Article

Effect of Parameters on Vapor Generation in Ship-to-Ship Liquefied Natural Gas Bunkering

1
R&D Center, Korean Register, 36, Myeongji ocean city 9-ro, Gangseo-gu, Busan 46762, Korea
2
Department of Naval Architecture and Offshore Engineering, Dong-A University, Busan 49135, Korea
3
R&D Center, DongHwa Entec, 7, Gwahaksandan-ro 305beon-gil, Gangseo-Gu, Busan 46742, Korea
4
Division of Marine System Engineering, Korea Maritime and Ocean University, 727, Taejong-ro, Yeongdo-gu, Busan 49112, Korea
*
Author to whom correspondence should be addressed.
Appl. Sci. 2020, 10(19), 6861; https://doi.org/10.3390/app10196861
Submission received: 31 August 2020 / Revised: 24 September 2020 / Accepted: 28 September 2020 / Published: 29 September 2020
(This article belongs to the Section Marine Science and Engineering)

Abstract

:
Liquefied natural gas (LNG) is attracting increasing attention as an alternative fuel in the maritime sector, as it can reduce harmful emissions for compliance with stricter environmental regulations. Owing to this environmental advantage, the number of ships using LNG as a fuel is increasing; thus, the demand for ship-to-ship LNG bunkering is increasing. One of the challenges of ship-to-ship LNG bunkering is boil-off gas (BOG) management, as it is more difficult than normal BOG management. This study analyzed the influences of the parameters on vapor generation, including the temperature difference between the bunker tank and receiving tank, bunkering flow rate, insulation performance, and compositions. A model based on a typical bunkering system was established, and a dynamic simulation was conducted using a commercial process simulator, Aspen HYSYS. The results indicated that as the initial temperature of the receiving tank increased, the amount of vapor return increased proportionally. In addition, increasing the bunkering flow rate decreased the amount of heat entering through the pipes and tanks; however, the heat dissipated by the pump shaft power increased. Different LNG compositions in the bunker tank led to changes in the initial pressure of the bunker tank, influencing the vapor return and vapor generation in the receiving tank. Through a parametric study, it was found that the pressure of the tank is the most important factor in terms of vapor return and vapor generation. As such, a pressure control method was proposed for the tank, so as to reduce vapor generation and vapor return. With pressure control, the total amount of vapor return to the bunker tanks is reduced from 7392 to 3317 kg. The net vapor generation in the receiving tank is reduced by up to 4047 kg and the net vapor generation in the overall system is reduced by 16.2%.

Graphical Abstract

1. Introduction

Owing to increasing pressure to reduce emissions in the maritime sector, the International Maritime Organization (IMO) has adopted several environmental regulations regarding nitrogen oxides (NOx), sulfur oxides (SOx), and carbon dioxide (CO2). The IMO Tier III regulations require an 80% reduction in NOx emissions from Tier I in NOx emission control areas, and global sulfur caps that limit the sulfur content of ship fuels to 0.5%, which became effective worldwide on January 1, 2020. In April 2018, the IMO adopted an initial strategy for reducing the total annual greenhouse gas emissions from shipping by at least 50% by 2050 (relative to 2008). These environmental regulations to reduce CO2 and other emissions are driving research into alternative fuels. Among several potential alternative fuels, liquefied natural gas (LNG) has been recognized as a technically feasible and proven solution in the maritime sector [1,2,3]. Using LNG as a ship fuel can provide a 95–100% reduction in SOx emissions, a 45–80% reduction in NOx, and a 25–30% reduction in CO2 emissions, depending on the engine technology [3]. With these environmental advantages, the number of ships using LNG as fuel is increasing, and thus, the demand for LNG bunkering is also increasing.
There are several LNG bunkering methods available, such as truck-to-ship, ship-to-ship, and terminal-to-ship, as illustrated in Figure 1.
A suitable bunkering method should be selected in consideration of the LNG fuel storage capacity and any potential time constraints for bunkering operations [4]. Truck-to-ship bunkering has been the most commonly used bunkering approach so far, and provides good operational flexibility; however, the limited capacity of the trucks can be a disadvantage in multi-truck operation. In port-to-ship bunkering, a larger volume of LNG can be delivered; however, it is often difficult for LNG-fueled ships to reach a terminal. In the ship-to-ship bunkering method, the LNG is delivered to an LNG-fueled ship by another ship, i.e., an LNG bunkering ship. This method has an advantage in that LNG bunkering can be conducted simultaneously with other transfers, such as cargo handling operations. In addition, it provides a larger delivery capacity and higher bunkering rate than that of the truck-to-ship method, and better operational flexibility than that of the terminal-to-ship method [3,4]. Therefore, the ship-to-ship bunkering method is considered the most efficient bunkering method [5]. Several LNG bunkering ships are under construction or operation, as can be seen in Table 1.
During the storage of LNG, boil-off gas (BOG) generation is inevitable owing to heat ingress, even though the storage tanks are well-insulated [5]. The typical LNG boil-off rate (BOR) under storage conditions is 0.1–0.5% per day [3]. During bunkering, additional BOG is generated owing to the heat ingress through the bunkering pipes, heat transferred by the cargo pumps, and cooling effect of the LNG on the storage tank [11,12]. In the case of LNG carriers, the BOG generated through a transfer operation is typically 8–10 times more than that generated during storage [13]. Therefore, adequate BOG handling during bunkering is an important concern. It must be managed effectively, e.g., by considering pressure accumulation in the tanks, burning in the gas combustion unit (GCU), and using the LNG as fuel or in re-liquefaction to maintain the pressure in the cargo tank below the tank design pressure [14]. Another study proposed managing excessive BOG by using an energy storage system in bunkering ships [1]. As evaluating the amount of BOG generated during bunkering under realistic conditions is important for applying the appropriate BOG handling methods, a literature review on BOG assessment was conducted, as discussed in the following section.
Sharafian et al. [15] conducted a performance evaluation of LNG storage tanks in refueling stations with varying initial LNG temperatures, tank storage sizes, and tank thermal performances. The results showed that the amount of BOG generated in a tank filled with unsaturated (cold) LNG was larger than that in a tank with saturated (warm) LNG, and as the tank size increased, the BOR (%/day) decreased. In addition, a tank with overall heat transfer coefficient (Uinsulation) of 0.01 W/m2·K could hold the BOG eight times longer than a tank with Uinsulation of 0.10 W/m2·K under the studied conditions. Shao et al. carried out dynamic simulations of ship-to-ship LNG bunkering with varying parameters by using Aspen HYSYS. Results show that the BOG and resulting pressure increase in the receiving tank were mainly determined by the temperature difference between bunkering and the receiving tank, pressure of the receiving tank, and amount of heel which is remained in the tank [16]. Shao et al. investigated the optimal time limit for ship-to-ship LNG bunkering using Aspen HYSYS. The capacities of the cargo tank and fuel tank for the bunkering and receiving ships were set as 4538 and 700 m3, respectively. The results revealed that the pressure difference between the bunkering and receiving tanks decreased with increasing bunkering time. In addition, to avoid additional BOG generation, an optimized bunkering time was recommended [17]. Querol et al. estimated the BOG generation in LNG terminals, and proposed a BOG cogeneration plant. The results indicated that the amount of generated BOG increased as the LNG became heavier, due to differences in the heat of vaporization with the varying compositions. Therefore, a composition close to the actual composition was suggested for the BOG assessment [18]. Sharafian et al. developed six models for LNG offloading from a tanker to an LNG refueling station, and implemented a parametric study using Aspen Plus. The results indicated that an LNG offloading model with a pressure buildup unit (PBU) causes more methane emissions than models using a pump or controlled PBU. In the parametric study, the insulation, pipe diameter, length of delivery pipeline, and PBU design influenced the LNG transfer process [19]. Yan and Gu investigated the performances of offloading LNG from floating production and storage to LNG carriers. The results indicated that the mass flow rate of the BOG increased with an increasing height difference between the pipes, although the difference was minor. The results also showed that as the mass flow rate of the LNG transfer increased, the mass flow rate of the generated BOG initially started to decrease and then increased, implying that an optimal mass flow rate existed for the LNG transfers. In addition, the mass flow rate of the BOG increased with the addition of heavy hydrocarbons [12]. Li and Li analyzed the parameters influencing the BOG quantity during unloading from an LNG carrier to a terminal and proposed an optimization strategy. The results revealed that the unloading of lean LNG (with the minimum LNG consumption) from the LNG receiving tank led to the lowest net BOG quantity, and that the operating pressure of the receiving tank was an important factor affecting the BOG quantity [20]. Kurle et al. performed dynamic simulation to obtain BOG generation profiles during of LNG vessel loading process. The effect of various factors on jetty BOG profile, including heat leak, initial-temperature of LNG ship-tank, BOG compressor capacity, and maximum cooling-rate for ship-tank, were studied. Results show that jetty BOG generation ranges from 1.2% to 2.5% of total amount of LNG transfer. LNG loading time increased by about 8 h due to the ship-tank being warmer by 30 °C [21].
In this study, we conducted a comprehensive and detailed dynamic simulation to estimate the amount of vapor generation (namely BOG) and vapor return during ship-to-ship LNG bunkering. The amounts of vapor generation and vapor return were analyzed with varying parameters, such as the temperature difference between tanks, transfer rate, pipe thermal insulation performance, LNG composition, and pressure control. The contribution of each parameter was assessed. The main difference between this study and those in References [16,17] is the calculation of the amount of vapor generation and vapor return during bunkering based on the more realistic and detailed conditions of ship-to-ship LNG bunkering. The previous studies and simulations did not consider the thermal insulation of the tanks and pipes, pressure drop of the hose, or composition of the LNG, all of which can affect the amounts of vapor generation and vapor return. The main objective of this study was to investigate the variation trends of vapor return and vapor generation, and those of pressure and temperature during bunkering. Furthermore, we proposed a method of pressure control for minimizing vapor return and vapor generation during bunkering.

2. Description of Liquefied Natural Gas (LNG) Bunkering System

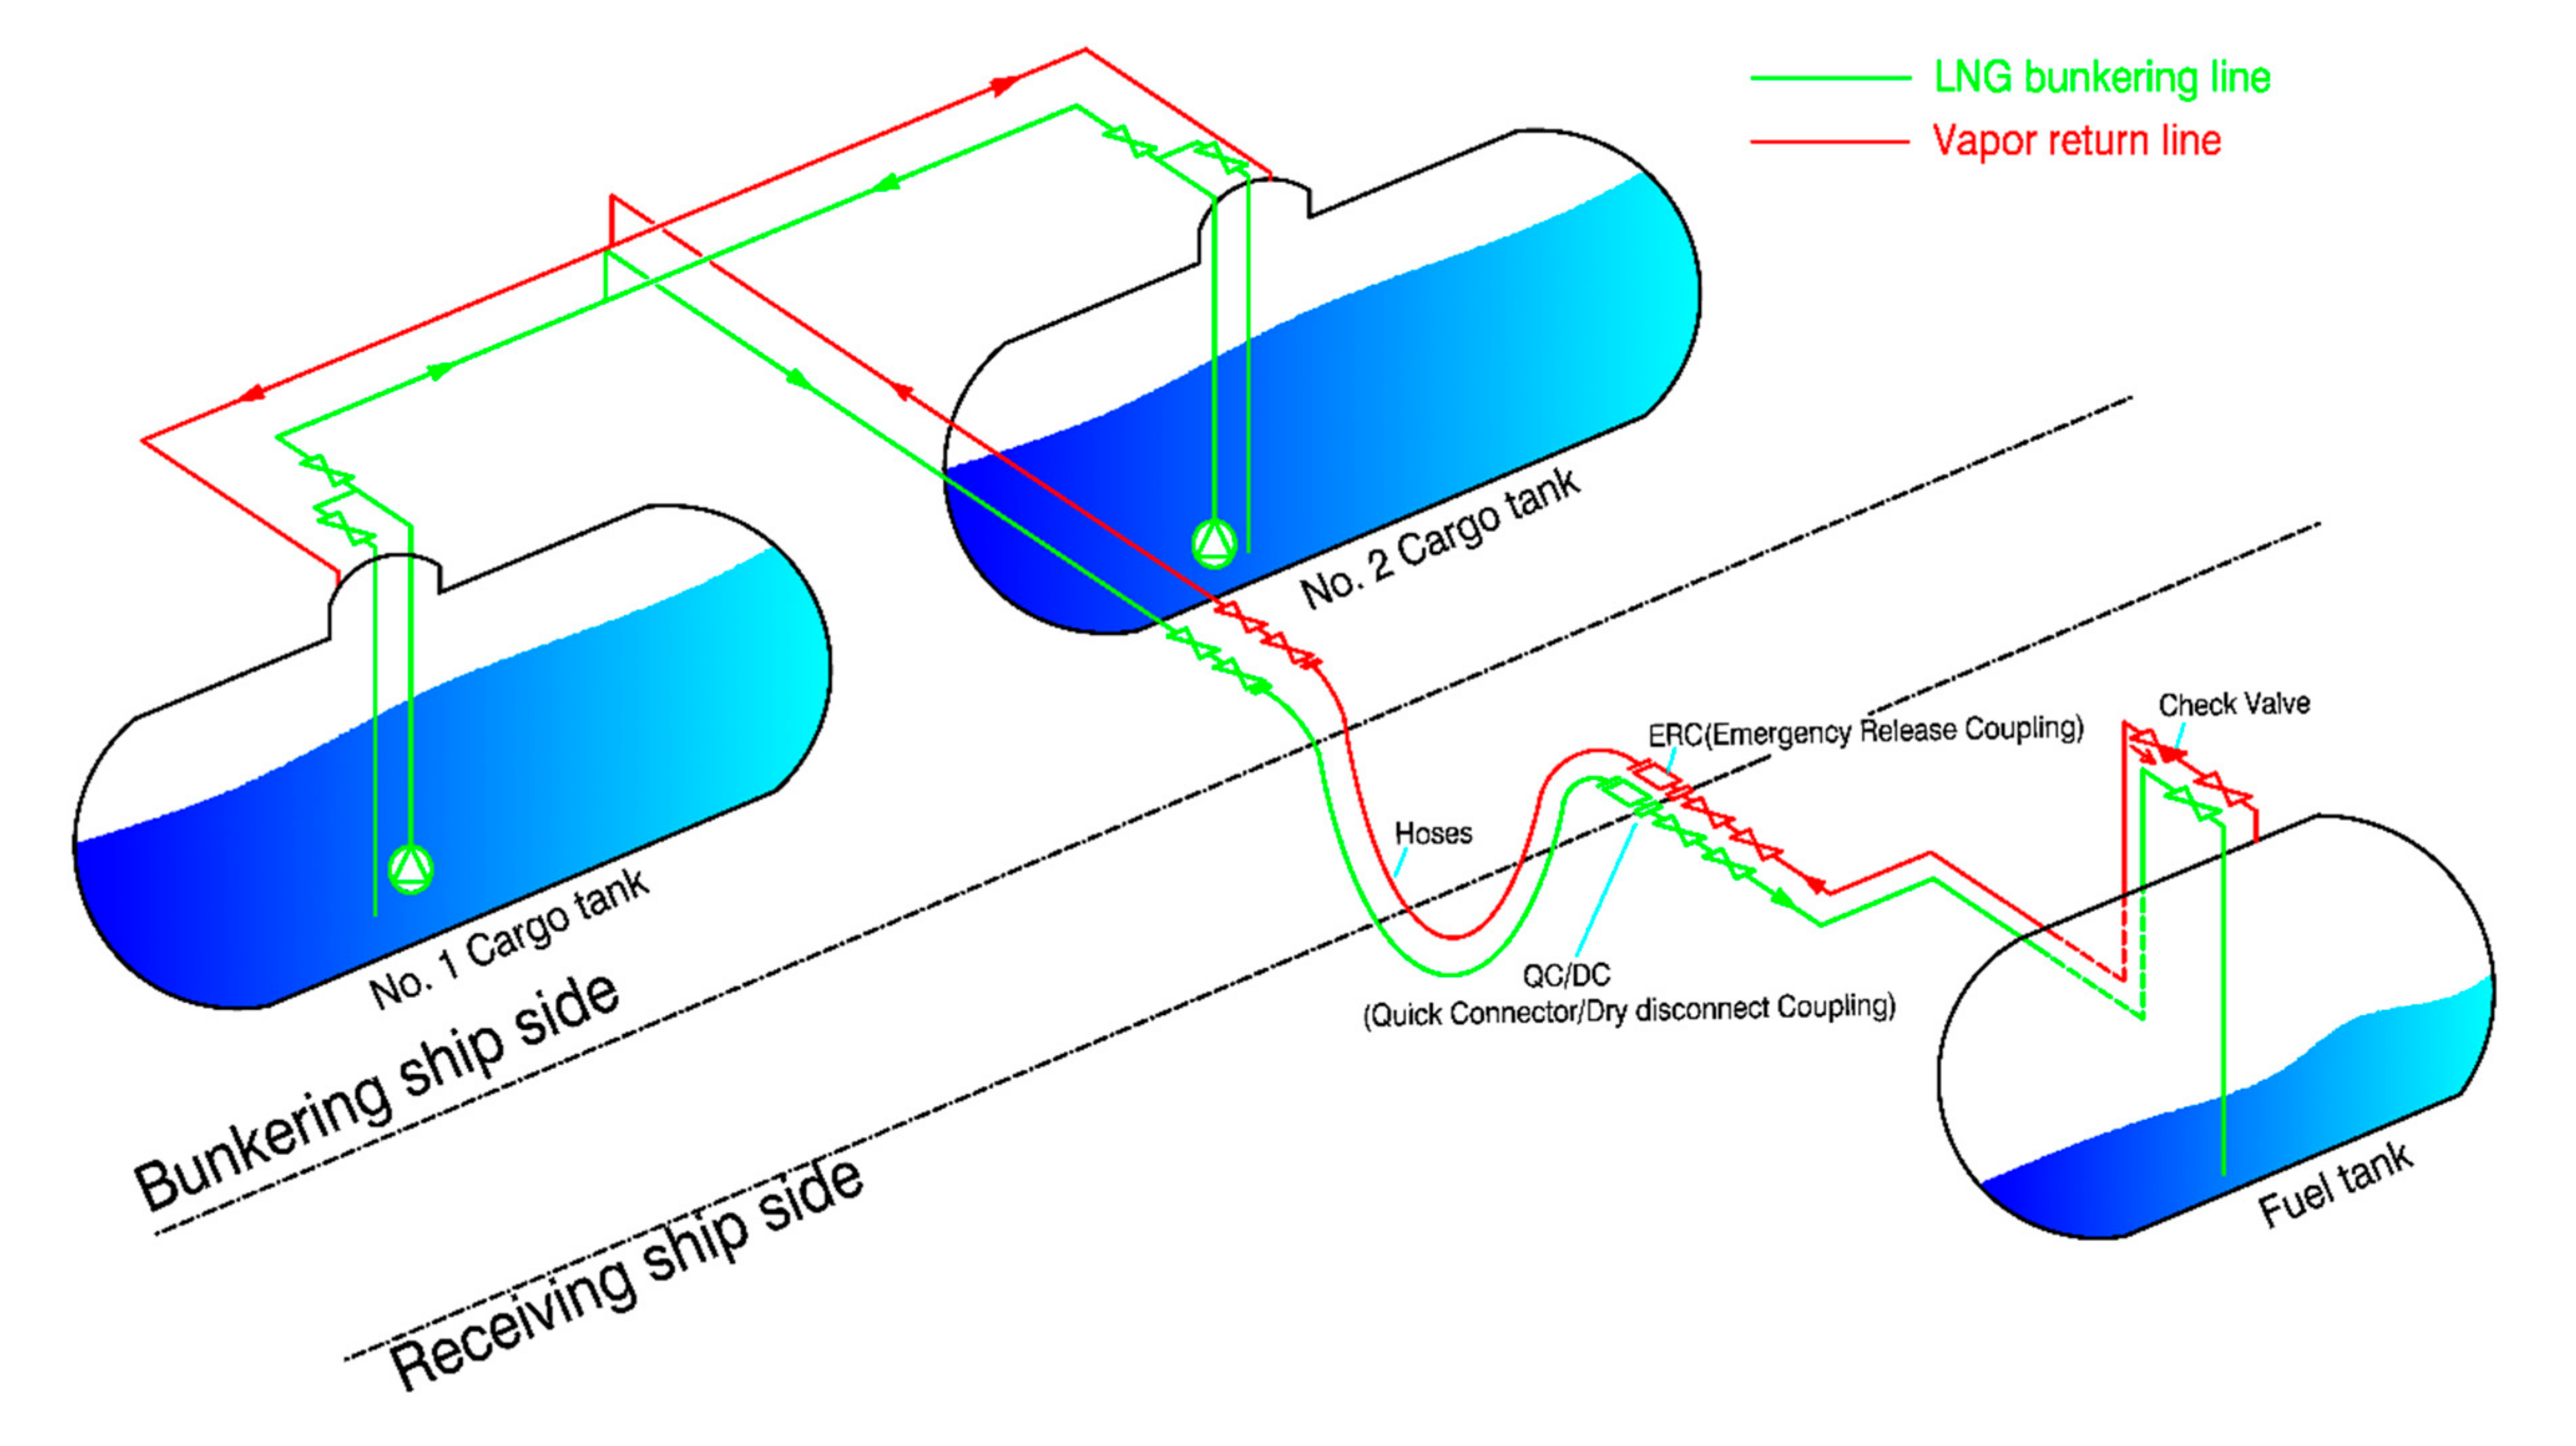
In general, a ship-to-ship LNG bunkering system consists of a bunker tank, cargo pump, liquid bunker line, hose, emergency release coupling (ERC), quick-connector/dry disconnect coupling (QC/DC), receiving (fuel) tank, and vapor return lines. There are four types of tanks used for gas carriers: three self-supporting types (IMO type A, B, and C tanks) and a non-self-supporting type (membrane tank). IMO type A, B, and membrane tanks are atmospheric tanks, which have a design pressure less than 0.7 barg. These tanks require partial or full secondary barriers. The IMO type C tank is a cylindrical pressure tank with the maximum allowable relief valve setting of 10 bar and does not require a secondary barrier. It is widely used as a cargo and fuel tank in existing LNG bunkering ships and LNG-fueled ships, as this type of tank has an advantage in regards to holding time with pressure accumulation [3]. To maintain the LNG cold temperature and minimize boil-off, a good-quality insulation system is essential. Polyurethane foam (PUF) is normally used for the IMO type C bunker tank [3], and vacuum perlite insulation is mostly used in IMO type C fuel tanks [22]. A deep well or submerged pump is used for the cargo pump. A variable-speed pump is recommended for controlling the bunkering time by regulating the bunkering flow rate [23]. The liquid lines for bunkering the LNG and vapor return lines for regulating the pressure in the receiving fuel tank comprise austenite stainless-steel type 316 or 304 (ASTM A312 TP316 or 304). These are suitable for cryogenic temperatures and are applied with polyurethane or double-walled vacuum insulation. The hoses are typically made of composite multi-layer thermoplastic and are flexible, allowing for relative movements between ships from wind, waves, draft changes, etc. [3]. The hoses are connected with QC/DC and ERCs, allowing hose separation when necessary. Each separated section includes a self-closing shut-off valve to avoid dripping LNG [14]. It is recommended that the flow velocity of the LNG line does not exceed 10 m/s, to avoid additional surge pressures generated by friction and cavitation [14]. A schematic isometric view of the ship-to-ship bunkering adopted in this study is shown in Figure 2.

3. Simulation and Input Preparation

In this study, the LNG bunkering process was modeled using Aspen HYSYS (Aspentech, Bedford, MA, USA). The process was switched to Aspen HYSYS Dynamic to investigate the dynamic behaviors of ship-to-ship LNG bunkering. ASPEN HYSYS is a powerful process simulator that was developed by Aspentech for modeling processes from upstream, through gas processing and cryogenic facilities, to a refining and chemicals plant. It contains comprehensive thermodynamic databases having physical and chemical properties of mixtures at different temperature and pressures. ASPEN HYSYS has subroutines for calculation of vapor–liquid phase equilibrium, heat and mass balances, and simulation of many kinds of plant engineering equipment. The Peng–Robinson equation of state was adopted for the process simulation, as it was found to be appropriate for the LNG bunkering process [15,16,17,19,24]. The liquid–vapor phase equilibrium was iterated and solved in the simulation. The simulation was validated via comparison with a study by Shao et al. [17] analyzing ship-to-ship LNG bunkering. Validation was performed at the same condition and it was found that total mass difference of BOG during bunkering was within 2%.
Two IMO type C tanks with a total capacity of 6500 m3 and filled with 80 vol% LNG were modeled on the bunkering ship side. In each bunker tank, a deep well-type pump was modeled by using performance curves generated in Aspen HYSYS. The LNG was transferred at 500 m3/h by two cargo pumps to the fuel tank through an 8-inch header pipe, hose, QC/DC, and ERC. The valves and fittings were counted based on the general configuration of the bunkering system, as shown in Figure 2. The QC/DC and ERC were modeled as butterfly valves with fully open positions for simplicity. The pressure drop of the 8-inch hose was less than 0.1 bar/m at cryogenic conditions and a maximum allowable flow speed of 14 m/s [25]; thus, we set the hose pressure drop as 1 bar/m for a conservative design of the LNG bunkering system. A receiving fuel tank with a capacity of 1000 m3 filled with 20 vol% LNG as a heel was considered. Pump performance curves generated in HYSYS based on flow rate, efficiency, and head are used. HYSYS generates three curves based on three different speeds: user-specified speed, user-specified speed multiplied by low speed %, and user-specified speed multiplied by low low-speed %. By controlling the pump speed, the LNG transfer flow rate was reduced from 500 to 200 m3/h when the liquid volume percentage of the receiving tank reached 85% of the tank volume, for “topping-up” purposes.
When the liquid volume % in the fuel tank reached the loading limit, defined as the maximum allowable liquid volume percentage that the tank could be loaded, the on-off valve was closed to avoid overfilling of the receiving fuel tank. The loading limit was determined from the following formula [26]:
L L = F L ρ R ρ L
In Equation (1), LL denotes the loading limit, and FL, ρ R , and ρ L denote the filling limit (normally taken as 98%) and relative densities of the LNG at the reference and bunkering temperatures, respectively. The reference temperature corresponds to the saturated vapor pressure of the LNG at the set pressure of the pressure relief valves. The loading limit of LNG fuel tanks is typically between 85% and 95% of the tank volume, although it depends on the tank type, pressure relief valve setting, and other factors [14,22,27]. In this study, the calculated loading limit of the receiving tank was 93%; however, we adopted 90% as the loading limit, for a conservative approach. The excessive BOG generated in the receiving fuel tank was returned to the bunker tank in the bunkering ship via a 6-inch vapor return line, to reduce the pressure of the receiving fuel tank.
The overall heat transfer coefficients of the bunker tanks and fuel tank were determined based on normal BORs of 0.25% and 0.35% respectively, at an ambient air temperature of 25 °C and an LNG temperature of −162 °C. These were assumed as constants in all simulations. The overall heat transfer coefficient of the bunker tank could be calculated as follows [15]:
Q ˙ = B O R % d a y 24 · 3600 · 100 · ρ L N G · V n e t , b t , f l · h v a p = 0.25 24 × 3600 × 100 × 425 k g m 3 × 3185 m 3 × 512,590 J k g = 20,077   W
U A b t = Q ˙ T a m b i e n t T L N G = 20,076 W 25 162 = 107.36   W / K
U b t = U A b t A b t = 106.8   W / K 932.5   m 2 = 0.414   k J / h r · m 2 · K
In the above, Q ˙ is the heat transfer rate to the tank during normal storage, and ρ L N G and h v a p are the LNG density and heat of vaporization at −162 °C and 1 atm. V n e t , b t , f l is 98% of the tank net volume, and that is the filling limit. U A b t is the thermal conductance of the bunker tank, and A b t is the total surface area of the bunker tank. The overall heat transfer coefficient of the fuel tank was calculated using the same procedure.
The overall heat transfer coefficient of the insulated pipes was calculated as follows:
U p i p e = 1 D i n s u l a t i o n   O . D D p i p e   I . D · h i n + D i n s u l a t i o n   O . D · l n D p i p e   O . D D p i p e   I . D 2 · k p i p e + D i n s u l a t i o n   O . D · l n D i n s u l a t i o n   O . D D p i p e   O . D 2 · k i n s u l a t i o n + 1 h a i r
Here, D i n s u l a t i o n   O . D , D p i p e   O . D , and D p i p e   I . D represent the outer diameter of the insulation, outer diameter of the pipe, and inner diameter of the pipe, respectively. k p i p e and k i n s u l a t i o n are the thermal conductivity of the pipe and insulation, h i n is the convective heat transfer coefficient of the LNG in the pipe, and h a i r is the convective heat transfer coefficient of air.
In the present study, the flow rate-related friction effect associated with the pipe wall, the gravity effect, and the Joule–Thomson effect associated with the pressure change in the pipe with phase transition were not taken into account. This approach can be reasonable considering that the length of bunkering pipeline and duration of bunkering are relatively short. The isothermal flash process for phase transitions are well described in Reference [28].
The input parameters for simulation are summarized in Table 2, Table 3 and Table 4.
In addition, to effectively compare the amounts of vapor produced during bunkering, the following formulas were applied:
Δ m v , b = m i , v , b m f , v , b
Δ m v , r = m i , v , r m f , v , r
In the above, Δ m v , b , m i , v , b , and m f , v , b denote the vapor mass difference in the bunker tank, initial vapor mass in the bunker tank, and vapor mass in the bunker tank after completion of bunkering, respectively. Similarly, Δ m v , r , m i , v , r , and m f , v , r denote the vapor mass difference in the receiving tank, initial vapor mass in the receiving tank, and vapor mass in the receiving tank after completion of bunkering, respectively.
By summing Δ m v , b and Δ m v , r , the net amount of vapor generation in the overall bunkering system, Δ m n e t , v g , o v e r a l l , can be calculated as follows:
m n e t , v g , o v e r a l l = Δ m v , b + Δ m v , r
The net vapor generation in the receiving tank, m n e t , v g , r , can be estimated as follows:
m n e t , v g , r = 0 t m ˙ v a p o r   r e t r u n + Δ m v , r
here, m ˙ v a p o r   r e t r u n represents the mass flow rate (kg/s) of the vapor return.

4. Results and Discussions

4.1. Effect of Initial Temperature of Receiving Tank

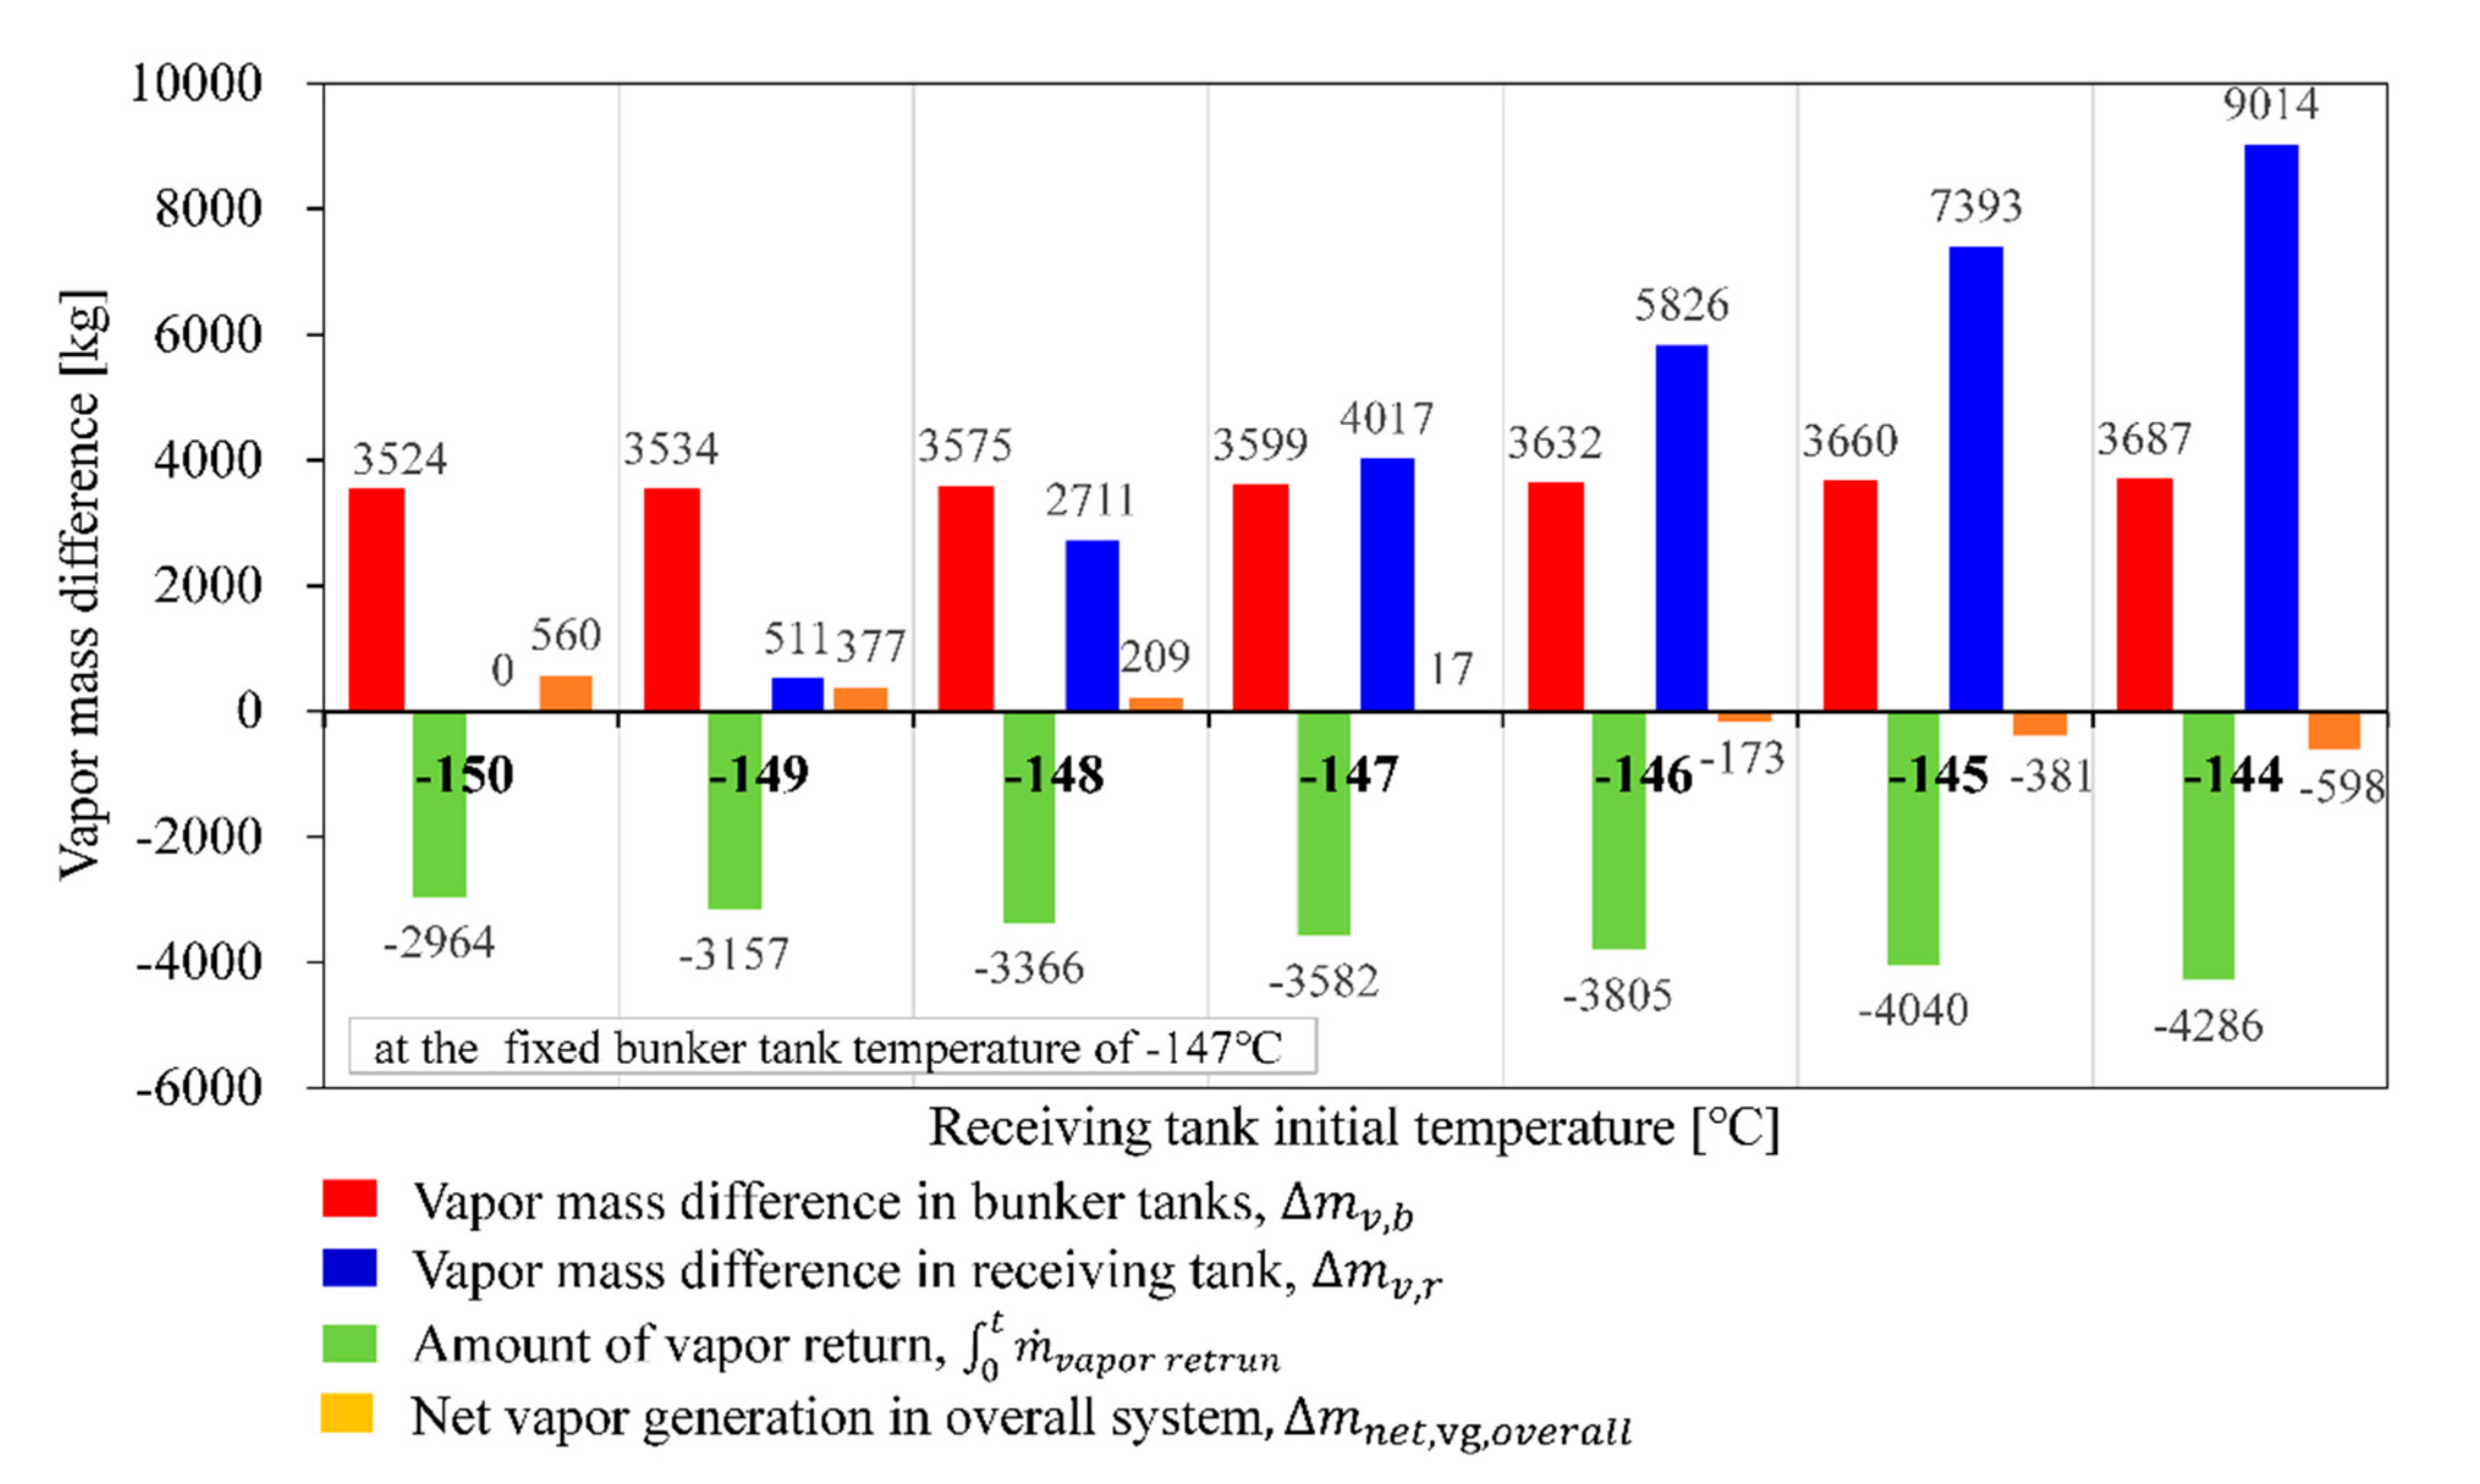
The effect of the initial temperature of the LNG in the receiving tank on vapor generation was studied by comparing the difference between the vapor mass at the initial condition and that at the completion of bunkering, as illustrated in Figure 3.
A case study was conducted by changing only the temperature of the receiving tank from the base case condition, as shown in Table 2, Table 3 and Table 4. The results indicated that with an increase in the initial temperature of the LNG in the receiving tank, both vapor mass difference in the bunker tanks ( Δ m v , b ) and the vapor mass difference in the receiving tank ( Δ m v , r ) were increased. When the temperature of the LNG in the receiving tank was warmer than that of LNG in bunker tanks (−147 °C), the net-generated vapor in the overall bunkering system ( m n e t , v g , o v e r a l l ) was negative, which could be interpreted as a partial amount of vapor was condensed. In contrast, in cases where the temperature of the LNG in the receiving tank was colder than that of LNG in the bunker tank, the net-generated vapor mass in the overall bunkering system was positive and decreased as the initial temperature of the LNG in the receiving tank increased.
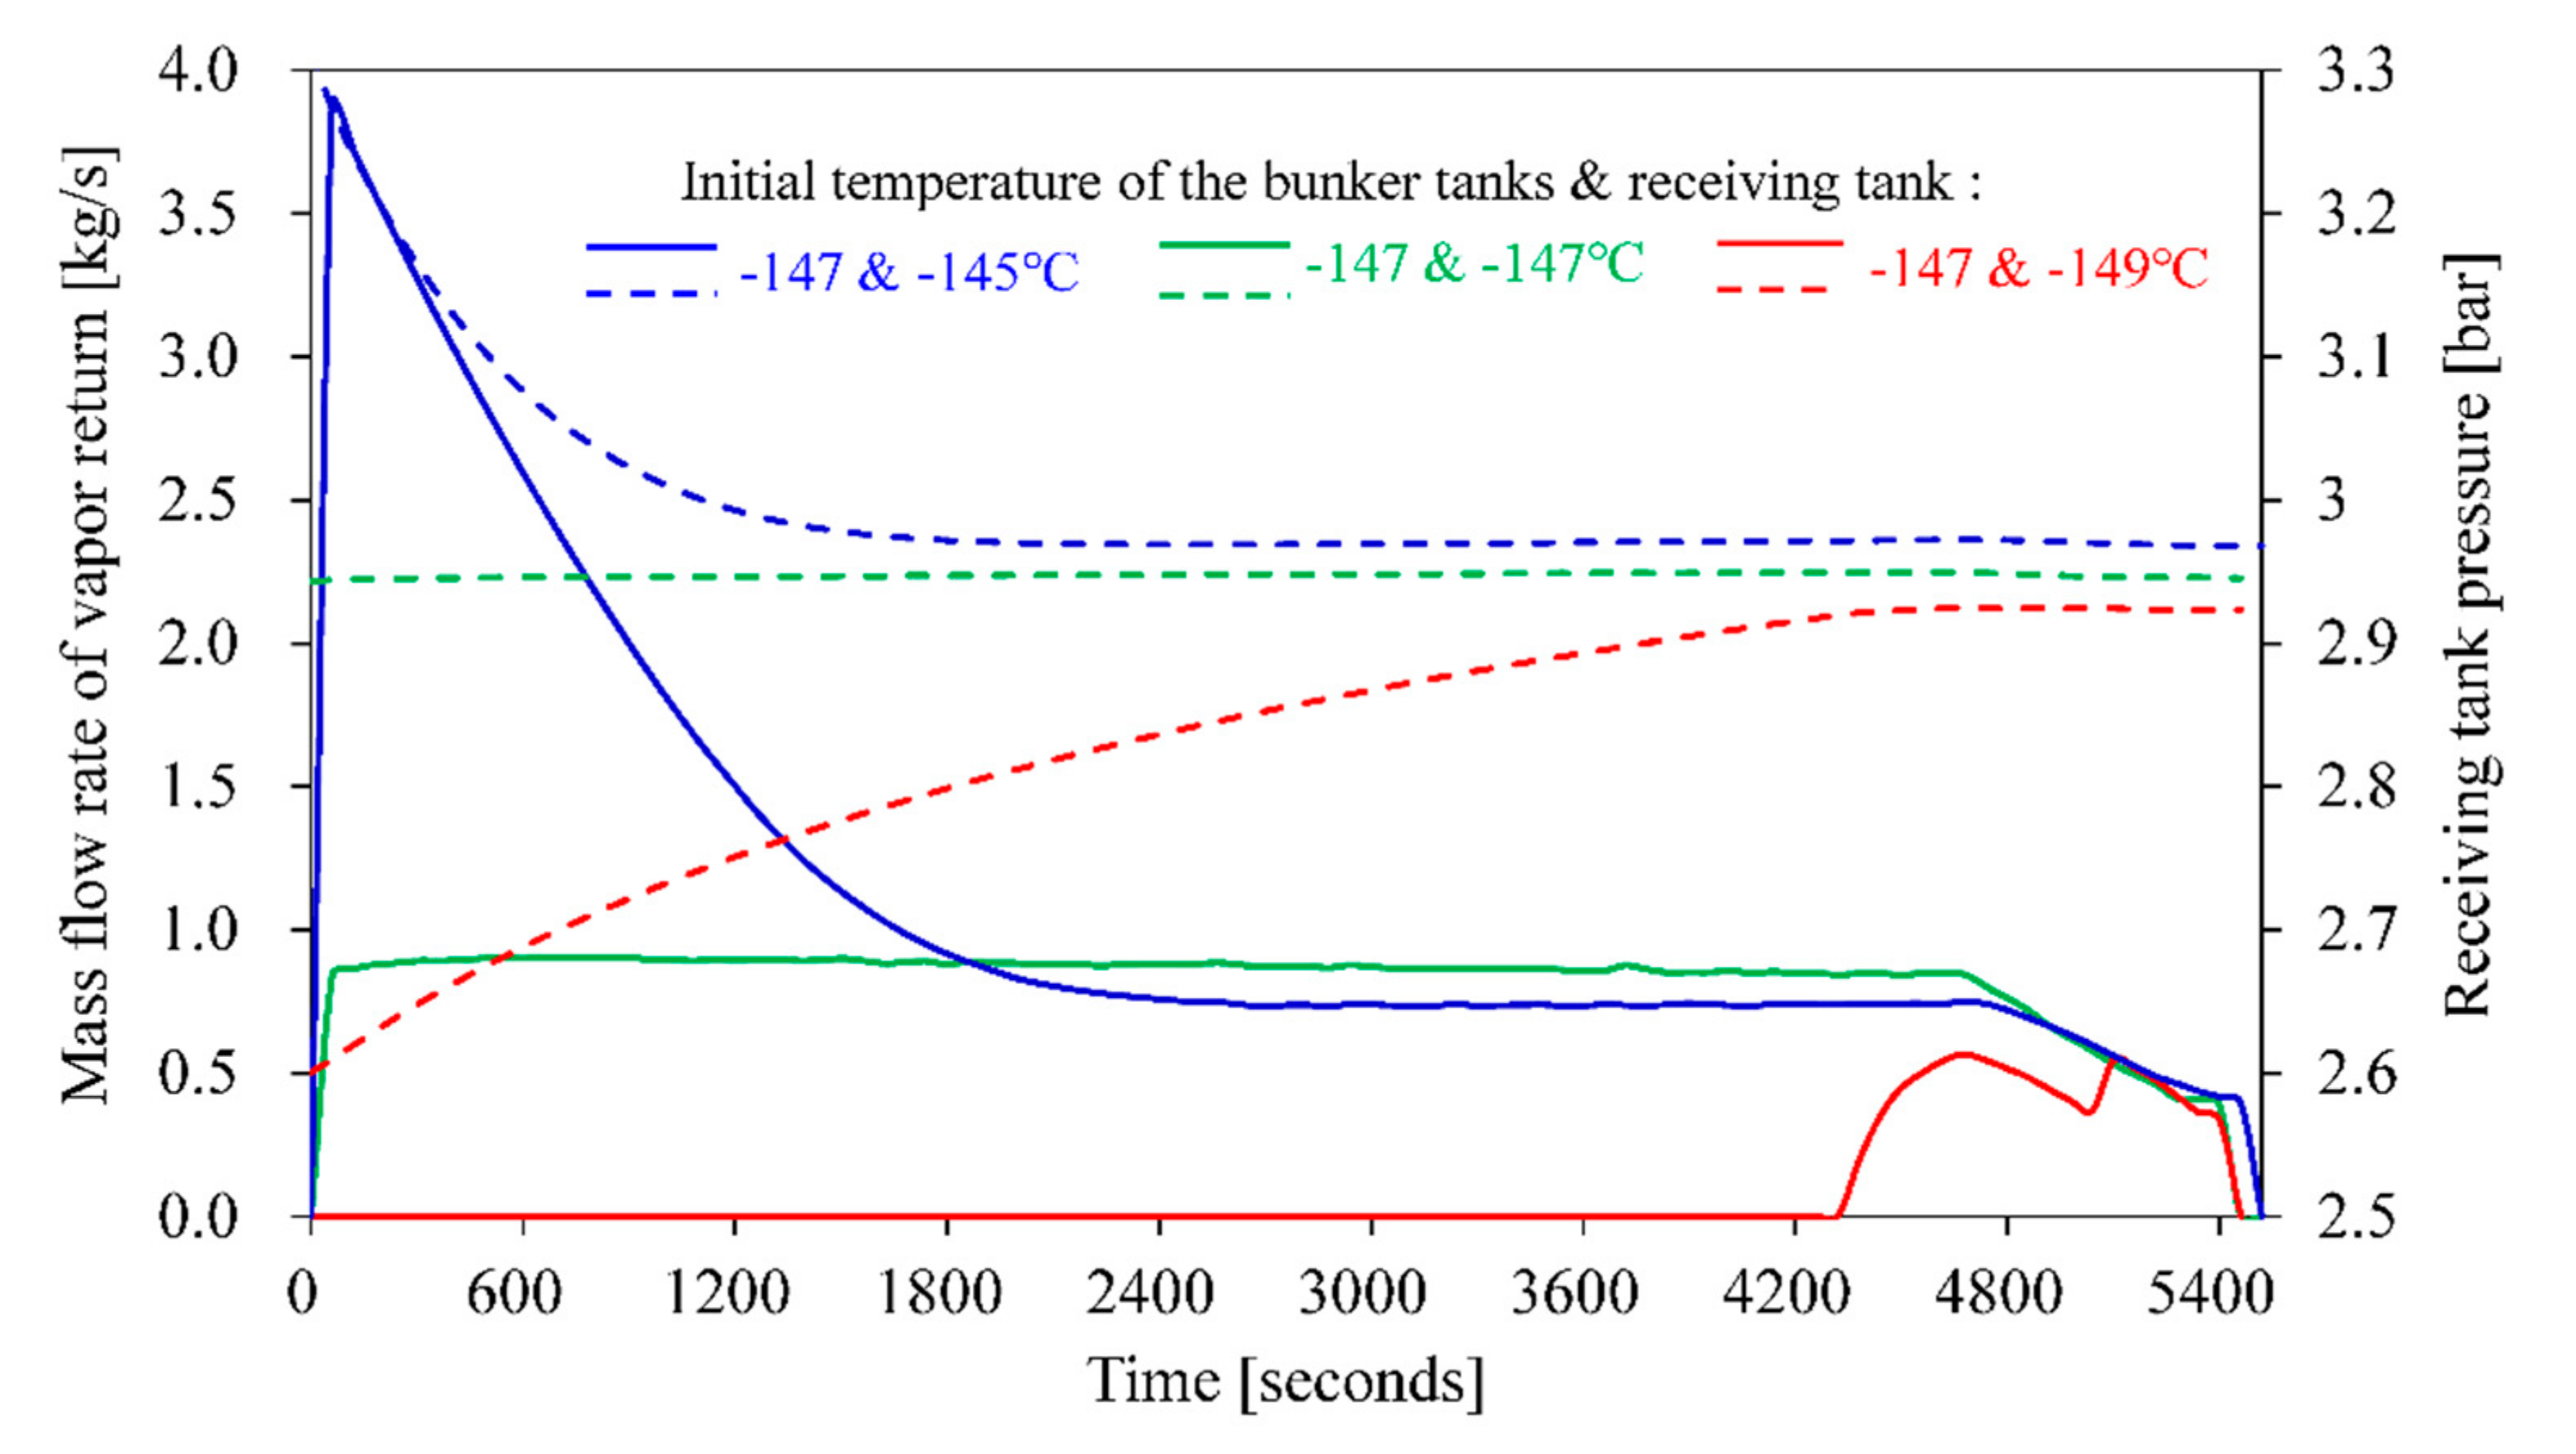
For a more detailed investigation, the variations in the mass flow rate of the vapor return, receiving tank pressure, and amount of vapor return were studied at the initial LNG temperatures of −145, −147, and −149 °C (in the receiving tank). When the initial temperature of the receiving tank was −145 °C, i.e., higher than that of the bunker tanks, the rate of vapor return increased sharply once bunkering commenced, and then decreased until the pressures of the bunker tanks and receiving tank were equalized, as shown in Figure 4. Note that the sample data collected at 60 s intervals were used for all subsequent graphs.
When the initial temperature of LNG in the receiving tank was −149 °C, i.e., lower than that of the bunker tanks, the vapor return to the bunker tanks remained zero until the pressure of the receiving tank approximated the bunker tank pressure. From these results, it can be interpreted that a positive value of the vapor mass difference in the bunker tanks ( Δ m v , b ) is mostly due to vapor return in cases of a warmer initial temperature in the receiving tank. In cases where the initial temperature of the receiving tank is colder, the positive value of the vapor mass difference in the bunker tanks ( Δ m v , b ) is mostly due to vapor generation in the bunker tanks, in order to maintain the pressure inside the bunker tanks. Similarly, a negative value of the vapor mass difference ( Δ m v , r ) in the receiving tank in cases of a warmer initial temperature in the receiving tank is mostly due to vapor return to the bunker tanks, and a negative value of the vapor mass difference in the receiving tank ( Δ m v , r ) in cases where the initial temperature of the receiving tank is colder is mostly due to the condensation of LNG vapor.
By comparing the total amount of vapor return with vapor mass difference in Figure 3, it can be seen that when the initial temperature of the receiving tank was −145 °C, the total amount of vapor return was greater than the vapor mass difference in the receiving tank, i.e., Δ m v , r . This can be interpreted as follows: As the bunkering operation progressed, the pressure in the receiving tank was decreased. Accordingly, the bubble point temperature of the LNG was lowered, resulting in a larger amount of vapor return ( 0 t m ˙ v a p o r   r e t r u n = 7393 kg) than the reduced amount of vapor in the receiving tank ( Δ m v , r = −4040 kg). This reveals that the net vapor generation in the receiving tank, m n e t , v g , r , during bunkering was approximately 3352 kg ( 0 t m ˙ v a p o r   r e t r u n + Δ m v , r ). At −149 °C, unlike in the case of −145 °C, the pressure of the receiving tank gradually increased as the bunkering progressed, and the bubble point temperature gradually increased accordingly. Then, the LNG in the receiving tank became subcooled, and the vapor generation in the receiving tank decreased. This resulted in the reduced amount of vapor in the receiving tank ( Δ m v , r = −3157 kg) being greater than the amount of vapor return ( 0 t m ˙ v a p o r   r e t r u n = 511 kg) and indicated that net vapor generation in the receiving tank, m n e t , v g , r , during bunkering was approximately −2647 kg, implying condensation.

4.2. Effect of Bunkering Flow Rate

The effects of varying the bunkering flow rates (300, 500, and 1000 m3/h) on the vapor generation and vapor return were studied. Figure 5 shows the T–s diagram corresponding to each location of the bunkering system at different bunkering flow rates. It can be seen that the LNG temperature increased at the pump outlet, and the degree of temperature rise was larger at higher bunkering flow rates. This was because some of the mechanical energy transferred from the pump shaft was lost in the form of heat, and the other was converted into pressure for the LNG. The relationship between the temperature rise ( Δ T p u m p ) at the pump outlet, shaft power, and flow rate can be expressed as follows:
Δ T p u m p , i n o u t = Q ˙ s h a f t · 1 η m ˙ · C p
In the above, Δ T p u m p , Q ˙ s h a f t , m ˙ , η , and Cp represent the temperature increase of the LNG through the pump, shaft power at the corresponding efficiency, mass flow rates through the pump, efficiency of the pump, and specific heat of the liquid in the pump, respectively. In addition, Figure 5 indicates that the LNG temperature in the receiving tank inlet ( T r e c e i v i n g   t a n k   i n l e t ) was slightly higher than that of T p u m p   o u t l e t . This is mainly due to heat ingress through the pipes and friction losses in the pipes during bunkering.
Table 5 shows the types and amounts of heat ingress to the system during bunkering, according to different bunkering flow rates. In the case of a bunkering flow rate of 300 m3/h, the total amount of heat ingress through the pipe and tank was larger than that of other cases due to the longer bunkering time; however, the amount of pump power converted to heat was relatively small. In contrast, in a case of a bunkering flow rate of 1000 m3/h, the amount of heat ingress through the pipe and tank was relatively small, due to the short bunkering time; however, a relatively large amount of the pump’s shaft power was converted to heat.
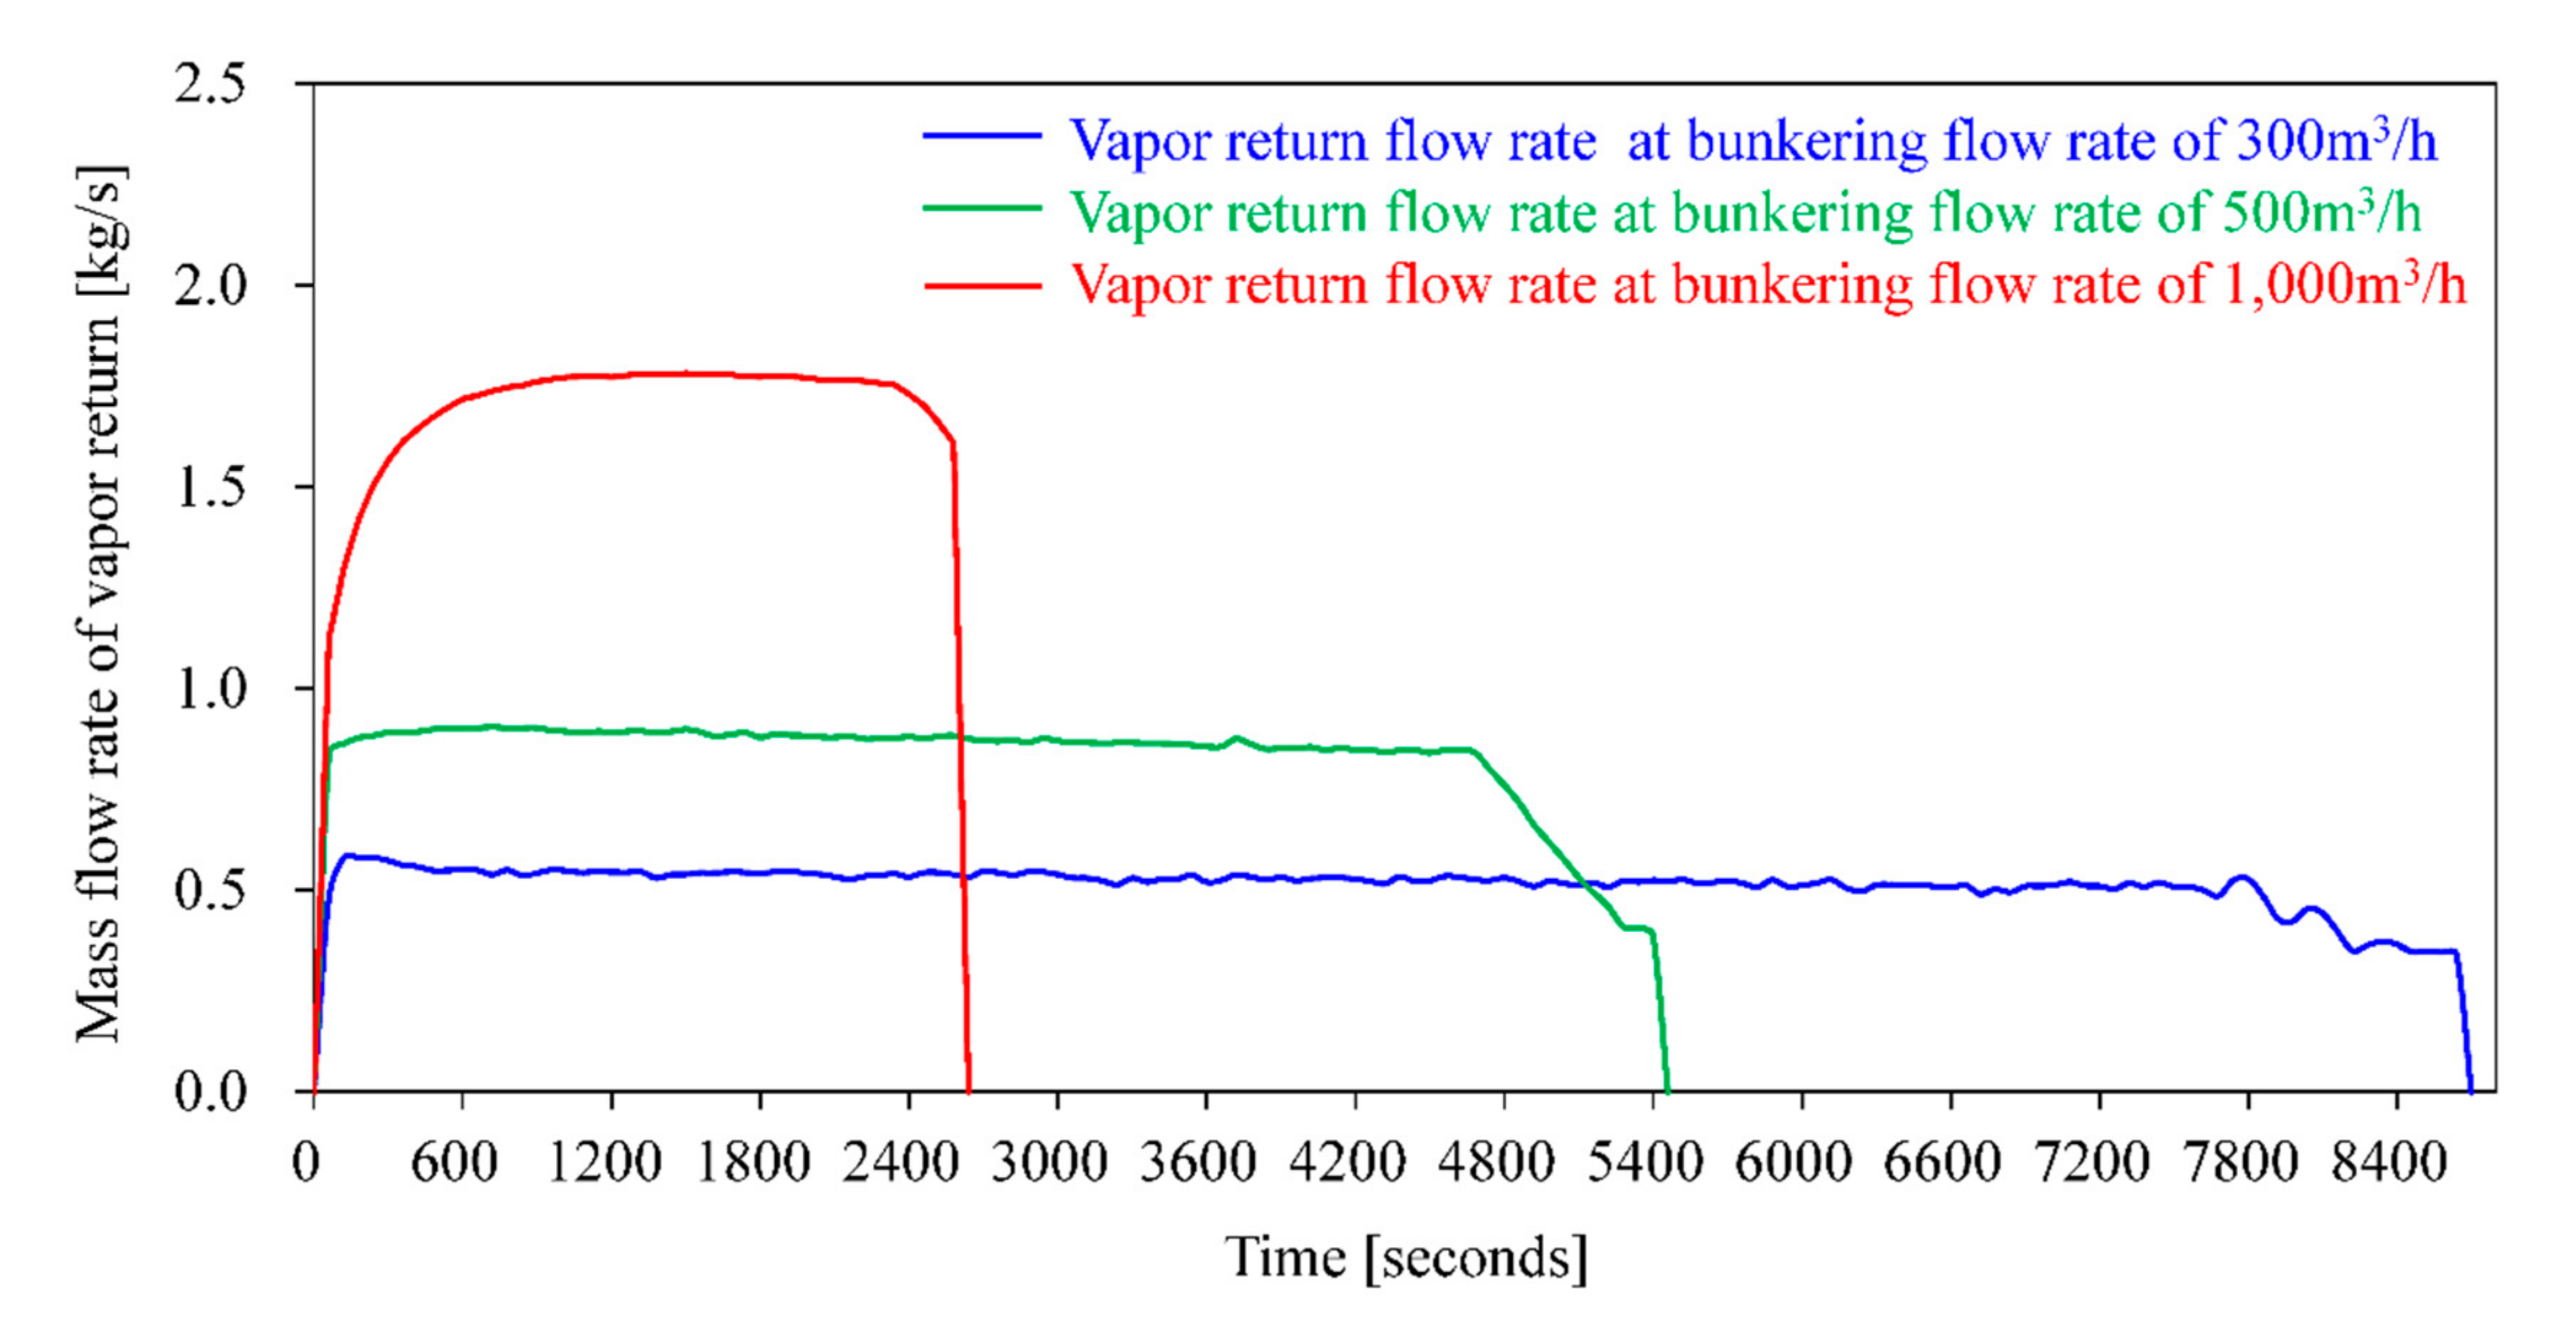
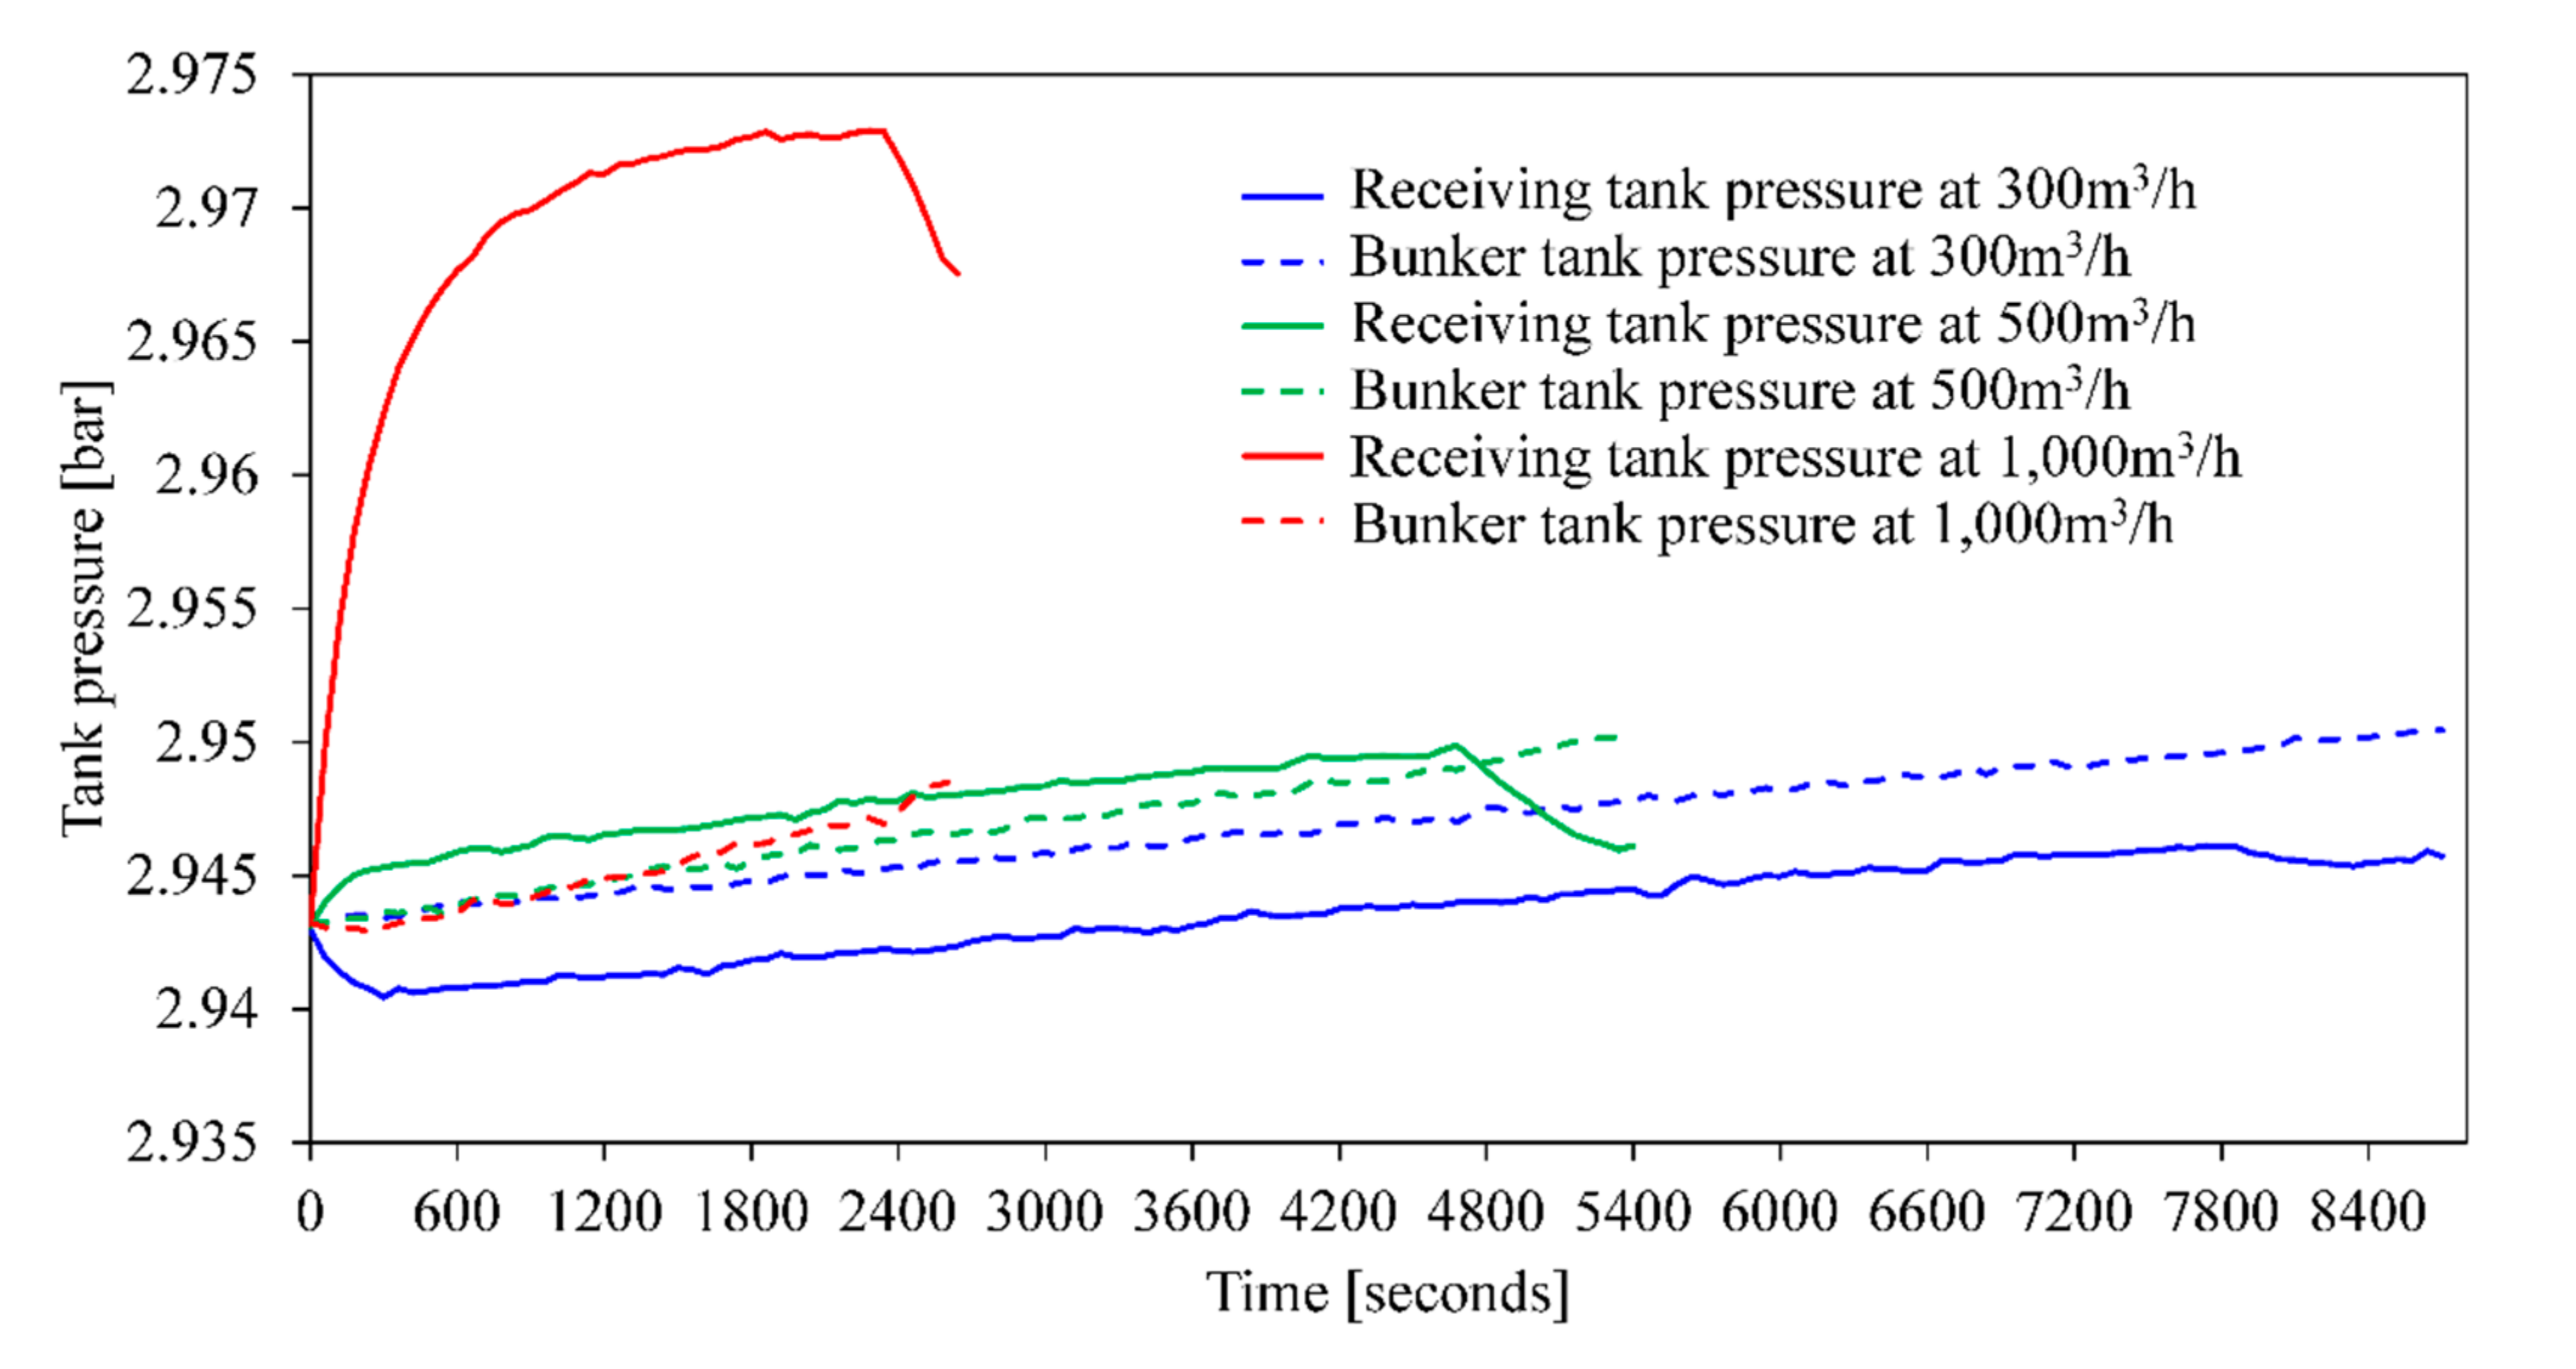
The variations of the vapor return flow rates differing at various bunkering flow rates are shown in Figure 6. The total amounts of vapor return at bunkering flow rates of 300, 500, and 1000 m3/h were approximately 3963, 4017, and 3955 kg respectively, and the net vapor generation values in the receiving tank were 391, 417, and 388 kg, respectively. This indicates that the bunkering flow rate does not significantly influence the amount of vapor return and net vapor generation. It also implies that the factors affecting vapor generation and vapor return at different bunkering flow rates includes not only heat ingress, but also other factors according to the change in the bunkering flow rate, such as the pressure variation in the receiving tank, as can be seen in Figure 7.
For example, in the case of a bunkering flow rate of 1000 m3/h, as bunkering progressed, the pressure in the receiving tank was significantly increased because the vapor return flow rate was relatively small as a fixed Cv value (compared to the bunkering flow rate). As a result, owing to the pressure exerted by the vapor over the LNG surface, a reduced amount of LNG flashed into vapor, and the heat entering the system mainly raised the temperature of the LNG. Although the largest amount of heat ingress occurred at a bunkering flow rate of 1000 m3/h, due to the pressure effect from pumping, the amount of vapor generation is similar to that of the others. With the heat ingress and pressure by the pump in play, an optimum bunkering flow rate may exist. The optimum bunkering flow rate should be determined considering the amount of vapor generation and vapor return, operating pressure of the tank, and bunkering time limit, which may affect the operation schedule of the receiving ship.

4.3. Effects of Insulation Performance of LNG Bunkering Lines

The effects of pipe insulation materials with different thermal conductivities on the vapor generation were analyzed. Three types of insulation materials were compared: cellular glass, multilayer insulation, and PUF. Cellular glass and PUF are selected because they are widely used in the marine and offshore industries especially for cryogenic services. Although multi-layer insulation is rarely used in the marine industry, for comparison purposes, it was selected in the present study.
The properties of these insulation materials are listed in Table 6. The other design parameters remained constant, as shown in Table 2, Table 3 and Table 4.
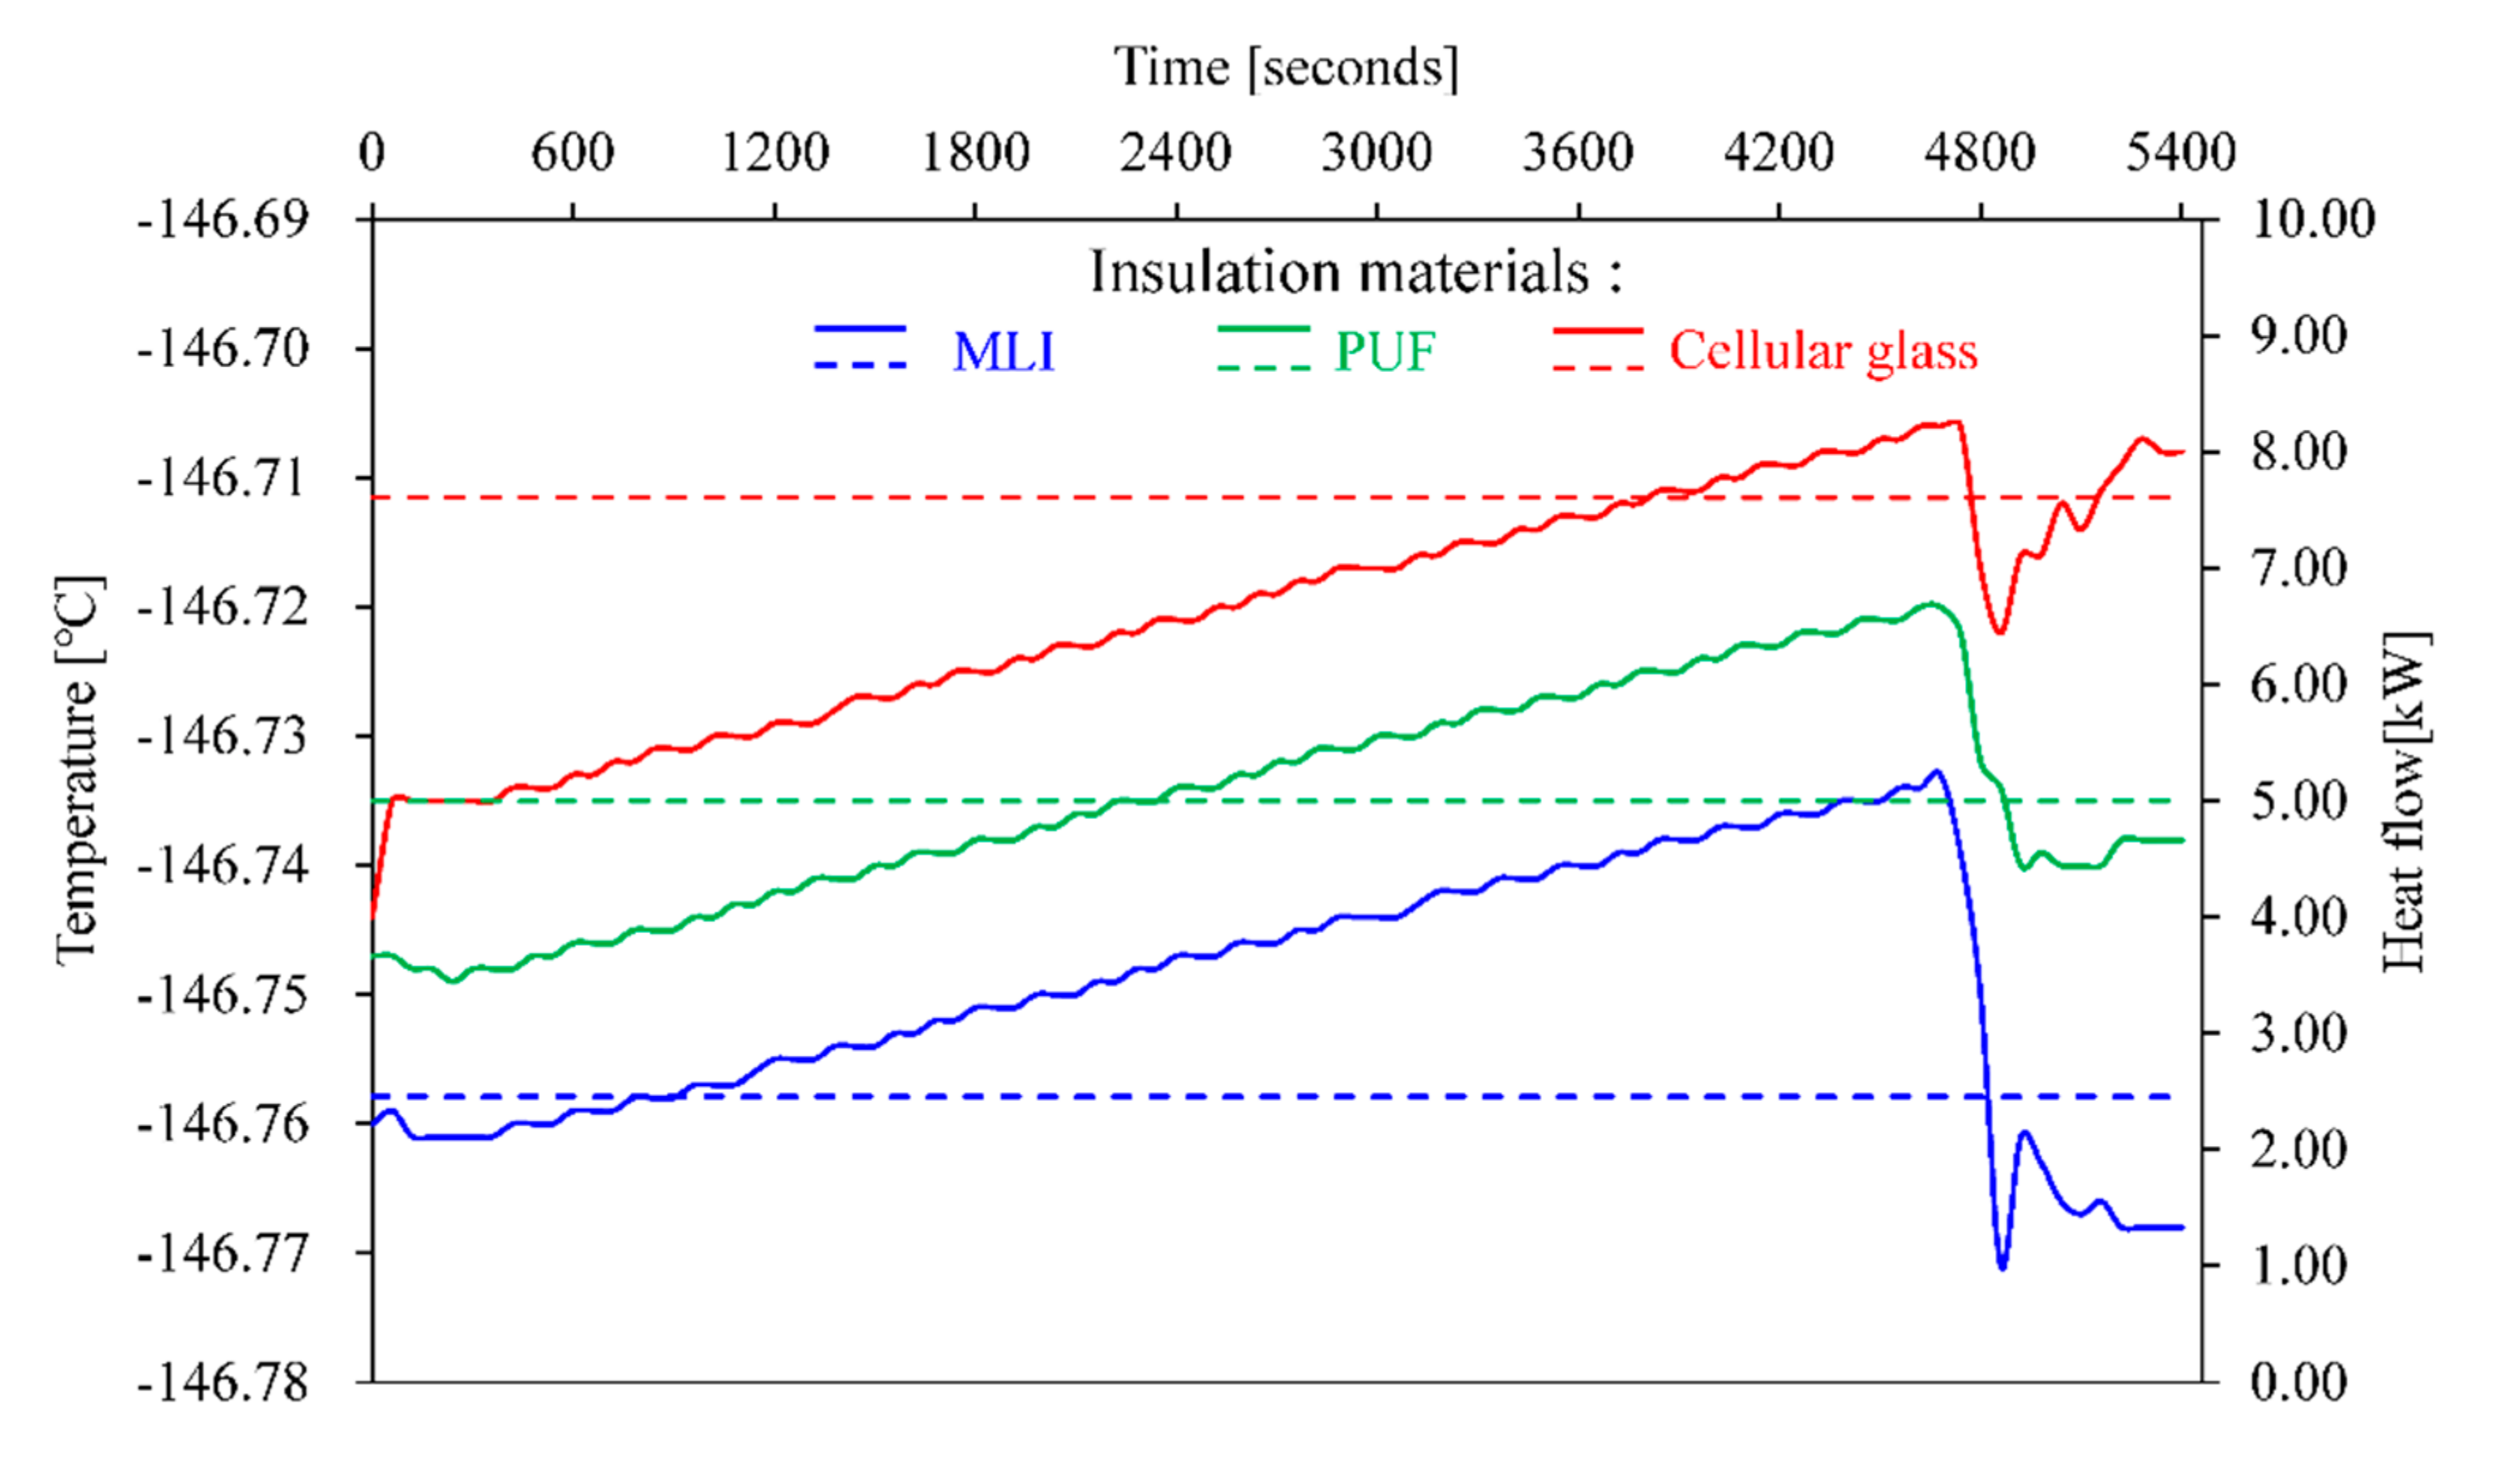
As can be seen in Figure 8, in all of the applied insulation materials, the temperature at the tank inlet increased over time, as the LNG temperature in the bunker tanks gradually increased. The PUF showed a temperature approximately 0.013 °C lower at the receiving tank inlet than the cellular glass, and the multi-layer insulation showed a temperature approximately 0.026 °C lower than the PUF. These results can be explained by the heat ingress rate for each applied insulation, as shown in Figure 8 (dotted lines). Overall, the temperature difference at the inlet of the tank was not large, and thus the type of insulation in the pipes did not significantly affect the vapor generation during bunkering, as tabulated in Table 7. However, it should be recognized that different results may be displayed depending on other factors, such as the length of the pipe and bunkering time.

4.4. Effects of LNG Composition

The LNG composition varies with the natural gas source, processing plant, and customer requirements [12,31]. In this section, the effects of the LNG composition on the vapor generation and vapor return were analyzed. Four LNG compositions were compared: lean, medium, rich-1, and rich-2, as shown in Table 8. The rich cases were divided into rich-1 and rich-2 to determine the effect of the nitrogen content. To make the comparisons equal, all other design parameters (i.e., except for the LNG compositions in bunker tanks) remained constant, as shown in Table 2, Table 3 and Table 4.
The total amount of vapor return in the LNG rich-1 case was smaller than that in the LNG lean case, as the LNG rich-1 case was at a higher pressure than the LNG lean case, as shown in Table 8. In addition, the receiving tank net vapor generation values ( m n e t , v g , r ) for the lean, medium, and rich-1 cases were 626.14, 434.83, and −314.20 kg, respectively. The negative amount of the receiving tank net vapor generation in the case of LNG rich-1 can be explained by the fact that the receiving tank pressure was lower than the bunker tank pressure for a certain period of time after the start of bunkering, as shown in Table 8 and Figure 9. Thus, the vapor return did not occur during this period. Thus, in this period, the fraction of the vapor was condensed with the gradual pressure increase. In contrast, in the LNG lean case, the receiving tank pressure gradually decreased until it was equalized with the bunker tank pressure, resulting in a relatively large amount of generated vapor. The values of the net vapor generation in the overall system ( m n e t , v g , o v e r a l l ) for the lean, medium, and rich-1 cases were −167.18, 17.01, and 386.24 kg, respectively. The LNG rich-1 case generated a larger amount of vapor due to the volume displacement in the bunker tank, in which the discharged volume was replaced by vapor. To identify the effect of nitrogen in the LNG mixture, the LNG rich-1 and rich-2 cases were compared. The compositional difference between LNG rich-1 and rich-2 was that the rich-2 case had a mole fraction of nitrogen of 0.05 less, and a mole fraction of ethane of 0.05 more than those of rich-1. As shown in Table 8, the receiving tank net BOG generation ( m n e t , B O G , r ) values for the rich-1 and rich-2 cases were −314.20 and 1696.62 kg, respectively. This was because by reducing the nitrogen mole fraction, the equilibrium pressure of the rich-2 case became lower than that of the rich-1 case; thus, more vapor returned to the bunker tank, generating more vapor in the receiving tank. Overall, it can be determined that the initial pressure of the bunker tank according to the LNG composition at a given temperature significantly affects the vapor generation.

5. Method of Pressure Control in the Bunker Tanks and Receiving Tank

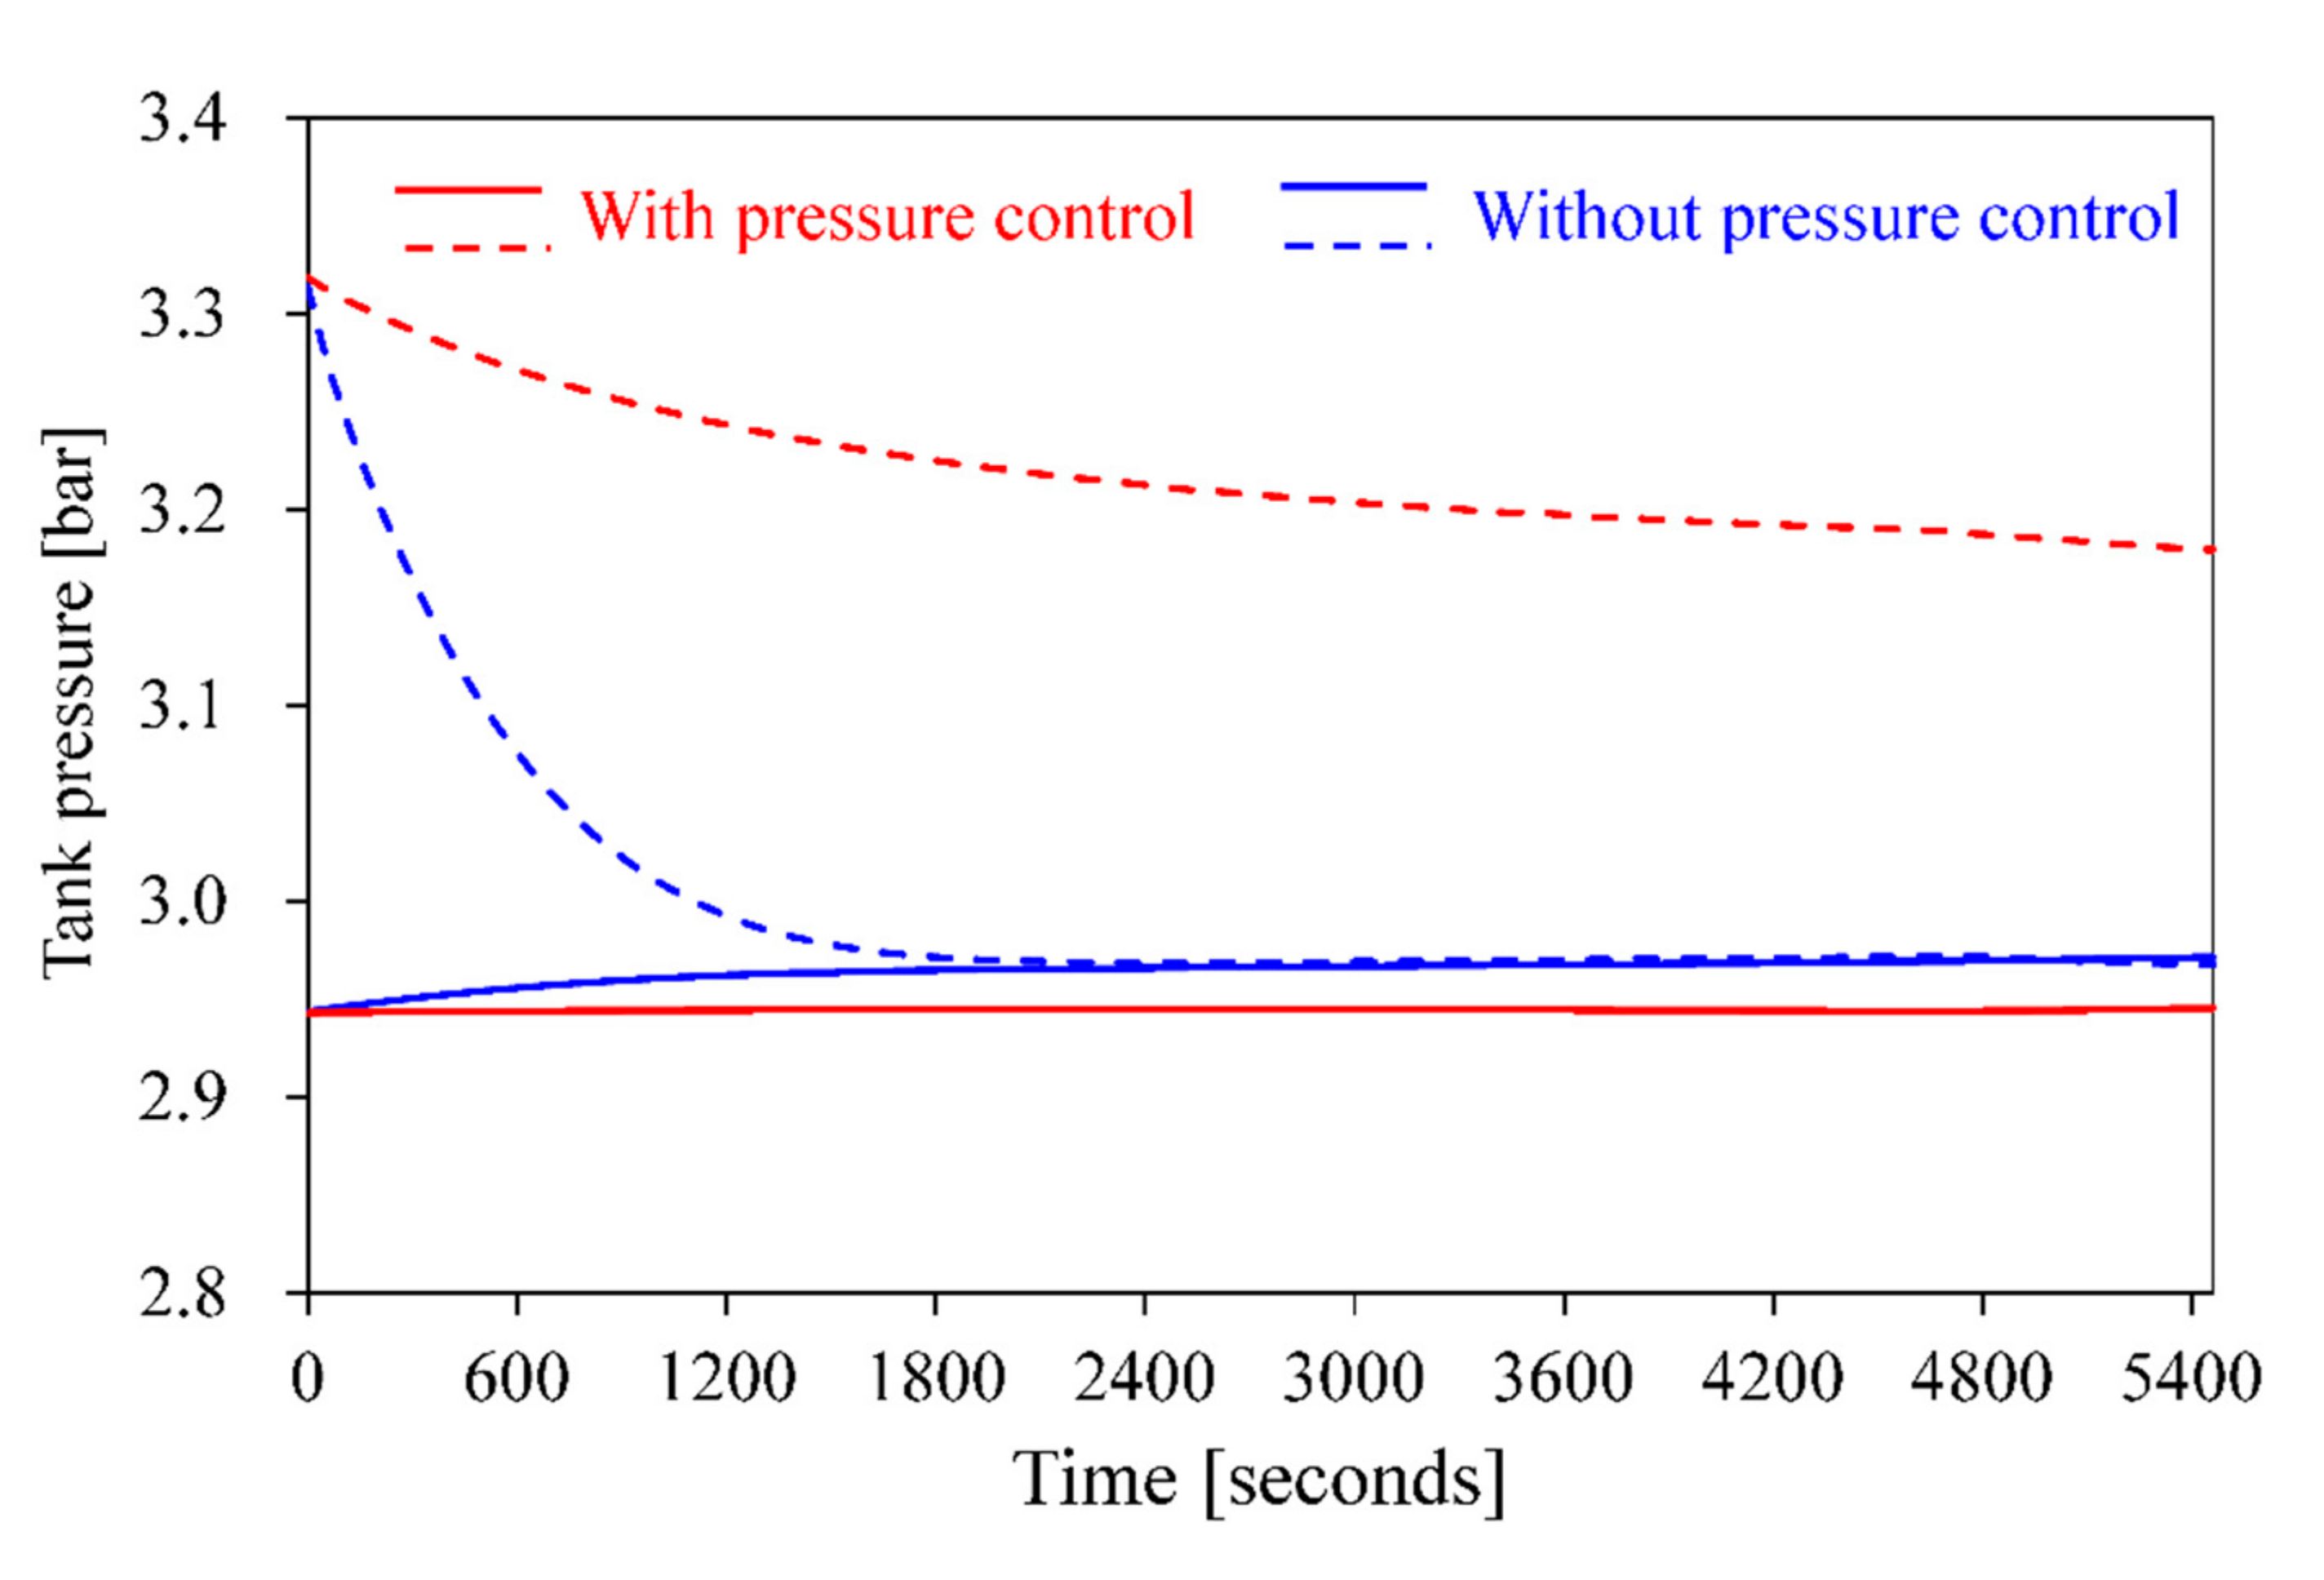
As discussed earlier, the amounts of vapor generation and vapor return are significantly affected by the pressure difference between the bunker tanks and receiving tank. When LNG is discharged from bunker tanks, the liquid volume in the LNG tank decreases, resulting in more vapor generated to fill the space left by the discharged LNG, and to maintain the pressure inside [32]. The proposed solution in this study is to maintain the bunker tank pressure as the initial condition by using a pressure control valve in the vapor return line. As is common practice in the LNG industry, the pressure of the LNG receiving tank is a few bars higher than that of the bunkering tanks. Thus, in this study, the initial pressure (temperature) of the bunker and receiving tank were set as 2.94 bar (−147 °C) and 3.31 bar (−145 °C), respectively. A proportional-integral controller (PIC-105 and PIC-106) was added to control the bunker tank and receiving tank pressure to the set point (2.94 bar) by adjusting the vapor return flow rate, as shown in Figure 10.
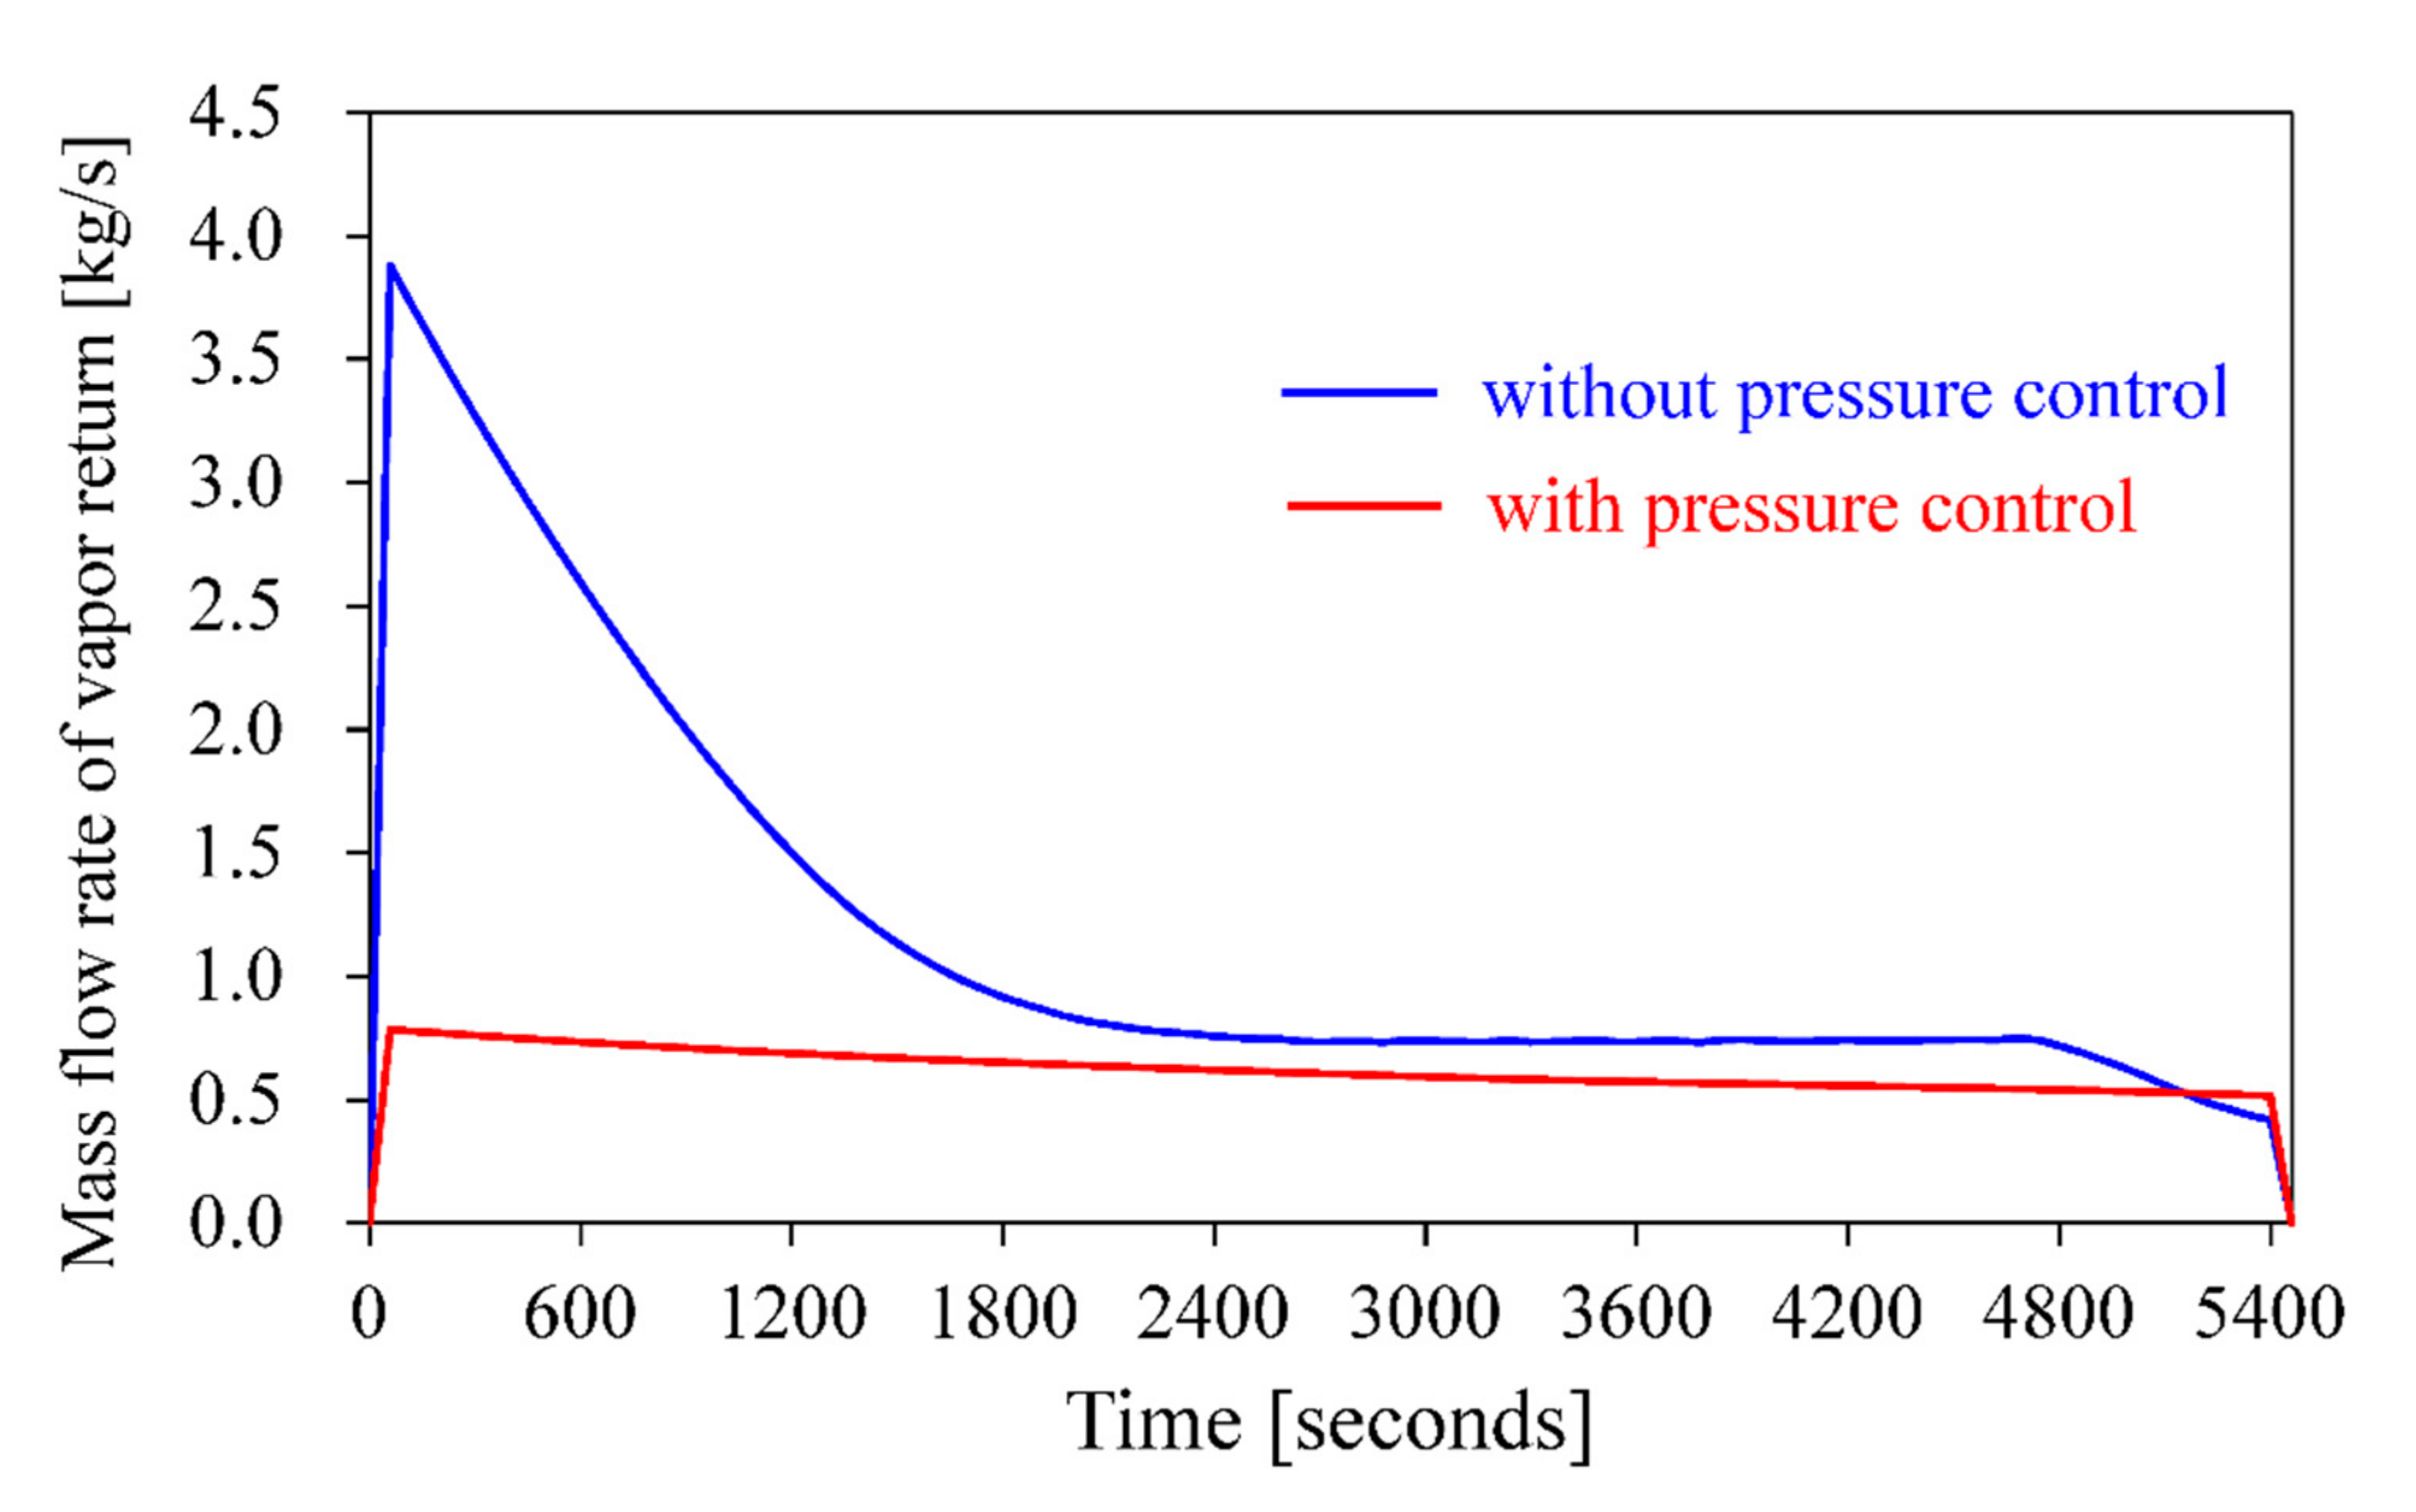
Figure 11 shows that the pressure of the receiving tank with the pressure controller gradually decreased with time. However, the pressure of the receiving tank without the pressure controller sharply decreased at the beginning of bunkering and remained almost constant after being equalized with the bunker tank pressure. Similarly, the vapor return flow rate in the tank with the pressure controller remained almost constant. However, the vapor return flow rate in the tank without the pressure controller sharply decreased at the beginning of bunkering and remained almost constant after being equalized with the bunker tank pressure, as shown in Figure 12. The amounts of vapor return and vapor generation are summarized in Table 9. The total amount of vapor return to the bunker tanks was reduced from 7392 to 3317 kg when the pressure controller was provided. This can be advantageous in the sizing of vapor handling units such as GCUs, or in re-liquefaction units (if they are applied). In addition, the net vapor generation in the receiving tank ( m n e t , v g , r ) was reduced by up to 4047 kg and the net BOG generation in the overall system ( m n e t , v g , o v e r a l l ) was reduced by 16.2%, i.e., they were more condensed by applying the pressure control. This indicates that maintaining the bunker tank pressure by using a pressure control valve in the vapor return line can provide efficient vapor management by stabilizing the vapor return flow rate and reducing the overall vapor generation. However, the final pressure of the receiving tank after bunkering is 3.18 bar when the pressure controller is provided, i.e., 0.2 bar higher than that in a case without a pressure controller. As the International Code of Safety for Ship Using Gases or Other Low-Flashpoint Fuels states that the tank pressure should be maintained below the set pressure of the tank pressure relief valves for a period of 15 days, assuming a full tank at normal service pressure and idle conditions, the increased pressure of the fuel tank after bunkering may be a disadvantage. However, by carefully reviewing the operating and design pressures of the receiving tank and the BOG consumption in the engine, this solution may benefit both bunkering and receiving ships in terms of BOG generation and the capacity of BOG handling equipment, such as re-liquefaction system, GCU, and compression unit, if those are used. From an economical point of view, considering that the above BOG handling equipment are higher in cost than other ship systems, an overall cost-saving of bunkering ships can be achieved by reducing those systems’ size.

6. Conclusions

Ship-to-ship LNG bunkering is getting more attention in the maritime sector. It is quite different from conventional onshore LNG loading/unloading in regard to several features, such as the tank type, scale, and bunkering system configuration, etc. In the present study, the effect of the main parameters on the performance of ship-to-ship LNG bunkering was studied via dynamic simulations. Our main findings are summarized as follows:
  • When the initial temperature of the receiving tank increases from −150 to −145 °C at a fixed temperature of the bunkering tank (−147 °C), the amount of vapor return is proportionally increased. The optimum temperature difference (and pressure difference) should be determined in consideration of tank pressure management.
  • The net vapor generation in the overall system has a positive value when the receiving tank temperature is colder than the bunkering LNG temperature. In contrast, it has a negative value when the receiving tank temperature is warmer than the bunkering LNG temperature.
  • Increasing the bunkering flow rate decreases the amount of heat ingress through the pipes and tanks, although the heat dissipated by the pump shaft power increases. In addition to the heat ingress effect, the pressure increase in the receiving tank from pumping is also an important factor. The optimum flow rate must be determined while considering the vapor return and bunkering time limit.
  • The influences of different insulation materials on the vapor return and vapor generation are minor; however, the influence of the insulation depends on the layout of the bunkering system (i.e., the results may be different for longer pipe lengths).
  • The composition of the LNG affects the vapor return and vapor generation. Different LNG compositions in the bunker tank lead to changes in the initial pressure of the bunker tank, influencing the vapor return and vapor generation in the receiving tank. When the nitrogen content is varied, the pressure and vapor return are significantly affected.
A pressure control method is proposed to compensate for the pressure decrease by the LNG discharged from the bunker tank, and to maintain the bunker tank pressure at the initial condition. With pressure control, the total amount of vapor return to the bunker tanks is reduced from 7392 to 3317 kg. The net vapor generation in the receiving tank ( m n e t , v g , r ) is reduced by up to 4047 kg and the net vapor generation in the overall system ( m n e t , v g , o v e r a l l ) is reduced by 16.2%, although the receiving tank pressure is 0.2 bar higher than that without pressure control.
The limitation of this study is that a constant heat transfer coefficient, instead of a temperature-dependent heat transfer coefficient which will slowly change depending on the in/out temperatures, was assumed. This caused an amount of vapor return of 0.25% offset in the base case simulation. In the future study, this should be reasonably considered.
Overall, the results of the parametric study can lay a reliable foundation for ship-to-ship LNG bunkering operations and provide insights for establishing vapor management strategies for bunkering. It is shown that the proposed concept of pressure control in a bunkering system can significantly reduce the amounts of vapor return and net vapor generation. Future work by the authors will include a detailed cost–benefit analysis for several possible vapor management methods, including pressure control, compression, re-liquefaction, pressure accumulation in the tanks, and use as fuel.

Author Contributions

Conceptualization, H.L. and S.Y.; methodology, H.L.; software, H.L.; validation, I.J., S.L., J.C., and H.K.; formal analysis, H.L. and S.Y.; investigation, H.L.; resources, I.J.; data curation, I.J. and B.R.; writing—original draft preparation, H.L. and S.L.; writing—review and editing, J.C.; visualization, I.J.; supervision, H.K.; project administration, B.R. and H.K.; funding acquisition, I.J. and H.K. All authors have read and agreed to the published version of the manuscript.

Funding

This material is based upon work supported by the Technology Innovation Program (20004659, the development of LNG Fuel Gas Supply System for Coastal Ships), which was funded by the Ministry of Trade, Industry & Energy (MOTIE, Korea), and PJT201293, Development of guidance for prevention of leak and mitigation of consequences in hydrogen ships, which was funded by the Ministry of Oceans and Fisheries (Korea).

Conflicts of Interest

The authors declare no conflict of interest.

References

  1. Kim, K.; Park, K.; Roh, G.; Chun, K. Case study on boil-off gas (BOG) minimization for lng bunkering vessel using energy storage system (ESS). J. Mar. Sci. Eng. 2019, 7, 130. [Google Scholar] [CrossRef] [Green Version]
  2. Hwang, S.; Jeong, B.; Jung, K.; Kim, M.; Zhou, P. Life cycle assessment of lng fueled vessel in domestic services. J. Mar. Sci. Eng. 2019, 7, 359. [Google Scholar] [CrossRef] [Green Version]
  3. EMSA (European Maritime Safety Agency). Guidance on LNG Bunkering to Port Authorities and Administration; EMSA (European Maritime Safety Agency): Lisbon, Portugal, 2018. [Google Scholar]
  4. Vandebroek, L. Risk assessment Study Supplying Flemish ports with LNG as a marine fuel. LNG Fuelling 2017. [Google Scholar] [CrossRef]
  5. IMO. Studies on the fessibility and use of as a fuel for shipping. Air Pollut. Energy Effic. Stud. 2016. Available online: http://www.imo.org/en/OurWork/Environment/PollutionPrevention/AirPollution/Documents/LNG%20Study.pdf (accessed on 30 August 2020).
  6. TGE. 5100 cbm LNG Bunker-Vessel ’Engie Zeebrugge’. Available online: https://www.tge-marine.com/wp-content/uploads/Datasheet-2735-engie_Zeebrugge-bunkervessel.pdf (accessed on 17 August 2020).
  7. Choi, W.J.; Navarro, J.M.; Tustin, R.D. Purpose designed LNG bunkering vessels (1). SWZ Marit. Marit. Tech. Vakbl. 2018, 139, 36–40. [Google Scholar]
  8. TGE. 5800 cbm LNG Bunker-Vessel ’Coralius’. Available online: https://www.tge-marine.com/wp-content/uploads/Datasheet-2826-coralius-bunkervessel.pdf (accessed on 17 August 2020).
  9. TGE. 6500 cbm LNG Bunker-Vessel ’Cardissa’. Available online: https://www.tge-marine.com/wp-content/uploads/Datasheet-2960-cardissa-bunkervessel.pdf (accessed on 17 August 2020).
  10. TGE. 7500 cbm LNG/LPG/Ethylene-Carrier/Bunker Vessel, ’Coral Methane’. Available online: https://www.tge-marine.com/wp-content/uploads/Datasheet-2021-CoralMethane-LNG-LPG-Ethylene-Ammonia-VCMcarrier-7500cbm.pdf (accessed on 17 August 2020).
  11. Dobrota, Đ.; Lalić, B.; Komar, I. Problem of Boil-off in LNG Supply Chain. Trans. Marit. Sci. 2013, 2, 91–100. [Google Scholar] [CrossRef] [Green Version]
  12. Yan, G.; Gu, Y. Effect of parameters on performance of LNG-FPSO offloading system in offshore associated gas fields. Appl. Energy 2010, 87, 3393–3400. [Google Scholar] [CrossRef]
  13. Benito, A. Accurate determination of LNG quality unloaded in Receiving Terminals: An Innovative Approach. Int. Gas. Union World Gas. Conf. Pap. 2009, 6, 4627–4646. [Google Scholar]
  14. IACS. LNG Bunkering Guidelines. IACS Rec. No. 142. 2016. Available online: http://www.iacs.org.uk/download/1962 (accessed on 30 August 2020).
  15. Sharafian, A.; Herrera, O.E.; Mérida, W. Performance analysis of liquefied natural gas storage tanks in refueling stations. J. Nat. Gas. Sci. Eng. 2016, 36, 496–509. [Google Scholar] [CrossRef]
  16. Shao, Y.; Lee, Y.-H.; Kim, Y.-T.; Kang, H.-K. Parametric Investigation of BOG Generation for Ship-to-Ship LNG Bunkering. J. Korean Soc. Mar. Environ. Saf. 2018, 24, 352–359. [Google Scholar] [CrossRef]
  17. Shao, Y.; Lee, Y.; Kang, H. Dynamic optimization of boil-off gas generation for different time limits in liquid natural gas bunkering. Energies 2019, 12, 1130. [Google Scholar] [CrossRef] [Green Version]
  18. Querol, E.; Gonzalez-Regueral, B.; García-Torrent, J.; García-Martínez, M.J. Boil off gas (BOG) management in Spanish liquid natural gas (LNG) terminals. Appl. Energy 2010, 87, 3384–3392. [Google Scholar] [CrossRef]
  19. Sharafian, A.; Blomerus, P.; Mérida, W. Liquefied natural gas tanker truck-to-tank transfer for on-road transportation. Appl. Therm. Eng. 2019, 162. [Google Scholar] [CrossRef]
  20. Li, Y.; Li, Y. Dynamic optimization of the Boil-Off Gas (BOG) fluctuations at an LNG receiving terminal. J. Nat. Gas. Sci. Eng. 2016, 30, 322–330. [Google Scholar] [CrossRef]
  21. Kurle, Y.M.; Wang, S.; Xu, Q. Dynamic simulation of LNG loading, BOG generation, and BOG recovery at LNG exporting terminals. Comput. Chem. Eng. 2017, 97, 47–58. [Google Scholar] [CrossRef]
  22. Zargham, M.; Pahwa, A.; Dwarkanath, P.S. Concept Design of LNG Bunkering Ship. 2012, pp. 1–32. Available online: http://name2-engineering.sites.olt.ubc.ca/files/2015/08/UBC-LNG-Bunker-Supply-Vessel-Final-Report.pdf (accessed on 30 August 2020).
  23. Linde Cryo, A.B. LNG ship to ship bunkering procedure. Uddevalla: Swedish Marine Technology Forum. 2010. Available online: https://smtf.se/fileadmin/documents/LNG02_projektrapport_appendix_www.pdf (accessed on 17 August 2020).
  24. Park, C.; Song, K.; Lee, S.; Lim, Y.; Han, C. Retrofit design of a boil-off gas handling process in liquefied natural gas receiving terminals. Energy 2012, 44, 69–78. [Google Scholar] [CrossRef]
  25. GUTTELING Product Catalog, Multi-LNG White STS Composite Hose. Available online: http://www.gutteling.com (accessed on 30 August 2020).
  26. IMO. International Code of Safety for Ship Using Gases or Other Low-Flashpoint Fuels. 2016. Available online: https://mdnautical.com/marine-safety/21370-imo-i109e-igf-code-2016-edition.html (accessed on 29 September 2020).
  27. American Bereau of Shipping. LNG Bunkering: Technical and Operational Advisory. LNG Bunkering 2014, 1, 25. [Google Scholar]
  28. Lu, M.; Connell, L.D. Transient, thermal wellbore flow of multispecies carbon dioxide mixtures with phase transition during geological storage. Int. J. Multiph. Flow 2014, 63, 82–92. [Google Scholar] [CrossRef]
  29. Marie, N.; Arnet, L. LNG Bunkering Operations. 2014. Available online: https://ntnuopen.ntnu.no/ntnu-xmlui/bitstream/handle/11250/235731/748638_FULLTEXT01.pdf?sequence=2 (accessed on 17 August 2020).
  30. Fesmire, J.E.; Augustynowicz, S.D. Cryogenic thermal insulation systems. In Proceedings of the 16th Thermal and Fluids Analysis Workshop, Orlando, FL, USA, 8–12 August 2005. [Google Scholar]
  31. Hasan, M.M.F.; Zheng, A.M.; Karimi, I.A. Minimizing boil-off losses in liquefied natural gas transportation. Ind. Eng. Chem. Res. 2009, 48, 9571–9580. [Google Scholar] [CrossRef]
  32. Kurle, Y.M.; Wang, S.; Xu, Q. Simulation study on boil-off gas minimization and recovery strategies at LNG exporting terminals. Appl. Energy 2015, 156, 628–641. [Google Scholar] [CrossRef]
Figure 1. Schematic representation of the different bunkering methods.
Applsci 10 06861 g001
Figure 2. Schematic isometric view of ship-to-ship bunkering.
Applsci 10 06861 g002
Figure 3. Comparison of vapor mass differences with varying receiving tank initial temperature.
Applsci 10 06861 g003
Figure 4. Variation of vapor return flow rates and receiving tank pressure at receiving tank initial temperature, −145, −147, −149 °C (solid line: mass flow rate of vapor return, dotted line: receiving tank pressure).
Applsci 10 06861 g004
Figure 5. T–s diagram at bunkering flow rates of 300, 500, and 1000 m3/h.
Applsci 10 06861 g005
Figure 6. Variation of vapor return flow rates at bunkering flow rates of 300, 500, and 1000 m3/h.
Applsci 10 06861 g006
Figure 7. Variation of tank pressure at bunkering flow rates of 300, 500, and 1000 m3/h.
Applsci 10 06861 g007
Figure 8. Variation of liquified natural gas (LNG) temperature at the receiving tank inlet for different insulation materials (solid line: temperature in receiving tank inlet, dotted line: heat flow through pipes).
Applsci 10 06861 g008
Figure 9. Variation of receiving tank pressure at different LNG composition.
Applsci 10 06861 g009
Figure 10. Dynamic process modeling with bunker tank pressure controller.
Applsci 10 06861 g010
Figure 11. Variation of tank pressure with time (solid line: bunker tank, dotted line: receiving tank).
Applsci 10 06861 g011
Figure 12. Variation of vapor return flow rate with time.
Applsci 10 06861 g012
Table 1. List of liquefied natural gas (LNG) bunkering ships.
Vessel NameCargo Tank (Bunker Tank)Bunkering Rate
(m3/h)
Boil-Off Gas HandlingReference
Tank TypeCargo Capacity
(m3)
Design Pressure
(Barg)
As fuelBurningRe-Liquefaction
Engie ZeebruggeType C51004600YesYesNo[6,7]
CoraliusBi-lobe58004.5840YesYesNo[7,8]
CardissaType C65003.51100YesYesYes[7,9]
KariosType C75003.751150YesNoNo[7]
Coral MethaneType C75003.2900Yes-Not for LNG[10]
Table 2. Specification and initial condition of LNG bunker tank in bunkering ship.
ParameterValueUnitNotes
Quantity of bunker tank2eaBunkering ship has two independent International Maritime Organization (IMO) type C tanks
Net capacity of bunker tank, Vnet, bt3250m3Total cargo capacity of bunkering ship is 6500 m3 in two bunker tanks
Overall length of each bunker tank30.74m2:1 ellipsoidal head, D/2h = 2, head height 3 m
Diameter of each bunker tank12mAssumed based on Reference [22]
Surface area of each bunker tank, Abt932.5m2Calculated from length and diameter
Maximum allowable relief valve setting, Pbt, MARVS4barAssumed
Boil-off rate (Normal) 0.25%Assumed
Thermal conductance of bunker tank, (UA)bt107.36W/KCalculated from Equations (2) and (3)
Overall heat transfer coefficient of bunker tank, Ubt0.414kJ/h·m2·KCalculated from Equations (2)–(4)
Quantity of cargo pump2eaThere is a submerged electrical driven cargo pump in each bunker tank
Cargo pump performance curves--Three performance curves generated in Aspen HYSYS at efficiency of 70%, 210 mlc and volumetric flow rate of 400 m3/h
Ambient Temperature25°C
Base case conditions at bunkering
LNG Volume %80%
LNG temperature in bunker tank−147°C
Pressure in bunker tank2.94bar
Table 3. Specification and initial condition of LNG fuel tank in receiving ship.
ParameterValueUnitNotes
Quantity of receiving tank1eaReceiving ship has an independent IMO type C tank
Net capacity of receiving tank, Vnet, rt1000m3
Overall length of receiving tank27.15m2:1 ellipsoidal head, D/2h = 2, head height 1.75 m
Diameter of receiving tank7mAssumed
Surface area of receiving tank, Art520.1m2Calculated from length and diameter
Maximum allowable relief valve setting, Prt, MARVS6barAssumed
Boil-off rate (Normal) 0.35%Assumed
Thermal conductance of tank, (UA)rt46.25W/KCalculated from Equations (2) and (3)
Overall heat transfer coefficient of tank, Urt0.320kJ/h·m2·KCalculated from Equations (2)–(4)
Ambient Temperature25°C
Base case conditions at bunkering
LNG Volume % (Heel)20%
LNG temperature−147°C
Pressure in receiving tank2.94bar
Loading limit90%
It was assumed that a dual fuel engine generator was installed on the receiving ship, and that the receiving ship did not use the LNG as fuel during bunkering.
Table 4. Specification of bunkering pipelines.
ParameterValueUnitNotes
Bunkering line diameter (Nominal)8inchSch10S (3.76 mm), Inner diameter 211.58 mm
Total length of LNG bunkering pipe, Lpipe112mSch10S (3.40 mm), Inner diameter 161.5 mm
Hose length, Lhose10mReference [29]
Hose pressure drop, Δ P h o s e 0.1bar/mHose pressure drop of 0.1 bar/m is applied for liquid line only
Pipe insulation thermal conductivity, kinsulation0.021W/m·KPUF (Polyurethane foam) at −162 °C, 1 atm and density of 32 kg/m3 [30]
Pipe Insulation thickness, tinsulation50mmAssumed
Overall heat transfer coefficient of liquid line, Upipe1.730kJ/h·m2·KCalculated
Total bunkering flow rate500m3/hBunkering duration of about 2 h assumed
Topping up flow rate200m3/hWhen the volume % of fuel tank reaches 85%, flow rate is adjusted from 500 to 200 m3/h
Ambient Temperature25°C
Table 5. Amount of heat ingress at bunkering flow rates of 300, 500, and 1000 m3/h.
Category300 m3/h500 m3/h1000 m3/h
Heat ingress through pump (kJ)59,86676,805151,431
Heat ingress through pipe (kJ)43,65827,15013,338
Heat ingress through tanks (kJ)69,41143,16921,213
Total heat ingress (kJ)172,935147,124185,982
Table 6. Properties of insulation materials.
ParameterCellular GlassPolyurethane Foam (PUF)Multi-Layer Insulation (MLI)
Thermal conductivity (W/m·K)0.0330.0210.010 (at 133.3 Pa)
Overall heat transfer coefficient of pipe insulation (kJ/h·m2·K)2.6321.7300.849 (at 133.3 Pa)
Table 7. Total amount of vapor return and net vapor generation with different insulation materials.
CategoryCellular GlassPolyurethane Foam (PUF)Multi-Layer Insulation (MLI)
Total amount of vapor return (kg)3991.224016.524036.62
Receiving tank net vapor generation, m n e t , v g , r (kg)409.15434.83459.35
Net vapor generation (overall system), m n e t , v g , o v e r a l l (kg)14.3917.0120.01
Table 8. Composition of LNG in bunker tanks and results.
ConditionsLNG LeanLNG Medium (Base Case)LNG Rich-1LNG Rich-2
Composition (mole %)
Methane0.9850.9230.8600.860
Ethane0.0130.0500.0940.099
Propane0.0010.0150.0250.025
Nitrogen0.0010.0050.0100.005
n-Pentane0.0000.0010.0010.001
n-Butane0.0010.0060.0100.010
Temperature (°C)−147−147−147−147
Pressure (bar)2.9162.9413.0772.803
Total amount of vapor return (kg)4224.514016.523230.685296.50
Receiving tank net vapor generation, m n e t , v g , r (kg)626.14434.83−314.201696.62
Net vapor generation (overall system), m n e t , v g , o v e r a l l (kg)−167.1817.01386.24−134.93
Table 9. Comparison of the evaluated values at the condition of with/without pressure control.
CategoryWithout Pressure ControlWith Pressure Control
Total amount of vapor return (kg)7392.553317.15
Receiving tank net vapor generation, m n e t , v g , r (kg)3352.41−695.32
Net vapor generation (Overall system), m n e t , v g , o v e r a l l (kg)−380.61−442.49