Article

Fragmented Rockfall Volume Distribution from Photogrammetry-Based Structural Mapping and Discrete Fracture Networks

1
Department of Civil and Environmental Engineering, University of Alberta, Edmonton, AB T6E 6S8, Canada
2
Klohn Crippen Berger Ltd., Edmonton, AB T6X 0P7, Canada
3
Alberta Transportation, Edmonton, AB T6B 2X3, Canada
*
Author to whom correspondence should be addressed.
Appl. Sci. 2020, 10(19), 6977; https://doi.org/10.3390/app10196977
Submission received: 25 August 2020 / Revised: 30 September 2020 / Accepted: 4 October 2020 / Published: 6 October 2020

Abstract

:

Featured Application

The design of rockfall protection structures requires information about the falling block volumes. This can be challenging at locations with scarce rockfall records and where block surveys are not feasible. This paper describes and validates a method for estimating rockfall block volumes, based on structural mapping using on photogrammetric techniques. The method can be used for dimensioning rockfall protection structures in cases where data is scarce or not available.

Abstract

The design of rockfall protection structures requires information about the falling block volumes. Computational tools for rockfall trajectory simulation are now capable of modeling block fragmentation, requiring the fragmented volume-relative frequency distribution of rockfalls as input. This can be challenging at locations with scarce or nonexistent rockfall records and where block surveys are not feasible. The work in this paper shows that simple discrete fracture network realizations from structural mapping based on photogrammetric techniques can be used to reliably estimate rock fall block volumes. These estimates can be used for dimensioning rockfall protection structures in cases where data is scarce or not available. The methodology is tested at two sites in the Canadian Cordillera where limestone outcrops have been the source of recurrent rockfalls. The results suggest that fragmentation will largely tend to occur through weak planes and expansion of non-persistent discontinuities, while other block breakage mechanisms exert less influence in the fragmented volume-relative frequency distribution of rockfalls. Therefore, block volume distribution can be estimated using a simple discrete fracture network (DFN) with fully persistent discontinuities. Limitations of the methods are also discussed, as well as potential future research to address such limitations.

1. Introduction

Rockfalls have long been recognized as ubiquitous hazards in mountainous regions [1,2,3,4,5,6,7,8]. Although rockfall volumes are typically small when compared to other landslide processes, their high frequency has often been associated with recurrent losses [5,9,10]. As a response, a variety of rockfall management approaches have been developed to assess rockfall hazard and risk, and to support decision-making for rockfall risk mitigation strategies [10,11,12,13,14,15,16,17,18,19].
Quantifying rockfall hazard and risk, and the design of rockfall mitigation structures, require information about the falling block volumes (and mass), their fragmentation during motion, and their frequencies [13,20,21,22,23,24]. Information on rockfall volumes and fragmentation can be gathered from comprehensive records or estimated through surveying fallen blocks along known rockfall trajectories [6,11,13,16,20,23]. However, these methods present challenges where rockfall records are scarce and block surveys are not possible due to the steepness of the terrain or falling blocks entering waterbodies downslope from the rock fall sources. Recognizing this challenge, a number of researchers have performed fragmentation field testing [25,26], evaluation of impact energy thresholds for fragmentation [27], and numerical simulation of fragmentation [28,29]. These have provided valuable insights that allowed the development of rockfall trajectory simulations capable of modeling block fragmentation based on the power-law volume distribution typically observed in rockfall deposits [9,30,31,32]. However, these models still require validation of the parameters of the power-law distributions of block volumes used for fragmentation.
The rock block volume distribution at the rockfall source, or In situ Rock Block Distribution (IRBD), can be calculated based on information on the rock mass discontinuities. Detailed 3-dimensional surface models of the rockfall sources obtained through Light Detection and Ranging (LiDAR) and photogrammetric techniques allow for discontinuity mapping and direct calculation of potential rockfall volumes [32,33,34,35]. Further, rock mass discontinuity information can be used to develop 3-dimensional computational realizations of the rock mass structure (Discrete Fracture Networks (DFNs)). Accounting for the stochastic characteristics of discontinuity orientation, spacing and finite persistence in developing DFNs has shown enhanced capability for estimating IRBD of potential rockfall events [33,34,36,37]. However, IRBD from direct measurements in surface models or DFN realizations of the rockfall source are not compatible with rock block distributions of fragmented rockfalls [31,35].
This paper presents a method to estimate the fragmented rockfall volume distribution in the absence of rockfall records or fallen block surveys, which could be a direct input into rockfall trajectory models that consider fragmentation. The method takes advantage of photogrammetric techniques to build 3-dimensional surface models of rockfall sources for virtual structural mapping of discontinuities. This method is based on the hypothesis that fragmentation in strong rocks will tend to occur through weak planes and by growth of non-persistent discontinuities as the in situ blocks detach, fall, bounce, and roll. It is assumed that the resulting fragmented blocks can be approximated by increasing the persistence of mapped discontinuities in DFN realizations. This implies that other breakage mechanisms in strong rocks would have less influence in the fragmented volume distribution of rockfalls, and could be neglected for the purpose of dimensioning rockfall protection structures without being overly conservative. The method is tested at two limestone rock cliffs in the Canadian Cordillera: the Tornado Mountain site adjacent to a railway line owned and operated by Canadian Pacific Railway (CP) and Site S042, adjacent to Highway 742 in Alberta which is maintained by Alberta Transportation (AT).

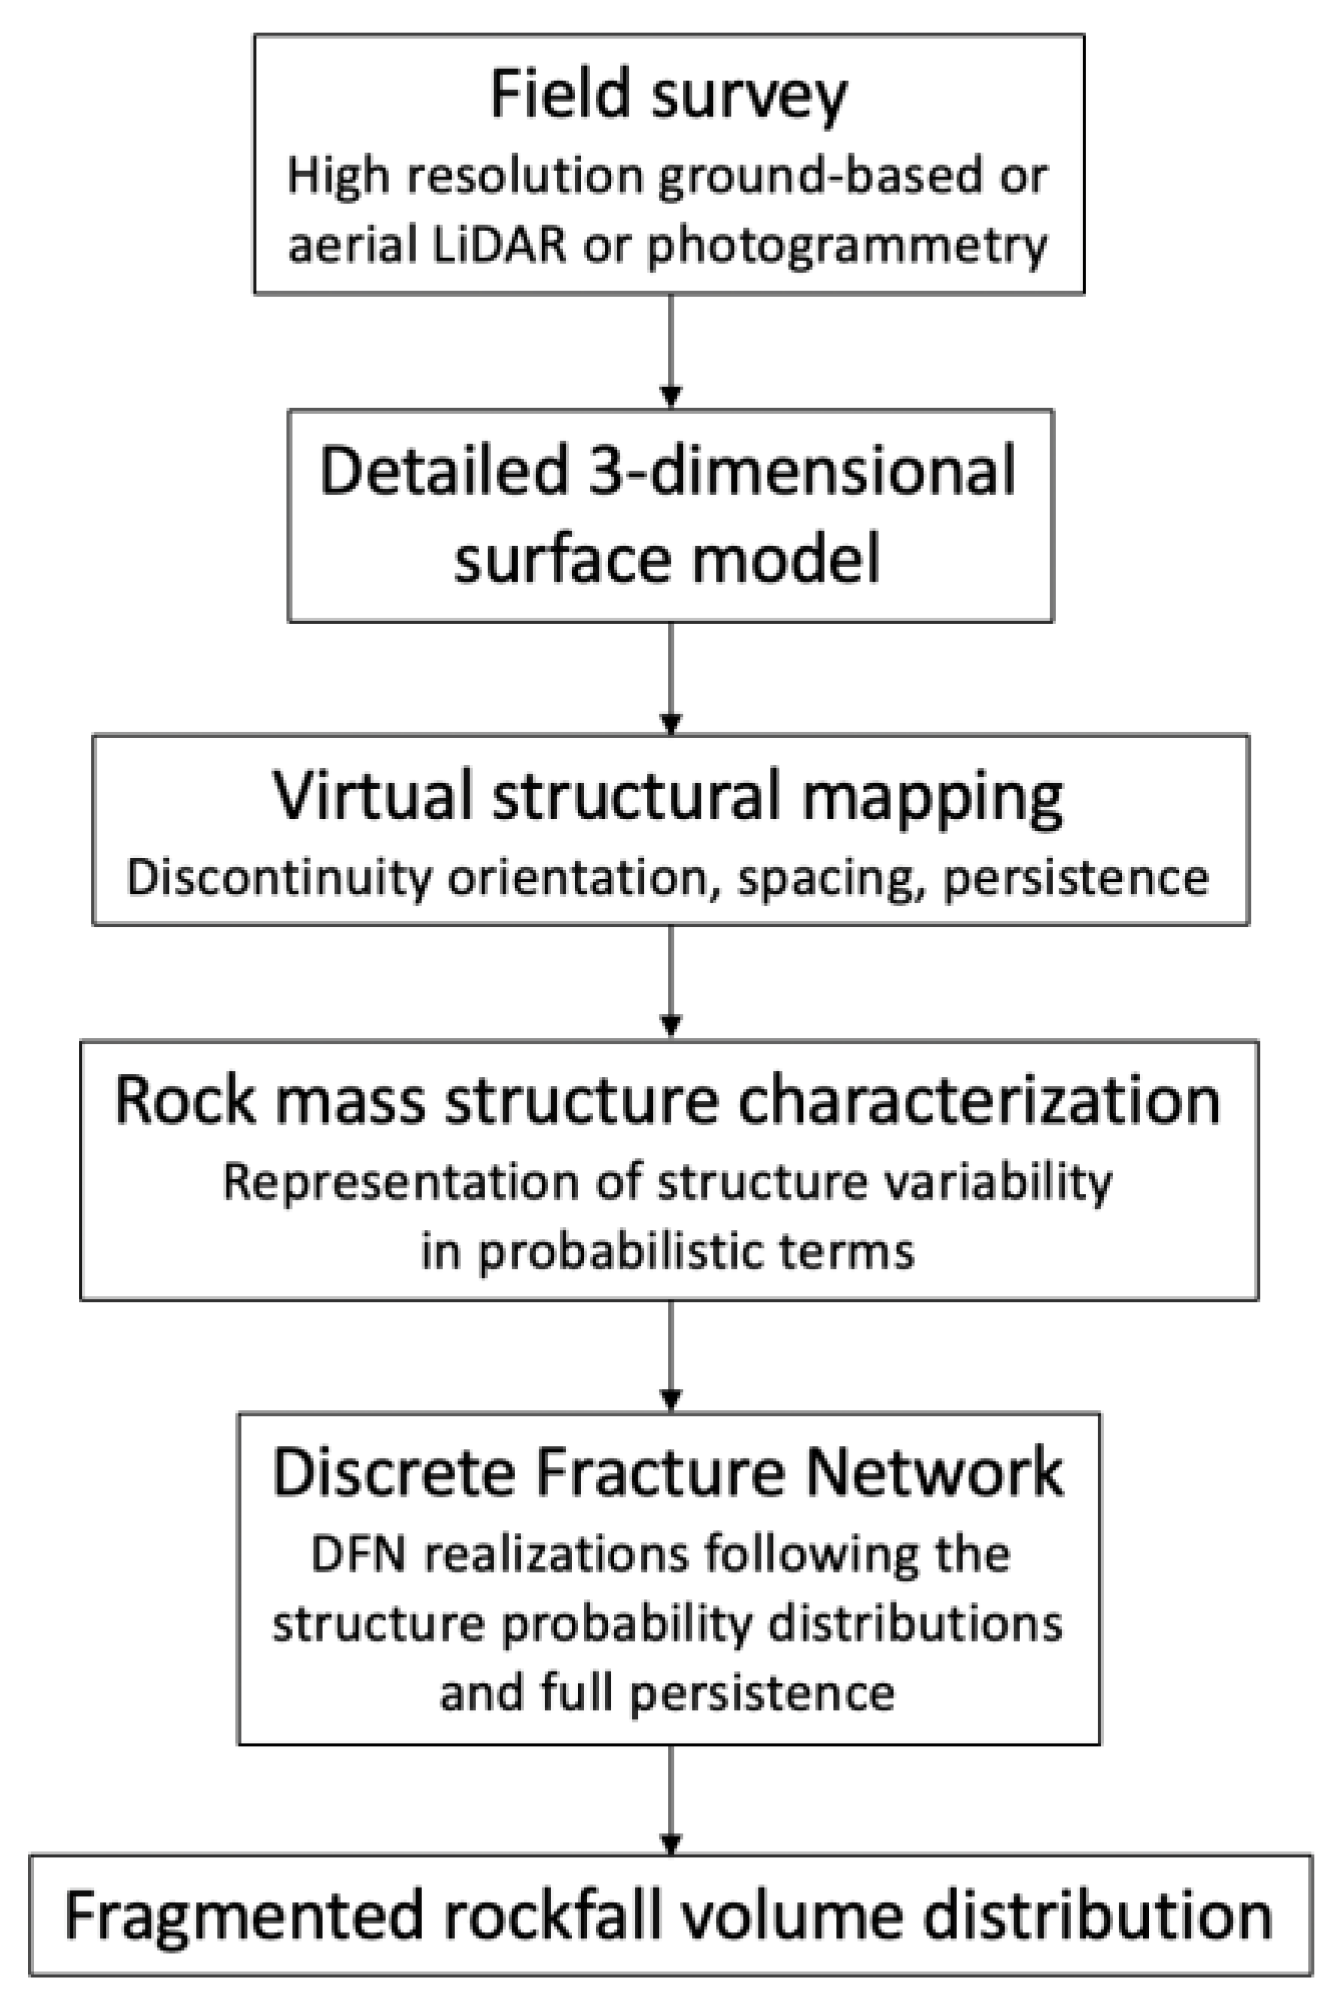
2. Materials and Methods

The method is illustrated in Figure 1 after the work in [35]. In this paper, we add a step for block volume survey in the field and comparison between surveyed and calculated fragmented volumes as a means of validating the method and assumptions.
The method initiates with a field survey of the rockfall source area. The survey aims at capturing high-resolution photogrammetric images (ground pixel sizes of 1 cm or smaller can be obtained with common photographic cameras and lenses given adequate planning for photography locations) or dense Light Detection and ranging (LiDAR) scans. It is the authors’ experience that LiDAR scans with densities of 500 points per m2 allow for mapping large discontinuities, but tend to miss non-persistent joint sets, particularly those with orientations sub-parallel to the line of sight with the laser scanner. Higher densities (2500 points per m2 or above) are typically required, which can take significant scanning time. Ground-based photogrammetry was used in this study.
The high-resolution photogrammetry is used to develop a detailed 3-dimensional surface model. Rock mass structures can be mapped in this 3-dimensional, virtual model (virtual mapping) to obtain discontinuity characteristics (orientation, spacing, persistence). This information is then used to identify major structures and discontinuity sets. Discontinuity set variability (e.g., dip, dip direction, and spacing) is fitted to probability distributions for a stochastic representation. The probabilistic structure information is then used to develop DFN realizations. The hypothesis that fragmentation in strong rocks will occur through weak planes and by growth of non-persistent discontinuities is conveniently represented by simplified DFNs that assume fully persistent discontinuities. The resulting discrete rock blocks are finally used to calculate the fragmented rockfall distribution.

2.1. Ground-Based Photogrammetry and Structural Mapping

Ground-based photogrammetry at the study areas were performed with digital single-lens reflex (DSLR) cameras with sensor size of 35.9 mm by 24 mm and 36.3 million pixels. The lens used at the Tornado Mountain site had a 200 mm fixed focal length and the lens used for Site S042 had a 150 mm fixed focal length. The distance between the camera stations and the target slope area varied between approximately 500 m and 600 m at the Tornado Mountain site, and between approximately 200 m and 600 m at Site S042. This corresponds to ground pixel sizes between 0.7 cm and 2 cm.
Photographs were processed in ADAM Technology’s photogrammetry software suite [38]. This software package builds a digital surface model based on overlapping sets of photos using photogrammetric principles, with tools to (automatically or manually) identify exposed discontinuity faces and map their orientations. In this study, orientations were mapped manually for all observable discontinuity faces. The software also has a tool that allows for measuring discontinuity spacing.
Discontinuity orientations obtained from the virtual structural mapping were input into Rocscience’s Dips software package [39]. Dips provides stereographic projection plots of discontinuity orientations and allows for defining discontinuity sets with manual intervention. The software further provides histograms and exports the mapped orientations corresponding to each discontinuity set defined.
The discontinuity orientations for each set were imported into Wolfram’s Mathematica software package [40]. This software is capable of working with large databases, conducts complex explicit mathematical and numerical calculations, and provides advanced visualization of data and results. Histograms with the probability densities of set orientations were fitted to probability density functions (PDFs). The number of observations required for an 80% confidence is estimated at 41 according to [41], and up to 271 for a 90% confidence. The number of observations achieved per set in this study varied between 18 and 75. This corresponded to limitations in aerial extents of the outcrop of interest (Tornado Mountain rockfall source) or limitations about observable discontinuities. This limitation necessitated the use of engineering judgment when defining the PDF for each set of discontinuities. PDFs were truncated at the minimum and maximum values measured to avoid unrealistic values at the distribution tails. Normal distributions were assumed for the PDFs following observations in [41], with the exception of one set which fit a LogNormal distribution. These PDFs were adopted as the mathematical representation of discontinuity orientation variability for each discontinuity set.
Pearson’s χ2 tests were adopted to evaluate the fit of these distributions to the orientation data. The statistic value (χ2) in this test is obtained through Equation (1), where n is the number of bins in the histogram, Xi is the observed data, and Ei is the expected value based on the theoretical distribution.
χ 2 = i = 1 n ( X i E i ) 2 E i
The null hypothesis is that the data are a subset obtained from the theoretical distribution. The value of χ2 obtained through Equation (1) is mapped to the χ2 Distribution to obtain the probability that this or a larger difference will be observed between the data and the distribution. If the probability is higher than the criteria adopted (commonly 0.05), the hypothesis is not rejected [42].

2.2. Fragmented Rockfall Volume Surveys

Fragmented rockfall volume surveys consisted of manual measurement of fallen block dimensions using standard surveyor measuring tapes. The measurements aimed to capture the average block dimensions for length, width and thickness. Block volumes were calculated by multiplication of the average dimensions. It is important to note this approach introduces measurement bias; however, more advanced methods for volume calculation were not feasible due to the large number of blocks to survey, accessibility limitations for the Tornado Mountain site, and resource availability for the surveys. The Tornado Mountain site is characterized by long runout distances of over 0.5 km. The survey consisted of measuring blocks encountered within the known rockfall trajectories [35]. The survey at Site S042 was conducted at the toe of the talus slope below the rock outcrop [38].

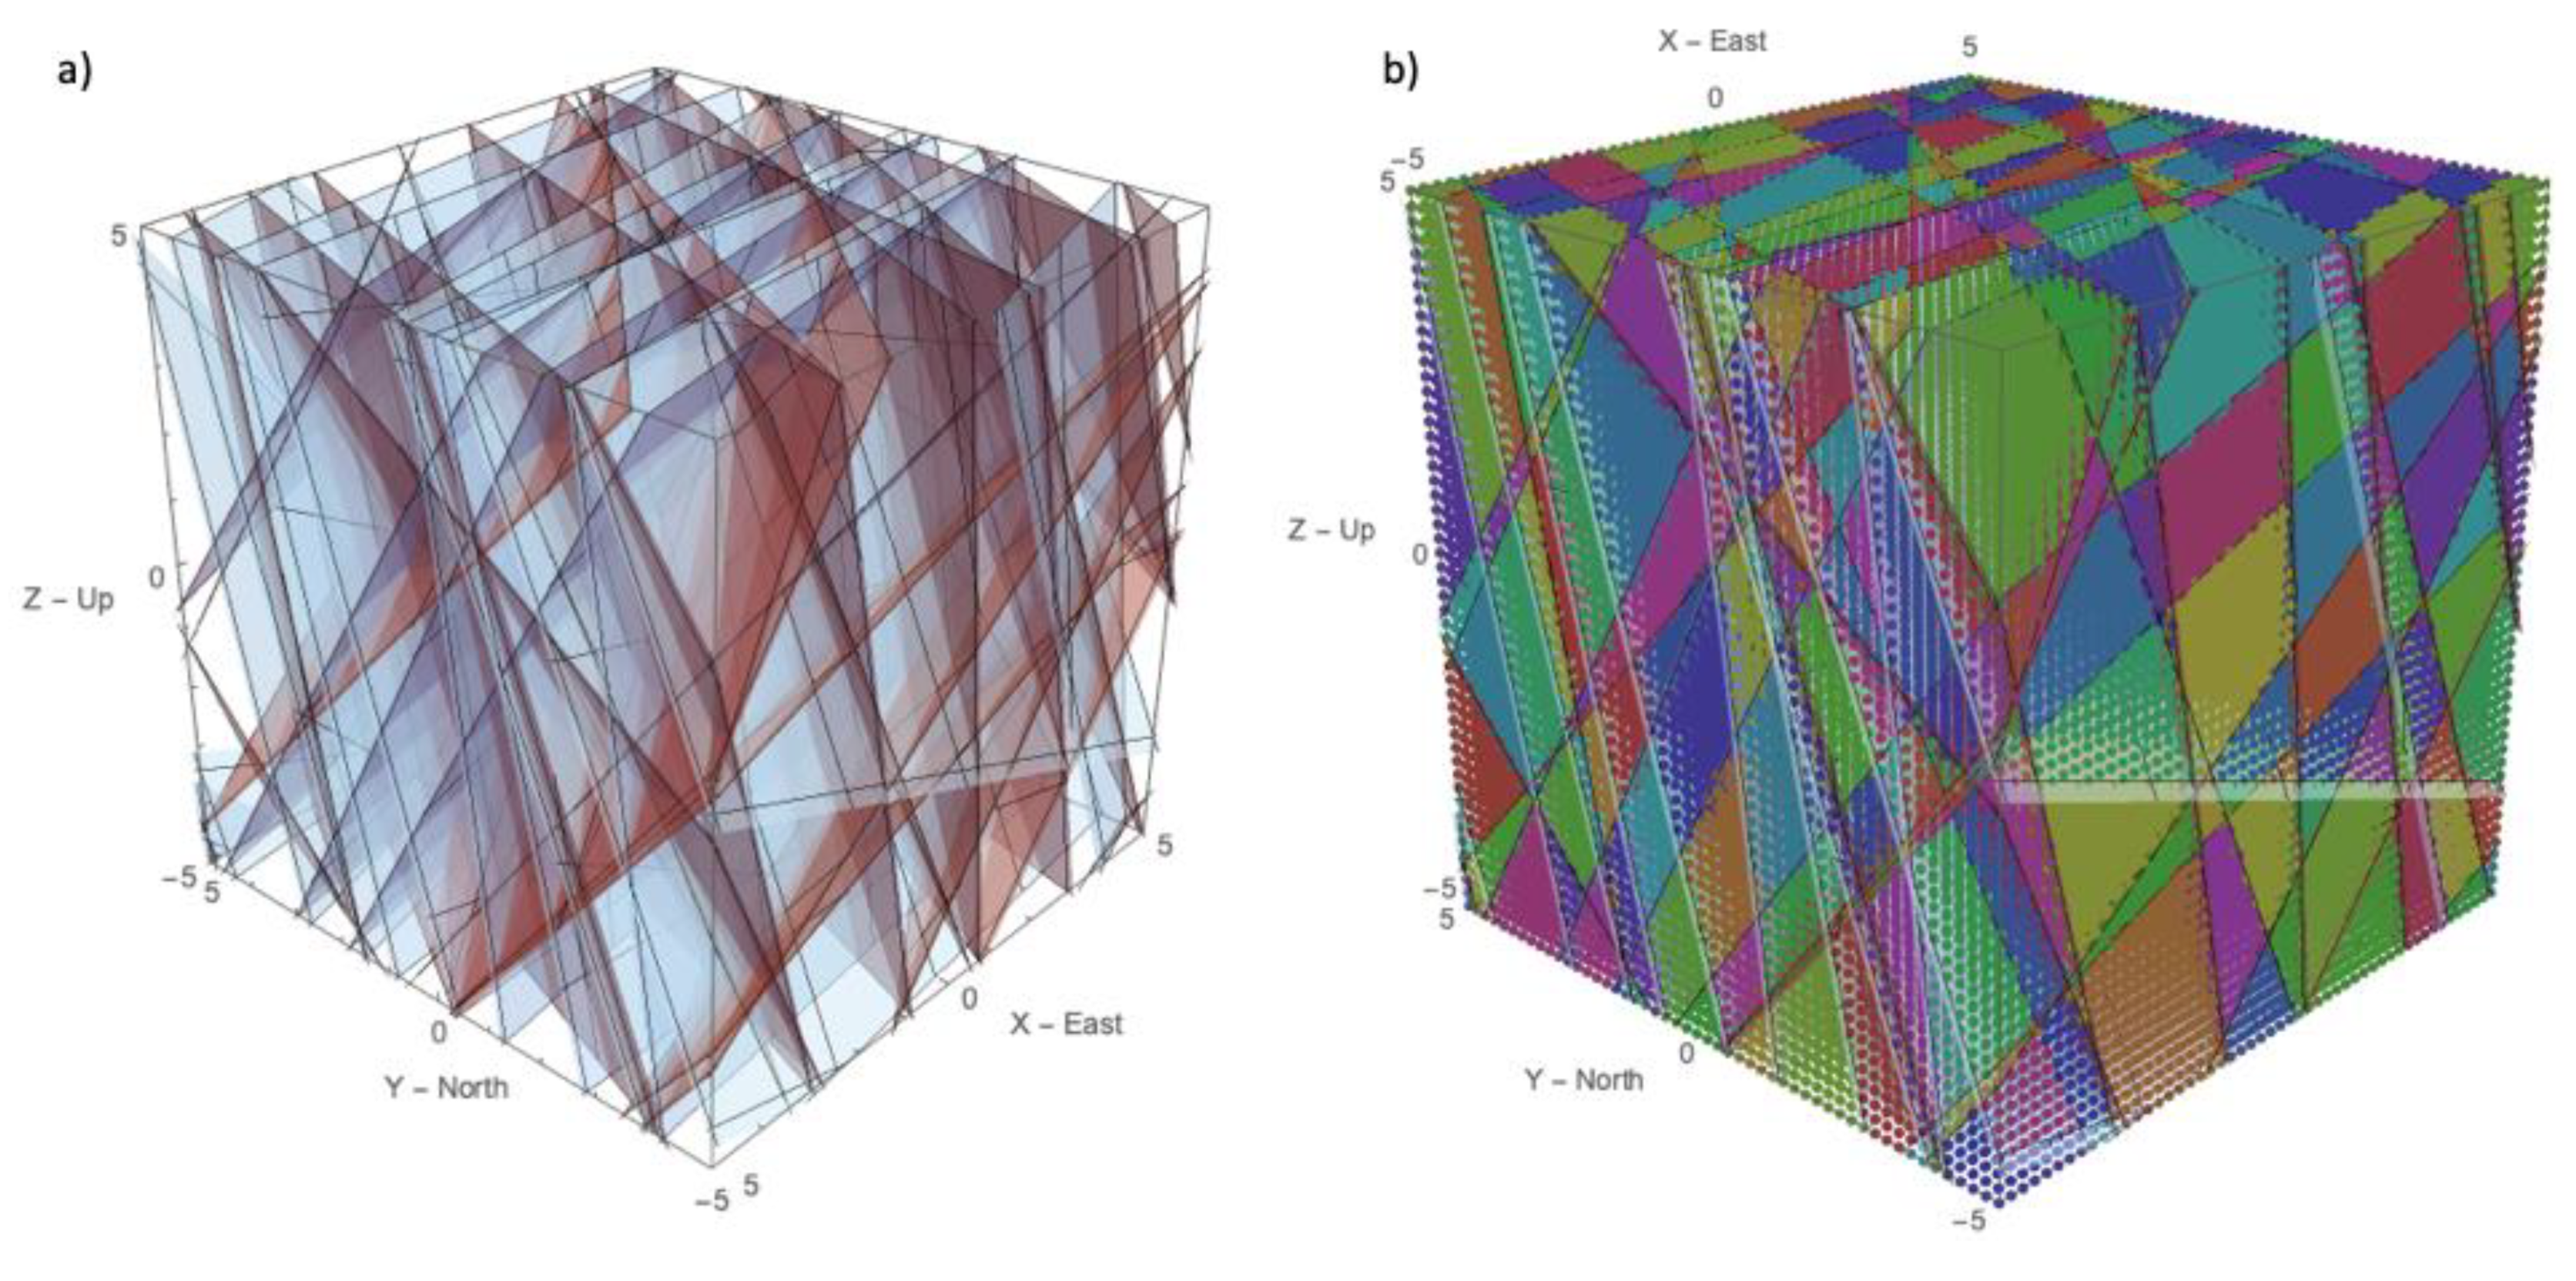
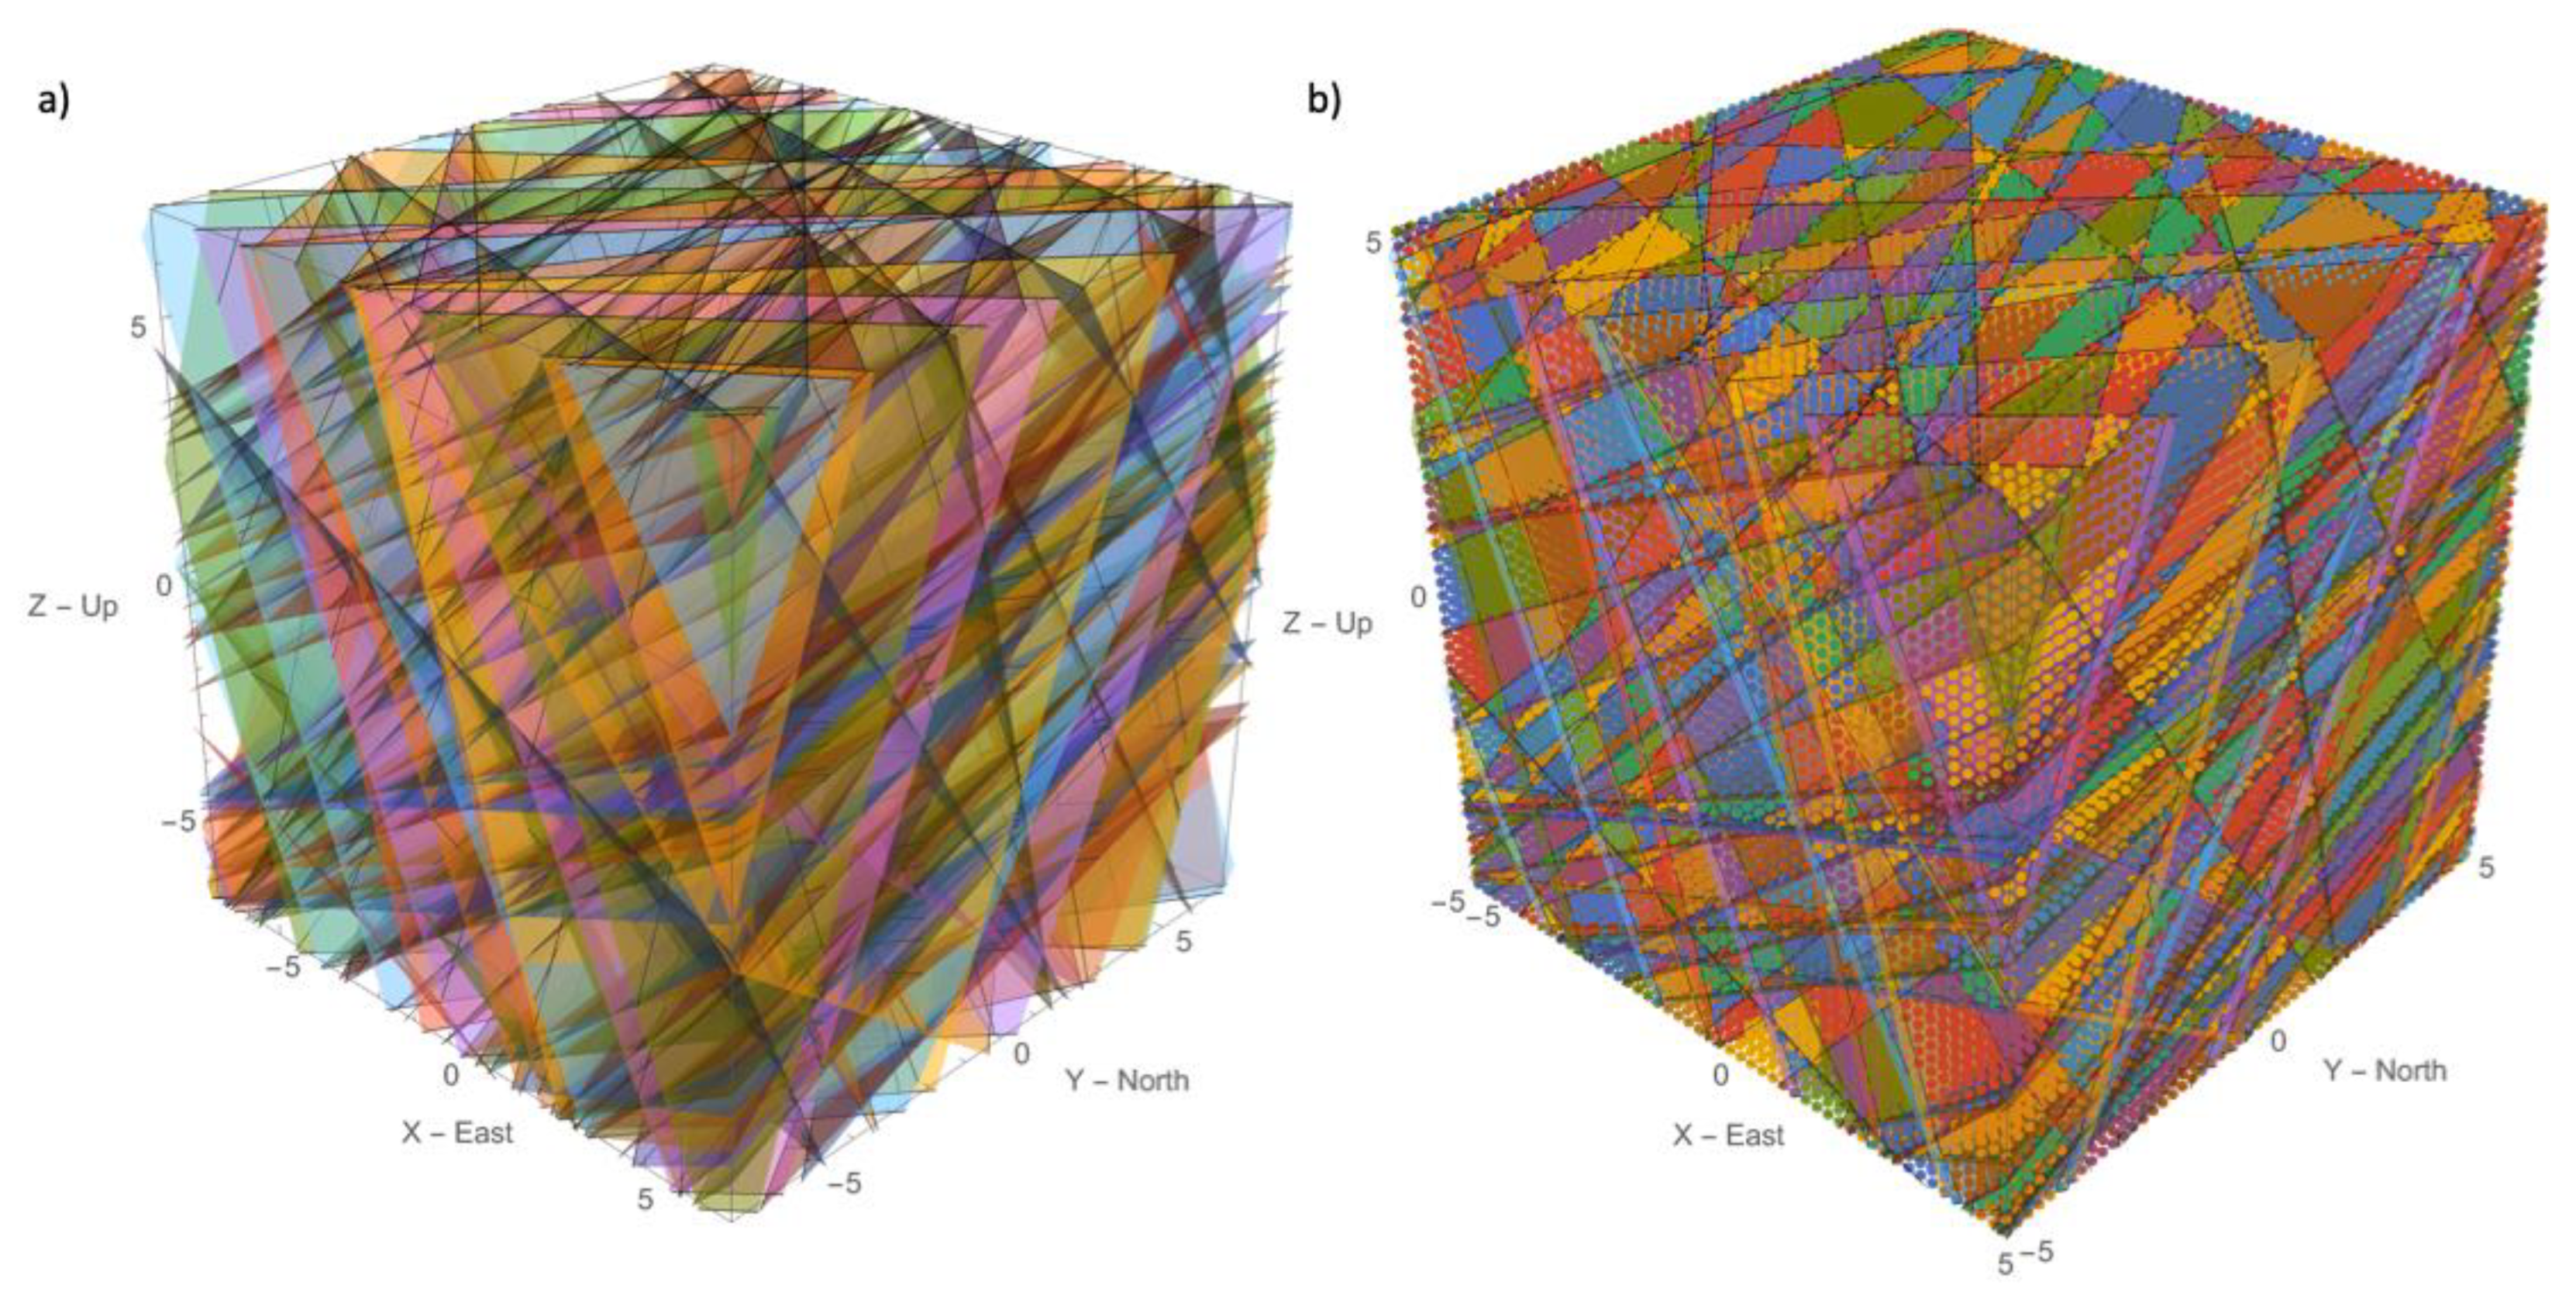
2.3. Persistent Discrete Fracture Network (DFN)

The persistent DFN is coded into Wolfram’s Mathematica following the PDF’s that represent the orientations of the discontinuity sets. A DFN block size must be defined; in this study, blocks of 10 m x 10 m x 10 m were utilized. This corresponds to a DFN block size approximately 4 to 5 times the maximum fragment sizes surveyed in each dimension (up to 2.5 m at the Tornado Mountain site), and over 60 times in volume. Each discontinuity set is constructed in sequence. For each set, a random location is selected within the DFN block (Random North, East, and Up). Random generation follows the ExtendedCA methodology coded in Wolfram’s Mathematica [40]. From this location, a plane is defined by a random selection of dip and dip direction according to the PDF of the orientations. The following discontinuities to be generated for that set are separated by random selection of a spacing value (according to the spacing PDF), in the normal direction to the previous plane generated. Orientations for these planes are then randomly selected following the process described. This sequence continues until the planes lie fully outside the DFN block. This process is repeated for each discontinuity set. Major discontinuities (e.g., faults) can be explicitly included in the DFN by defining them as planes. In this study, large numbers of discontinuities were defined and visually inspected to corroborate that the DFN block was fully constructed and populated with discontinuities according to the structural mapping at both sites.

2.4. DFN-Based Volume Calculations
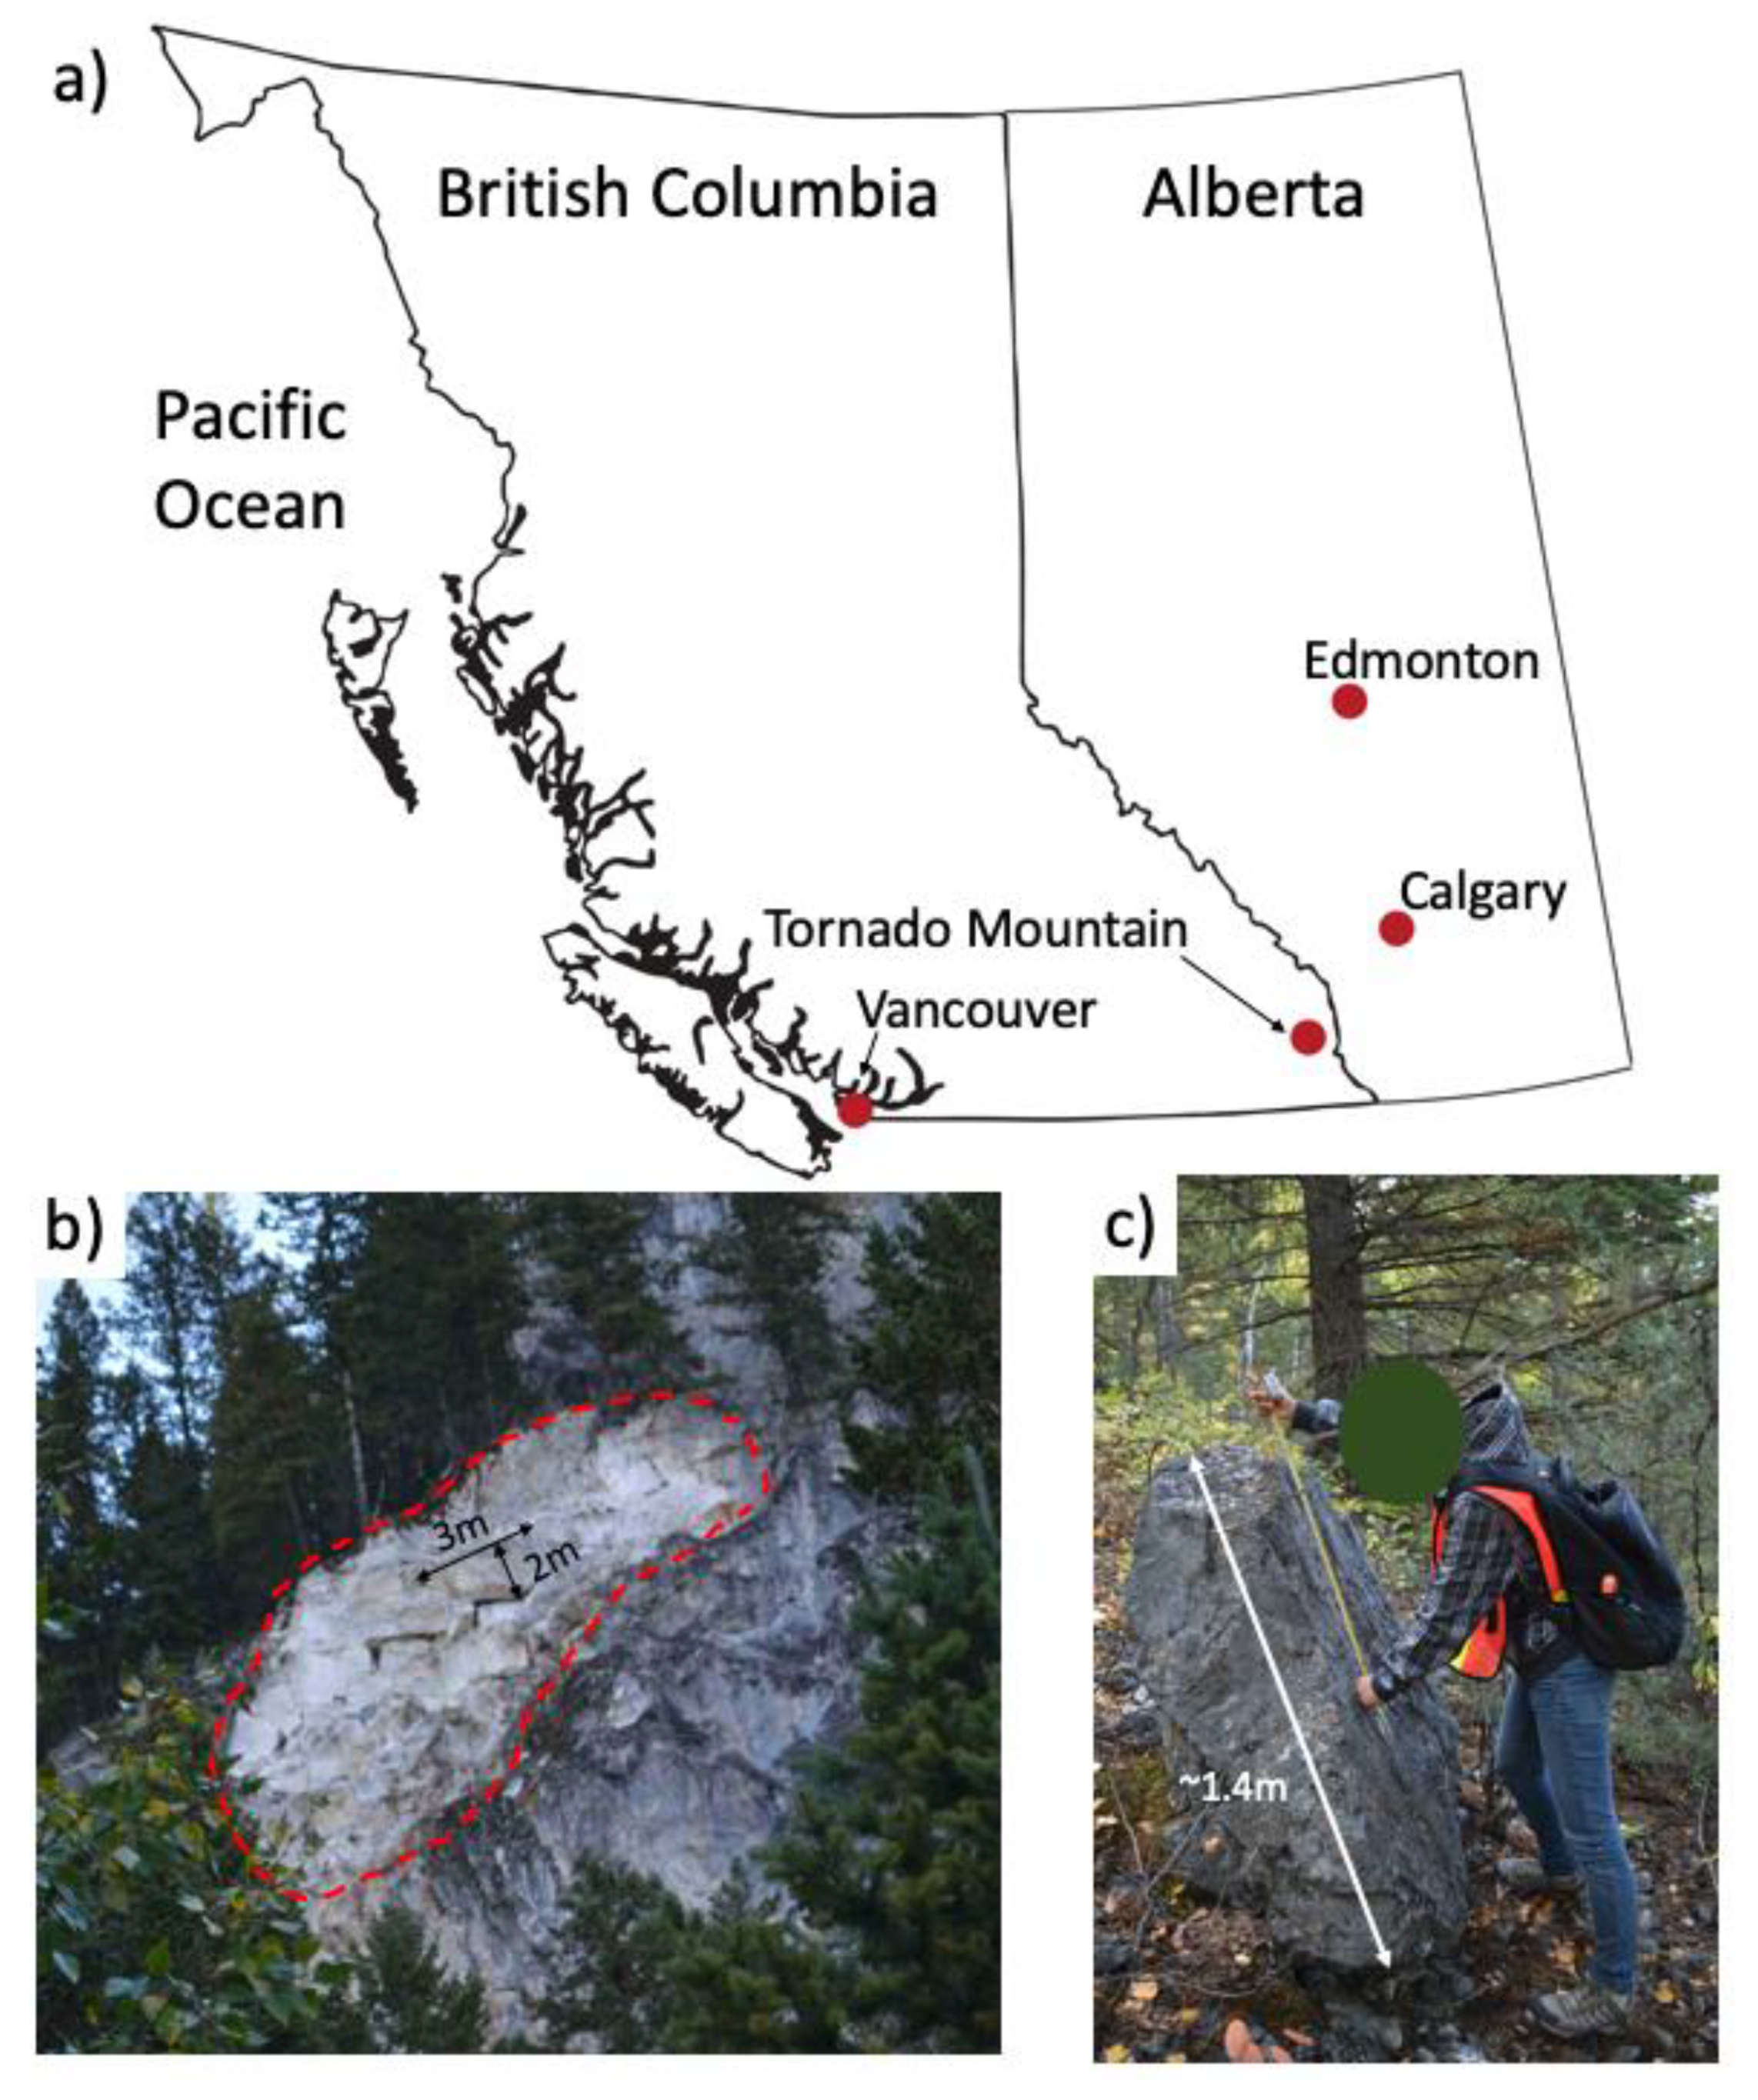
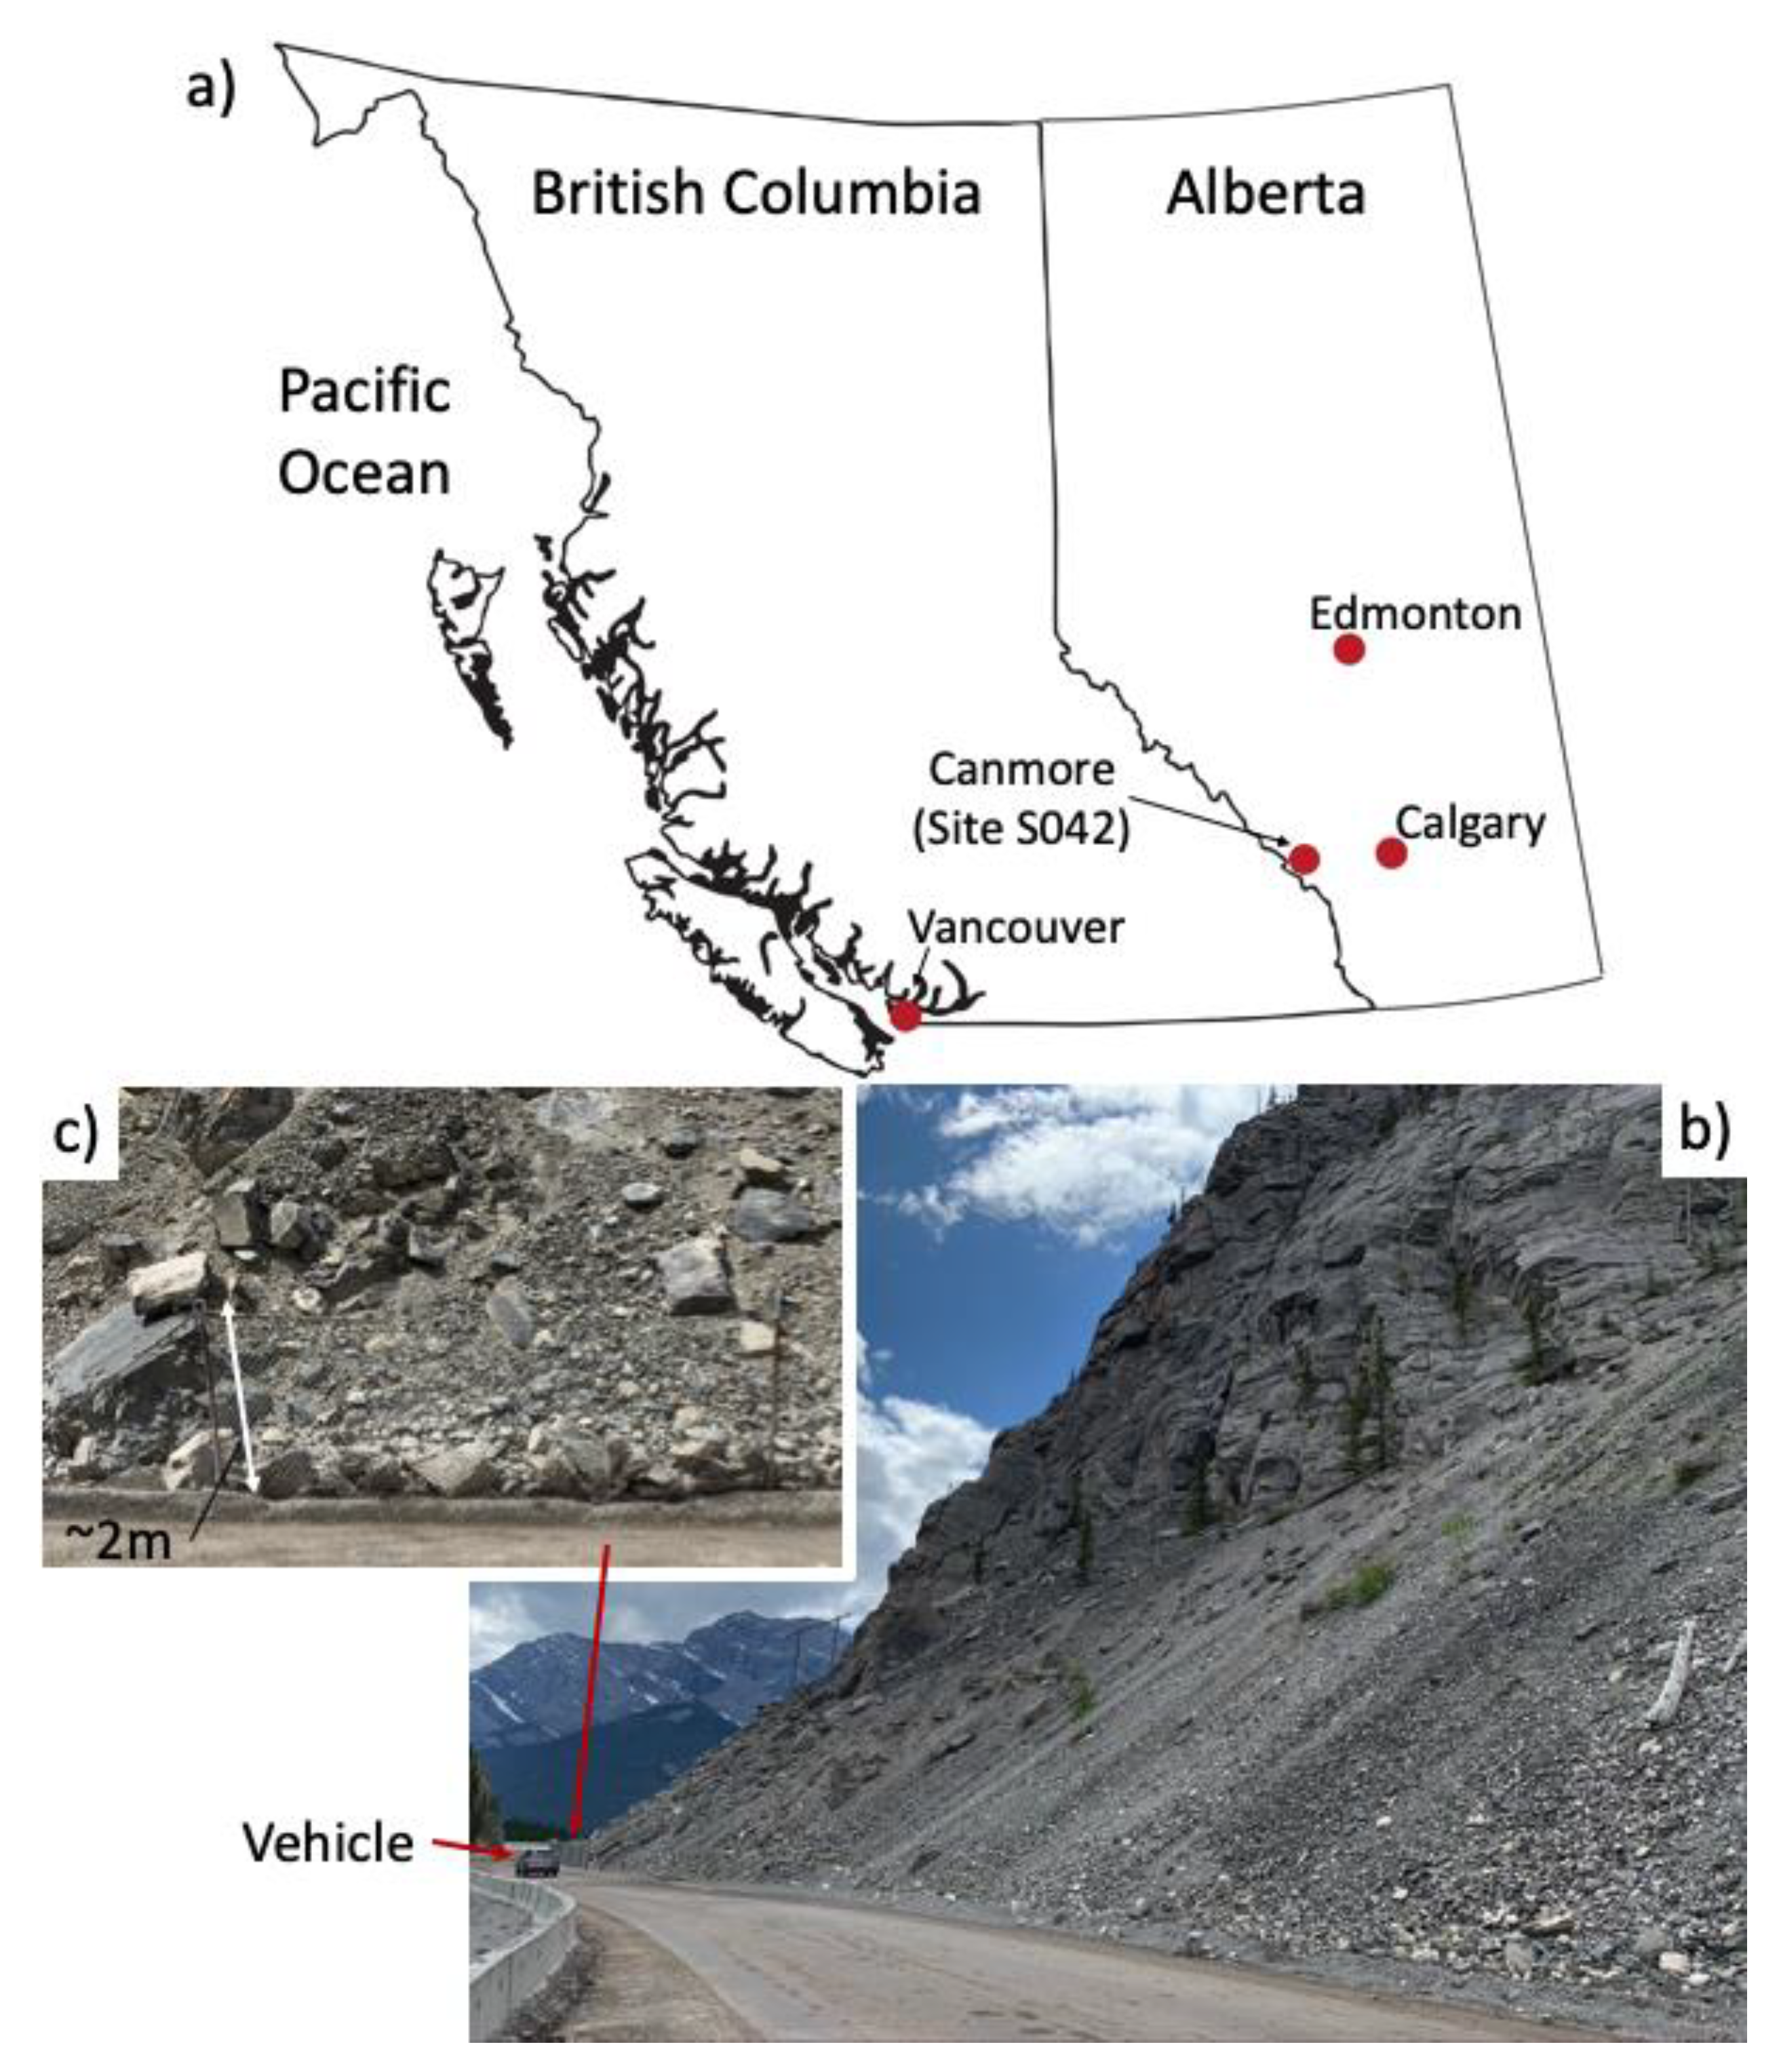
The persistent DFN defines discrete blocks. Blocks adjacent to the limits of the DFN block are considered truncated and can be flagged for elimination during volume distribution calculations. Volume calculation was performed by numerical integration. The DFN block is discretized in a 20 cm mesh (discrete unit volume of 8 × 10⁻³ m3), and each mesh unit is assigned a code that corresponds to the joints defining the rock block in which the mesh unit is located. This renders discrete mesh units with unique identifiers that are shared only by mesh units within a same rock block. Adding mesh units with the same identifier and multiplying by the discrete volume (8 × 10⁻³ m3) provides a distribution of DFN block volumes.
In this study, the distribution of DFN block volumes was compared against the surveyed volumes of fragmented rockfalls to evaluate the applicability of the method.

3. Study Sites

3.1. Tornado Mountain

The study site at Tornado Mountain is located approximately 20 km north of the town of Sparwood, near the provincial boundary between Alberta and British Columbia, Canada (Figure 2a). The area is characterized by a wide glacially carved valley with vegetated slopes (mostly pine trees) transitioning to steep rock faces. The lithology in the study site comprises mostly strong, blocky limestone [18,35].
CP owns and operates a railway line in the vicinity of the study site, approximately 500 m downslope from an active rockfall source. The rockfall source was identified after a rockfall event reached the section of railway, coming to a stop a few meters downslope from the tracks in 2004. In this event, two rockfalls travelled approximately 600 m horizontally and 350 m vertically. These rock falls had maximum dimensions of 1.6 and 2.5 m, with masses of about 3750 kg and 5600 kg, respectively [18,35]. The source of these rockfalls is shown in Figure 2b. Figure 2c shows one block, typical of those encountered along the trajectory of rockfalls originating from this source.
The method to calculate fragmented rock volumes presented in this paper was developed originally for the Tornado Mountain Site. The method proved to deliver adequate approximations of the fragmented rockfall distribution [35]. Verification was done through direct comparison of the DFN block volume distribution against the blocks surveyed (manual measurements) on site. These results are presented in the following sections.

3.2. Site S042

Site S042 is located on Alberta Highway 742 (Spray Lake Trail) approximately 5 km southwest of Canmore, Alberta, Canada (Figure 3a). This site is known for its rockfall activity and was selected to further validate the method as applied to strong rocks, particularly blocky limestones. This site is monitored and managed by AT as part of the department’s Geohazard Risk Management Program (GRMP). This site was selected due to the availability of information which had been gathered to inform rockfall mitigation strategies [20].
Figure 3b shows a view of the Site S042 rock slope looking towards the southwest direction. This figure shows the loose talus slope that extends from the edge of the gravel highway (there is no ditch) at approximately 40° to a near vertical rock cliff face approximately 80 m high [20]. The rock face mainly consists of limestones. Figure 3b also shows a vehicle and the location of a 2 m high fence (detail in Figure 3c) for scale. The rock slope is generally oriented in the southeast direction.
The site is an active rockfall area that requires frequent road maintenance, consisting mainly of the removal of rock blocks of 30 cm (maximum block dimension) or smaller. However, signs of activity associated with larger rockfalls are evidenced by the rock blocks embedded in the talus slope and blocks captured by a 150 m long, 2 m high fence along part of the toe of the talus slope (Figure 3c). A rockfall event occurred in 2013, where several large blocks (estimated between 1 and 10 m3) detached from the slope and landed adjacent to the highway. This event triggered an assessment of the site for the design of rockfall protection and mitigation strategies that included fallen block surveys, rock slope inspections for loose blocks, and initiating scheduled inspections to evaluate the need for scaling and removal of debris.

4. Results

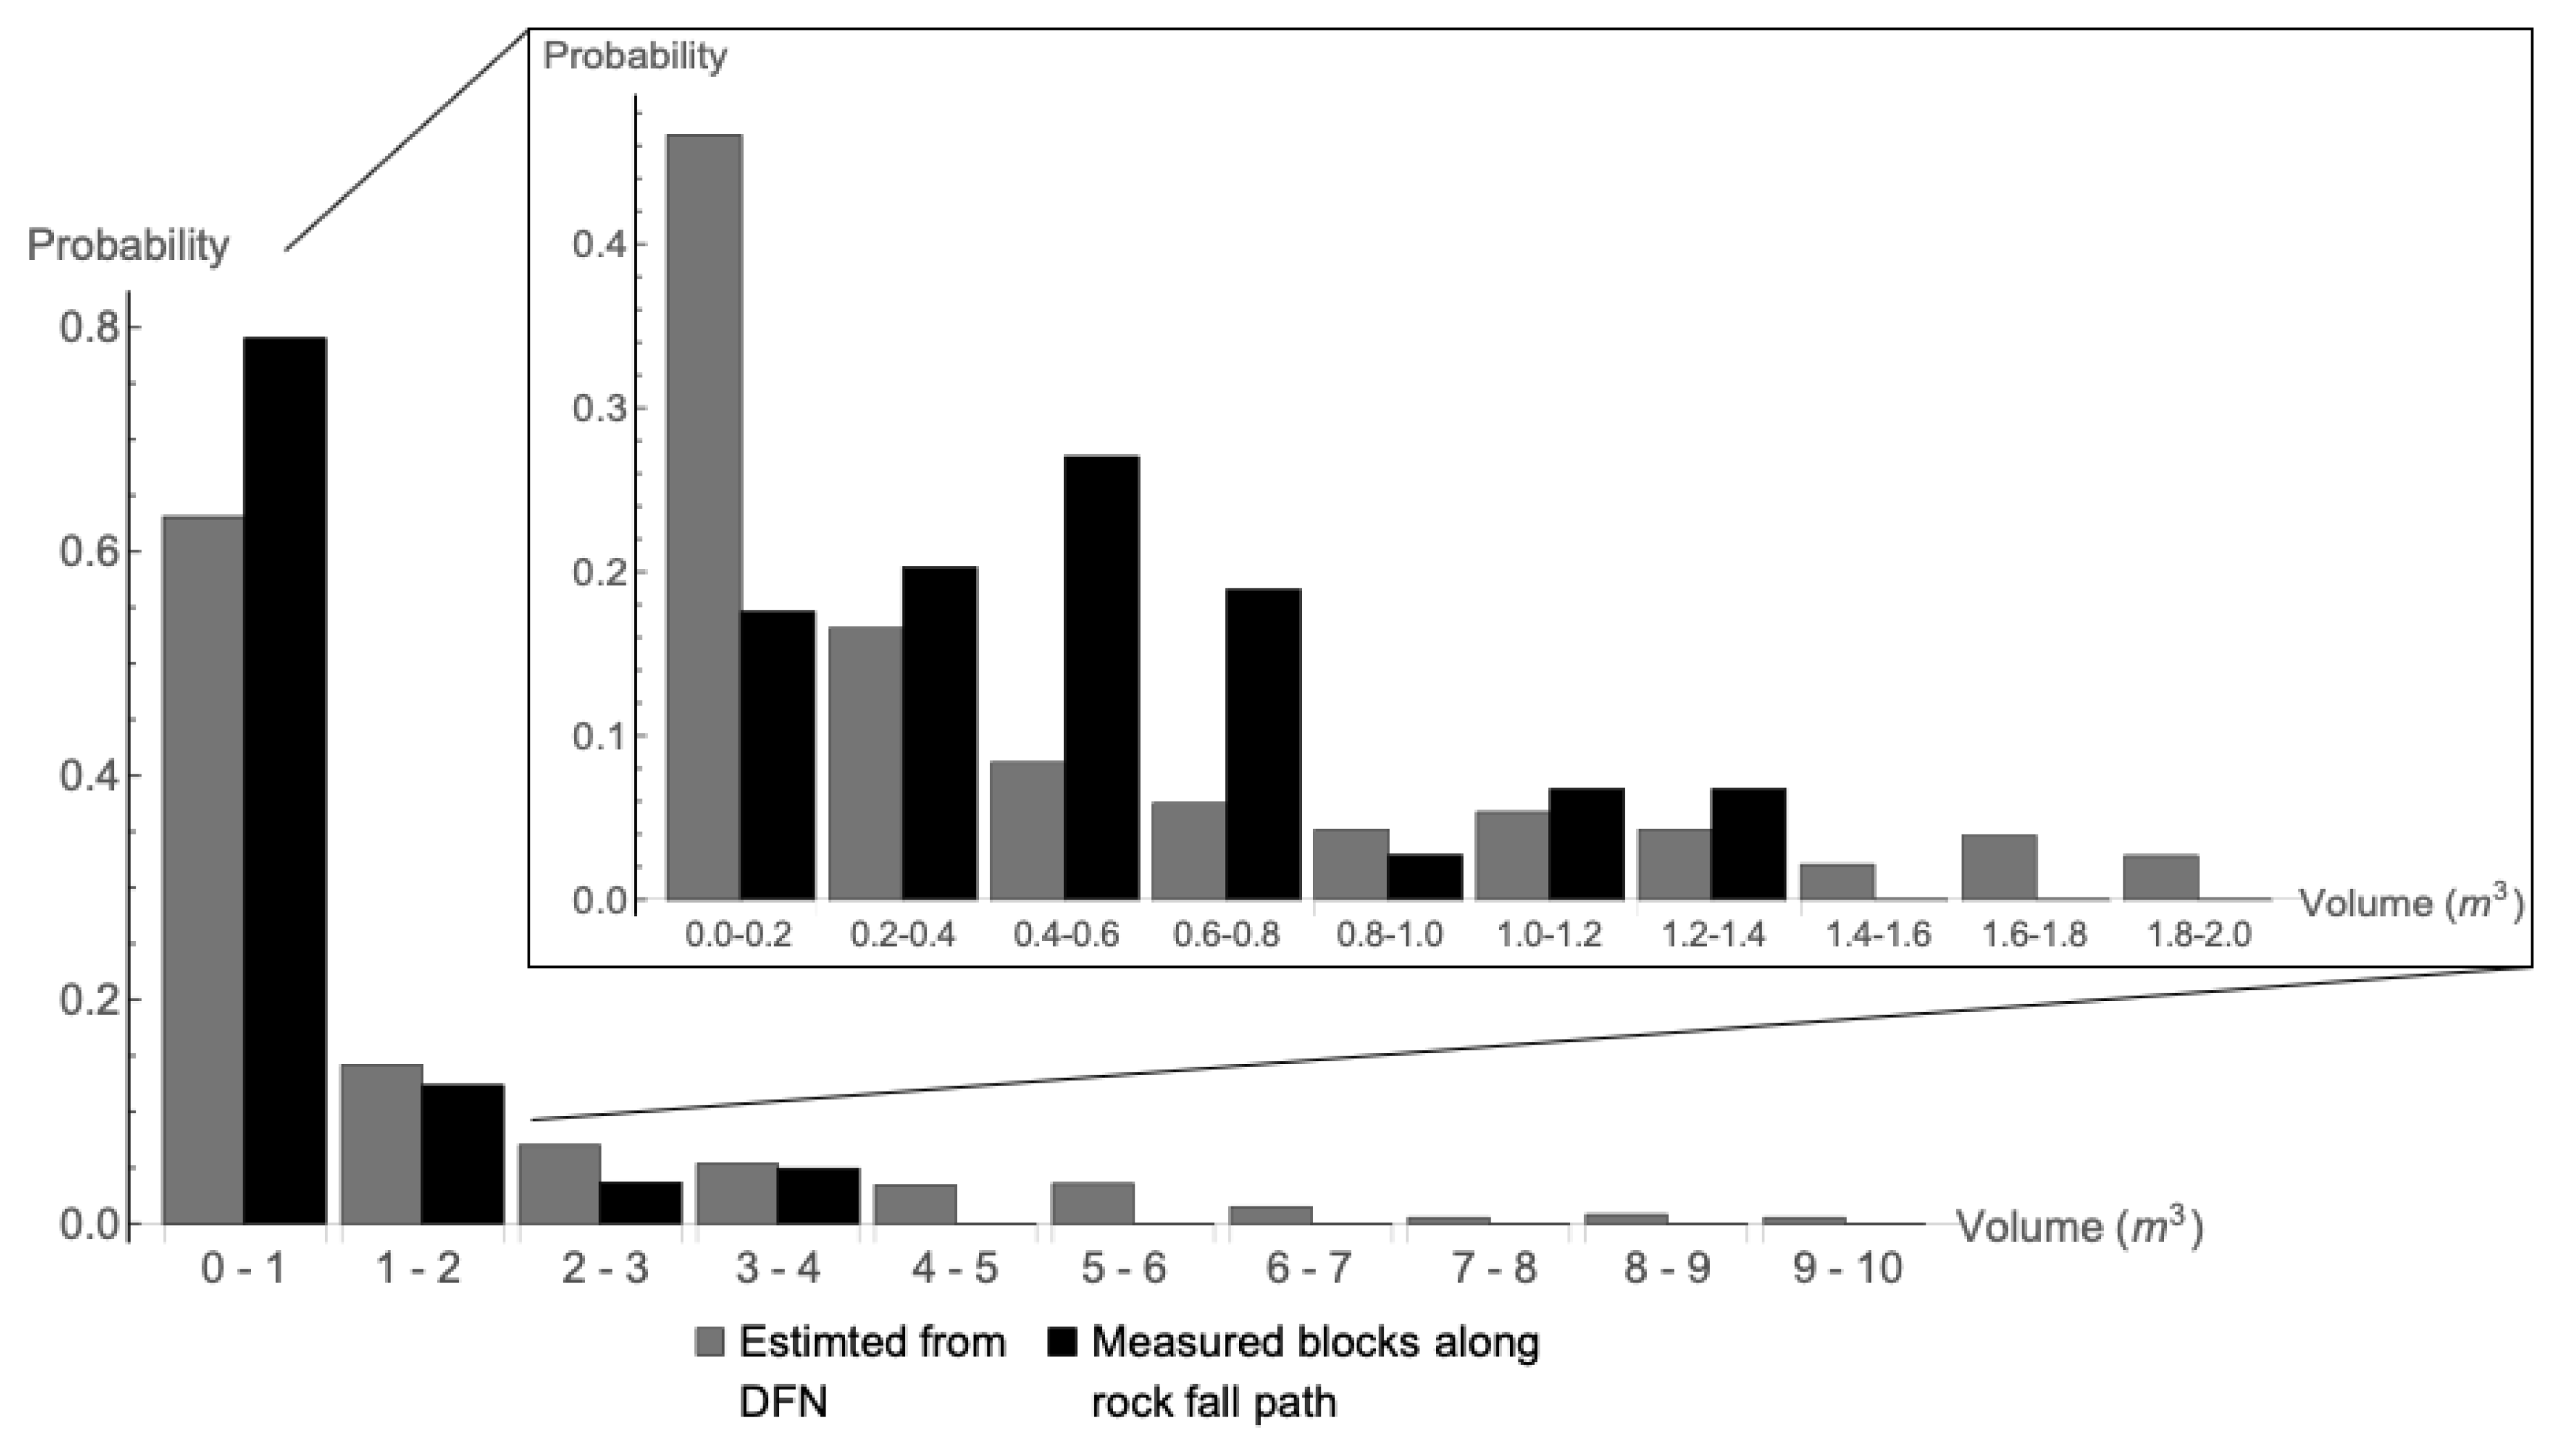
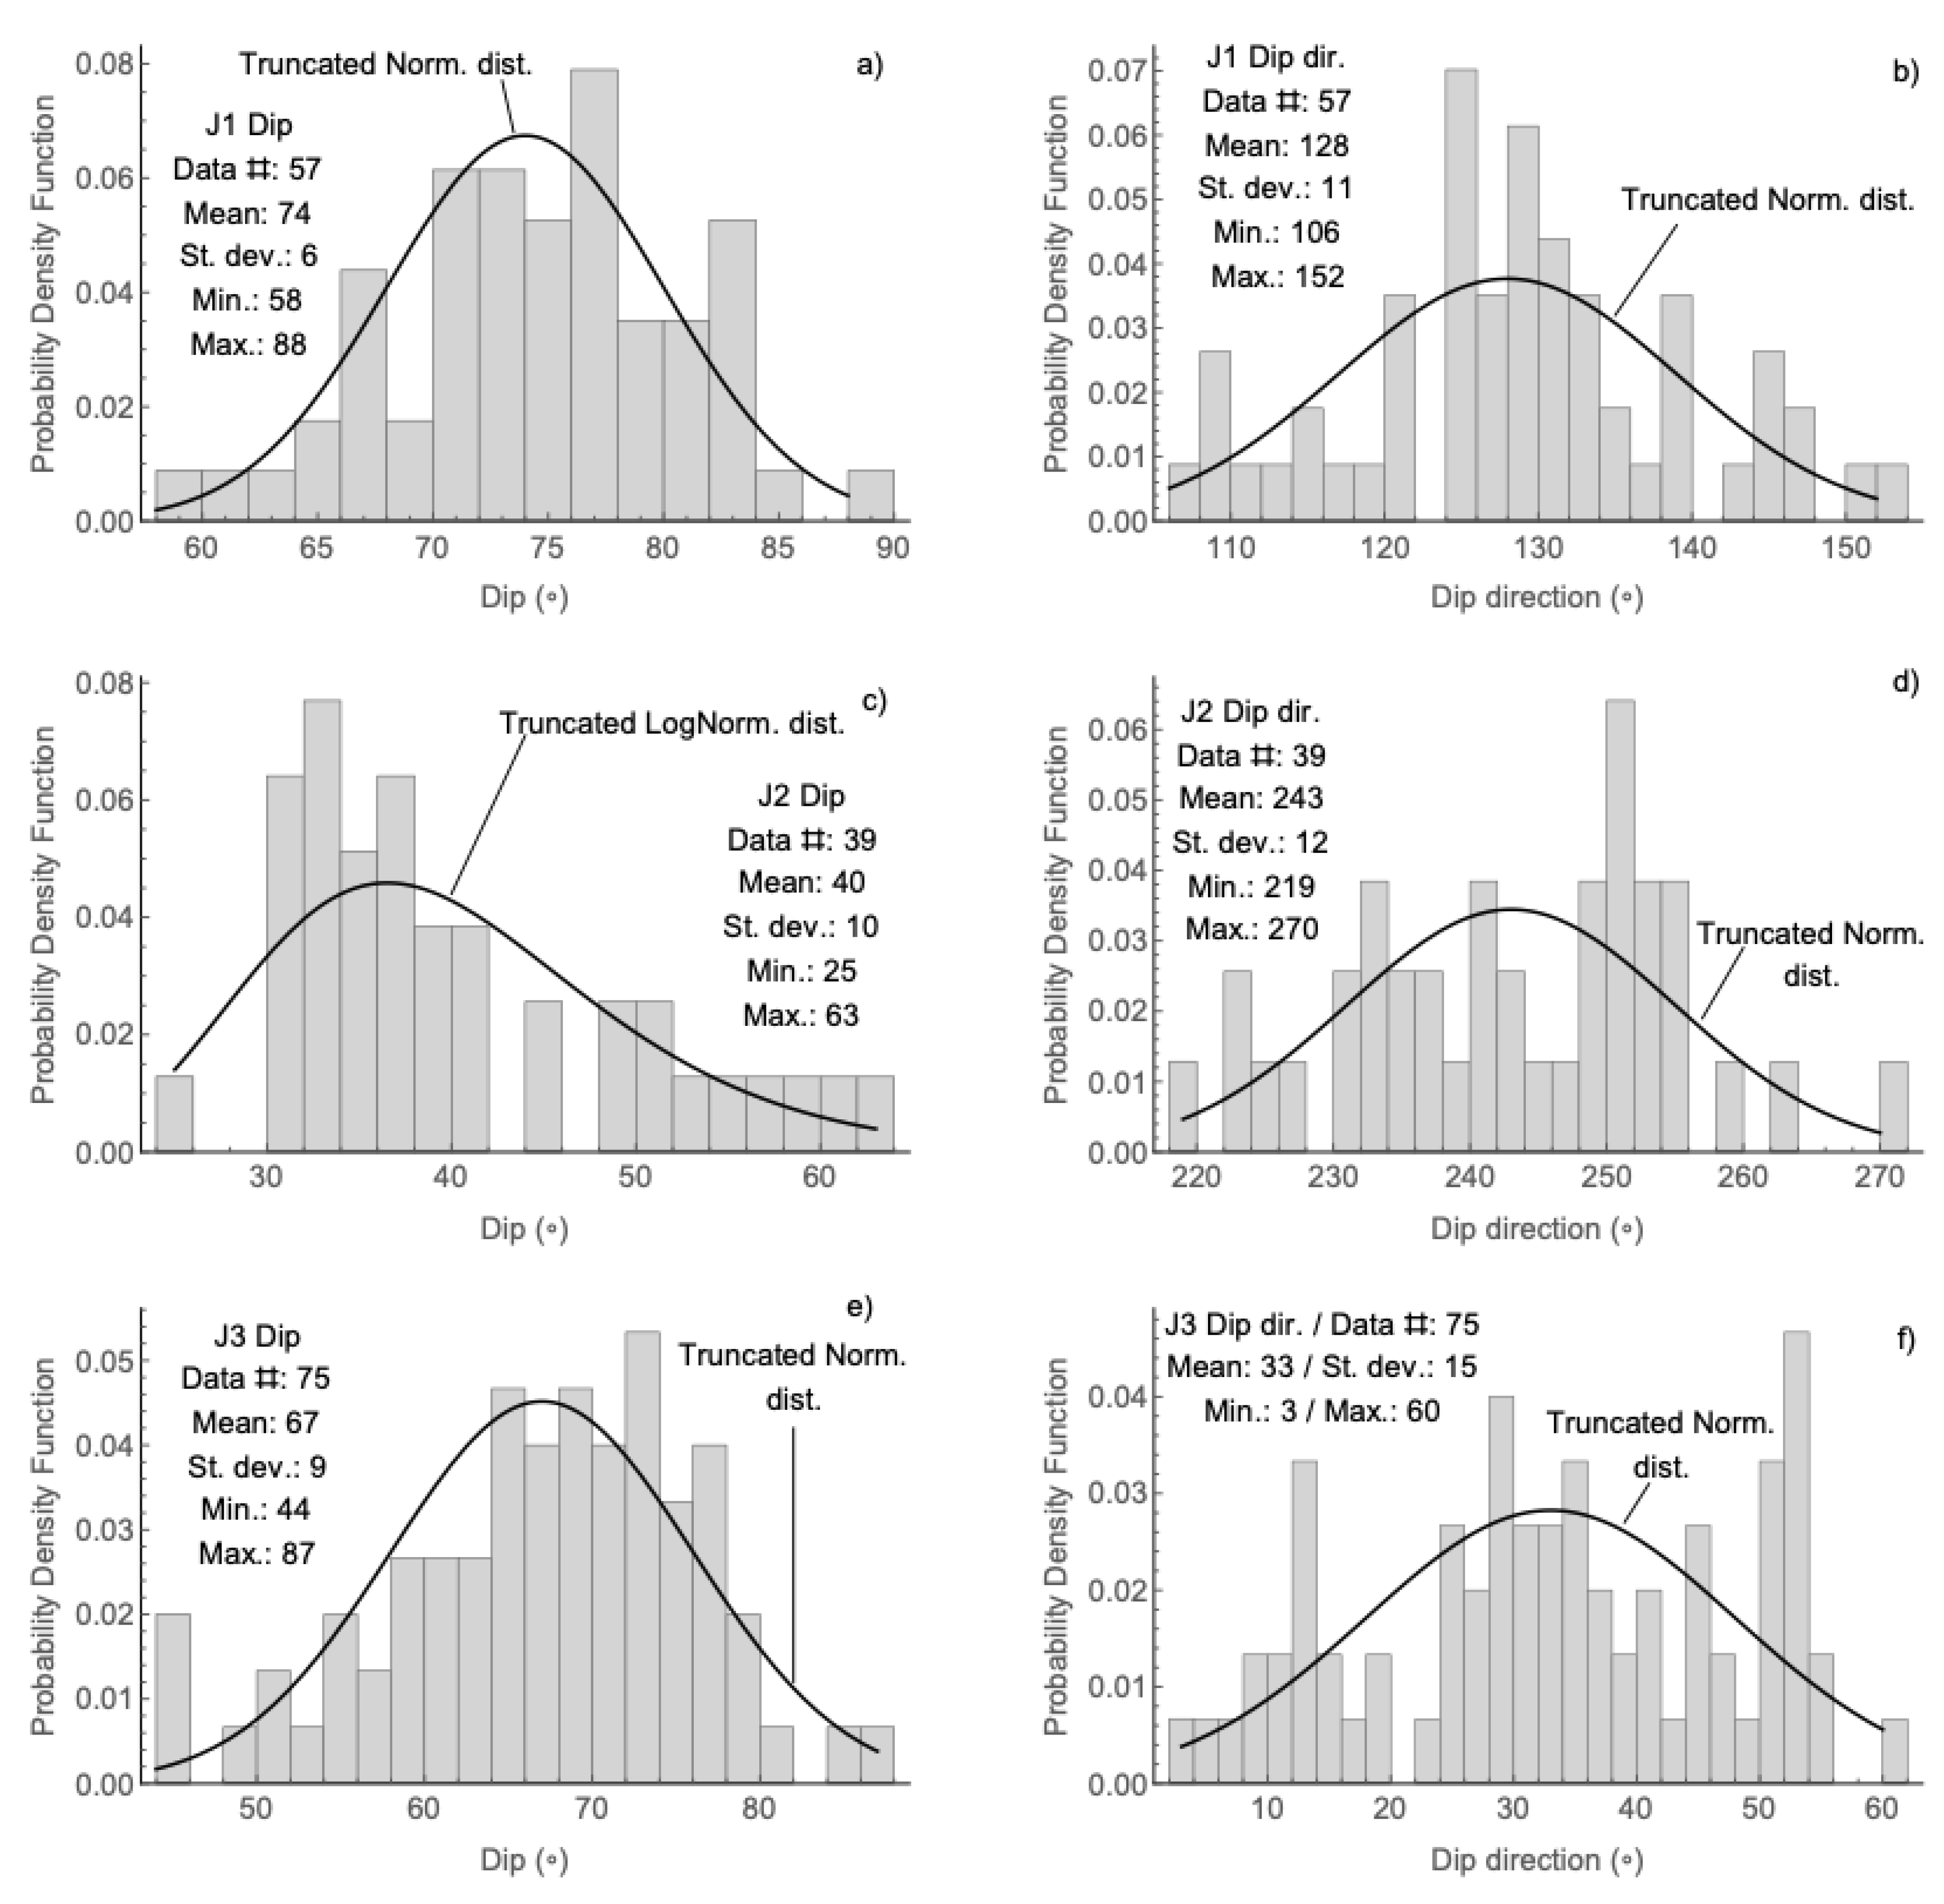
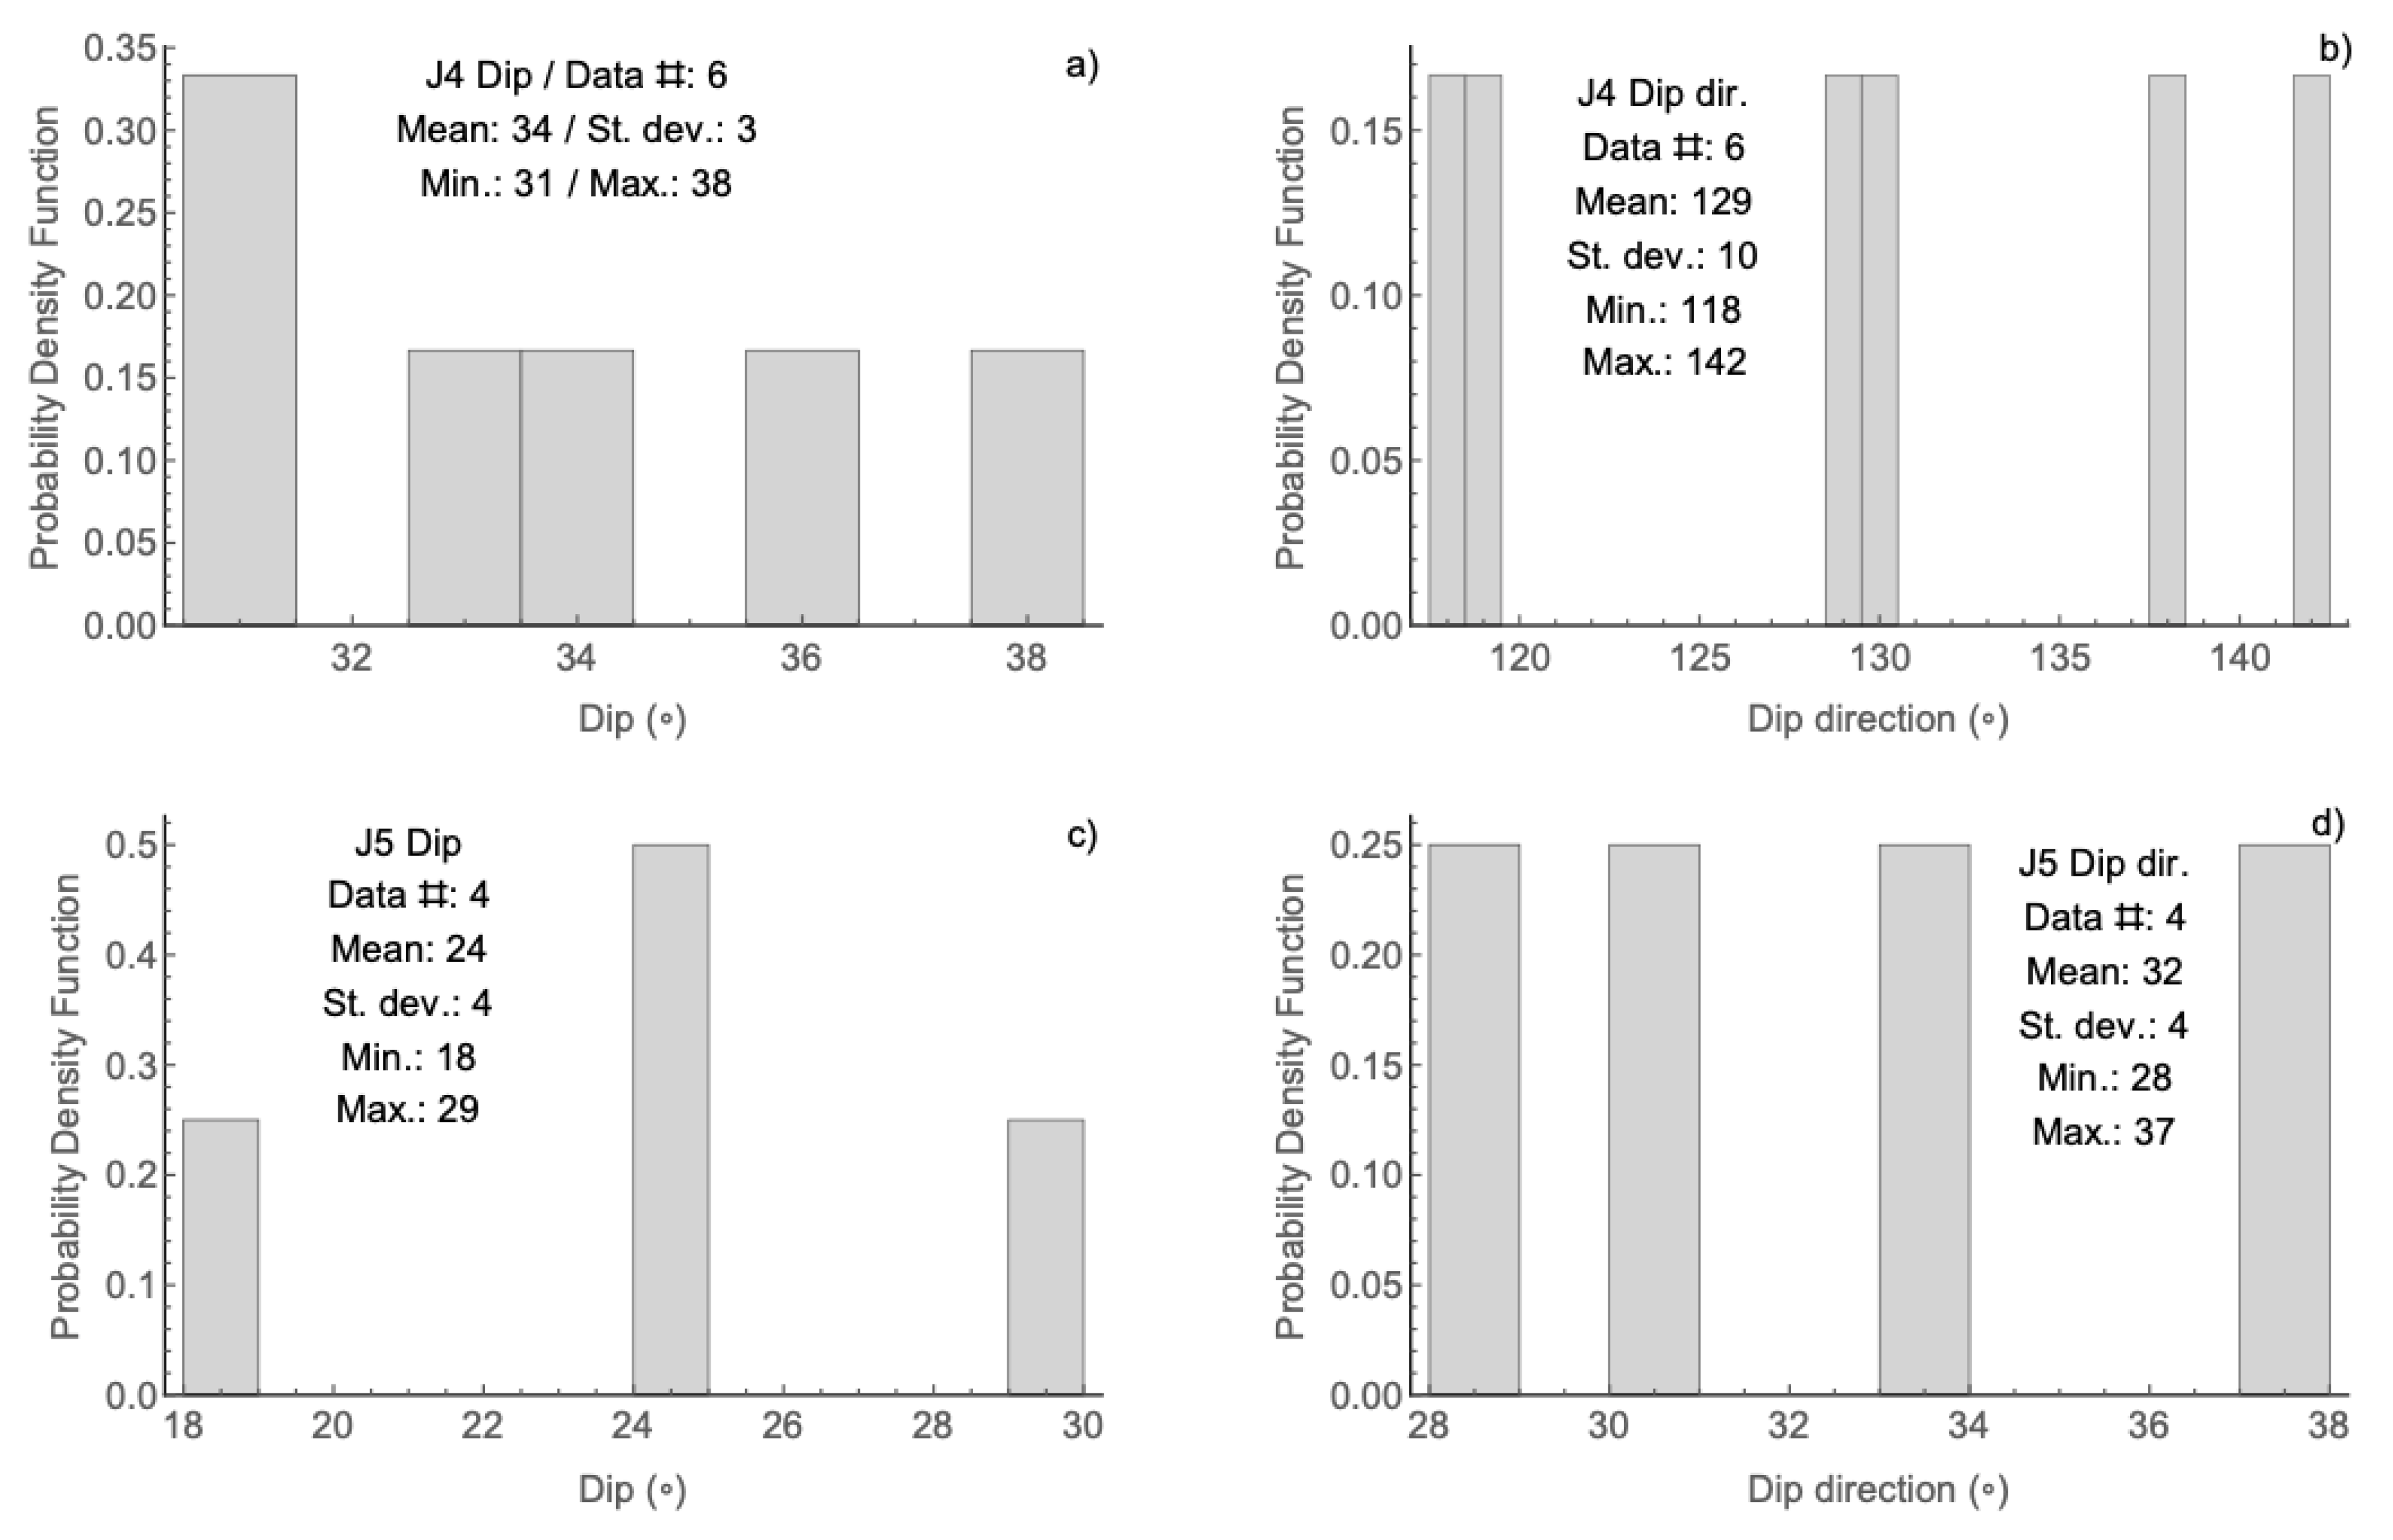
4.1. Tornado Mountain

The method applied at the Tornado Mountain site is described in [35]. Virtually mapped discontinuity density contours in a stereographic projection (Figure 4a) were used to define four sets of discontinuities. This set definition was adopted to virtually measure relative spacing between joints and find their range (Figure 4b). The work in [35] did not provide a detailed orientation distribution fit; it was rather assumed that the randomness encountered in measurements was better represented through a uniform distribution within the ranges of values measured, with a triangular distribution used for measured spacing. This corresponded to the limited number of measurements given the small rockfall source area mapped, and arguably introduced bias related to an expected normality of the measured data. The structural mapping results are detailed in Table 1.
One iteration of the 10 m × 10 m × 10 m persistent DFN build based on the distributions in Table 1 is shown in Figure 5a. This figure shows the persistent DFN that defines the virtual rock blocks as closed volumes. The 10 m × 10 m × 10 m volume discretization into 8 × 10⁻³ m3 units is superimposed to the DFN. These units are color coded according to the DFN blocks, shown in Figure 5b. The colors are selected randomly and with the only purpose of visualization. The realizations resulted in 941 blocks. The distribution of volumes for these blocks compared against the 81 block volumes surveyed at the site is shown in Figure 6. This figure presents the volume distributions in 1 m3 intervals and in 0.2 m3 intervals. The average and maximum differences (in probability 0–1) between the DFN prediction and observations were 0.03 and 0.16, when volumes are discretized in 1 m3 intervals, and 0.08 and 0.29 when discretized in 0.2 m3 intervals.
It is common that rockfall volume-frequency distributions are presented as plots of volume (horizontal axis) vs. cumulative frequency of rockfalls equal to or larger than the specified volume increments (vertical horizontal axis). Figure 7a shows the fragmented rockfall volume cumulative relative distribution as calculated by the persistent DFN method and field surveys. The correlation between calculated volumes and surveyed volumes appears adequate as a first approximation for engineering purposes, based on the correlation between histograms (Figure 6). The cumulative distributions quickly deviate (Figure 7a), however, with the DFN method overestimating the volumes for a given relative frequency when compared to the measured observations. However, relative cumulative frequency distributions, such as those in Figure 7, depend on the number of blocks surveyed and the range of volumes surveyed, and therefore have a strong potential for bias. Figure 7b shows the fragmented rockfall volume cumulative relative frequency distribution as calculated by the persistent DFN method and field surveys, but truncating the DFN blocks to the range of blocks observed by the surveys. Overestimation of the DFN volumes is still observed, but the DFN predictions are significantly closer to observations.

4.2. Site S042

Orientation data from virtual discontinuity mapping was provided in [43]. Orientation data was plotted in a stereographic projection as shown in Figure 8. The density contours were used to manually define five joint sets (J1 through J5 in Figure 8). The projection is an Equal Area projection consisting of 207 discontinuity entries. Discontinuity J1 was the most well defined (clear clustering—see Figure 8 in red contours) followed by discontinuities J2 and J3. Discontinuities J4 and J5 were not as well defined, probably due to the low frequency of their traces.
Histograms of joint set orientation (dip and dip direction) are shown in Figure 9 for joint sets J1 through J3. These histograms correspond to the probability densities for each bin (bins are 2° wide). As opposed to the Tornado Mountain case study, PDFs for the orientations have been defined based on the statistical descriptors of the data (mean and standard deviation), truncated at the observed minimum and maximum measurements, and assuming the normality observed for large datasets of discontinuity orientations in [41]. The dip measurements of J2 were fitted to a lognormal distribution to better represent the shape of the data. The distributions were truncated at the maximum and minimum values to avoid unrealistic values at the tails of the distributions. The distributions adopted, as well as their mean, standard deviation, and minimum and maximum values, are presented in Figure 9. The probability values from the Pearson’s χ2 tests for goodness of fit are shown in Table 2. These probabilities are all significantly higher than the critical value adopted (0.05); therefore, it is highly probable that the distributions are an adequate representation of the true orientation distributions.
The histograms for joint sets J4 and J5 are shown in Figure 10. The number of measurements obtained for J4 and J5 were 6 and 4, respectively. These two joint sets were not considered for the method any further due to their low frequency.
Range of spacing values for joint set J1 through J3 are reported in [43] and shown in Table 3. Unfortunately, detailed measurements are not reported and only the minimum, maximum and mean values were available. This study adopted triangular distributions for the spacing between the minimum and maximum values reported and with modes equal to the mean values reported. This last decision was made to try and capture any skewness in the data reflected by the mean values.
One iteration of the 10 m × 10 m × 10 m persistent DFN built based on the distributions in Table 2 and Table 3 is shown in Figure 11a. The blocks defined by this DFN are shown in Figure 11b, randomly colorized. The realizations resulted in 6077 blocks. The distribution of volumes for these blocks compared against the 82 block volumes surveyed at the site is shown in Figure 12. This figure presents the volume distributions in 0.5 m3 intervals and in 0.025 m3 intervals. The average and maximum differences (in probability 0–1) between the DFN prediction and observations were 0.02 and 0.09 when volumes are discretized in 0.5 m3 intervals, and 0.05 and 0.25 when discretized in 0.025 m3 intervals.
Figure 13a shows the fragmented rockfall volume cumulative relative distribution as calculated by the persistent DFN method and field surveys. Similar to the Tornado Mountain case study, the correlation between calculated volumes and surveyed volumes appears adequate as a first approximation for engineering purposes, based on the correlations between histograms (Figure 12), but the cumulative distributions quickly deviate in Figure 13a. The DFN method overestimates the volumes for a given relative frequency when compared to observations. As mentioned previously, relative cumulative frequencies such as those in Figure 13 can be biased by the number of observations and ranges of volumes observed. Figure 13b shows the fragmented rockfall volume cumulative relative distribution as calculated by the persistent DFN method and field surveys, but truncating the DFN blocks to the range of blocks observed by the surveys. Overestimation of the DFN volumes is still evident; however, the DFN prediction is significantly closer to the observations.

5. Discussion and Conclusions

Quantifying rockfall hazard and risk, as well as the design of rockfall mitigation structures, require information about the falling block volumes (and mass) and their fragmentation during motion. Information on rockfall volumes and fragmentation can be gathered from comprehensive records or through surveying fallen blocks along known rockfall trajectories. However, these methods present challenges where rockfall records are scarce and surveys are not feasible. Rockfall trajectory models in recent years have successfully represented the fragmentation of rockfalls, matching the volume distribution along the rockfall path. This is an important step forward for enhanced rockfall hazard assessments and protection design; however, input information about the fragmented rockfall distribution is still required. A method to estimate fragmented rockfall volume distributions, and fragmented volume–frequency relationships, is therefore needed at locations where rockfall records are scarce or non-existent.
This paper presents a method to estimate the fragmented rockfall volume–frequency distribution (relative frequency) in the absence of rockfall records or fallen block surveys. The method takes advantage of photogrammetric techniques to build 3-dimensional surface models of rockfall sources for virtual structural mapping of discontinuities. DFN realizations are developed based on the mathematical representation of structure orientation and spacing variability. The DFN’s assume fully persistent discontinuities to define discrete blocks. The volumes of these blocks are used to calculate the DFN fragmented rockfall volume–frequency distribution. This method is based on the hypothesis that fragmentation in strong rocks (Strong to Extremely Strong rocks characterized by Unconfined Compressive Strengths over 50 MPa) will tend to occur through weak planes and by growth of non-persistent discontinuities as the in situ blocks detach, fall, bounce, and roll. This implies that other breakage mechanisms in strong rocks (e.g., breakage of intact rock bridges due to high-energy impacts and abrasion) would have less influence on the fragmented volume distribution of rockfalls, and can be neglected for the purpose of dimensioning rockfall protection structures.
The method is tested in this paper at two limestone rock cliffs in the Canadian Cordillera, the Tornado Mountain site and Site S042. The photogrammetry and virtual structural mapping information is representative of the information that is typically available for practical engineering applications. The information available required input of expert judgment when building some of the PDF’s to represent the structure orientation and spacing. This included the limited number of observations of dip, dip direction, and spacing for some of the discontinuities, which required selecting shapes for the PDF’s based on previous experience. Although this introduces a source of bias, it provided for testing the method under practical constraints commonly encountered in engineering applications.
Fragmented rockfall volume distributions obtained through DFN realizations were compared against blocks surveyed along the known rockfall trajectories and toe of talus slopes. These comparisons were made at two scales (in histograms) and provided good approximations, with average errors between 0.02 and 0.08 (probability) and maximum errors between 0.16 and 0.29. These results suggest that the hypothesis that fragmentation in strong rocks will tend to occur through weak planes and by growth of non-persistent discontinuities is an adequate approximation. A statistical evaluation of the hypothesis would require validation at additional locations.
Comparison of volume-cumulative relative frequencies between DFN calculated volumes and measured observations highlighted how the number of blocks surveyed and the limited observation period can bias the representation of these relationships. This is a consequence of anchoring the relative distribution to the pair (lowest volume: 1.0). Therefore, the frequency of other volumes being exceeded depends on how many blocks are surveyed and the volumes of the largest blocks. The DFN generated volume-cumulative relative frequencies differed significantly from observations when all volumes generated were considered. However, their similarity increased significantly when the DFN generated volumes were truncated at the highest measured volume. This finding can be interpreted as the DFN generated volumes overestimating the volume of the least frequent blocks, and that for the largest blocks, fragmentation in the absence of weak planes or non-persistent discontinuities have a significant effect. However, it is also possible that this discrepancy is caused by observation bias, where the likelihood of larger blocks predicted by the DFN is so small (very small frequency), that these events were simply not observed during the discrete observation periods. As an example, the large rockfall event in 2013 at Site S042 supports the potential for large fragmented blocks as identified by the DFN prediction. There is also a potential for undocumented rock fall events that may have occurred prior to the establishment of AT’s GRMP in 1999. These may also increase the number of actual large block volumes.
The volume-cumulative relative frequencies derived from persistent DFN’s are very similar to observations when block volumes are truncated to the largest observed volumes, however some overprediction occurs in both case studies. At the Tornado Mountain site, the findings indicate, for example, that 90% of blocks are smaller than approximately 3 m3 and 1.5 m3 for the DFN prediction and observations, respectively; however, both the DFN predictions and the observations indicate that 95% of blocks are smaller than approximately 3.3 m3. At Site S042, 90% of blocks are smaller than approximately 0.24 m3 and 0.14 m3 for the DFN prediction and observations, respectively; however, both the DFN predictions and the observations indicate that 99% of blocks are smaller than approximately 0.35 m3. It is possible that these overpredictions are a result of neglecting breakage of blocks not associated with weak planes or non-persistent discontinuities, such as breakage of intact rock bridges at impact, abrasion during rolling and in situ effects of weathering (e.g., freeze–thaw effects).
In the absence of fragmented rockfall databases or observations, application of the method requires truncating the maximum DFN predicted volumes based on judgment about their likelihood according to measurements and observations at the rockfall source, any observed fragmented blocks associated with sources in the vicinity, previous experience, and design life of proposed mitigation measures (e.g., are we designing for rockfalls with a return period of 1 in every 100, 1000, or 10,000 years?).
Further investigation into the method could aim at confirming the trend in DFN overpredictions with other case studies in similar rock materials, such that observation bias is reduced, and develop statistical volume correction factors that could account for block fragmentation not associated with weak planes or non-persistent discontinuities. Furthermore, the method needs to be tested at rockfall sources with different lithological units to evaluate its applicability.

Author Contributions

Conceptualization, R.M.; Data curation, C.G. and R.S.; Formal analysis, R.M.; Investigation, R.M.; Methodology, R.M.; Validation, C.G. and R.S.; Writing—original draft, R.M. and C.G.; Writing—review and editing, R.S. All authors have read and agreed to the published version of the manuscript.

Funding

This research was funded by the Natural Sciences and Engineering Research Council of Canada (NSERC) and Klohn Crippen Berger Ltd. through a Collaborative Research and Development Grant (CRD) (CRDPJ543429-19).

Acknowledgments

The authors would like to acknowledge Alberta Transportation and Klohn Crippen Berger for facilitating the logistics to acquire field data at Site S042; and Canadian Pacific Railway for facilitating the logistics to acquire field data at Tornado Mountain. Special thanks to Kristen Tappenden (Alberta Transportation) for her review of the manuscript and James Lyons (Klohn Crippen Berger) for his support during the field surveys at Site S042.

Conflicts of Interest

The authors declare no conflict of interest.

References

  1. Heim, A. Bergsturz und Menschenleben; Zürich Fretz and Wasmuth Verlag: Bern, Switzerland, 1932. [Google Scholar]
  2. Ladd, G.E. Landslides, subsidences and rock-falls: As problems for the railroad engineer. In American Railway Engineering Association Proceedings; AREA: Chicago, IL, USA, 1935. [Google Scholar]
  3. B, G.B.; Sharpe, C.F.S. Landslides and Related Phenomena: A Study of Mass-Movements of Soil and Rock. Geogr. J. 1938, 92, 276. [Google Scholar] [CrossRef]
  4. Grove, J.M. The Incidence of Landslides, Avalanches, and Floods in Western Norway during the Little Ice Age. Arct. Alp. Res. 1972, 4, 131. [Google Scholar] [CrossRef]
  5. Peckover, F.L.; Kerr, J.W.G. Treatment and maintenance of rock slopes on transportation routes. Can. Geotech. J. 1977, 14, 487–507. [Google Scholar] [CrossRef]
  6. Evans, S.; Hungr, O. The assessment of rockfall hazard at the base of talus slopes. Can. Geotech. J. 1993, 30, 620–636. [Google Scholar] [CrossRef]
  7. Dorren, L.K.A. A review of rock fall mechanics and modeling approaches. Prog. Phys. Geogr. 2003, 27, 69–87. [Google Scholar] [CrossRef]
  8. Guzzetti, F.; Reichenbach, P.; Ghigi, S. Rockfall Hazard and Risk Assessment Along a Transportation Corridor in the Nera Valley, Central Italy. Environ. Manag. 2004, 34, 191–208. [Google Scholar] [CrossRef] [PubMed]
  9. Hungr, O.; Evans, S.G.; Hazzard, J. Magnitude and frequency of rock falls and rock slides along the main transportation corridors of southwestern British Columbia. Can. Geotech. J. 1999, 36, 224–238. [Google Scholar] [CrossRef]
  10. Leroi, E. Global rockfalls risk management process in ‘La Désirade‘ Island (French West Indies). Landslides 2005, 2, 358–365. [Google Scholar] [CrossRef]
  11. Bunce, C.M.; Cruden, D.M.; Morgenstern, N.R. Assessment of the hazard from rock fall on a highway. Can. Geotech. J. 1997, 34, 344–356. [Google Scholar] [CrossRef]
  12. Baillifard, F.; Jaboyedoff, M.; Sartori, M. Rockfall hazard mapping along a mountainous road in Switzeland using a GIS-based parameter rating approach. Nat. Hazards Earth Syst. Sci. 2003, 3, 431–438. [Google Scholar] [CrossRef]
  13. Corominas, J.; Copons, R.; Moya, J.; Vilaplana, J.M.; Altimir, J.; Amigó, J. Quantitative assessment of the residual risk in a rockfall protected area. Landslides 2005, 2, 343–357. [Google Scholar] [CrossRef]
  14. Frattini, P.; Crosta, G.; Carrara, A.; Agliardi, F. Assessment of rockfall susceptibility by integrating statistical and physically-based approaches. Geomorphology 2008, 94, 419–437. [Google Scholar] [CrossRef]
  15. Lan, H.; Martin, C.D.; Zhou, C.; Lim, C.H. Rockfall hazard analysis using LiDAR and spatial modeling. Geomorphology 2010, 118, 213–223. [Google Scholar] [CrossRef]
  16. Macciotta, R.; Martin, C.D.; Morgenstern, N.R.; Cruden, D.M. Quantitative risk assessment of slope hazards along a section of railway in the Canadian Cordillera—a methodology considering the uncertainty in the results. Landslides 2015, 13, 115–127. [Google Scholar] [CrossRef]
  17. Macciotta, R.; Martin, C.D.; Cruden, D.M.; Hendry, M.; Edwards, T. Rock fall hazard control along a section of railway based on quantified risk. Georisk: Assess. Manag. Risk Eng. Syst. Geohazards 2017, 11, 272–284. [Google Scholar] [CrossRef]
  18. Macciotta, R.; Martin, C.D. Preliminary approach for prioritizing resource allocation for rock fall hazard investigations based on susceptibility mapping and efficient three-dimensional trajectory modelling. Bull. Int. Assoc. Eng. Geol. 2018, 78, 2803–2815. [Google Scholar] [CrossRef]
  19. Mineo, S. Comparing rockfall hazard and risk assessment procedures along roads for different planning purposes. J. Mt. Sci. 2020, 17, 653–669. [Google Scholar] [CrossRef]
  20. Macciotta, R.; Gräpel, C.; Keegan, T.; Duxbury, J.; Skirrow, R. Quantitative risk assessment of rock slope instabilities that threaten a highway near Canmore, Alberta, Canada: Managing risk calculation uncertainty in practice. Can. Geotech. J. 2020, 57, 337–353. [Google Scholar] [CrossRef]
  21. Scavia, C.; Barbero, M.; Castelli, M.; Marchelli, M.; Peila, D.; Torsello, G.; Vallero, G. Evaluating Rockfall Risk: Some Critical Aspects. Geosciences 2020, 10, 98. [Google Scholar] [CrossRef] [Green Version]
  22. Yu, B.; Yi, W.; Zhao, H. Experimental study on the maximum impact force by rock fall. Landslides 2017, 15, 233–242. [Google Scholar] [CrossRef]
  23. Corominas, J.; Matas, G.; Ruiz-Carulla, R. Quantitative analysis of risk from fragmental rockfalls. Landslides 2018, 16, 5–21. [Google Scholar] [CrossRef] [Green Version]
  24. Macciotta, R.; Martin, C.D.; Cruden, D.M. Probabilistic estimation of rockfall height and kinetic energy based on a three-dimensional trajectory model and Monte Carlo simulation. Landslides 2014, 12, 757–772. [Google Scholar] [CrossRef]
  25. Giacomini, A.; Buzzi, O.; Renard, B.; Giani, G. Experimental studies on fragmentation of rock falls on impact with rock surfaces. Int. J. Rock Mech. Min. Sci. 2009, 46, 708–715. [Google Scholar] [CrossRef]
  26. Gili, J.; Ruiz, R.; Matas, G.; Corominas, J.; Lantada, N.; Núñez-Andrés, M.A.; Mavrouli, O.; Buill, F.; Moya, J.; Prades, A.; et al. Experimental study on rockfall fragmentation: In situ test design and first results. In Landslides and Engineered Slopes. Experience, Theory and Practice; Informa UK Limited: London, UK, 2016; pp. 983–990. [Google Scholar]
  27. Fornaro, M.; Peila, D.; Nebbia, M. Block falls on rock slopes - application of a numerical simulation program to some real cases. In Proceedings of the 6th International Congress IAEG, Amsterdam, The Netherlands, 6–10 August 1990. [Google Scholar]
  28. Salciarini, D.; Tamagnini, C.; Conversini, P. Numerical approaches for rockfall analysis: A comparison. In Proceedings of the 18th IMACS world congress/MODSIM09, Cairns, Australia, 13–17 July 2009. [Google Scholar]
  29. Wang, Y.; Tonon, F. Discrete Element Modeling of Rock Fragmentation upon Impact in Rock Fall Analysis. Rock Mech. Rock Eng. 2010, 44, 23–35. [Google Scholar] [CrossRef]
  30. Matas, G.; Lantada, N.; Corominas, J.; Gili, J.A.; Ruiz-Carulla, R.; Prades, A. RockGIS: A GIS-based model for the analysis of fragmentation in rockfalls. Landslides 2017, 40, 455–1578. [Google Scholar] [CrossRef] [Green Version]
  31. Ruiz-Carulla, R.; Corominas, J.; Mavrouli, O. A fractal fragmentation model for rockfalls. Landslides 2016, 14, 875–889. [Google Scholar] [CrossRef]
  32. Ruiz-Carulla, R.; Corominas, J.; Mavrouli, O. A methodology to obtain the block size distribution of fragmental rockfall deposits. Landslides 2015, 12, 815–825. [Google Scholar] [CrossRef] [Green Version]
  33. Elmouttie, M.; Poropat, G.V. A Method to Estimate In Situ Block Size Distribution. Rock Mech. Rock Eng. 2011, 45, 401–407. [Google Scholar] [CrossRef]
  34. Lambert, C.; Thoeni, K.; Giacomini, A.; Casagrande, D.; Sloan, S.W. Rockfall Hazard Analysis From Discrete Fracture Network Modelling with Finite Persistence Discontinuities. Rock Mech. Rock Eng. 2012, 45, 871–884. [Google Scholar] [CrossRef]
  35. Macciotta, R.; Martin, C.D. Remote structural mapping and discrete fracture networks to calculate rock fall volumes at Tornado Mountain, British Columbia. In Proceedings of the 49th US Rock Mechanics/Geomechanics Symposium, San Francisco, CA, USA, 28 June–1 July 2015. [Google Scholar]
  36. Grenon, M.; Matasci, B.; Jaboyedoff, M.; Stock, G.M. Discrete fracture network modeling using Coltop3D for rockfall potential assessment at Glacier Point, Yosemite Valley. In Proceedings of the First International Conference on Discrete Fracture Network Engineering, Vancouver, BC, Canada, 19–22 October 2014. [Google Scholar]
  37. Palleske, C.; Kennedy, C.; Hutchinson, D.J.; Diederichs, M.S. Methods for using photogrammetry in the generation of discrete fracture networks for block size estimation. In Proceedings of the First International Conference on Discrete Fracture Network Engineering, Vancouver, BC, Canada, 19–22 October 2014. [Google Scholar]
  38. ADAM Technology, 3DM Analyst and CalibCam. Available online: https://www.adamtech.com.au (accessed on 1 July 2020).
  39. Rocscience Inc. Dips. Available online: https://www.rocscience.com/software/dips (accessed on 31 July 2020).
  40. Wolfram. Wolfram Mathematica. Available online: https://www.wolfram.com/mathematica (accessed on 31 July 2020).
  41. Obregon, C.; Mitri, H. Probabilistic approach for open pit bench slope stability analysis–A mine case study. Int. J. Min. Sci. Technol. 2019, 29, 629–640. [Google Scholar] [CrossRef]
  42. Mielke, P.W.; Benjamin, J.R.; Cornell, C.A. Probability, Statistics and Decision for Civil Engineers. J. Am. Stat. Assoc. 1971, 66, 923. [Google Scholar] [CrossRef]
  43. Klohn Crippen Berger Ltd. S42 Spray Lakes Rockfall—Preliminary Design Report; Alberta Transportation: Edmonton, AB, Canada, 2016. [Google Scholar]
Figure 1. Method for calculating fragmented rockfall volume distribution from remote sensing, virtual structural mapping and discrete fracture networks.
Applsci 10 06977 g001
Figure 2. Location of Tornado Mountain (a), view of the source of the 2004 rockfalls (b), and example of blocks encountered within the rockfall paths during surveying (c).
Applsci 10 06977 g002
Figure 3. Location of Site S042 (a), view of the rock face towards the southwest direction (b), and detail of blocks contained behind a 2m height fence at the toe of the talus slope (c).
Applsci 10 06977 g003
Figure 4. Virtually mapped discontinuity density contours in a stereographic projection (a). Major discontinuity sets (average) and distribution of mapped spacing (b). Modeled after the work in [35].
Applsci 10 06977 g004
Figure 5. View of one realization of the 10 m × 10 m × 10 m persistent discrete fracture network (DFN) built for the Tornado Mountain site (a) and discrete blocks defined by the DFN, colorized randomly (b). Modeled after the work in [35].
Applsci 10 06977 g005
Figure 6. Fragmented rockfall volume distribution as calculated by the persistent DFN method and field surveys. Modeled after the work in [35].
Applsci 10 06977 g006
Figure 7. Fragmented rockfall volume cumulative relative distribution as calculated by the persistent DFN method and field surveys, for all DFN calculated volumes (a) and for DFN volumes truncated in accordance with the range of surveyed volumes (b). Tornado Mountain.
Applsci 10 06977 g007
Figure 8. Virtually mapped discontinuity density contours in stereographic projection for Site S042 and manually identified joint sets.
Applsci 10 06977 g008
Figure 9. Probability density histograms of joint set orientation and fitted probability density function (PDF). J1 dip (a) and dip direction (b), J2 dip (c) and dip direction (d), J3 dip (e), and dip direction (f).
Applsci 10 06977 g009
Figure 10. Probability density histograms of joint set orientation. J4 dip (a) and dip direction (b), J5 dip (c), and dip direction (d).
Applsci 10 06977 g010
Figure 11. View of one realization of the 10 m × 10 m × 10 m persistent DFN built for Site S042 (a) and discrete blocks defined by the DFN, colorized randomly (b).
Applsci 10 06977 g011
Figure 12. Fragmented rockfall volume distribution as calculated by the persistent DFN method and field surveys for Site S042.
Applsci 10 06977 g012
Figure 13. Fragmented rockfall volume cumulative relative distribution as calculated by the persistent DFN method and field surveys, for all DFN calculated volumes (a) and for DFN volumes truncated in accordance with the range of surveyed volumes (b). Site S042.
Applsci 10 06977 g013
Table 1. Joint set data in [35] and probabilistic distribution adopted for the Tornado Mountain site.
Joint SetDip (°)DistributionDip Direction (°)DistributionSpacing (m)Distribution
150–70 Uniform within the range300–350 Uniform within the range0.2–2 Triangular within the range and mode at 0.6
265–85 Uniform within the range160–180 Uniform within the range0.4–2 Triangular within the range and mode at 0.6
365–85 Uniform within the range100–130 Uniform within the range0.4–2 Triangular within the range and mode at 0.6
475–90 Uniform within the range0–10 Uniform within the range0.4–2 Triangular within the range and mode at 0.6
Table 2. Pearson’s χ2 probability values for the goodness of fit tests for measured orientation PDF adopted. Values over 0.05 are considered an adequate fit.
Joint SetDip Dist. FitDip Direction Dist. Fit
10.780.27
20.130.55
30.210.25
Table 3. Range of spacing values for joint sets J1 through J3.
Joint SetMinMeanMaxDistribution Adopted
10.10.52.4Triangular, mode = 0.5
20.10.30.4Triangular, mode = 0.3
30.11.02.8Triangular, mode = 1.0

