Raman Laser Spectrometer: Application to 12C/13C Isotope Identification in CH4 and CO2 Greenhouse Gases

 , , , ,
Abstract
:Featured Application
Abstract
1. Introduction
2. Materials and Methods
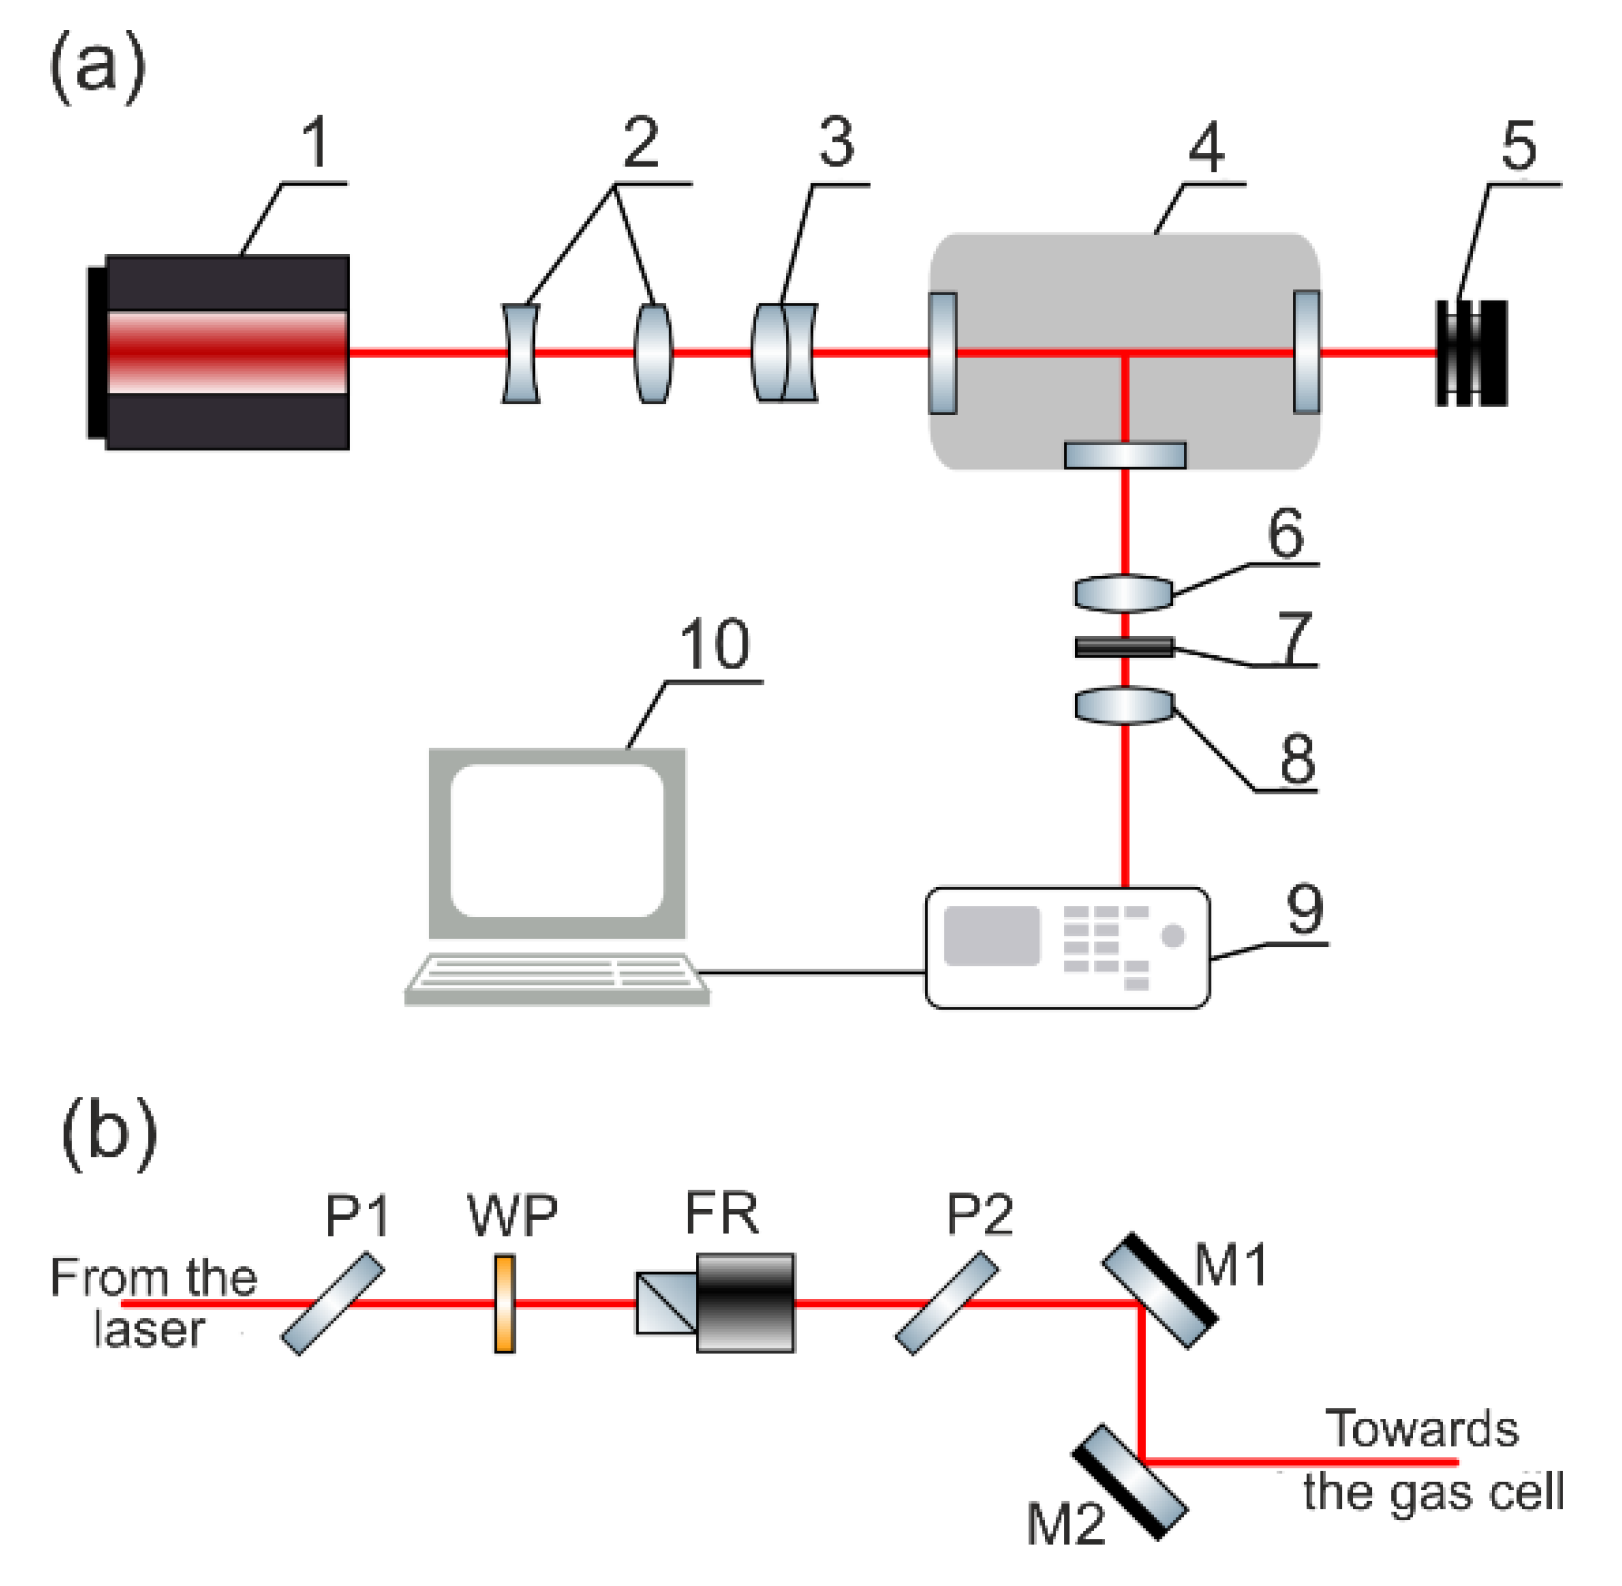
3. Raman Laser Spectrometer
3.1. Excitation Source
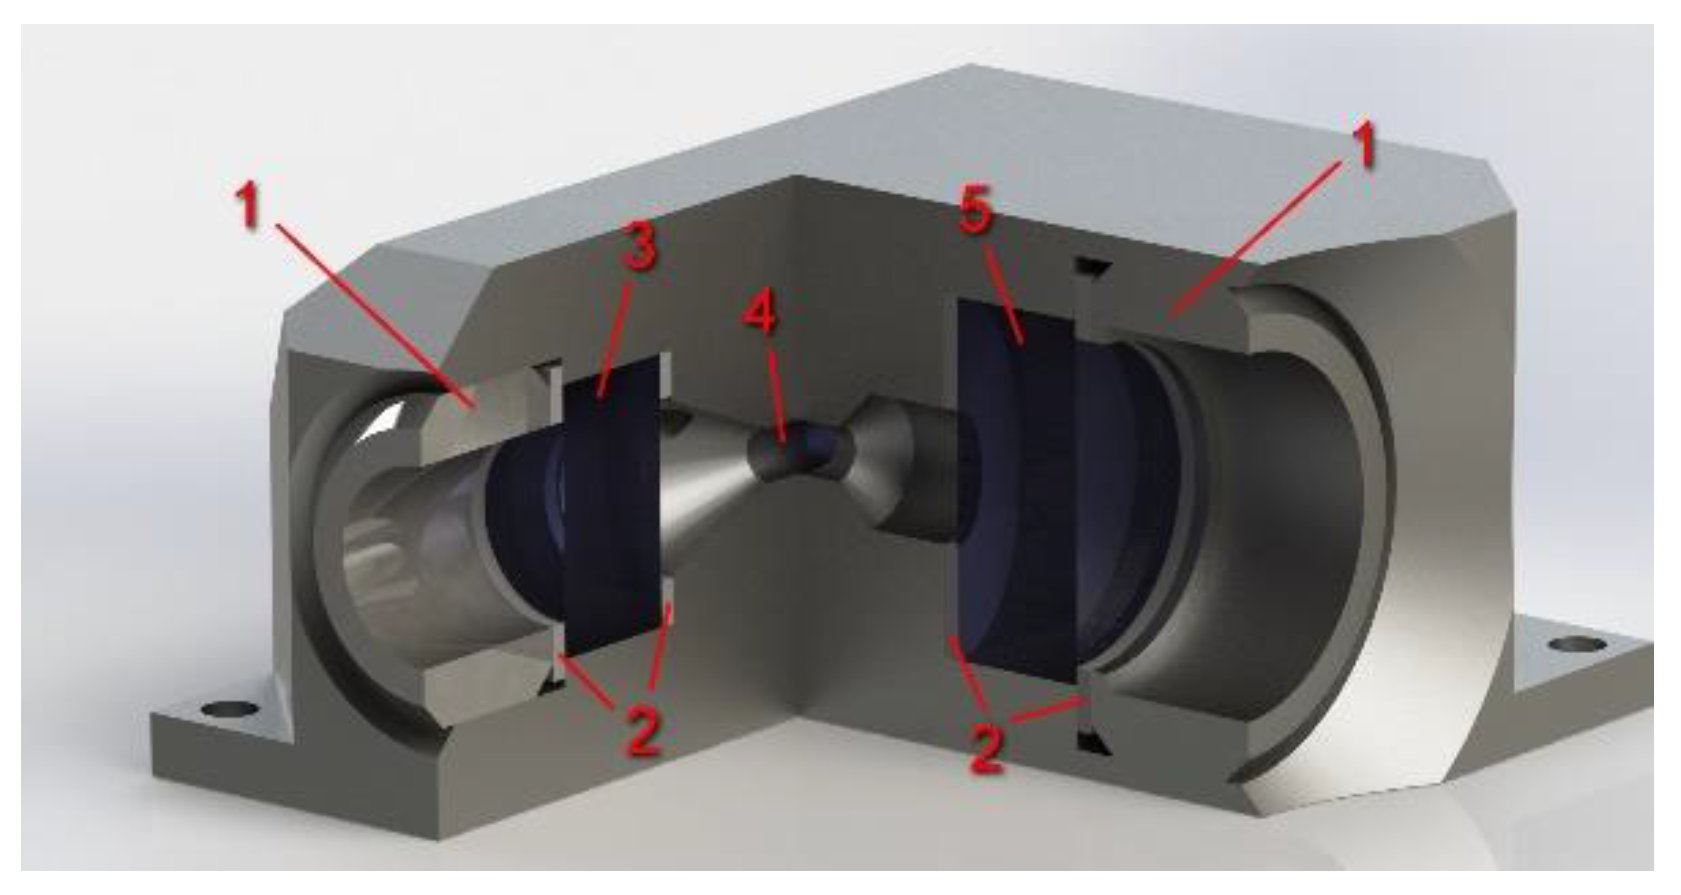
3.2. High-Pressure Gas Cell
3.3. Spectrometer
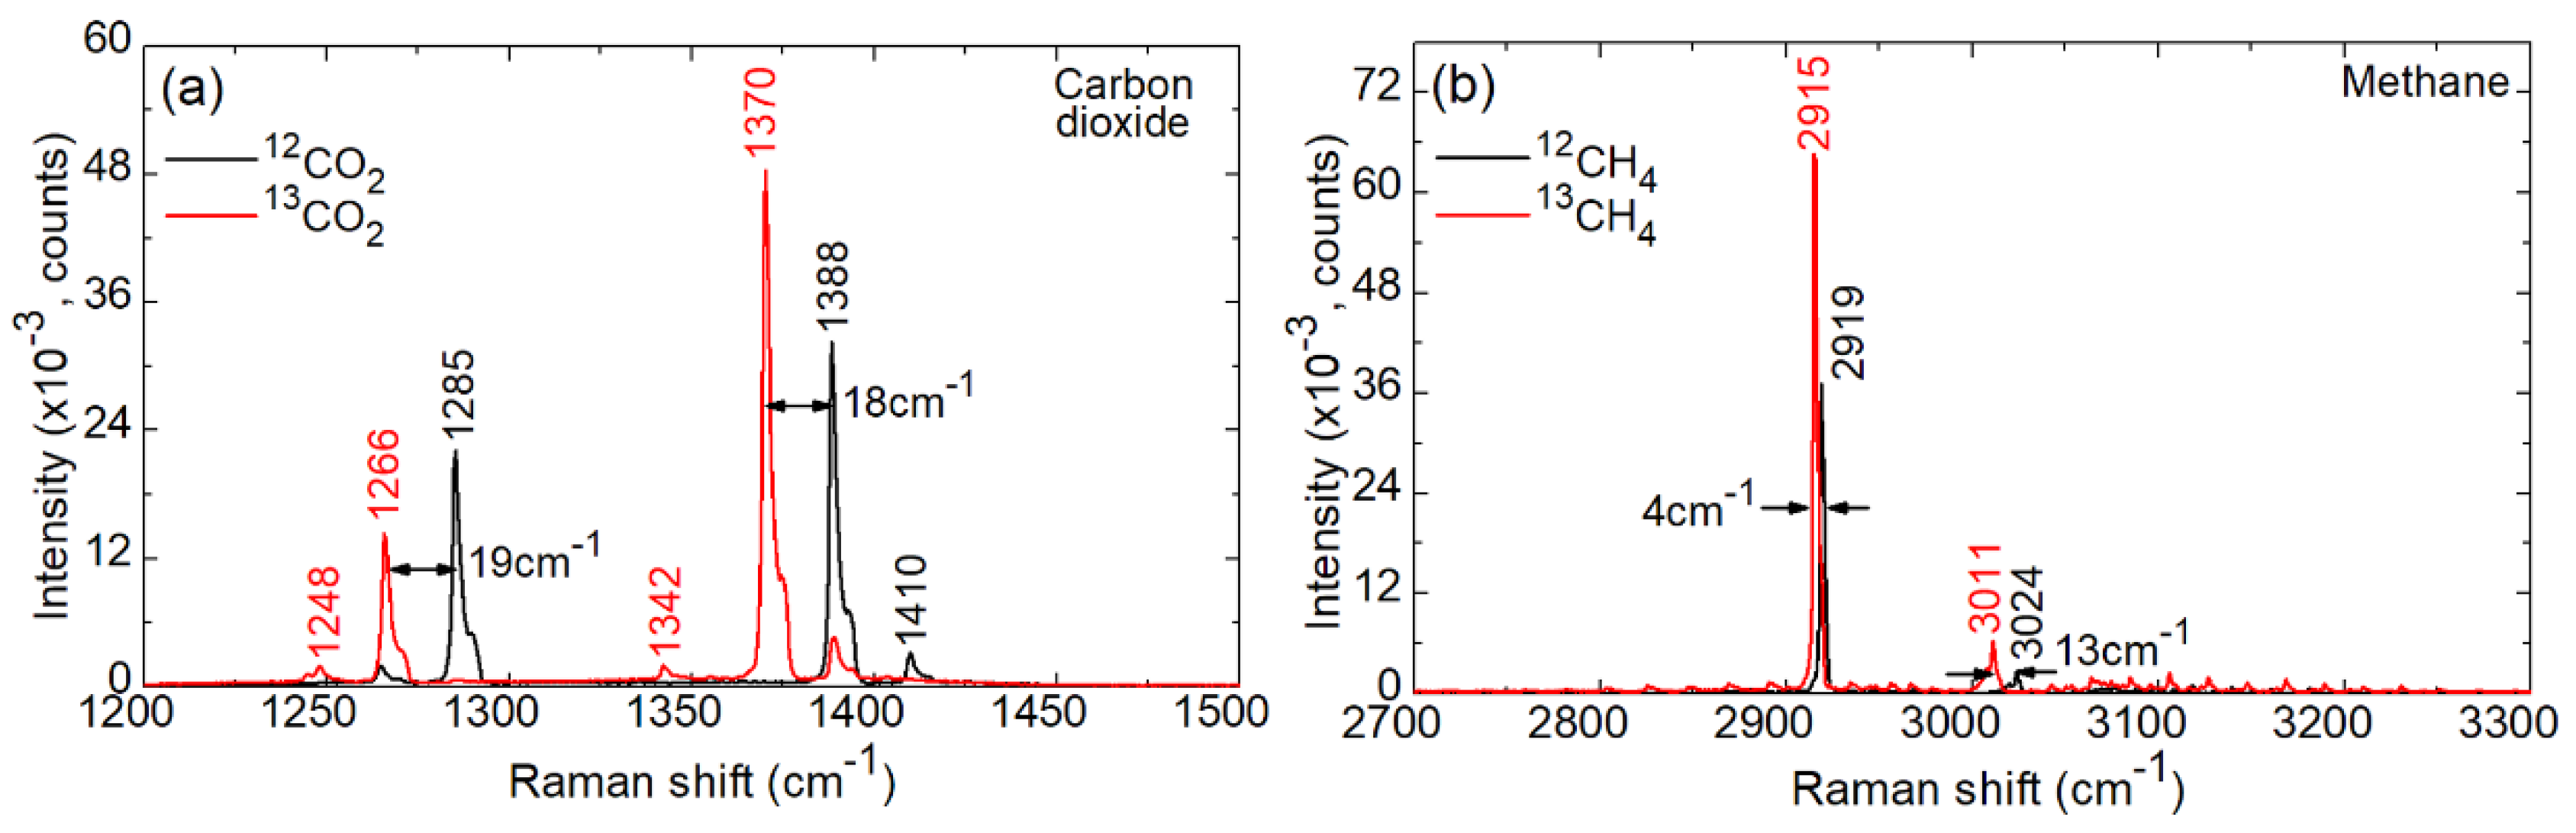
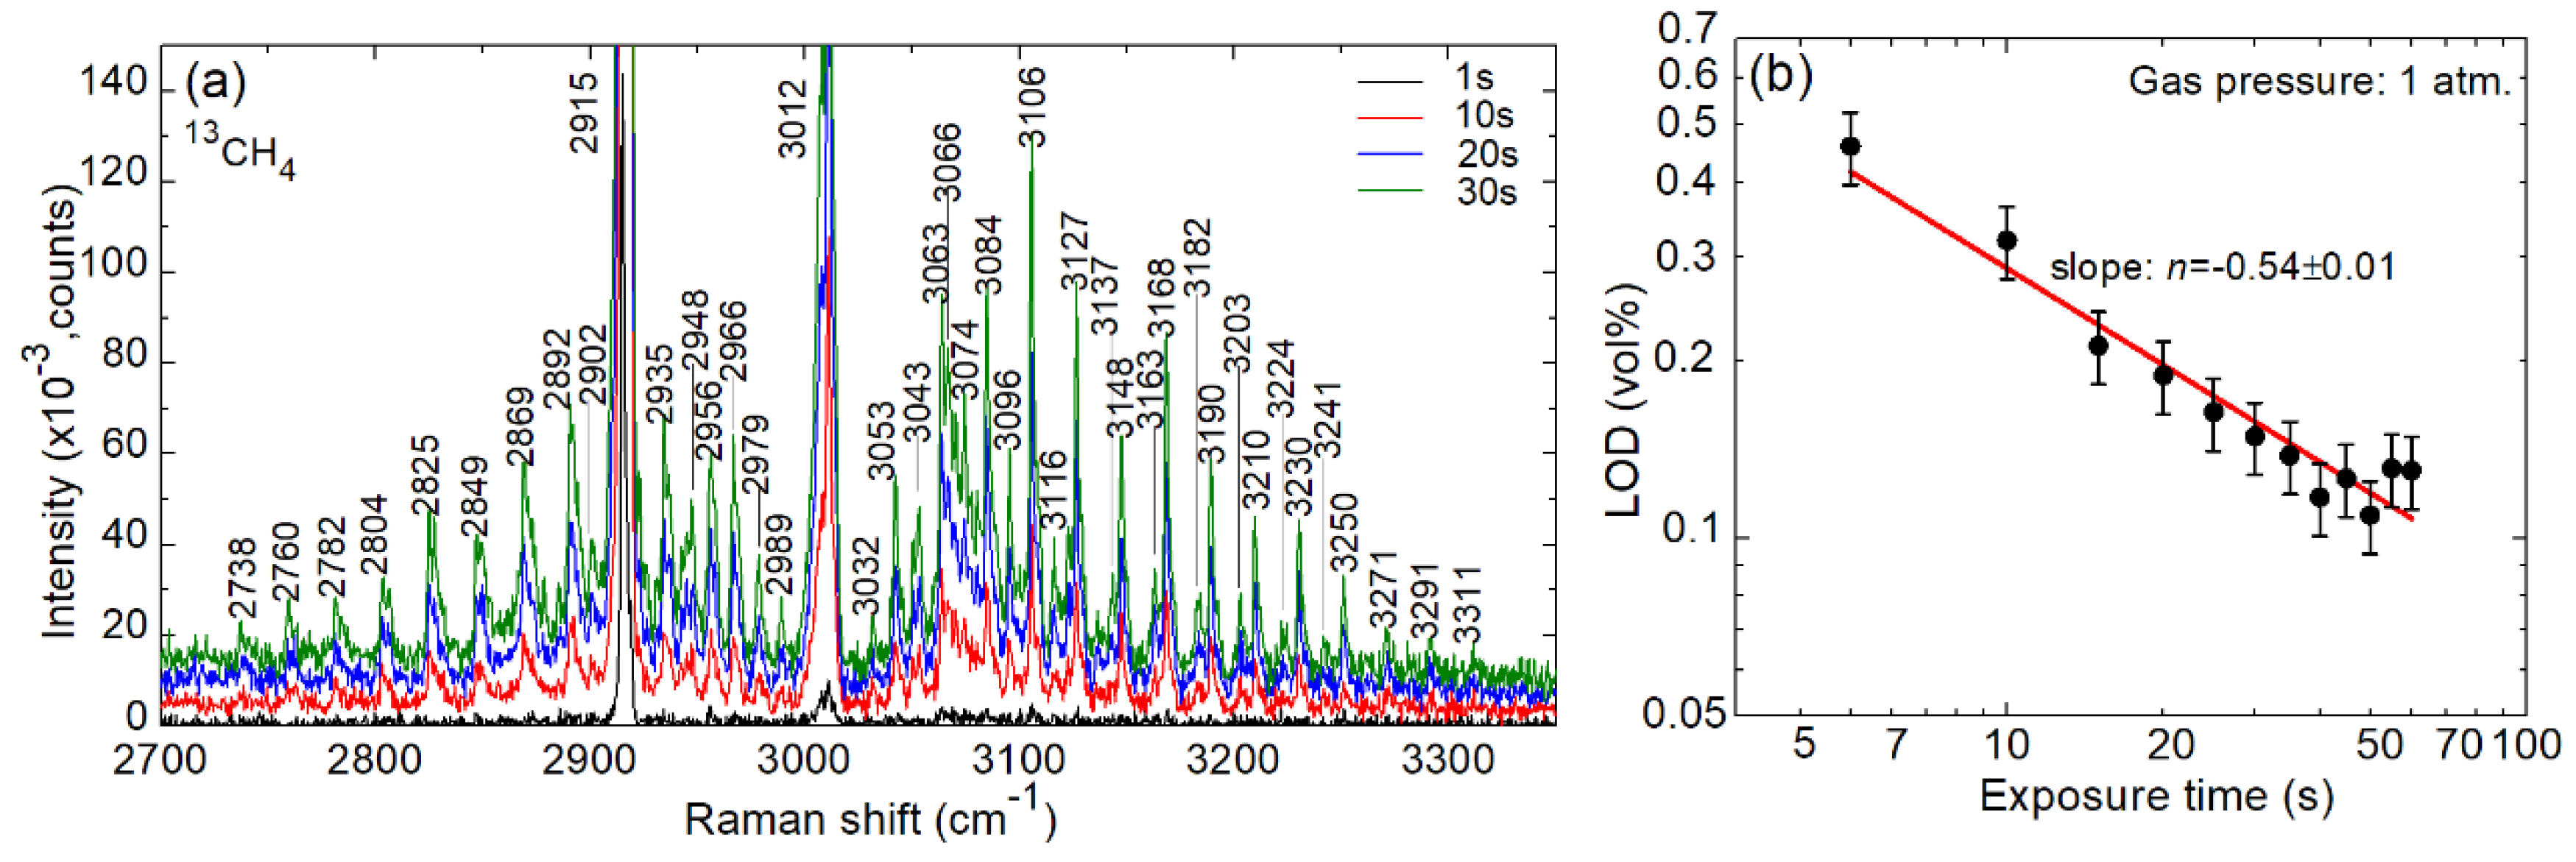
4. Spectroscopy of 12C/13C Isotopologues
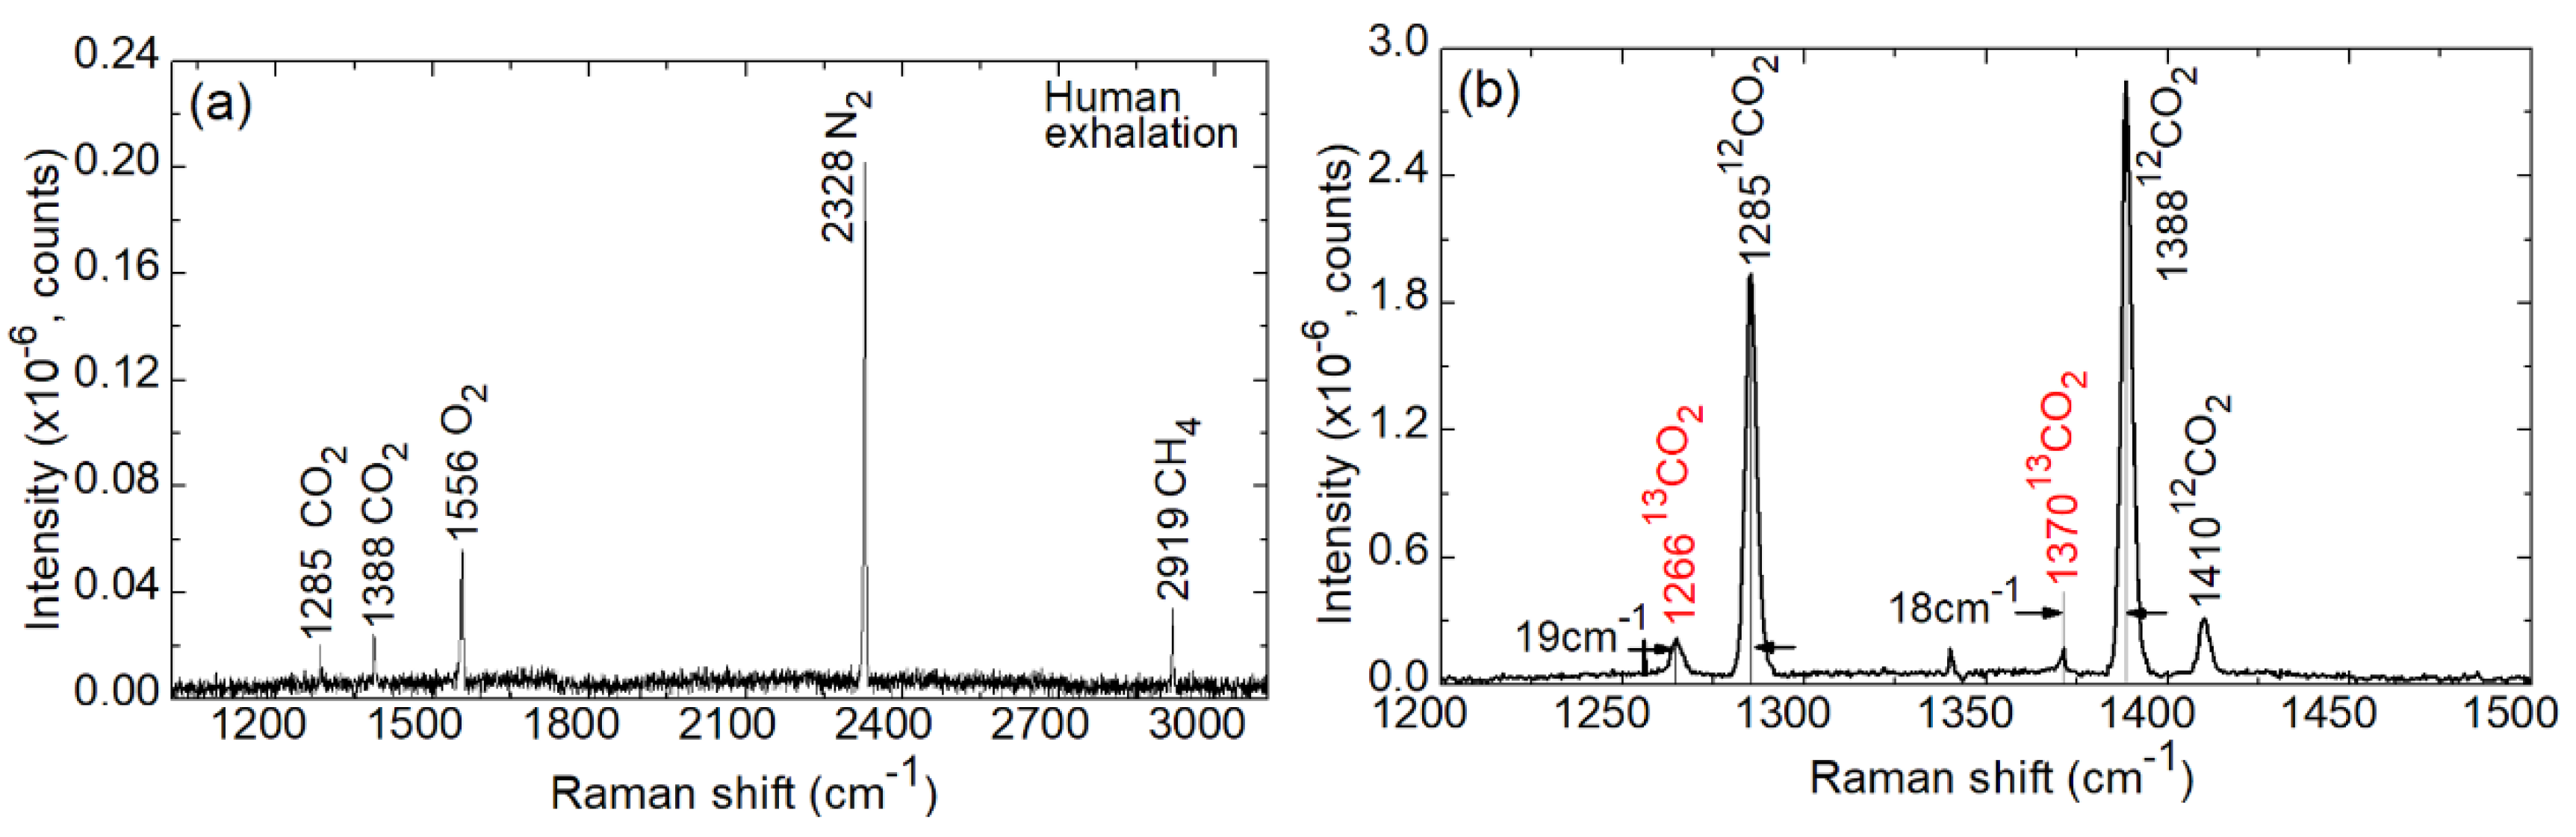
5. Towards Applications: Human Exhalation
6. Conclusions
Author Contributions
Funding
Conflicts of Interest
References
- Rieker, G.B.; Giorgetta, F.R.; Swann, W.C.; Kofler, J.; Zolot, A.M.; Sinclair, L.C.; Baumann, E.; Cromer, C.; Petron, G.; Sweeney, C.; et al. Frequency-comb-based remote sensing of greenhouse gases over kilometer air paths. Optica 2014, 1, 290–298. [Google Scholar] [CrossRef]
- Ghosh, P.; Brand, W.A. Stable isotope ratio mass spectrometry in global climate change research. Int. J. Mass Spectrom. 2003, 228, 1–33. [Google Scholar] [CrossRef] [Green Version]
- Schneider, S.H. Detecting climatic change signals: Are there any” fingerprints”? Science 1994, 263, 341–347. [Google Scholar] [CrossRef] [PubMed]
- Stevens, C.M.; Rust, F.E. The carbon isotopic composition of atmospheric methane. J. Geophys. Res. Oceans 1982, 87, 4879–4882. [Google Scholar] [CrossRef]
- Monteil, G.A.; Houweling, S.; Dlugockenky, E.J.; Maenhout, G.; Vaughn, B.H.; White, J.W.C.; Rockmann, T. Interpreting methane variations in the past two decades using measurements of CH4 mixing ratio and isotopic composition. Atmosph. Chem. Phys. 2011, 11, 9141–9153. [Google Scholar] [CrossRef] [Green Version]
- Li, J.J.; Li, R.X.; Dong, H.; Wang, Z.H.; Zhao, B.S.; Wang, N.; Cheng, J.H. Carbon isotopic compositions in carbon dioxide measured by micro-laser Raman spectroscopy. J. Appl. Spectrosc. 2017, 84, 237–241. [Google Scholar] [CrossRef]
- Keiner, R.; Frosch, T.; Massad, T.; Trumbore, S.; Popp, J. Enhanced Raman multigas sensing—A novel tool for control and analysis of 13CO2 labeling experiments in environmental research. Analyst 2014, 139, 3879–3884. [Google Scholar] [CrossRef] [PubMed] [Green Version]
- Li, J.; Li, R.; Zhao, B.; Guo, H.; Zhang, S.; Cheng, J.; Wu, X. Quantitative measurement of carbon isotopic composition in CO2 gas reservoir by micro-laser Raman spectroscopy. Spectrochim. Acta A Mol. Biomol. Spectrosc. 2018, 195, 191–198. [Google Scholar] [CrossRef] [PubMed]
- Zhang, M.; Zhao, L.B.; Luo, W.L.; Pang, R.; Zong, C.; Zhou, J.Z.; Ren, B.; Tian, Z.Q.; Wu, D.Y. Experimental and theoretical study on isotopic surface-enhanced Raman spectroscopy for the surface catalytic coupling reaction on silver electrodes. J. Phys. Chem. C 2016, 120, 11956–11965. [Google Scholar] [CrossRef]
- Prinzhofer, A.; Battani, A. Gas isotopes tracing: An important tool for hydrocarbons exploration. Oil Gas Sci. Tehcnol. 2003, 58, 299–311. [Google Scholar] [CrossRef] [Green Version]
- Naik, V.; Voulgarakis, A.; Fiore, A.M.; Horowitz, L.W.; Lamarque, J.F.; Lin, M.; Prather, M.J.; Young, P.J.; Bergmann, D.; Cameron-Smith, P.J.; et al. Preindustrial to present-day changes in tropospheric hydroxyl radical and methane lifetime from the Atmospheric Chemistry and Climate Model Intercomparison Project (ACCMIP). Atmosph. Chem. Phys. 2013, 13, 5277–5298. [Google Scholar] [CrossRef] [Green Version]
- Bergamaschi, P.; Schupp, M.; Harris, G.W. High-precision direct measurements of 13CH4/12CH4 and 12CH3D/12CH4 ratios in atmospheric methane sources by means of a long-path tunable diode laser absorption spectrometer. App. Opt. 1994, 33, 7704–7716. [Google Scholar] [CrossRef] [PubMed] [Green Version]
- Bréas, O.; Guillou, C.; Reniero, F.; Wada, E. The global methane cycle: Isotopes and mixing ratios, sources and sinks. Isot. Environ. Health S. 2001, 37, 257–379. [Google Scholar] [CrossRef]
- Petrov, D.V.; Matrosov, I.I. Raman gas analyzer (RGA): Natural gas measurements. Appl. Spectrosc. 2016, 70, 1770–1776. [Google Scholar] [CrossRef]
- Prokhorov, I.; Kluge, T.; Janssen, C. A novel method of carbon dioxide clumped isotope analysis with tunable infra-red laser direct absorption spectroscopy. In Proceedings of the EGU General Assembly 2016, Vienna, Austria, 17–22 April 2016. [Google Scholar]
- Polyansky, O.L.; Bielska, K.; Ghysels, M.; Lodi, L.; Zobov, N.F.; Hodges, J.T.; Tennyson, J. High-accuracy CO2 line intensities determined from theory and experiment. Phys. Rev. Lett. 2015, 114, 243001. [Google Scholar] [CrossRef] [PubMed] [Green Version]
- International Committee for Weights and Measures. Proceedings of Session I of the 104th Meeting (9–10 March 2015). Available online: https://www.bipm.org/utils/en/pdf/CIPM/CIPM2015-I-EN.pdf (accessed on 29 August 2020).
- Van Geldern, R.; Nowak, M.E.; Zimmer, M.; Szizybalski, A.; Myrttinen, A.; Barth, J.A.; Jost, H.J. Field-based stable isotope analysis of carbon dioxide by mid-infrared laser spectroscopy for carbon capture and storage monitoring. Anal. Chem. 2014, 86, 12191–12198. [Google Scholar] [CrossRef] [PubMed]
- Siberio-Pérez, D.Y.; Wong-Foy, A.G.; Yaghi, O.M.; Matzger, A.J. Raman spectroscopic investigation of CH4 and N2 adsorption in metal−organic frameworks. Chem. Mater. 2007, 19, 3681–3685. [Google Scholar] [CrossRef]
- Keutel, D.; Seifert, F.; Oehme, K.L.; Asenbaum, A.; Musso, M. Evidence for negative cross correlations in vibrational dephasing in liquids: Isotropic Raman-line shift and width phenomena in isotopic mixtures of N2 and O2. Phys. Rev. Lett. 2000, 85, 3850. [Google Scholar] [CrossRef]
- Cabaço, M.I.; Longelin, S.; Danten, Y.; Besnard, M. Transient dimer formation in supercritical carbon dioxide as seen from Raman scattering. J. Chem. Phys. 2008, 128, 074507. [Google Scholar] [CrossRef]
- Musso, M.; Matthai, F.; Keutel, D.; Oehme, K.L. Critical Raman line shape behavior of fluid nitrogen. Pure Appl. Chem. 2004, 76, 147–155. [Google Scholar] [CrossRef]
- Yan, D.; Popp, J.; Frosch, T. Analysis of fiber-enhanced Raman gas sensing based on Raman chemical imaging. Anal. Chem. 2017, 89, 12269–12275. [Google Scholar] [CrossRef] [PubMed]
- Yu, A.; Zuo, D.; Wang, X. Optimization of parabolic cell for gas Raman analysis. J. Raman Spectrosc. 2019, 50, 731–740. [Google Scholar] [CrossRef]
- Eichmann, S.C.; Weschta, M.; Kiefer, J.; Seeger, T.; Leipertz, A. Characterization of a fast gas analyzer based on Raman scattering for the analysis of synthesis gas. Rev. Sci. Instrum. 2010, 81, 125104. [Google Scholar] [CrossRef] [PubMed]
- Petrak, B.; Cooper, J.; Konthasinghe, K.; Peiris, M.; Djeu, N.; Hopkins, A.J.; Muller, A. Isotopic gas analysis through Purcell cavity enhanced Raman scattering. Appl. Phys. Lett. 2016, 108, 091107. [Google Scholar] [CrossRef]
- Sharma, R.; Poonacha, S.; Bekal, A.; Vartak, S.; Weling, A.; Tilak, V.; Mitra, C. Raman analyzer for sensitive natural gas composition analysis. Opt. Eng. 2016, 55, 104103. [Google Scholar] [CrossRef]
- John, S.T.; Shaw, D.M.; Klug, D.D.; Patchkovskii, S.; Vankó, G.; Monaco, G.; Krisch, M. X-ray Raman spectroscopic study of water in the condensed phases. Phys. Rev. Lett. 2008, 100, 095502. [Google Scholar] [CrossRef]
- Chubchenko, Y.K.; Konopel’ko, L.A. Development of a new type of reference standard for carbon isotopic composition. Measur. Tech. 2018, 60, 1228–1232. [Google Scholar] [CrossRef]
- Vitkin, V.V.; Chubchenko, I.K.; Polischuk, A.V.; Kovalev, A.V.; Popov, E.E. Raman gas analyzer for detecting carbon isotopologues. J. Physics: Conf. Ser. 2019, 1399, 022033. [Google Scholar] [CrossRef]
- Popov, E.; Polishchuk, A.; Grigorenko, K.; Chubchenko, I.; Vitkin, V. Raman detector of carbon isotopes. Opt. Sens. Det. VI 2020, 11354, 113542P. [Google Scholar] [CrossRef]
- ASTM E1840-96. Standard Guide for Raman Shift Standards for Spectrometer Calibration; ASTM International: West Conshohocken, PA, USA, 1996. [Google Scholar]
- Howard-Lock, H.E.; Stoicheff, B.P. Raman intensity measurements of the Fermi diad ν1, 2ν2 in 12CO2 and 13CO2. J. Mol. Spectrosc. 1971, 37, 321–326. [Google Scholar] [CrossRef]
- Niederer, H.M.; Wang, X.G.; Carrington, T., Jr.; Albert, S.; Bauerecker, S.; Boudon, V.; Quack, M. Analysis of the rovibrational spectrum of 13CH4 in the Octad range. J. Mol. Spectrosc. 2013, 291, 33–47. [Google Scholar] [CrossRef]
- Niederer, H.M.; Albert, S.; Bauerecker, S.; Boudon, V.; Champion, J.P.; Quack, M. Global analysis of the infrared spectrum of 13CH4: Lines in the region 0 to 3200 cm–1. CHIMIA Int. J. Chem. 2008, 62, 273–276. [Google Scholar] [CrossRef]
- Boudon, V.; Rey, M.; Loete, M. The vibrational levels of methane obtained from analyses of high-resolution spectra. J. Quant. Spectrosc. Rad. Transf. 2006, 98, 394–404. [Google Scholar] [CrossRef]
- Gooijer, C.; Ariese, F.; Hofstraat, J.W. Chemical Analysis: A Series of Monographs on Analytical Chemistry and Its Application; John Wiley & Sons: New York, NY, USA, 2000. [Google Scholar]
- Okita, Y.; Katagiri, T.; Matsuura, Y. A Raman cell based on hollow optical fibers for breath analysis. In Optical Fibers and Sensors for Medical Diagnostics and Treatment Applications X; International Society for Optics and Photonics: San Francisco, CA, USA, 2010; Volume 7559, p. 755908. [Google Scholar] [CrossRef]
- Butz, D.E.; Cook, M.E.; Eghbalnia, H.R.; Assadi-Porter, F.; Porter, W.P. Changes in the natural abundance of 13CO2/12CO2 in breath due to lipopolysacchride-induced acute phase response. Rapid Commun. Mass Spectrosc. 2009, 23, 3729–3735. [Google Scholar] [CrossRef] [PubMed]
- Braden, B.; Haisch, M.; Duan, L.P.; Lembcke, B.; Caspary, W.F.; Hering, P. Clinically feasible stable isotope technique at a reasonable price: Analysis of 13CO2/12CO2-abundance in breath samples with a new isotope selective-nondispersive infrared spectrometer. Z. Gastroenterol. 1994, 32, 675–678. [Google Scholar] [PubMed]
- Barth, E.; Tugtekin, I.; Weidenbach, H.; Wachter, U.; Vogt, J.; Radermacher, P.; Adler, G.; Georgieff, M. Determination of 13CO2/12CO2 ratio by IRMS and NDIRS. Isot. Environ. Health S. 1998, 34, 209–213. [Google Scholar] [CrossRef]
- Koletzko, S.; Koletzko, B.; Haisch, M.; Hering, P.; Seeboth, I.; Hengels, K.; Braden, B. Isotope-selective non-dispersive infrared spectrometry for detection of Helicobacter pylori infection with 13C-urea breath test. Lancet 1995, 345, 961–962. [Google Scholar] [CrossRef]
- Normand, S.; Pachiaudi, C.; Khalfallah, Y.; Guilluy, R.; Mornex, R.; Riou, J.P. 13C appearance in plasma glucose and breath CO2 during feeding with naturally 13C-enriched starchy food in normal humans. Am. J. Clin. Nutr. 1992, 55, 430–435. [Google Scholar] [CrossRef]
- Schoeller, D.A.; Brown, C.; Nakamura, K.; Nakagawa, A.; Mazzeo, R.S.; Brooks, G.A.; Budinger, T.F. Influence of metabolic fuel on the 13C/12C ratio of breath CO2. Biomed. Mass Spectrom. 1984, 11, 557–561. [Google Scholar] [CrossRef]


| Gas | CP, % | δC, % |
|---|---|---|
| 12CO2 | >99.987 | 99.992 |
| 13CO2 | >99.994 | 99.57 |
| 12CH4 | >99.5 | >99.99 |
| 13CH4 | >99 | >99.9 |
| Parameter | 12CO2 | 13CO2 | 12CH4 | 13CH4 |
|---|---|---|---|---|
| ν, cm−1 | 1388 | 1370 | 2919 | 2915 |
| Isignal, counts | 7630 | 13754 | 37487 | 64654 |
| Inoise, counts | 382 | 229 | 523 | 311 |
| (r.m.s.)noise, counts | 28 | 27 | 30 | 28 |
| ΔIsignal, counts | 7248 | 13525 | 36964 | 64343 |
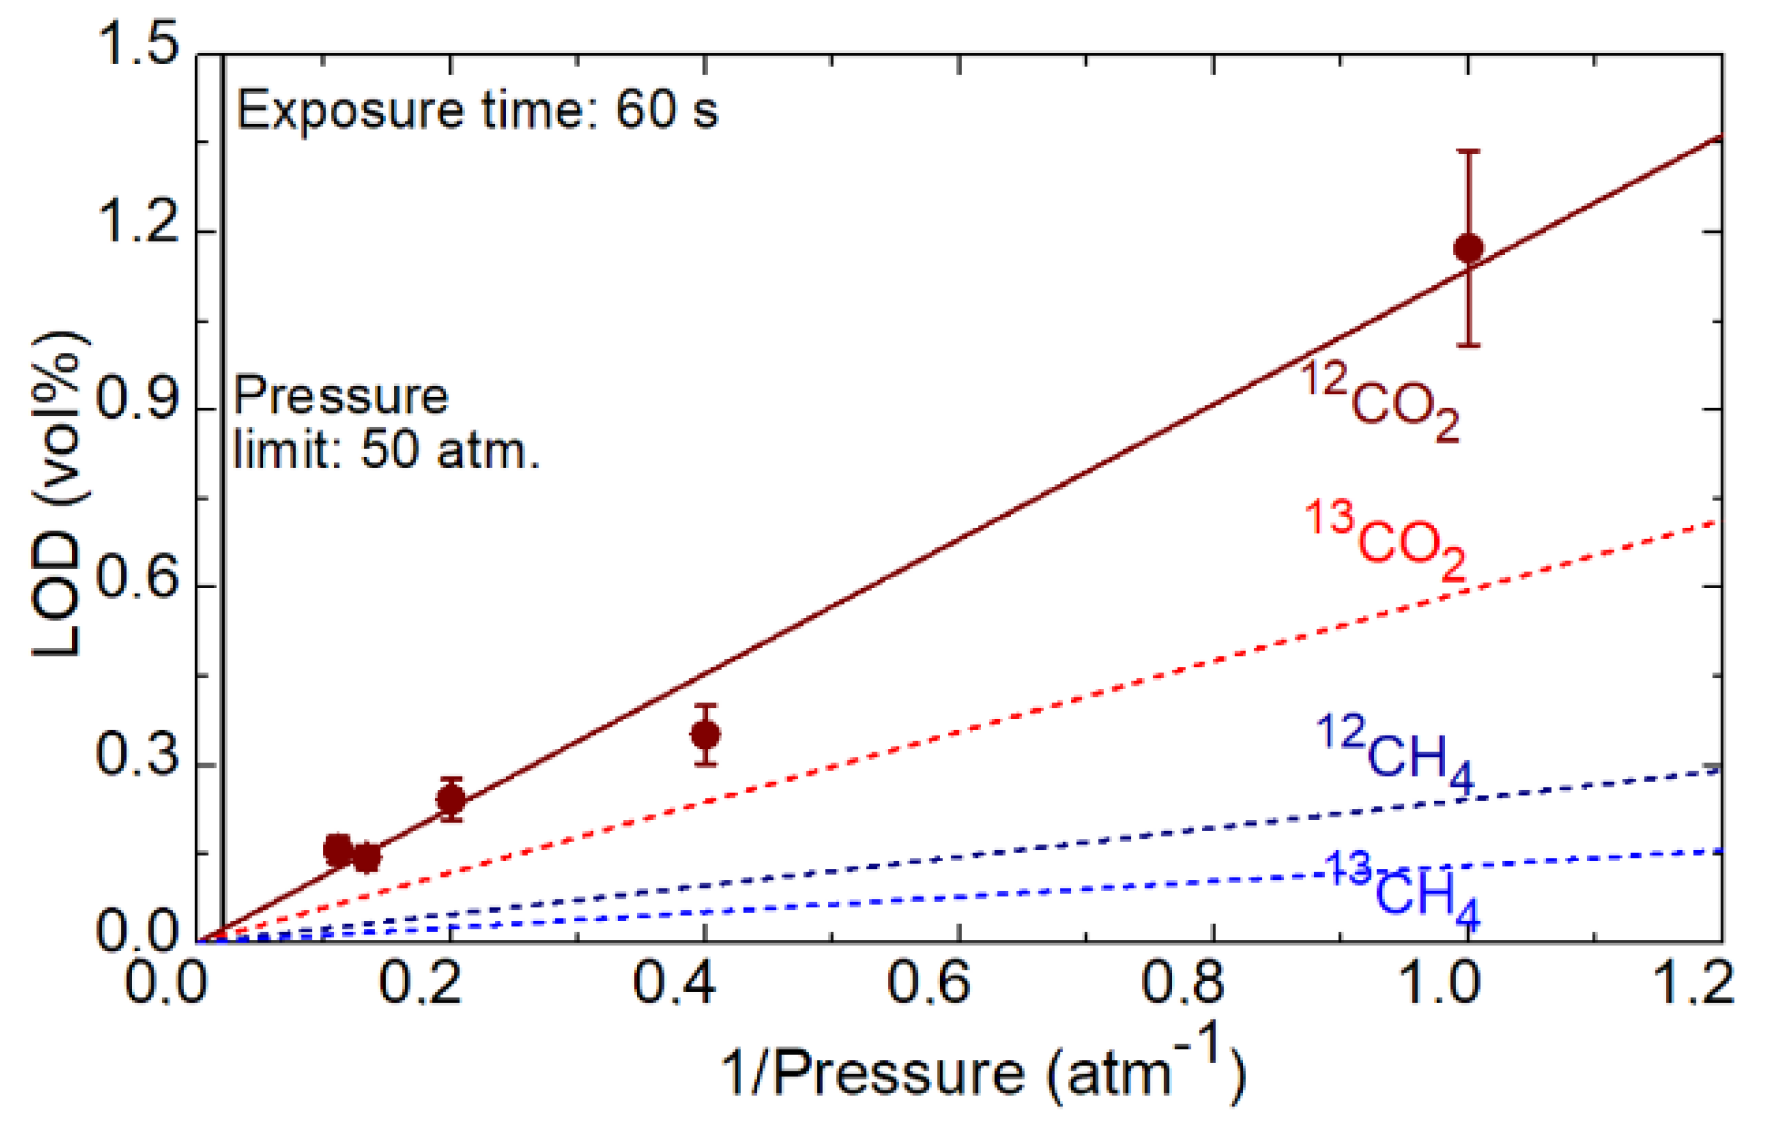
| LOD (1 atm.), % | 1.1731 | 0.5952 | 0.2428 | 0.1303 |
| LOD (50 atm.), % | 0.0227 | 0.0119 | 0.0049 | 0.0026 |
| LOD (50 atm.), ppm | 227 | 119 | 49 | 26 |
| LOD (50 atm., 300 s), ppm | 95 | 50 | 20 | 11 |
Publisher’s Note: MDPI stays neutral with regard to jurisdictional claims in published maps and institutional affiliations. |
© 2020 by the authors. Licensee MDPI, Basel, Switzerland. This article is an open access article distributed under the terms and conditions of the Creative Commons Attribution (CC BY) license (http://creativecommons.org/licenses/by/4.0/).
Share and Cite
Vitkin, V.; Polishchuk, A.; Chubchenko, I.; Popov, E.; Grigorenko, K.; Kharitonov, A.; Davtian, A.; Kovalev, A.; Kurikova, V.; Camy, P.; et al. Raman Laser Spectrometer: Application to 12C/13C Isotope Identification in CH4 and CO2 Greenhouse Gases. Appl. Sci. 2020, 10, 7473. https://doi.org/10.3390/app10217473
Vitkin V, Polishchuk A, Chubchenko I, Popov E, Grigorenko K, Kharitonov A, Davtian A, Kovalev A, Kurikova V, Camy P, et al. Raman Laser Spectrometer: Application to 12C/13C Isotope Identification in CH4 and CO2 Greenhouse Gases. Applied Sciences. 2020; 10(21):7473. https://doi.org/10.3390/app10217473
Chicago/Turabian StyleVitkin, Vladimir, Anton Polishchuk, Ian Chubchenko, Evgeniy Popov, Konstantin Grigorenko, Artem Kharitonov, Arsen Davtian, Anton Kovalev, Valeria Kurikova, Patrice Camy, and et al. 2020. "Raman Laser Spectrometer: Application to 12C/13C Isotope Identification in CH4 and CO2 Greenhouse Gases" Applied Sciences 10, no. 21: 7473. https://doi.org/10.3390/app10217473