Abstract
An integrated method for fault detection of bearing using wavelet packet energy (WPE) and fast kurtogram (FK) is proposed. The method consists of three stages. Firstly, several commonly used wavelet functions were compared to select the appropriate wavelet function for the application of WPE. Then the analyzed signal is decomposed using WPE and the energy of each decomposed signal is calculated and selected for signal reconstruction. Secondly, the reconstructed signal is analyzed by FK to select the best central frequency and bandwidth for the band-pass filter. Finally, the filtered signal is processed using the squared envelope frequency spectrum and compared with the theoretical fault characteristic frequency for fault feature extraction. The procedure and performance of the proposed approach are illustrated and estimated by the simulation analysis, proving that the proposed method can effectively extract the weak transients. Moreover, the analysis results of gearbox bearing and rolling bearing cases show that the proposed method can provide more accurate fault features compared with the individual FK method.
1. Introduction
The condition monitoring of rolling bearings is very important in ensuring the safety of the mechanical system as it is one of the basic components and widely applied in various rotating machines. The measured dynamic signal of bearing has the characteristics of non-linear and non-stationary with various background noise. Moreover, the original signal is too low in energy to extract fault characteristics. As a result, some progress has been made in the research of effective health monitoring for mechanical system and key components in recent years [1,2,3]. The vibration signal produced by the rotating machine contains significant information related to the state of the machine; therefore, the vibration-based analysis has been widely used as an effective method to identify the machine faults [4]. However, the measured vibration signal is consisted of stationary, non-stationary, and background noise. It is necessary to select appropriate signal processing technology to obtain effective fault features for rolling bearings fault detection [5,6,7].
In the fault diagnosis of rolling bearings, the analysis method based on the time domain and frequency domain are commonly used for stationary signal processing, and the time-frequency domain analysis method has been widely used to analyze the non-stationary signals for fault features extraction in both the time and frequency domains. The popular time-frequency analysis methods include short time Fourier transform (STFT), empirical mode decomposition (EMD), Wigner-Ville distribution (WVD), wavelet pack transform (WPT), etc. Although these methods have been widely used in fault detection, they also have their own shortcomings. For instance, the STFT cannot satisfy the localization of time and frequency at the same time. The WVD is affected by cross-interference items. The EMD can effectively decompose amplitude modulation signals into a series of intrinsic mode functions (IMFs), but it is easily affected by modal aliasing, which makes IMFs lose their specific physical meaning. Compared with the above-mentioned method, WPT can perform orthogonal decomposition on the signal of the whole frequency band to obtain more detailed and comprehensive information. Therefore, it has been widely used in fault diagnosis of gearboxes, rolling bearings, and rotors [8,9,10]. On the basis of WPT, wavelet packet energy (WPE) is an improved time-frequency analysis method which can get the energy change of the signal in each frequency band and then extract the characteristic frequency band signal to reflect the impact vibration phenomenon of bearing. In recent years, WPE has become a prevalent method in the field of machinery condition monitoring and fault diagnosis [11,12,13,14].
Spectra kurtosis (SK) is one of the effective approaches for transient signal enhancement. It was originally developed by Dwyer [15] to highlight the transient components. The spectra kurtosis method uses the properties of kurtosis, is very sensitive to the transient components in a signal, and can provide an index for indicating the frequency band for transient components extraction. The definition of the ‘‘kurtogram’’ was first introduced by Antoni [16]. The fast kurtogram (FK) overcomes the limitation of pre-determining the parameters for the band-pass filter and can optimize the parameters adaptively according to the characteristics of the analyzed signal. Therefore, FK has been favored in the field of rotating machinery fault detection, and has been widely adopted and developed in recent years. Smith et al. applied the FK to analyze the vibration signal obtained from a planetary gearbox test bench for detecting planet bearings faults [17]. He et al. proposed a new multi-faults detection method using the FK and Minimum entropy deconvolution (MED) to extract weak impulsive signal [18]. Zhang et al. presented an effective method for band-filter parameter optimization in rolling element bearing fault diagnosis based on the genetic algorithms and FK [19]. The above research shows that the FK can be applied to bearing fault diagnosis and extract the fault features effectively.
To effectively extract fault features from background noise, this paper proposes a hybrid method based on WPE and FK for bearing fault diagnosis. Firstly, in order to select the optimized wavelet packet basis function and obtain a reconstructed signal with sufficient fault information, various wavelet functions are compared and the energy distribution were analyzed. Secondly, FK analysis is carried out on the reconstructed signal to select the optimal center frequency and bandwidth of the band-pass filter. Finally, the filtered signal is processed with the square envelope spectrum, and the fault features are extracted for bearing fault detection. Compared with the conventional FK analysis, the diagnosis result shows that the proposed method not only can extract the fault characteristic frequency but also optimize the wavelet packet parameters. Therefore, the effectiveness of the proposed method in the fault diagnosis of rolling bearings is verified.
The remainder of this paper is outlined as follows. A brief review of the theoretical background of wavelet packet transform and fast kurtogram are presented in Section 2 and Section 3. In Section 4, the performance evaluation of the proposed method based on simulation study is introduced. The procedure of the proposed method is demonstrated in Section 5. Section 6 validates the practical applications of the detector via application case studies. Finally, conclusions are drawn in Section 7.
2. Wavelet Packet Transform
2.1. WPT
Compared with wavelet decomposition, wavelet packet (WPT) makes up for the shortcomings of high-frequency part decomposition of the measurement signal. It separates the frequency band of the signal in multiple levels and refines the fault features of the measurement signal in each frequency band [20,21]. Suppose the original signal is , then can be decomposed by wavelet packet as:
Among them, j represents the scale and l represents the translation factor. represents the basis function in , and represents the WPT coefficient. can be decomposed into and , namely:
where k represents the translation parameter; n represents the oscillation parameter.
2.2. Frequency Band Energy Feature Extraction
Suppose the highest frequency of the time signal is , and perform J-layer WPT decomposition on to get groups of WPT coefficients, respectively . The frequency band corresponding to these coefficients is .
Take the three-layer WPT as an example. First, find the signal energy of each frequency band. Suppose the corresponding energy of is , then:
Secondly, the feature vector is constructed with as the element:
When the signal energy is large, represents a large value, so it will bring certain difficulties in signal processing. Therefore, the feature vector T will be normalized:
Finally, get the normalized vector .
3. Kurtogram Calculation
Antoni clarified the theoretical basis of spectral kurtosis (SK) for diagnosing mechanical faults, and successfully applied the SK method in actual mechanical fault diagnosis [22]. Subsequently, some researchers combined SK with other methods for machinery fault detection and achieved certain results [23,24]. Considering the Wold-Cramer decomposition of non-stationary measurement signals, and define Y(t) as the system excited by the signal x(t), then can be presented as:
where is a spectral process, is the complex envelope of process under frequency . The SK using the fourth-order spectrum cumulate is defined as:
where indicates the instantaneous moment of order 2n, which can be expressed in Equation (8). It has the ability of presenting the complex envelope energy.
Hence the SK in the energy-normalized fourth-order spectral can be cumulated:
A simple model of the measured signal can be represented , is the measured vibration signal, is the random noise signal, and is the pure measurement signal. and are used to represent the measured vibration signal and the SK of the pure measurement signal respectively, then SK is written as
where represents the power spectral density (PSD) ratio of the noise to the actual vibration signal. It can be seen that and are approximately equal at frequencies with a large signal-to-noise ratio, and is approximately equal to zero at frequencies with strong random noise.
4. Simulation Analysis
4.1. Data Acquisition
The vibration signal of a bearing with incipient faults can be represented as an amplitude modulation model. Considering the random sliding process, the modeled vibration signal can be expressed in Equation (11):
where A = 1 is the amplitude of the modeled signal, = 900 is attenuation coefficient, = 100 Hz is the fault characteristic frequency, is the random fluctuation that occurs during the i-th impact. The sampling frequency of the data is 20 kHz, and the sampling points is 8192.
4.2. Optimization of the WPE Parameters
Figure 1 shows the waveform and the corresponding spectrum of the simulated outer race fault signals. It is not easy to recognize the fault features of the simulated signal from Figure 1.
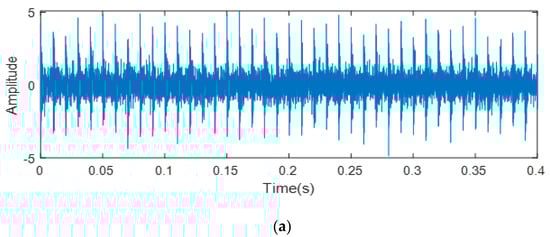
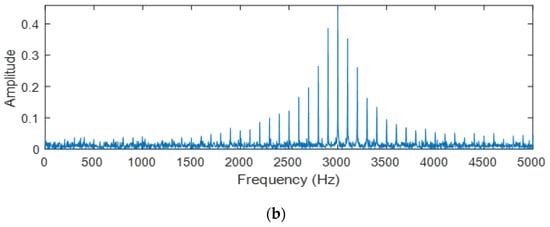
Figure 1.
Simulated signal of a faulty bearing: (a) waveform; (b) spectrum.
In order to get better wavelet packet parameters, firstly, select several commonly used wavelet packet parameters (i.e., db1, db3, db5, db7, db10, coif1, coif2, coif3, coif4, coif5, sym1, sym3, sym5, sym7, sym10) from Table 1. Then, decomposed, energy calculated and reconstructed by using the above 15 wavelet functions respectively. Secondly, the reconstructed signal is filtered using FK and the filtered signal is square envelope spectrum analysis. Then, compare the amplitude of square envelope spectrum to determine the optimal wavelet base in Figure 2. It can be seen that db1, coif2, and sym1 decomposition effect is better than others. To further select the wavelet function, the above three wavelet functions are compared as shown in Figure 3. It can be seen that the decomposition of db1 and sym1 are similar, better than coif2. Finally, due to the db1 and sym1 decomposition effect being similar, then select the wavelet function (i.e., db2, db3, db4, db5) and (i.e., sym2, sym3, sym4, sym5) for comparison. Figure 4a,b depict that decomposition of db2, db3 and sym2, sym3 show a similar effect; however, the magnitude of db4, db5 is greater than the magnitude of sym4, sym5 in Figure 4c,d. Therefore, wavelet function dbN decomposition is best.

Table 1.
Wavelet packet parameters.
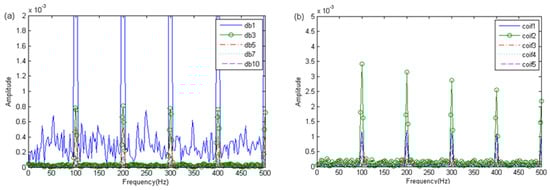
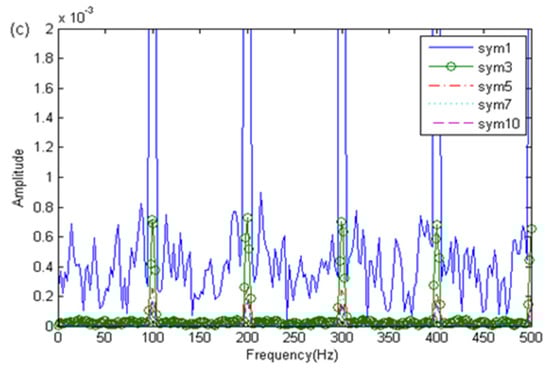
Figure 2.
The results of the envelope analysis: (a) dbN; (b) coifN; (c) symN.
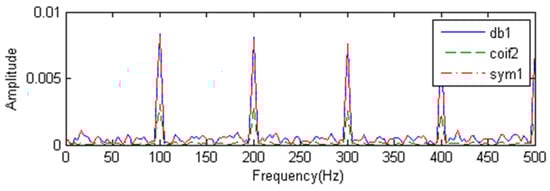
Figure 3.
The results of the envelope analysis.
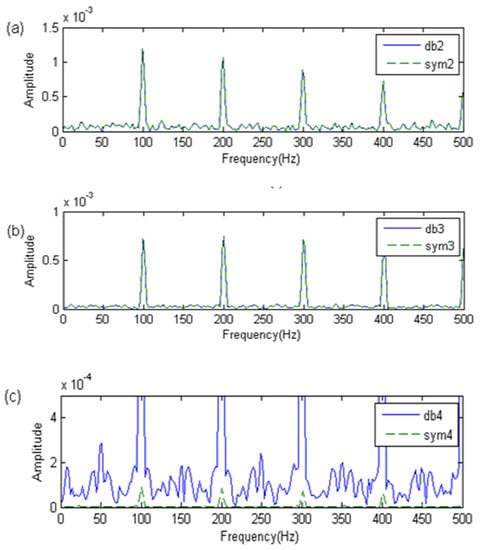
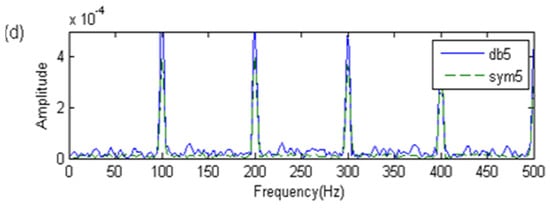
Figure 4.
The results of the envelope analysis: (a) db2,sym2; (b) db3,sym3; (c) db4,sym4; (d) db5,sym5.
The above concludes that the decomposition of wavelet function dbN is the best. However, the order of the wavelet packet is not determined. In this paper, we applied the FK to optimize the wavelet packet order. The FK of the reconstructed signal is depicted in Figure 5. It can be found that the center frequency of FK utilize db3 is located in the subspace the frequency band. Therefore, db3 is selected as the wavelet function.
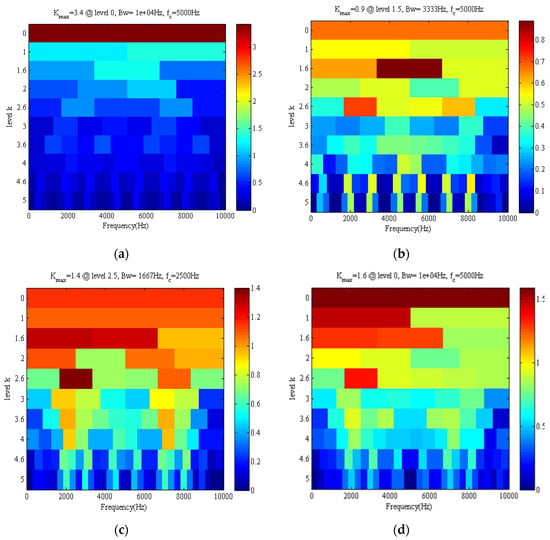
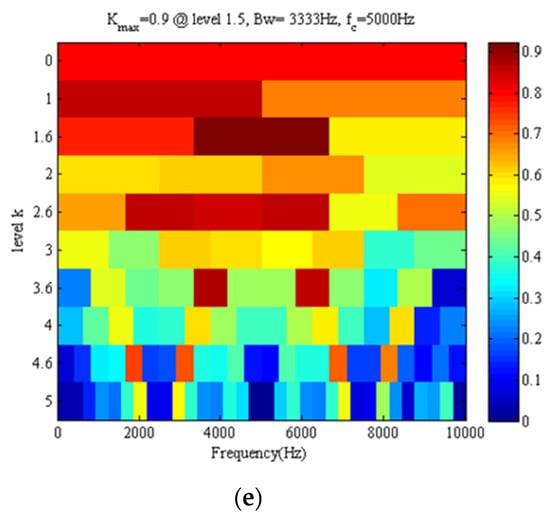
Figure 5.
The results of the fast kurtogram (FK) (a) db1; (b) db2; (c) db3; (d) db4; (e) db5.
4.3. Results and Analysis
The WPE method is utilized to extract the fault characteristics of the faulty signal. The wavelet function db3 is used, decomposition layers are selected to be 3, then 8 decomposition bands are generated and the frequency range of 3-layer wavelet packet displayed in Table 2. The proportional relationships of the energy bands are analyzed and calculated; the comparison result is illustrated in Figure 6 by histograms. It can be seen that the changes in the WPE distribution is presented in the node [3,2] and the node [3,3]. Figure 7 illustrated the results of the square envelope spectrum the proposed method, and represents the fault frequency of the bearing outer ring.
Table 2.
The frequency range of three layer wavelet packet decomposition.
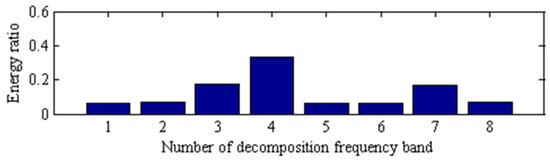
Figure 6.
Energy distribution proportional histogram of simulated signal.
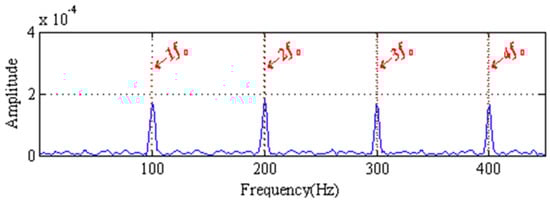
Figure 7.
The results of the proposed method.
5. The Flowchart of the Fault Diagnosis Method
This paper proposes a new method using wavelet packet energy (WPE) and fast kurtogram (FK). The specific diagnosis steps are as follows, and the basic process is shown in Figure 8.
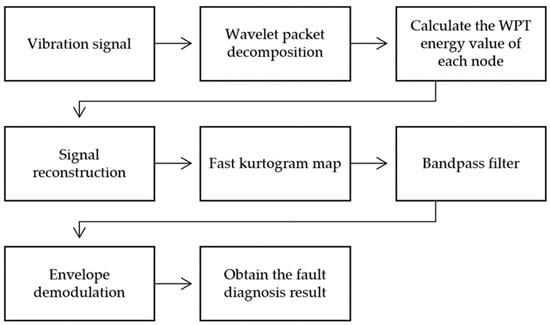
Figure 8.
Rolling bearing fault diagnosis flowchart.
- (1)
- By selecting the appropriate wavelet function and the number of decomposition layers, the measurement signal is decomposed by WPT and passed to obtain the WPT coefficient of each node;
- (2)
- Calculate the WPT energy value of each node;
- (3)
- Select the decomposed signal with the concentrated energy for reconstruction;
- (4)
- Calculate the SK map of the acquired reconstructed signal and select the center frequency and bandwidth corresponding to the maximum kurtosis value;
- (5)
- Filter the reconstructed signal using the optimized center frequency and bandwidth as the band-pass filter parameters;
- (6)
- Perform square envelope demodulation on the filtered signal to obtain the envelope spectrum of the signal;
- (7)
- Analyze the envelope spectrum to obtain the fault diagnosis result.
6. Experiments Validation
6.1. Data Acquisition
The first verification test case is fault detection for rolling bearing. The bearing test rig consists of a motor, coupling, intermediate shaft, supporting bearings, and electrical brake, as shown in Figure 9. A piezoelectric accelerometer was installed vertically on the drive end of the motor, and another piezoelectric accelerometer was positioned on the bearing housing with a sensitivity of 1.04 mV/ms2. The standard load of the bearing test rig is 680 Nm, and the final output speed is 388 rpm. Table 3 and Table 4 show the parameters of the experimental bearing, among them, , , and are the fault characteristic frequencies of the outer ring, inner ring, rolling element, and cage of the rolling element bearing, respectively.
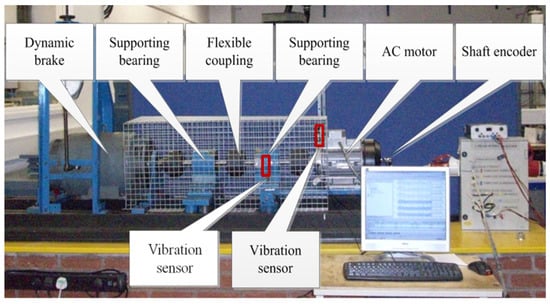
Figure 9.
The motor bearing test rig.
Table 3.
The parameters of the motor bearings.
Table 4.
Specifications of the supporting bearing.
6.2. Motor Bearing Fault Detection
Figure 10 shows the waveform and its frequency spectrum. It is not easy to identify the fault of rolling bearing from Figure 10. Thus, it is necessary to conduct further analysis.
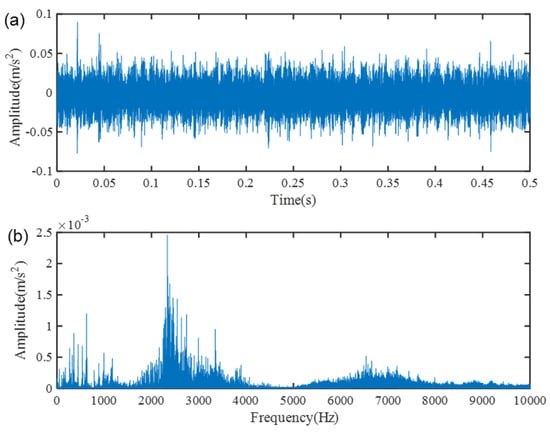
Figure 10.
The motor vibration signal: (a) waveform; (b) spectrum.
The proposed method is used to handle the measured signal of the gearbox bearing. In Figure 11, the changes in WPE distribution in the node [3,2] and the node [3,6] can be seen. Selecting the above two subspaces are applied as the eigenvalue of the outer race fault signals. To further prove the superiority of the proposed method, the individual FK method is applied for comparison. Figure 12 shows the analysis results of the proposed method and the individual FK method. Three obvious spectrum lines pointed at the characteristic frequencies of the bearing with outer race (i.e., , and ) can be recognized in Figure 12a. In contrast, although three harmonics of fault frequency (i.e., , , and ) can be identified in Figure 12b, the noise is significantly more than the proposed method. The experimental results demonstrated that the proposed method can obtain more accurate recognized result than the individual FK method for bearing outer race fault detection.
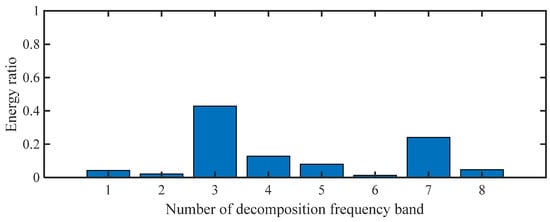
Figure 11.
Energy distribution proportional histogram of the vibration signal.
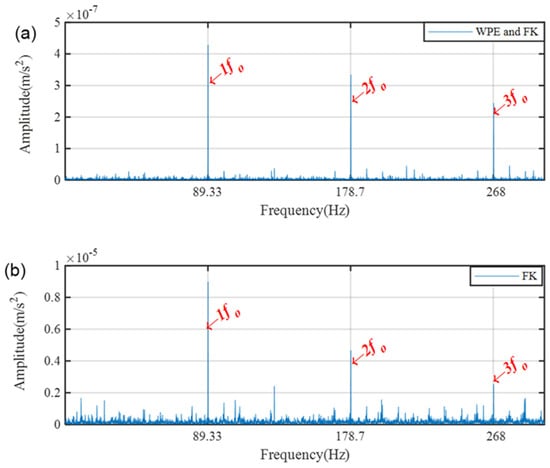
Figure 12.
The results of the motor bearing outer race fault vibration signal: (a) the proposed method; (b) individual FK method.
6.3. Supporting Bearing Fault Detection
Figure 13 depicts the waveform and spectrum. Evidently, the fault feature information is merged with random noise. Thus, the diagnosis is barely possible.
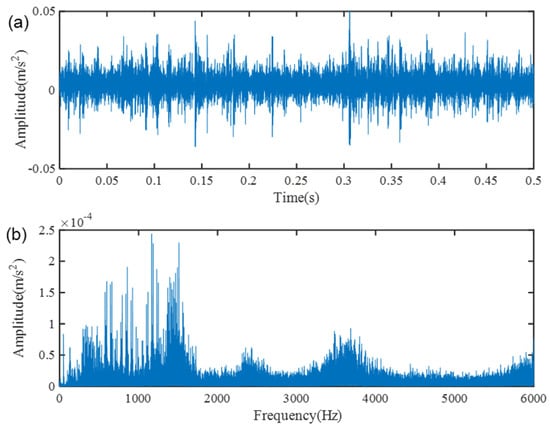
Figure 13.
The supporting bearing vibration signal: (a) waveform; (b) spectrum.
The proposed method is utilized to diagnosis the fault information. In Figure 14, the changes in WPE distribution in the node [3,4] and the node [3,5] are shown. Figure 15 illustrates the analysis results of the individual FK and the proposed method, respectively. It can be found from Figure 15a that the result presented obvious peaks reflected the supporting bearing fault and its harmonics. In Figure 15b, although the inner race fault frequency and its harmonics can be recognized, the signal-to noise ratio is poor. The comparison results show that the proposed method is more accurate than the individual FK method in supporting bearing fault diagnosis.
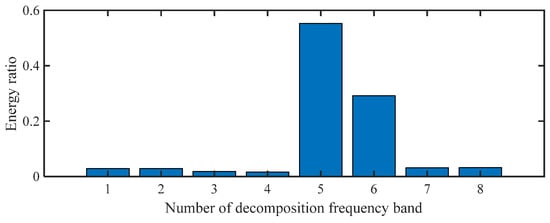
Figure 14.
Energy distribution proportional histogram of the vibration signal.
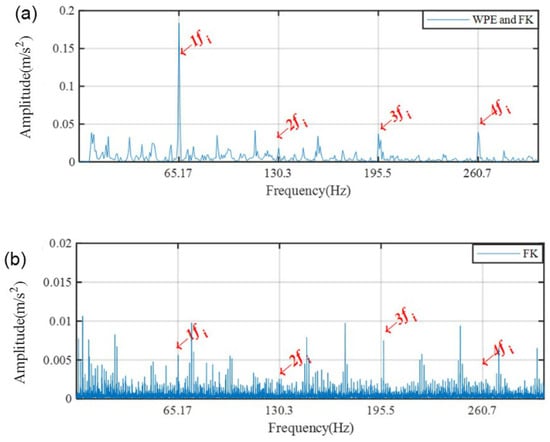
Figure 15.
The results of the supporting bearing inner race fault vibration signal: (a) the proposed method; (b) individual FK.
7. Conclusions
Aiming at the problem of energy concentration of faulty bearing vibration signals, this paper proposed a new method combining wavelet packet energy (WPE) and fast kurtogram (FK) to extract the transient signals. In the simulation analysis, the wavelet packet parameters were optimized by comparison analysis. And it is verified that the wavelet function of db3 can obtain better decomposition results than others. Through experiments, even both the proposed method and the individual FK method can obtain the bearing faults characteristic frequency, but it can be seen that the results of the proposed method significantly exceeds the results obtained by the individual FK method. In addition, the signal-to-noise ratio of the envelope spectrum obtained by the proposed method is much higher than that of the individual FK method. Therefore, the experiment results demonstrate that the proposed method outperforms the individual FK method. Furthermore, it can effectively solve the energy concentration problem in feature extraction for bearing fault.
Author Contributions
X.Z. and J.Z. conceived and wrote the paper; Y.W. and J.Z. analyzed the data; D.Z. and M.Z. proposed the analysis method and revised the manuscript. All authors have read and agreed to the published version of the manuscript.
Funding
This research was funded by the National Key Research and Development Project of China, grant number 2018YFB1309401.
Conflicts of Interest
The authors declare no conflict of interest.
References
- Li, Z.; Ming, A.; Zhang, W.; Liu, T.; Chu, F.; Li, Y. Fault feature extraction and enhancement of rolling element bearings based on maximum correlated kurtosis deconvolution and improved empirical wavelet transform. Appl. Sci. 2019, 9, 1876. [Google Scholar] [CrossRef]
- Zhang, X.; Wang, J.; Liu, Z.; Wang, J. Weak feature enhancement in machinery fault diagnosis using empirical wavelet transform and an improved adaptive bistable stochastic resonance. ISA Trans. 2019, 84, 283–295. [Google Scholar] [CrossRef] [PubMed]
- Cui, L.; Wang, X.; Wang, H.; Jiang, H. Remaining useful life prediction of rolling element bearings based on simulated performance degradation dictionary. Mech. Mach. Theory 2020, 153, 103967. [Google Scholar] [CrossRef]
- Lei, Y.; Liu, Z.; Lin, J.; Lu, F. Phenomenological models of vibration signals for condition monitoring and fault diagnosis of epicyclic gearboxes. J. Sound Vib. 2016, 369, 266–281. [Google Scholar] [CrossRef]
- Zhou, R.; Bao, W.; Li, N.; Huang, X.; Yu, D. Mechanical equipment fault diagnosis based on redundant second generation wavelet packet transform. Digit. Signal Process. 2010, 20, 276–288. [Google Scholar] [CrossRef]
- Guo, J.; Zhen, D.; Li, H.; Shi, Z.; Gu, F.; Ball, A. Fault detection for planetary gearbox based on an enhanced average filter and modulation signal bispectrum analysis. ISA Trans. 2020, 101, 408–420. [Google Scholar] [CrossRef]
- Cui, L.; Wang, X.; Wang, H.; Ma, J. Research on remaining useful life prediction of rolling element bearings based on time-varying Kalman filter. IEEE Trans. Instrum. Meas. 2020, 69, 2858–2867. [Google Scholar] [CrossRef]
- Xing, Y.; Wang, Y.; Shi, L.; Guo, H.; Chen, H. Sound quality recognition using optimal wavelet-packet transform and artificial neural network methods. Mech. Syst. Signal Process. 2015, 66. [Google Scholar] [CrossRef]
- Mavaddaty, S.; Ahadi, S.M.; Seyedin, S. Speech enhancement using sparse dictionary learning in wavelet packet transform domain. Comput. Speech Lang. 2017, 44, 22–47. [Google Scholar] [CrossRef]
- Xu, X.; Luo, M.; Tan, Z.; Pei, R. Echo signal extraction method of laser radar based on improved singular value decomposition and wavelet threshold denoising. Infrared. Phys. Tech. 2018, 92, 327–335. [Google Scholar] [CrossRef]
- Bianchi, D.; Mayrhofer, E.; Gröschl, M.; Betz, G.; Vernes, A. Wavelet packet transform for detection of single events in acoustic emission signals. Mech. Syst. Signal. Process. 2015, 64, 441–451. [Google Scholar] [CrossRef]
- He, Q. Vibration signal classification by wavelet packet energy flow manifold learning. J. Sound Vib. 2013, 332, 1881–1894. [Google Scholar] [CrossRef]
- Han, L.; Li, C.; Guo, S.; Su, X. Feature extraction method of bearing AE signal based on improved FAST-ICA and wavelet packet energy. Mech. Syst. Signal Process. 2015, 62, 91–99. [Google Scholar] [CrossRef]
- Hoseinzadeh, M.S.; Khadem, S.E.; Sadooghi, M.S. Quantitative diagnosis for bearing faults by improving ensemble empirical mode decomposition. ISA Trans. 2018, 83, 261–275. [Google Scholar] [CrossRef]
- Dwyer, R. Detection of non-gaussian signals by frequency domain kurtosis estimation. In Proceedings of the IEEE International Conference on Acoustics Speech and Signal Processing, Boston, MA, USA, 14–16 April 1983; Volume 8, pp. 607–610. [Google Scholar]
- Antoni, J. Fast computation of the kurtogram for the detection of transient faults. Mech. Syst. Signal. Process. 2007, 21, 108–124. [Google Scholar] [CrossRef]
- Smith, W.A.; Fan, Z.; Peng, Z.; Li, H.; Randall, R.B. Optimised spectral kurtosis for bearing diagnostics under electromagnetic interference. Mech. Syst. Signal Process. 2016, 75, 371–394. [Google Scholar] [CrossRef]
- He, D.; Wang, X.; Li, S.; Lin, J.; Zhao, M. Identification of multiple faults in rotating machinery based on minimum entropy deconvolution combined with spectral kurtosis. Mech. Syst. Signal Process. 2016, 81, 235–249. [Google Scholar] [CrossRef]
- Zhang, Y.; Randall, R.B. Rolling element bearing fault diagnosis based on the combination of genetic algorithms and fast kurtogram. Mech. Syst. Signal Process. 2009, 23, 1509–1517. [Google Scholar] [CrossRef]
- Guo, J.; Zhen, D.; Li, H.; Shi, Z.; Gu, F.; Ball, A. Fault feature extraction for rolling element bearing diagnosis based on a multi-stage noise reduction method. Measurement 2019, 139, 226–235. [Google Scholar] [CrossRef]
- Mishra, C.; Samantaray, A.K.; Chakraborty, G. Rolling element bearing fault diagnosis under slow speed operation using wavelet de-noising. Measurement 2017, 103, 77–86. [Google Scholar] [CrossRef]
- Antoni, J. The spectral kurtosis: A useful tool for characterising non-stationary signals. Mech. Syst. Signal Process. 2006, 20, 282–307. [Google Scholar] [CrossRef]
- Miao, Y.; Zhao, M.; Lin, J. Improvement of kurtosis-guided-grams via Gini index for bearing fault feature identification. Meas. Sci. Technol. 2017, 28, 1–14. [Google Scholar] [CrossRef]
- Ren, Y.; Li, W.; Zhang, B.; Zhu, Z.; Jiang, F. Fault diagnosis of rolling bearings based on improved kurtogram in varying speed conditions. Appl. Sci. 2019, 9, 1157. [Google Scholar] [CrossRef]


Publisher’s Note: MDPI stays neutral with regard to jurisdictional claims in published maps and institutional affiliations. |
© 2020 by the authors. Licensee MDPI, Basel, Switzerland. This article is an open access article distributed under the terms and conditions of the Creative Commons Attribution (CC BY) license (http://creativecommons.org/licenses/by/4.0/).