Abstract
Geopolymer concrete offers a favourable alternative to conventional Portland concrete due to its reduced embodied carbon dioxide (CO2) content. Engineering properties of geopolymer concrete, such as compressive strength, are commonly characterised based on experimental practices requiring large volumes of raw materials, time for sample preparation, and costly equipment. To help address this inefficiency, this study proposes machine learning-assisted numerical methods to predict compressive strength of fly ash-based geopolymer (FAGP) concrete. Methods assessed included artificial neural network (ANN), deep neural network (DNN), and deep residual network (ResNet), based on experimentally collected data. Performance of the proposed approaches were evaluated using various statistical measures including R-squared (R2), root mean square error (RMSE), and mean absolute percentage error (MAPE). Sensitivity analysis was carried out to identify effects of the following six input variables on the compressive strength of FAGP concrete: sodium hydroxide/sodium silicate ratio, fly ash/aggregate ratio, alkali activator/fly ash ratio, concentration of sodium hydroxide, curing time, and temperature. Fly ash/aggregate ratio was found to significantly affect compressive strength of FAGP concrete. Results obtained indicate that the proposed approaches offer reliable methods for FAGP design and optimisation. Of note was ResNet, which demonstrated the highest R2 and lowest RMSE and MAPE values.
1. Introduction
Emission of carbon dioxide caused by various sectors, including construction, industrial processes, transport, residential, and agriculture, has emerged as a severe problem that dramatically affects global climate change. Calcining limestone in Portland cement production represents 8% of global anthropogenic CO2 emission [1]. Global production of cement increased rapidly from 1.5 billion tonnes in 1998 [2] to 4.1 billion tonnes in 2018 [3], which has significantly impacted emissions linked to the construction sector. This justifies the need for more sustainable alternatives sourced from industrial by-products/wastes with minimal embodied carbon, offering a balance of technical, environmental, and economic benefits.
In this context, geopolymer concrete using industrial by-products (e.g., fly ash and ground-granulated blast-furnace slag) has been reported to reduce up to 80% of CO2 emission relative to conventional concrete [4]. Geopolymer products are synthesised through the reaction of alkali liquid with silica and alumina contained in aluminosilicate precursors. Depending upon local resources, solid aluminosilicate precursors can be sourced from industrial by-products such as fly ash, metakaolin, red mud, and waste glass [5,6,7,8]. According to previous studies [9,10,11,12,13], fly ash-based geopolymer (FAGP) concrete showed the ability to achieve high compressive strengths up to 68 MPa. To assess the compressive strength of concrete, universal compression testing machines are typically used to apply compression load on cylindrical or cube specimens at a prescribed rate (e.g., 20–50 psi/s or 0.14–0.35 MPa/s based on American Society for Testing and Materials (ASTM) C39/C39M-18 [14]). In addition to direct testing, non-destructive testing methods, such as ultrasonic pulse velocity and rebound hammer, are also used to predict the compressive strength of concrete products [15,16,17]. However, these experimental methods rely heavily on costly equipment and time-consuming preparation of specimens.
As such, artificial intelligence approaches including artificial neural network, adaptive neuro fuzzy inference, and deep learning have been employed to predict the mechanical properties of FAGP concrete by several researchers [18,19,20,21]. Inspired by the biological neural system, the artificial neural network (ANN) algorithm with three neuron layers has been widely applied in different research fields such as civil engineering, biochemistry, pharmaceutics, and biology owing to its ability to learn complex relationships among values in its training patterns. Dao et al. [19] investigated the compressive strength of FAGP concrete consisting of steel slag aggregates using ANN and neuro fuzzy inference approaches. Mean absolute error, R-squared, and root mean square error (RMSE) were employed to evaluate the performance of the proposed approaches. Three input parameters including sodium hydroxide (NaOH) concentration, alkali activator/fly ash ratio, and sodium hydroxide-to-sodium silicate ratio were used to predict the compressive strength of FAGP concrete. Results obtained from the ANN were in substantial agreement with experiment data. Sensitivity analysis for ANN and adaptive neuro fuzzy inference were adopted in a study by the same authors [18] to evaluate the impact of each input factor including the mass of fly ash, sodium silicate (Na2SiO3), NaOH, and water on the accuracy of the proposed models. The two approaches effectively predicted the compressive strength of the geopolymer concrete using only three input parameters in the mixture proportion. Curing condition factors were neglected in these studies even though they undoubtedly play essential roles in the compressive strength of geopolymer concrete [22,23,24,25]. In addition to mixture proportion factors, curing time and temperature values were added in the training dataset for compressive strength prediction of FAGP concrete using ANN in a study by Ling et al. [21]. Results from ANN modelling methods showed good agreement with those obtained from experiments. The authors concluded that compressive strength of geopolymer concrete was profoundly influenced by mixture proportion and curing conditions. Performance of deep neural network (DNN) and deep residual network (ResNet) approaches in predicting the compressive strength of FAGC was investigated in a study by Nguyen et al. [20]. With high rate of recognition accuracy within a complex network, the ResNet model showed better performance than the DNN models, with two main forward and backward passes; therefore, it has been used in several advanced engineering problems [26,27]. ResNet and DNN approaches were also employed to predict compressive strength of conventional and foamed concrete in the studies by Jang et al. [28] and Nguyen et al. [29], respectively. Against this background, current solutions to predict compressive strength of FAGP concrete have not been dealt with in depth within existing literature. Although various machine learning approaches including ANN and DNN have been separately introduced in several studies [19,21] as numerical predictors for FAGP strength, a thorough search of relevant published literature yielded a mere presence of the ResNet approach in FAGP property prediction. The lack of studies on impacts of input parameters (e.g., mix proportion ratios, NaOH concentration, and curing conditions) on geopolymer strength indicates possible improvements for upcoming research. More comprehensive research needs to be carried out to investigate the effectiveness of various machine learning methods in predicting compressive strength of FAGP concrete, considering a wider variety of input parameters and sensitivity analysis.
As such, this study aims to offer advancements to the existing literature by employing ANN, DNN, and ResNet approaches integrated with sensitivity analysis to predict the compressive strength of FAGP concrete. These models were trained through 263 pairs of input/target values obtained from experiments. Performance of FAGP strength prediction of the three proposed approaches was investigated in two phases. In the first phase, the models were trained and validated using randomly shuffled datasets. Additional training and assessment under K-fold cross validation schemes were then carried out to confirm the results obtained from the first phase. Impacts of six input parameters (including NaOH/Na2SiO3 ratio, fly ash/aggregate ratio, alkali liquid/fly ash ratio, NaOH concentration, curing time, and temperature) on prediction models were investigated using sensitivity analysis. Outcomes from sensitivity analysis are expected to identify the critical input parameters in FAGP strength prediction and control them carefully during geopolymer production. Three measures including R-squared (R2), root mean square error (RMSE), and mean absolute percentage error (MAPE) were employed to evaluate the accuracy of the proposed machine learning techniques.
2. Machine Learning Approaches
2.1. Artificial Neural Network (ANN)
Inspired by the biological neuron system, ANN is based on a suite of mutually connected units, known as perceptrons, which replicate the functions of neurons in the human brain. ANN is one of the main models used in machine learning where its structure is formed by three layers of neurons including input, hidden, and output layers. Independent variables enter the system through the input layer and are processed in the hidden layer, while predicted values are generated in the output layer. Figure 1 presents the basic concept of ANN.
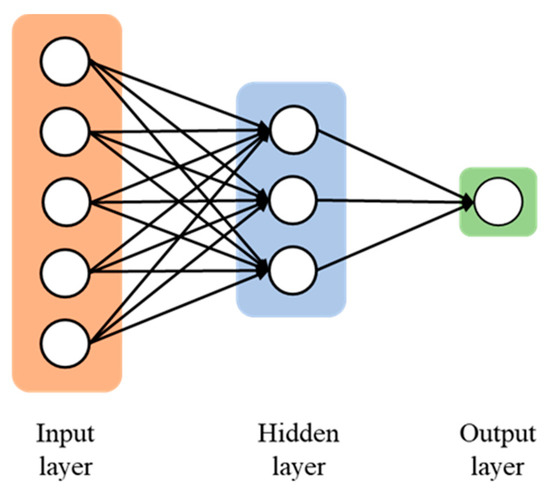
Figure 1.
The construction of the artificial neural network (ANN) [20].
2.2. Deep Neural Network (DNN)
DNN consists of more layers and neurons than ANN, leading to its ability to learn functions with a high degree of complexity. DNN possesses a powerful representational ability of input data and can reduce over-fitting issues in regression performance [30]. With powerful representational ability, DNN is able to achieve high accuracy in various tasks [31]. A typical DNN network structure is presented in Figure 2, including two main forward and backward phases.
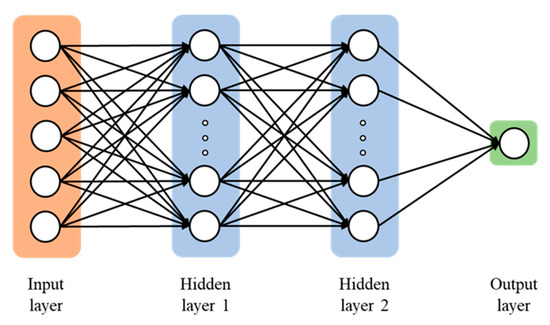
Figure 2.
Deep neural network (DNN) with two hidden layers [20].
2.3. Deep Residual Network (ResNet)
ResNet was developed to overcome a limitation in training deep networks where training errors can increase as the number of layers increases [20]. Owing to modified architectures, ResNet models have been empirically confirmed to enhance learnability of neural networks with less error on defined tasks using a limited number of layers [32]. ResNet consists of residual blocks with shortcut connections as shown in Figure 3, where the formulation H(x) is the desired mapping output of a specific layer and x is the input data. Given the presence of shortcut connections, gradient-based optimisation algorithms work effectively under ResNet-based architectures and improve the learnability of weight layers representing the function F(x) [33].
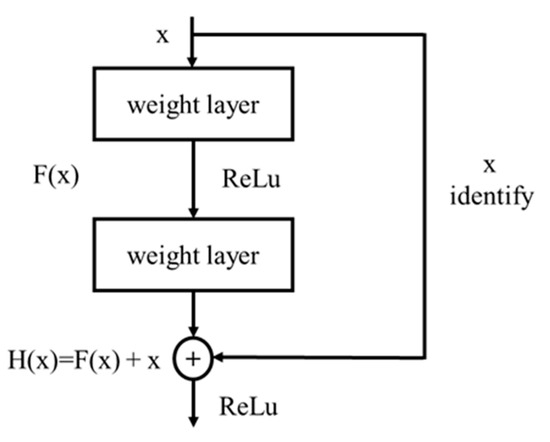
Figure 3.
A block in a deep residual network [20].
3. Experimental Programme
3.1. Materials and Mixing Process
Constituent materials of the FAGP concretes considered were fly ash, coarse and fine aggregates, alkali activator, and water. Low-calcium fly ash (class F) with a specific gravity of 2500 kg/m3 was used as the main aluminosilicate precursor. The chemical composition of the fly ash used is presented in Table 1, which conforms to requirements from ASTM 618 [ASTM]. The FAGP concrete mix designs and mixing processes were based on a previous study by Nguyen et al. [20]. Geopolymer mix designs were formulated based on various binder and aggregate contents, concentration of sodium hydroxide, and curing conditions. The ratio of fly ash mass to total aggregate mass (fly ash/aggregate) varied from 0.13–0.37. Specific gravities of the coarse and fine aggregates were 2700 kg/m3 and 2650 kg/m3, respectively.

Table 1.
Chemical compositions of fly ash class F.
Sodium silicate solution consisting of 36% Na2O and 38% SiO2 by mass was mixed with sodium hydroxide with a wide range of concentrations including 4M, 8M, 11M, 12M, 15M, and 18M to prepare alkali liquid (AL). The ratios of NaOH/Na2SiO3 and AL/fly ash ranged from 0.4–2.5 and 0.3–0.7, respectively.
Fly ash and aggregates were mixed together on a slow setting for about three minutes. Alkali solution was then added and mixed for a further four minutes before casting. Fresh FAGP concrete was cast in standard cylinder moulds (100 mm diameter, 200 mm high), de-moulded after 24 h, and then cured in an oven at temperatures 40, 60, 80, 90, 100, and 120 °C for 2, 4, 6, 8, 10, and 12 h. The processing and testing procedure is represented in Figure 4.
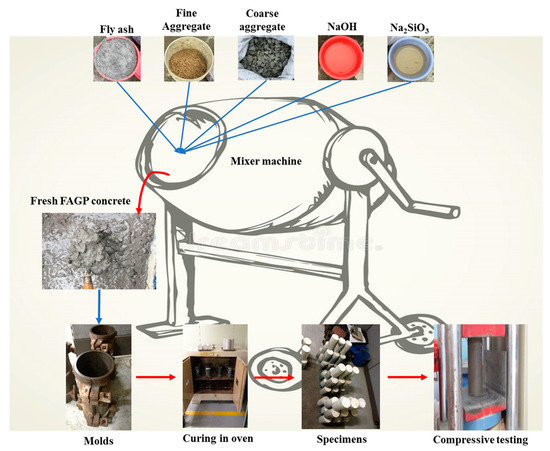
Figure 4.
Schematic illustration of experimental works.
3.2. Data Preparation for Machine Learning Approaches
According to previous studies [10,22,34], FAGP concrete properties depend on constituent material proportioning, concentration of sodium hydroxide (CM), and curing conditions. In this study, a total of 263 pairs of input/target values fabricated from different geopolymer mix proportions, NaOH concentration, and curing conditions were designed to generate the data for running the machine learning-based models. Inside these models, the six input variables considered to estimate the compressive strength of FAGP concrete were: NaOH/Na2SiO3, fly ash/aggregate and AL/fly ash, CM, curing time, and curing temperature. For compressive strength measurement, FAGP concrete cylinders were subjected to axial compression with a loading rate of up to 0.35 MPa/s according to ASTM C39/C 39M-18 [14] after seven days. At least three specimens were tested for each mix design of FAGP concrete to obtain the mean value of the compressive strength. The test data from experimental works are given in Table 2.
Table 2.
Statistical parameters of fly ash-based geopolymer (FAGP) concrete used in the training dataset.
4. Research Methodology
In this study, 263 datasets (each comprising six inputs and one output) were used to train and validate ANN, DNN, and ResNet models. In terms of inputs, each dataset comprised a unique combination of the six mix design values considered, as summarised in Table 2. The output for each dataset was the corresponding average compressive 7-day strength result obtained from experimental testing. The range of strength values recorded for the 263 combinations considered was 5.55–67.86 MPa.
A data division scheme was applied to reduce possibilities of error and improve the reliability of predicted results. Random selection of about 90% of the values (235 datasets) in the training dataset were chosen from the original data collection to train the network, while the remaining values (28 datasets) remained untrained as a validation database to confirm the accuracy of the trained network. The structures of three machine learning approaches including ANN, DNN, and ResNet are presented in the schematic flowchart in Figure 5.
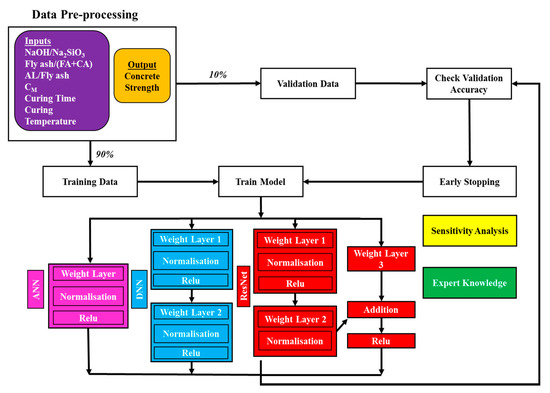
Figure 5.
Schematic flowchart presenting the three machine learning approaches used to estimate FAGP concrete compressive strength.
FAGP concrete compressive strength was predicted by employing ANN, DNN, and ResNet architectures comprising weight, normalisation, and activation layers in regression tasks. For comparative purposes, DNN and ResNet models consisted of the same number of nodes with 128 nodes in Weight Layer 1 and 256 nodes in Weight Layer 2. A layer with 256 nodes, known as Weight Layer 3, was included to enable additional operation at the end of ResNet implementation. The ANN model with one weight layer comprised 384 nodes. One of the stochastic gradient descent methods, known as Adam [35], was used as the optimisation method to update neural networks coefficients since it integrated advanced features from different optimisation algorithms, including AdaGrad and RMSProp. The layer normalisation method introduced by Ba et al. [36] was employed to ensure inputs to layers fell within specific ranges since it exhibited efficient training time in neural network architecture compared to traditional batch normalisation. Training models without normalisation were also carried out to validate the effectiveness of the model integrated with layer normalisation. During the training process, dropping out units with keep probability of 0.2 in the architectures were included in the final models to prevent overfitting problems. Table 3 presents details of the setting of six architectures (known as architectures 1–6) implemented in this study.
Table 3.
Details of the setting of six investigated architectures from artificial neural network (ANN), deep neural network (DNN) and deep residual network (ResNet).
Three statistical measures including R2, RMSE, and MAPE were applied to evaluate the accuracy of the proposed machine learning approaches under the K-fold cross validation scheme. These parameters provide insights into differences between original and estimated values. Higher R2 value and/or lower MAPE and RMSE values indicate better prediction performance of machine learning approaches [19]. The three statistical measures were calculated using the following equations:
where and are the compressive strength obtained from experiments and predictions respectively; is the number of datasets.
The K-fold cross validation method divides data into K equal folds and then does K independent training iterations on the prediction model with (K − 1) folds while leaving the remaining fold for validation purposes. In this experiment, the common value K = 10 was used. The performance of the prediction model was judged by averaging the metric measurement (R2, MAPE, and RMSE) measured in K training and evaluating the iterations as follows:
where MK-fold denotes a general metric measurement when K-fold cross validation is applied, and mk is the metric measurement in the fold k of the procedure.
An important note is that the same training and validation sets in each fold were used to train and validate each model. A hypothesis test (e.g., paired t-test) with a significance level α = 0.05 was then applied to the accurate measurements of each model on validation sets in 10 divided folds to confirm the statistical significance of the results. The null hypothesis was that these measurements are all in the same population (or belong to the same model), suggesting there is no difference between the performance of two evaluated models. From the t-test, a p-value less than the chosen significance level (α = 0.05) can statistically confirm the advance of a prediction model over the others (rejecting the null hypothesis), while the p-value greater than this significance level may suggest that the event, or the numerical conclusion, happens by chance (not rejecting the null hypothesis).
5. Experimental Programme
5.1. Estimative Performance of ANN, DNN, and ResNet Approaches
In the first phase, six predictive models based on three proposed machine learning approaches (ANN, DNN, and ResNet) were trained and validated using randomly shuffled datasets obtained from experimental works. Input variables in the dataset consisted of six parameters including mixture proportions (i.e., NaOH/Na2SiO3, fly ash/aggregate, AL/fly ash), NaOH concentration, and curing conditions. Compressive strength of FAGP specimens was regarded as output variable. The results from the first phase were aimed to provide a short list of models to further test with K-fold cross validation and the t-test method as described in Section 4.
R2, RMSE, and MAPE values for the ANN (architecture 1 and 2), DNN (architecture 3 to 4), and ResNet (architecture 5 to 6) models are summarised in Table 4, with the bold numbers representing the best predictive model of each approach. As shown, architectures 1, 3, and 6 were found to be the best ANN, DNN, and ResNet models, respectively. From the six architectures presented in Table 4, ResNet-based architecture 6 was the best model for determining FAGP concrete compressive strength with the highest R2 of 0.937 and lowest RMSE and MAPE values (1.987 and 6.6, respectively). Apart from the ResNet models, ANN-based architecture 1 (R2 = 0.889; RMSE = 4.711; MAPE = 14.06) and DNN-based architecture 3 (R2 = 0.898; RMSE = 2.521; MAPE = 9.496) showed better predictive performance than the other models (architecture 2, 4, and 5). Based on these observations, ANN-based architecture 1, DNN-based architecture 3, and ResNet-based architecture 6 were selected for further investigation.
Table 4.
Performance comparison of six architectures for FAGP compressive strength prediction in terms of R-squared (R2), root mean square error (RMSE) and mean absolute percentage error (MAPE).
In the second phase, further investigation into performance of the proposed approaches was carried out using additional training and assessment under a 10-fold scheme with three architectures: 1, 3, and 6. Results of various statistic measures (R2, MAPE, and RMSE) for each fold and the average (Avg.) values with standard deviations are presented in Table 5. The same training and validation sets of each fold were applied for the three models 1, 3, and 6. As shown in this table, ResNet-based architecture 6 obtained the best strength prediction performance in terms of R2 (0.934 ± 0.021), RMSE (2.750 ± 0.573), and MAPE (8.552 ± 1.333. Also, a further paired t-test with α = 0.05 was applied to prove the statistical significance of this observation. As presented in Table 6, p-values from the comparisons of ResNet model and ANN/DNN models were lower than the chosen significance level (α = 0.05), providing statistical confirmation that the ResNet model out-performed the ANN/DNN model in terms of FAGP strength prediction.
Table 5.
Accuracy measurements on validation sets for the proposed machine learning approaches (architectures 1, 3, and 6) under K-fold cross validation scheme.
Table 6.
Paired t-test for statistical significance between ResNet and ANN-based models (architecture 6 and 1) and between ResNet and DNN-based models (architecture 6 and architecture 3).
Relationships between the experimental and predicted strength values from architectures 1, 3, and 6 are illustrated in Figure 6. As shown, compressive strength values predicted by all machine learning models were close to the actual values obtained from compression experiments, indicating that the proposed approaches were successfully trained to predict FAGP compressive strength. The ResNet model outperformed the other models with the strongest relationship existing between actual and predicted values. This observation was confirmed in Figure 7, which presents the correlation coefficient (R) of the three approaches in terms of validation data. Minimal variation existed between actual and predicted values existed for the ANN, DNN, and ResNet models, albeit with the highest variance being associated with the former (architecture 1).
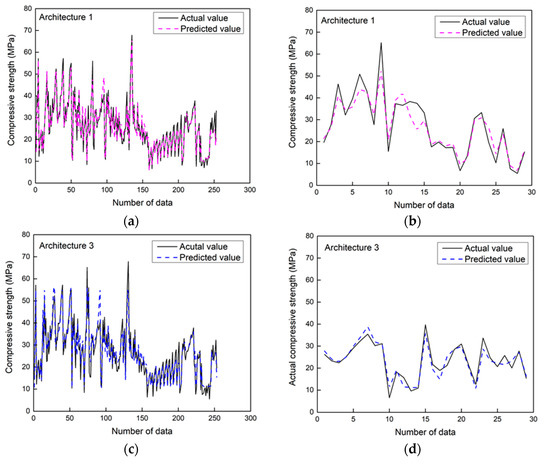
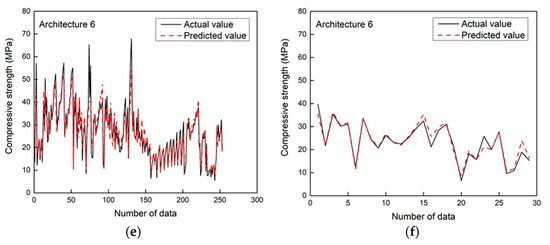
Figure 6.
Relationship between compressive strength values obtained from experiments (actual value) and machine learning approaches (predicted value): (a) training ANN; (b) validation ANN; (c) training DNN; (d) validation DNN; (e) training ResNet; (f) validation ResNet.
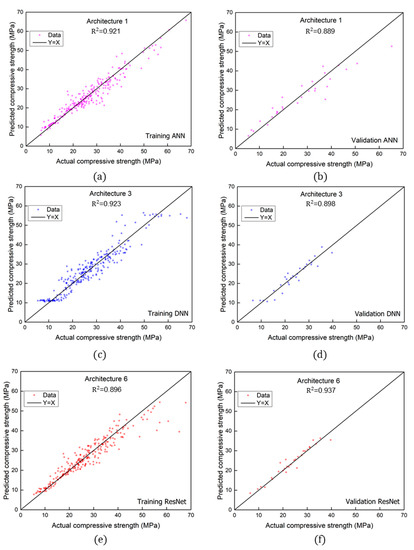
Figure 7.
Correlation coefficients R of three proposed approaches: (a) training ANN; (b) validation ANN; (c) training DNN; (d) validation DNN; (e) training ResNet; (f) validation ResNet.
The relationship between iterations of the three best performed architectures (1, 3, and 6) and validation RMSE is shown in Figure 8. The highest convergence speed was observed in ResNet-based architecture 6 model, which required only 2000 iterations to reach a validation RMSE of 4.8 MPa. For the same RMSE, higher iteration numbers of 6000 and 148,000 were required for DNN and ANN models, respectively. After convergence, sufficiently low values of RMSE were observed in the ResNet and DNN models, indicating better performances over the ANN model. For instance, at the same iteration value of 152,000, the ANN model converged at an RMSE of 4.7 MPa while ResNet and DNN models achieved lower values of RMSE (2.1 MPa and 2.7 MPa, respectively).
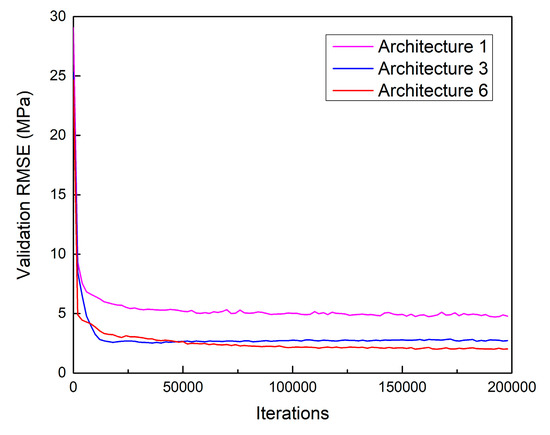
Figure 8.
Relationship between validation RMSE and iterations.
Figure 9 presents the distribution of error rates at 5% increments for predicted results obtained from architectures 1, 3, and 6. It is noted that the majority of datasets (61%) from the ResNet model exhibited error levels less than 5%. Corresponding frequencies of errors less than 5% for the ANN and DNN models were significantly lower (approximately 21 and 35%, respectively). In terms of errors less than 20%, frequencies for the ANN, DNN, and ResNet models were 79, 89, and 89%, respectively. In terms of ranking, therefore, the ResNet model provided the best estimative performance, followed by the DNN and ANN models.
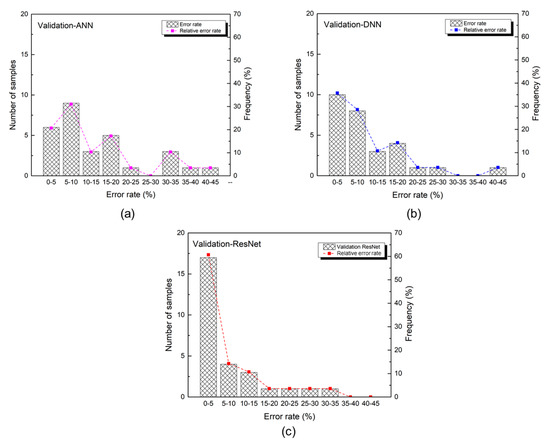
Figure 9.
Error rate distribution of three proposed approaches: (a) validation ANN; (b) validation DNN; (c) validation ResNet.
5.2. Sensitivity Analysis
Sensitivity analysis is commonly used to evaluate how input parameters affect output variation derived by machine learning models [37]. As the best performing model, ResNet-based architecture 6 was exclusively selected for this analysis, which involved calculating FAGP concrete compressive strength by changing one input variable at a time while maintaining the other five as constants based on their mean values. For example, to assess the importance of the NaOH/Na2SiO3 ratio, this value was varied from 0.4–2.5, while fly ash/aggregate, AL/Fly ash, NaOH concentration, curing time, and temperature values were kept constant at mean values of 0.23, 0.5, 14 (M), 8 h, and 85.6 °C, respectively. Data derived from this sensitivity analysis were returned to the training process to estimate compressive strength. For each parameter, a corresponding sensitivity analysis factor was given by the expression:
where fmax(xi) and fmin(xi) are the maximum and minimum estimated compressive strengths relating to the input variable xi, with all other input parameters kept constant at their mean values.
Figure 10 shows the results of this sensitivity analysis, from which a pronounced influence (35.5%) of fly ash/aggregate ratio on estimated compressive strength can be seen. A similar effect was observed in the study by Joseph and Mathew [11], and can be explained by the fact that the internal void structure formed by fly ash and aggregates has direct effects on FAGP compressive strength. Additionally, shown in this figure are high sensitivity scores of 16.22%, 16.18%, and 14.93% for curing time, NaOH concentration, and curing temperature, respectively. This confirms the observations from previous studies by [22,23] where curing conditions play significant roles in compressive strength of FAGP concrete. As such, various factors such as mix proportions, sodium hydroxide concentration, and curing regimes should be thoroughly considered in the prediction of FAGP mechanical properties using machine learning approaches. In particular, based on these findings, it is recommended that the fly ash/aggregate ratio is carefully determined and controlled in geopolymer manufacturing processes owing to its pronounced effect on FAGP strength.
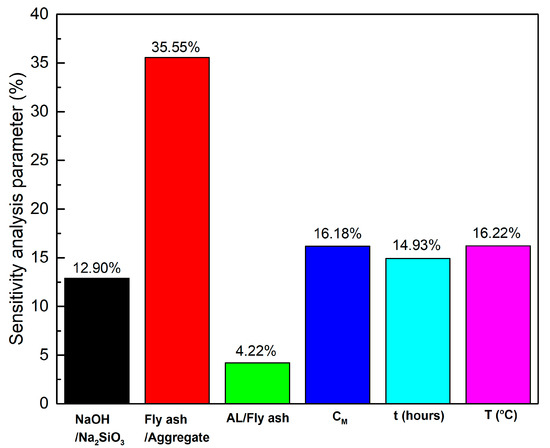
Figure 10.
Sensitivity analysis parameters for the estimated compressive strength of FAGP concrete.
6. Conclusions
This study employed three different machine learning approaches including ANN, DNN, and ResNet to predict compressive strength of fly ash-based geopolymer concrete. Six parameters of mix design and curing conditions (including NaOH/Na2SiO3, fly ash/aggregate, AL/Fly ash, concentration of sodium hydroxide, curing time, and temperature) and corresponding 7-day compressive strength results were used to generate 263 unique input/output pairs for model training purposes.
While the results indicated that all three machine learning approaches could predict FAGP concrete compressive strength with some degree of accuracy, the ResNet model was the most promising method with the highest R2 (0.937) and the lowest RMSE (1.987) and MAPE (6.6) values. This observation was confirmed by additional training and assessment under the K-fold cross validation scheme and paired t-test with α = 0.05, where the highest R2 (0.934 ± 0.021) and the lowest RMSE (2.750 ± 0.573) and MAPE (8.552 ± 1.333) were observed in the ResNet-based model. Sensitivity analysis performed for the ResNet model confirmed that the ratio of fly ash/aggregate was the most dominant factor when predicting compressive strength, with a sensitivity analysis score of 35%. This was followed in order of importance by curing temperature (16.22%), NaOH concentration (16.18%), curing time (14.93%), NaOH/Na2SiO3 ratio (12.90%), and AL/fly ash ratio (4.22%). This analysis indicates the importance of considering a wide range of input parameters in the prediction of FAGP concrete compressive strength and controlling them carefully during the manufacturing process.
This study provides a detailed understanding of performance of different machine learning approaches in strength prediction for FAGP concrete. The findings highlight potential uses of the proposed machine learning approaches such as ResNet and DNN as effective tools to, not only precisely predict mechanical properties of FAGP, but also to develop mix designs for geopolymer concrete. In the next phase of work, consideration will be given to how ResNet and DNN models can be applied in FAGP manufacturing industries to predict optimised mix designs and curing regimes based on target compressive strength. This predictive ability will also be linked to mix design evaluations in terms of potential cost and environmental benefits prior to construction stages. In addition, the proposed machine learning approaches adopted a general training scheme for neural networks with standard input and output features, indicating promising potential to be applied to other regression problems in upcoming research works.
Author Contributions
Conceptualization, Q.D.N. and K.T.N.; Data curation, Q.D.N. and Q.L.X.; Funding acquisition, T.C.; Investigation, A.T.H., Q.D.N. and K.T.N.; Methodology, Q.D.N. and Q.L.X.; Project administration, K.T.N.; Resources, K.T.N.; Software, Q.D.N. and Q.L.X.; Supervision, B.M. and T.C.; Validation, Q.L.X. and T.C.; Visualization, K.T.N.; Writing—original draft, A.T.H. and K.T.N.; Writing—review & editing, A.T.H., Q.L.X., K.T.T. and B.M. All authors have read and agreed to the published version of the manuscript.
Funding
This research was funded by the Basic Science Research Program through the National Research Foundation of Korea (NRF-2020R1F1A1050014).
Conflicts of Interest
The authors declare no conflict of interest.
References
- Farfan, J.; Fasihi, M.; Breyer, C. Trends in the global cement industry and opportunities for long-term sustainable CCU potential for Power-to-X. J. Clean. Prod. 2019, 217, 821–835. [Google Scholar] [CrossRef]
- van Oss, H.G. Mineral Commodity Summaries: Cement; U.S. Geological Survey: Reston, VA, USA, 2000.
- van Oss, H.G. Mineral Commodity Summaries: Cement; U.S. Geological Survey: Reston, VA, USA, 2018.
- McGrath, T.E.; Kwasny, J.; Aiken, T.; Cox, S.; Soutsos, M.; Chen, J.F.; Mariotti, J.; Sha, W.; Correia, R. Demonstration of using low carbon precast concrete products for an energy efficient built environment. Sustain. Constr. Mater. Technol. 2019. [Google Scholar] [CrossRef]
- Meesala, C.R.; Verma, N.K.; Kumar, S. Critical review on fly-ash based geopolymer concrete. Struct. Concr. 2020, 21, 1013–1028. [Google Scholar] [CrossRef]
- Luukkonen, T.; Abdollahnejad, Z.; Yliniemi, J.; Kinnunen, P.; Illikainen, M. One-part alkali-activated materials: A review. Cem. Concr. Res. 2018, 103, 21–34. [Google Scholar] [CrossRef]
- Vafaei, M.; Allahverdi, A. High strength geopolymer binder based on waste-glass powder. Adv. Powder Technol. 2017, 28, 215–222. [Google Scholar] [CrossRef]
- Detphan, S.; Chindaprasirt, P. Preparation of fly ash and rice husk ash geopolymer. Int. J. Miner. Metall. Mater. 2009, 16, 720–726. [Google Scholar]
- Guru Jawahar, J.; Lavanya, D.; Sashidhar, C. Performance of fly ash and ggbs based geopolymer concrete in acid environment. Int. J. Res. Sci. Innov. 2016, 3, 101–104. [Google Scholar]
- Al Bakri, A.M.M.; Kamarudin, H.; Bnhussain, M.; Rafiza, A.R.; Zarina, Y. Effect of Na2SiO3/NaOH Ratios and NaOH Molarities on Compressive Strength of Fly-Ash-Based Geopolymer. ACI Mater. J. 2012, 109, 503–508. [Google Scholar]
- Joseph, B.; Mathew, G. Influence of aggregate content on the behavior of fly ash based geopolymer concrete. Sci. Iran. 2012, 19, 1188–1194. [Google Scholar] [CrossRef]
- Farhan, N.A.; Sheikh, M.N.; Hadi, M.N. Investigation of engineering properties of normal and high strength fly ash based geopolymer and alkali-activated slag concrete compared to ordinary Portland cement concrete. Constr. Build. Mater. 2019, 196, 26–42. [Google Scholar] [CrossRef]
- Tempest, B.; Sanusi, O.; Gergely, J.; Ogunro, V.; Weggel, D. Compressive strength and embodied energy optimization of fly ash based geopolymer concrete. In Proceedings of the 3rd World Coal Ash, WOCA Conference, Lexington, KY, USA, 4–7 May 2009. [Google Scholar]
- American Society for Testing and Materials. Standard Test Method for Compressive Strength of Cylindrical Concrete Specimens; ASTM C39/C39M-18; ASTM International: West Conshohocken, PA, USA, 2018. [Google Scholar]
- Naskar, S.; Chakraborty, A.K. Effect of nano materials in geopolymer concrete. Perspect. Sci. 2016, 8, 273–275. [Google Scholar] [CrossRef]
- Huynh, A.T.; Magee, B.; Woodward, D. A Preliminary Characterisation of Innovative Semi-Flexible Composite Pavement Comprising Geopolymer Grout and Reclaimed Asphalt Planings. Materials 2020, 13, 3644. [Google Scholar] [CrossRef]
- Prabhakaran, A.; Rajagopal, G.; Manikandan, S.A. Non Destructive Testing on Geopolymer Concrete using Concrete Demolition Waste. SSRG Int. J. Civ. Eng. 2017, 610–614. [Google Scholar]
- Van Dao, D.; Ly, H.-B.; Trinh, S.H.; Le, T.-T.; Pham, B.T. Artificial Intelligence Approaches for Prediction of Compressive Strength of Geopolymer Concrete. Materials 2019, 12, 983. [Google Scholar] [CrossRef]
- Van Dao, D.; Trinh, S.H.; Ly, H.-B.; Pham, B.T. Prediction of Compressive Strength of Geopolymer Concrete Using Entirely Steel Slag Aggregates: Novel Hybrid Artificial Intelligence Approaches. Appl. Sci. 2019, 9, 1113. [Google Scholar] [CrossRef]
- Nguyen, K.T.; Nguyen, Q.D.; Le, T.A.; Shin, J.; Lee, K. Analyzing the compressive strength of green fly ash based geopolymer concrete using experiment and machine learning approaches. Constr. Build. Mater. 2020, 247, 118581. [Google Scholar] [CrossRef]
- Ling, Y.; Wang, K.; Wang, X.; Li, W. Prediction of engineering properties of fly ash-based geopolymer using artificial neural networks. Neural Comput. Appl. 2019, 3, 1–21. [Google Scholar] [CrossRef]
- Muhammad, N.; Baharom, S.; Amirah, N.; Ghazali, M.; Alias, N.A. Effect of Heat Curing Temperatures on Fly Ash-Based Geopolymer Concrete. Int. J. Eng. Technol. 2019, 8, 15–19. [Google Scholar]
- Patil, A.A.; Chore, H.S.; Dode, P.A. Effect of Curing Conditions on Compressive Strength of Brick Aggregate. Adv. Concr. Constr. 2014, 2, 29–37. [Google Scholar] [CrossRef]
- Zhang, H.; Li, L.; Sarker, P.K.; Long, T.; Shi, X.; Wang, Q.; Cai, G. Investigating Various Factors Affecting the Long-Term Compressive Strength of Heat-Cured Fly Ash Geopolymer Concrete and the Use of Orthogonal Experimental Design Method. Int. J. Concr. Struct. Mater. 2019, 13, 63. [Google Scholar] [CrossRef]
- Azevedo, A.G.S.; Strecker, K.; Barros, L.A.; Tonholo, L.F.; Lombardi, C.T. Effect of Curing Temperature, Activator Solution Composition and Particle Size in Brazilian Fly-Ash Based Geopolymer Production. Mater. Res. 2019, 22, 1–12. [Google Scholar] [CrossRef]
- Nguyen, D.Q.; Vien, N.A.; Dang, V.-H.; Cheong, T. Asynchronous framework with Reptile+ algorithm to meta learn partially observable Markov decision process. Appl. Intell. 2020, 50, 4050–4062. [Google Scholar] [CrossRef]
- Choi, S.; Le Pham, T.; Nguyen, Q.D.; Layek, A.; Lee, S.; Chung, T. Toward Self-Driving Bicycles Using State-of-the-Art Deep Reinforcement Learning Algorithms. Symmetry 2019, 11, 290. [Google Scholar] [CrossRef]
- Jang, Y.; Ahn, Y.; Kim, H.Y. Estimating Compressive Strength of Concrete Using Deep Convolutional Neural Networks with Digital Microscope Images. J. Comput. Civ. Eng. 2019, 33, 04019018. [Google Scholar] [CrossRef]
- Nguyen, T.; Kashani, A.; Ngo, T.; Bordas, S. Deep neural network with high-order neuron for the prediction of foamed concrete strength. Comput. Civ. Infrastruct. Eng. 2019, 34, 316–332. [Google Scholar] [CrossRef]
- Goodfellow, I.; Bengio, Y.; Courville, A. Deep Learning; MIT Press: Cambridge, MA, USA, 2016; Available online: http://www.deeplearningbook.org (accessed on 30 September 2020).
- Sze, V.; Chen, Y.-H.; Yang, T.-J.; Emer, J.S. Efficient Processing of Deep Neural Networks: A Tutorial and Survey. In Proceedings of the IEEE; IEEE: New York, NY, USA, 2017; Volume 105, pp. 2295–2329. [Google Scholar]
- Khan, A.; Sohail, A.; Zahoora, U.; Qureshi, A.S. A survey of the recent architectures of deep convolutional neural networks. Artif. Intell. Rev. 2020, 53, 5455–5516. [Google Scholar] [CrossRef]
- Wang, R.; Chencho; An, S.; Li, J.; Li, L.; Hao, H.; Liu, W. Deep residual network framework for structural health monitoring. Struct. Health Monit. 2020, 1–19. [Google Scholar] [CrossRef]
- Fauzi, A.; Nuruddin, M.F.; Malkawi, A.B.; Abdullah, M.M.A.B.; Mohammed, B.S. Effect of Alkaline Solution to Fly Ash Ratio on Geopolymer Mortar Properties. Key Eng. Mater. 2017, 733, 85–88. [Google Scholar] [CrossRef]
- Kingma, D.P.; Ba, J.L. Adam: A method for stochastic optimization. In Proceedings of the 3rd International Conference for Learning Representations, San Diego, CA, USA, 7–9 May 2015. [Google Scholar]
- Ba, J.L.; Kiros, J.R.; Hinton, G.E. Layer Normalization. arXiv 2016, arXiv:1607.06450. [Google Scholar]
- Tenza-Abril, A.; Villacampa, Y.; Solak, A.; Baeza-Brotons, F. Prediction and sensitivity analysis of compressive strength in segregated lightweight concrete based on artificial neural network using ultrasonic pulse velocity. Constr. Build. Mater. 2018, 189, 1173–1183. [Google Scholar] [CrossRef]


Publisher’s Note: MDPI stays neutral with regard to jurisdictional claims in published maps and institutional affiliations. |
© 2020 by the authors. Licensee MDPI, Basel, Switzerland. This article is an open access article distributed under the terms and conditions of the Creative Commons Attribution (CC BY) license (http://creativecommons.org/licenses/by/4.0/).