1. Introduction
In 2019, the net income of the global courier, express, and parcel market was over 330.4 billion EUR, with an almost 10% percent increase from the previous year [
1]. Operators such as DHL, TNT, and FedEx primarily provide air, road, or combined express parcel delivery services of packages for various customers [
2]. Although many modes of transport are used for parcel transportation, the packages travel a significant portion of the total transportation period in small vehicles like vans that collect from and deliver to senders and receivers.
The shipments of courier packages are usually small in size, light in weight, and time-sensitive products. The transport environment of these shipments produces physical events that can affect the integrity of the products and can be the primary source of damage [
3]. The most common physical events include vibration, impacts (shocks), and compression [
4]. These physical conditions are random, so it is important to measure and analyze them in order for packaging engineers to gain a better understanding and design suitable protective packaging systems. It is very important to avoid those damages during distribution that can cause losses by making the product unmarketable at its destination. On the other hand, the cost-effectiveness issue is also important for engineers to design optimal packaging that simultaneously serves to protect the goods and reduce environmental impact.
The vibration environment during distribution can be based on factors such as the vehicle body structure, type of vehicle suspension and tires, road roughness, vehicle speed, and actual payload [
4].
Previous studies have measured and analyzed vibration levels for parcel delivery vehicles and CEP (Courier Express Parcel) modes of transportation [
3,
5,
6,
7]. Factors involving changes in vibration levels, including payload, suspension (leaf spring vs. air ride), and road condition, for small parcel delivery vehicles have also been previously investigated [
8,
9,
10]. Former results have shown that significant vibration levels increase when a small vehicle such as a van travels on poor roads, with a higher speed, and with less payload. All these studies have only measured the vibration levels on the platform of the vehicle, but did not take into consideration that most of these parcels are delivered in a stacked state due to the relatively limited capacity of small vehicles and the large quantity of goods. In this context, the vibration levels in stacked loads (in layers) will be completely different from the direct input that can be experienced on the platform. Moreover, these shipments do not act as a palletized unit as they are not fixed to each other; furthermore, they are loaded into the vehicle with free movement spaces around them. This phenomenon can be seen in
Figure 1a,b.
Nowadays, the above-mentioned circumstance can be often observed in parcel delivery methods due to the very intensive flow of goods in periods where customers’ orders occur via online stores, such as in situations like COVID-19, when personal purchase of goods is strictly limited, or during festive seasons when the malls are overcrowded.
However, we could not find any published field research that measured and analyzed the vibration levels in stacked units for parcel delivery methods. Previous results have mainly focused on vehicle vibration as an input to normal cargo, but in reality, there is not enough knowledge to estimate the conditions of stacked parcels, which could suffer more significant damage than parcels in normal transport solutions. Therefore, this study presents new measured and analyzed data that can help packaging engineers gain a better understanding of this distribution environment and design appropriate protective packaging for CEP packages.
The main goal of this paper was to measure and analyze the vibration levels in a three-layer unit in van shipments for average delivery routes using tri-axial data recorders. We also discuss the effect of free movement space around the packages during transportation and provide a statistical presentation on the nature of random vibration throughout this shipping method. The data from this research can be compared to normal vibration testing profiles that are used for packaging testing purposes but can be used as recommended methods for general vibration on vehicle platforms. These new data can be a useful technical tool for packaging engineers to use for parcel package pre-shipment testing. Furthermore, this study presents a novel measurement method to evaluate and analyze the vibration levels in stacked small packaged goods that are not held down by equipment when being transported.
The importance of this study is also confirmed by logistics experts by the fact that in these pandemic days, consumers have become adept in their e-commerce shopping and make even smaller purchases via online stores; this trend is expected to continue even more in the future of normal business. This is also a big challenge for managers as sales strategies need to be redefined, which in turn will create new technical demands in real life. Thus, the results of our study can be of great benefit to companies that are already present in the CEP market with their products or to new entrants looking to develop an omni-channel strategy for their products in the future. Furthermore, designing the packaging of products more accurately and professionally can serve business management purposes by saving and avoiding costs resulting from product damage. Additionally, CEP companies such as Amazon, TNT, and FedEx could benefit greatly from the results by updating and applying the loading layout and packaging guidelines.
3. Results and Discussion
3.1. Acceleration Levels
Table 3 contains the results of the measured peak acceleration values for all three orientations. On the floor, the highest acceleration levels were recorded in the vertical orientation, followed by lateral, with the least in the longitudinal direction. Concordant results on floor vibration levels have been presented in previous research for small delivery vehicles [
3,
5,
6,
7,
10,
15]. However, it is a very interesting observation that the highest peaks of the entire recorded data for this study were in the third layer and in the lateral direction: 4.16
g, 4.93
g, and 5.94
g with 0%, 10%, and 20% FM space, respectively. On the other hand, the highest acceleration in the vertical direction was 3.99
g with 20% FM, also in the third layer. This phenomenon can be attributed to heavy curvy roads on the country road network while traveling with relatively high speed, when the packages in the third layer can bounce into the fences with a high amplitude, first to the right/left side and then to the back.
Practically, at each measurement, it could be observed that the highest acceleration levels were in the third layer, followed by the second, first, and floor. This is true for all orientations except the longitudinal direction with 10% FM space, where 50% of recorded event data were higher in the first layer than in the second layer. This latter phenomenon can be explained by different sudden braking conditions due to variable traffic during different measurements.
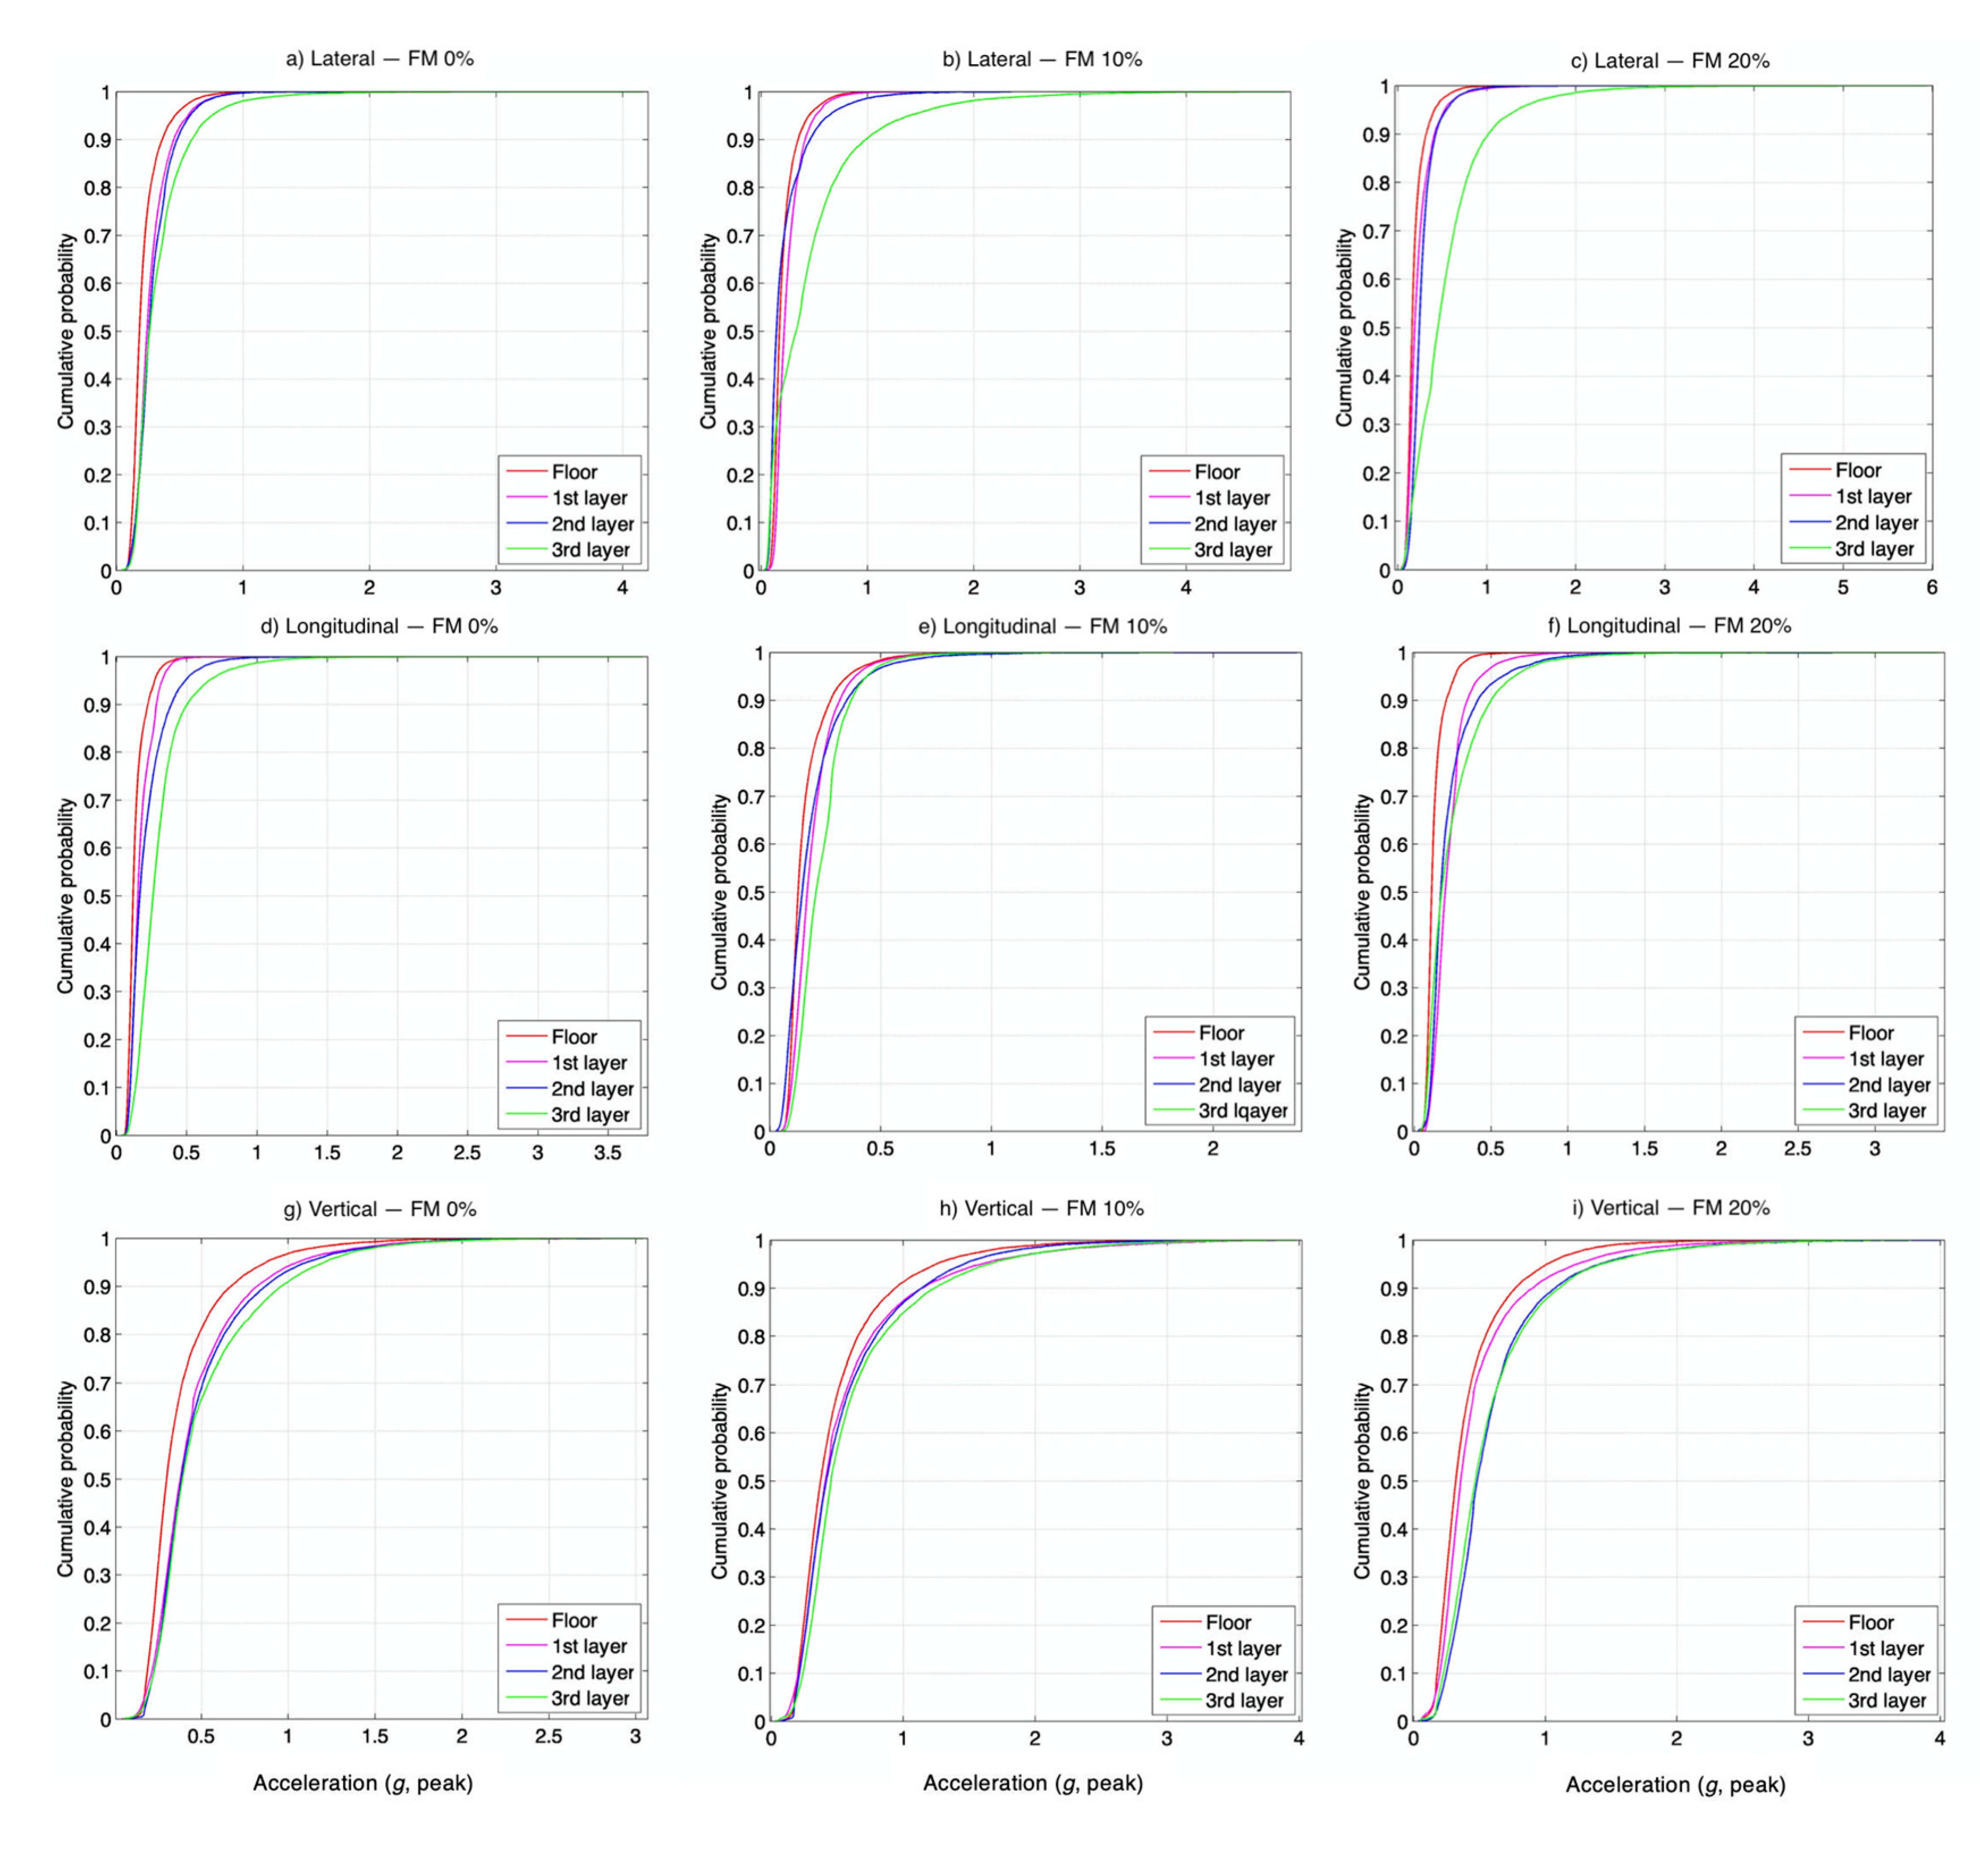
Figure 5 presents the CDFs and also shows the probability of occurrence at a given acceleration level. The data presented in this figure show that 50% of vertical vibration levels are below 0.37
g on the floor and below 0.48
g in the third layer. In the lateral and longitudinal directions, 50% are below 0.18
g and 0.13
g, respectively, on the floor and below 0.45
g and 0.26
g, respectively, in the third layer.
It can be stated, based on the recorded data and CDFs, that higher acceleration levels can be observed with more free movement space. In the vertical direction, this means 1.21–1.51 times higher values in higher layers, with 1.44–2.81 times and 1.63–2.36 times higher values in the lateral and longitudinal directions, respectively, in comparison to the floor.
Higher vertical acceleration levels in higher layers mean a higher risk of damage to the shipment. This is mainly due to the stacked unit performance of the shipment. For longitudinal and lateral orientations, the acceleration levels increase when more free movement space is left for packages; this is due to sudden and normal braking/acceleration events, as well as the effects of winding roads.
3.2. Vibration Levels in Stacked Units and the Effect of FM, and Transmissibility
The recorded vibration levels displayed in the PSD plots are shown in
Figure 6 for various amounts of FM space and layer positions in all three orientations. In all SAVER positions, the results showed that the highest vibration levels occurred in the vertical direction, followed by lateral and then longitudinal. In the vertical direction, the most intense vibration levels in higher layers were found in the frequency range of 8–50 Hz; below 8 Hz, the vibration intensity was almost the same in higher layers as on the floor. Additionally, around 40–50 Hz, cross-frequency could be observed, above which the intensity decreased rapidly below the floor intensity. The reason for the same vibration intensity between 1 and 8 Hz could be that the applied sample stacked unit, by its mass, moved together with the vehicle in this frequency range. The results also showed that in the longitudinal direction, this cross-frequency could also be found above, in which the intensity also decreased below the floor’s intensity. However, in a lateral orientation, the vibration intensity in the higher layers was already higher than that in the lower region (below 8 Hz). This was also true for the longitudinal direction if any FM space (10% or 20%) was applied.
Figure 7 presents the transmissibility plots for vertical orientation in the layers of the stacked unit with various amounts of FM space in the frequency range of 1–200 Hz. The peaks of the transmissibility ratio in the third layer were 11.9 (21 Hz), 7.2 (15 Hz), and 11.8 (16 Hz) at FM 0%, 10%, and 20%, respectively. At FM 10%, the highest peak was observed in the first layer. This phenomenon can be attributed to some shock (impact) impulse that may have occurred due to potholes or severe road roughness during this measurement. Nevertheless, it is clearly visible that the amplification at FM 0% and in a higher layer was significant in the frequency range of 8–50 Hz. However, if any FM space was applied, this frequency range was wider, as shown by FM 10% and 20%. It also has to be noted here that the middle layer was partly suppressed by the package above it, and this is reflected in the recorded and calculated levels. This phenomenon has already been observed in previous research in laboratory vibration simulations for unitized load shipments [
16].
Table 4 reports the overall G
rms values of the calculated vibration data for the various FMs and layers in the range of 1–200 Hz. The highest overall G
rms values were observed in the third layer in each case in the vertical direction, followed by the lateral and longitudinal directions. In the analyzed frequency range of 1–200 Hz, the overall G
rms values increased as layers were added. In the vertical direction, the overall G
rms value was 1.22–1.48, 1.29–20.3, and 1.08–2.28 times higher than those on the floor, in the longitudinal direction, and in the lateral direction, respectively.
3.3. Statistical Characteristics of Acceleration Peaks
In
Figure 8, the PDF plots of the recorded acceleration data are presented for the vertical direction.
Appendix A contains the numerical data for all kurtosis and skewness values in all three orientations and for all layers and FM space amounts. Here it has to be noted that presenting the kurtosis and skewness values is very important due to the fact that the random vibration testing controller in the laboratory, when engineers want to simulate vibration circumstances, mostly generates a control signal from a normal distribution, so field-measured kurtosis can be used as an input parameter to perform realistic variability for the random signal during vibration simulations.
The recorded acceleration events at each measurement and in each layer were positively peaked (positive kurtosis) and showed a difference (CI: 95%) from a normal Gaussian distribution (where the kurtosis is zero). This indicates a so-called “heavy-tailed” distribution. The reason for this phenomenon is that the field-recorded acceleration values (used with positive or negative orientation) did not follow the normal Gaussian distribution as a function of time. The kurtosis values of vertical recorded events were between 1.18 and 6.76. These values for the floor confirm the results of previous papers presented on the non-Gaussian nature of random vehicle vibration in delivery vehicles [
17,
18,
19]. However, the values of kurtosis in higher layers approached zero, which means that in a stack unit, the higher layers suffer such random vibration that it almost follows a normal distribution. The kurtosis values of longitudinal and lateral recorded events were 8.08–19.83 and 5.97–15.86, respectively, for higher layers and various FM amounts.
In each case, skewness values showed deviation from zero, which indicates asymmetric distributions. These values were between −0.74 and 1.10 in the vertical direction, 1.99–3.43 in the lateral direction, and 2.15–3.87 in the longitudinal direction. On the floor and in the vertical direction, the vehicle vibration was negatively skewed; these distributions thereby went towards the right dissymmetry. This can be attributed to more acceleration events in the vertical negative direction.
3.4. Limitations
We want to call attention to the fact that the PSD method using the fast Fourier transformation (FFT) process results in a PSD plot with averaged intensity over the observed frequency range of interest. So, the presented PD levels do not expose some severe or extreme vibration levels that can happen during real delivery. Furthermore, each product has a different sensitivity to vibration, so this study can provide a simulation environment that can be used in practice to check the adequacy of packaging.
The CEP delivery services usually use other vehicles like minivans, mid-size trucks, or heavy trucks to deliver shipments; therefore, data from this study have limited use for the entire parcel delivery chain.
Last, but not least, it has to be recognized by the readers of this paper that the theoretical dynamics of stacked packages can be described as nonlinear free vibration of a coupled mass–spring system. Hence, various geometrical sizes and different weights of packages will change the vibration intensity in a nonlinear way.
Of course, there are also obstacles from an economic point of view that cannot be avoided. A higher intensity vibration may require stronger packaging, which, in turn, can lead to significant cost overruns and the risk of overpacking. This issue can only be resolved after careful economic consideration, i.e., with the combined examination of damage risks or the possible damage boundary of the product and additional packaging costs.
4. Conclusions
From this study, we can conclude the following: Higher acceleration values can be observed in packages that are in a higher stacked position. This is true for all orientations. The highest acceleration values were in the lateral direction: 4.16g, 4.93g, and 5.94g. In the vertical direction, the highest was 3.99g. Higher acceleration levels were observed when there was more free movement space in the package layout method.
In terms of vertical orientation, the most intense vibration levels were found in the frequency range of 8–50 Hz; furthermore, this was amplified in the higher layers. Below 8 Hz, the vibration intensity was almost the same in the higher layers as on the floor, and around 40–50 Hz, a cross-frequency could be found above which the intensity decreased rapidly below the floor intensity. In all package positions, the highest vibration levels occurred in the vertical direction, followed by lateral and longitudinal.
The highest overall Grms values (in the frequency range of 1–200 Hz) were observed in the third layer, and in each case, were highest in the vertical direction followed by the lateral and longitudinal directions.
The kurtosis statistical values for the recorded vertical vibration events were from 1.18 to 6.76, which presents a non-Gaussian nature of random vibration in every package position.
The results of this paper can provide information about such a test environment for engineers that can simulate the vibration circumstances of small stacked packages in parcel delivery transportation, thereby helping to find and design an optimal packaging that simultaneously serves to protect the goods and reduce the environmental impact of the packaging used.
We want to draw the attention of managers to the fact that the presented results can be used practically immediately in day-to-day design and testing practice. They are also encouraged to apply the newly developed packaging testing guidelines, which can also help avoid damage to goods, thereby generating greater profits or resulting in lower costs for companies. The results of this study will also help companies maintain a competitive advantage for a particular product in the market, or help them enter into a new sales channel that they have not used before.


