Article

Analysis of the Applicability of Non-Destructive Techniques to Determine In Situ Thermal Transmittance in Passive House Façades

Group of Construction Research and Innovation (GRIC), Universitat Politècnica de Catalunya (UPC), C/Colom, 11, Ed. TR5, 08222 Terrassa, Spain
*
Author to whom correspondence should be addressed.
Appl. Sci. 2020, 10(23), 8337; https://doi.org/10.3390/app10238337
Submission received: 26 October 2020 / Revised: 15 November 2020 / Accepted: 20 November 2020 / Published: 24 November 2020
(This article belongs to the Special Issue Non-destructive Testing in Civil Engineering)

Abstract

:
Within the European framework, the passive house has become an essential constructive solution in terms of building efficiency and CO2 reduction. However, the main approaches have been focused on post-occupancy surveys, measurements of actual energy consumption, life-cycle analyses in dynamic conditions, using simulation, and the estimation of the thermal comfort. Few studies have assessed the in situ performance of the building fabric of passive houses. Hence, this paper explores the applicability of non-destructive techniques—heat flux meter (HFM) and quantitative infrared thermography (QIRT)—for assessing the gap between the predicted and actual thermal transmittance of passive house façades under steady-state conditions in the Mediterranean climate. Firstly, the suitability of in situ non-destructive techniques was checked in an experimental mock-up, and, subsequently, a detached house was tested in the real built environment. The findings revealed that both Non-Destructive Testing (NDT) techniques allow for the quantification of the gap between the design and the actual façades U-value of a new passive house before its operational stage. QIRT was faster than the HFM technique, although the latter was more accurate. The results will help practitioners to choose the most appropriate method based on environmental conditions, execution of the method, and data analysis.

1. Introduction

Within the context of European regulation on energy efficiency and energy conservation, the passive house (PH) concept has emerged as a global quality assurance standard [1,2,3]. Nearly Zero Energy Buildings (NZEBs) have become an essential element in developed countries to achieve a reduction in energy consumption and CO2 in the construction sector [4,5,6], using efficient systems of HVAC (Heating, Ventilating, and Air-Conditioning) and increasing the thermal insulation of buildings [7]. Indeed, PH requires 80–90% less heating energy than conventional buildings to provide optimal thermal comfort conditions, while the initial investment only represents an increase of 5–10% [8]. However, the main barriers for this type of construction are the high performance building materials and the cost of adoption (training and certification) [9,10].
Some authors stated that a PH should be defined by six principles: (i) a high level of thermal insulation and thermal capacity of opaque walls [3,5,6,7,11], (ii) minimization of thermal bridges [3,5,11,12], (iii) high efficient windows [5,12], (iv) high levels of airtightness [3,5,6,7], (v) passive solar gains [7,11,12], and (vi) efficient mechanical ventilation with heat recovery system [3,5,6,7]. For this reason, researchers put their efforts on the assessment of the energy performance of PH dwellings. The main approaches consisted of post-occupancy surveys, measurements of the actual energy consumption, life-cycle analyses (LCA) in dynamic conditions, using simulation (i.e., EcoHestia, Computation Fluid Dynamics (CFD) model, or EnergyPlus) [6,11], and the determination of the thermal comfort by the PMV (Predicted Mean Vote) model according to ASHRAE 55 and EN 15,251 [4,5,7,8,9,11,13]. As regards the design parameters, recent studies were focused on building performance optimization (BPO) through the implementation of meta-models (i.e., multiple linear regression, support vector machines (SVM), and artificial neural networks (ANN)) [8]. Nevertheless, a lack of systematic optimization methods for façades is still detected in the research field [8]. Besides this, few studies assessed the in situ performance of the building fabric of PH dwellings in comparison with the theoretical design [3,14,15,16,17,18]. Along this line, Johnston et al. [3] highlighted that most of in situ tests were conducted on prefabricated timber frames or externally insulated thin-joint blockworks, using heat flux meter (HFM) and qualitative infrared thermography (IRT) techniques. No references were found for heavy multi-leaf walls and quantitative internal IRT.
The heat flux meter (HFM) method is widely used as a non-destructive method for measuring the actual thermal transmittance of façades [19,20,21,22,23,24,25]. However, the literature review revealed that the HFM average method is not frequently applied to verify compliance with technical specifications of projects in façades with low U-value in PH on site.
It is challenging to obtain accurate results during in situ measuring of façades with low thermal transmittance. Very few initiatives have conducted in situ measurements on façades with low U-values, using the HFM average method. Furthermore, in most of these studies, the relative deviation of measured U-values from theoretical values was significant. Asdrubali et al. [21] measured the actual thermal transmittance of façades, with theoretical U-values ranging from 0.23 up to 0.33 W/m2·K. Their results showed relative deviations of between 4 to 75%. Mandilaras et al. [26] obtained a relative deviation between theoretical and measured U-values of 28% when they monitored, in situ, a building envelope with theoretical thermal transmittance of 0.20 W/m2·K. Albatici et al. [27] and Nardi et al. [28] used the HFM average method to validate results obtained by using the quantitative infrared thermography technique. Researchers obtained relative deviations between U-values from 1 up to 6% and of 83%, respectively. Bros-Williamson et al. [29] calculated the actual U-value of two façades with theoretical U-values of 0.10 and 0.23 W/m2·K. Results had relative deviations between theoretical and measured U-values from 10 up to 65%. Finally, Samardzioska and Apostolska [30] studied façades with a theoretical thermal transmittance of 0.22 W/m2·K, with relative deviations between U-values from 3 up to 59%.
Infrared thermography (IRT) is a widely accepted NDT technique that allows users to inspect entire wall areas [31]. The employment of thermographic inspection can be divided into qualitative and quantitative studies [32,33,34]. In fact, Tejedor et al. [35] highlighted that most studies were qualitative, to discover heterogeneities due to anomalies (moisture, thermal bridges, cracks, air leakages, etc.) below the plaster [36,37,38,39,40] and to define the geometry of a masonry, among other purposes [41]. Besides this, international standards (i.e., ISO 6781:1983 [42]), UNE EN 13187:1998 [43], ASTM E1311 [44], ASTM E1862 [45], and guidelines (i.e., RESNET [32]) only recommend boundary conditions for the use of qualitative IRT tests to carry out energy audits in buildings [33,46,47]. In the last decade, few systematic attempts have emerged for developing accurate approaches related to the estimation of in situ U-values of façades by quantitative IRT. Nevertheless, the studies tended to analyze the convective and radiative heat-transfer processes of the wall from outside the building [27,28,48,49,50,51,52,53,54,55,56] instead of inside the building [57,58,59,60,61,62,63,64,65]. Some researchers pointed out two main constraints in the use of external thermography: (i) the tabulated value of the external convective heat transfer coefficient is considered a precautionary value, since it is computed to estimate the heat loss during the design stage of the building [51]; (ii) the calculated value of the convective heat-transfer coefficient based on Jürge’s equation may present a greater variability due to wind characteristics (angle, intensity, and direction) [66,67,68,69,70]; (iii) uncontrolled reflections indexes of surroundings may be given on the target [33,61]. As regards internal thermography, Madding et al. [71] proposed a numerical model where the equation of the specific heat flux by radiation was linearized. Moreover, the convective heat-transfer coefficient was focused on a dimensional approach that was reported in Earle’s study [72] and Holman’s study [73]. According to Sham et al. [69], the calculation procedure with a dimensionless approach is more accurate. Along this line, Bienvenido–Huertas et al. [74] carried out a comparative analysis among different numerical models based on quantitative internal IRT in terms of radiative heat flux: Madding [71], Fokaides et al. [57], and Tejedor et al. [61]. The results did not show significant differences in the use of the three equations. For determining the influence of internal convective heat transfer coefficients (hc) on the thermal characterization of building envelopes using QIRT, a cluster analysis was drawn up. The study took into account 25 correlations of temperature differences and 20 correlations of dimensionless numbers. The outcomes demonstrated that the use of dimensionless numbers for computing hc was the most efficient approach for the QIRT from inside the building. Concerning the precision of the method, researchers obtained relative deviations between theoretical and measured U-values from 10 to 60% for external thermography and from 2 to 12% for internal thermography. Dall’O et al. [51] stated that the deviation between HFM and QIRT measured data was greater for well-insulated walls, reaching >50%. As seen, the main benefit of internal QIRT is that the practitioner can work under controllable test conditions, obtain a better precision, and avoid unknown reflections of surroundings on the target. Hence, it might be interesting to observe whether passive house façades can be evaluated by internal thermography and whether the results are similar to HFM measurements.
Based on the outlined background, the aim of the paper was to assess the use of non-destructive techniques (HFM and QIRT) for determining the gap between the predicted and actual thermal transmittance of passive house façades in steady-state conditions. With this purpose, two measurement campaigns were carried out. The first one was conducted on an experimental mock-up with controlled climatic conditions (February 2017), to define good practices in the monitoring process for applying the HFM average method and the quantitative internal IRT technique. The conclusions obtained from this preliminary study were taken into account for the second measurement campaign in a detached house under real environmental conditions (February 2019). This research will help practitioners to select the most appropriate method for determining in situ the actual thermal transmittance of façades with a low U-value.
This paper is organized as follows. Section 2 specifies the research methodology implemented in this paper and describes the opaque walls to be assessed. Section 3 discusses the use of HFM and QIRT to determine building thermal performance of façades with a high level of insulation. Finally, Section 4 highlights the major contributions of this research.

2. Materials and Methods

The research methodology is represented in Figure 1. Firstly, an experimental mock-up was designed and constructed with prefabricated panels in February 2017, incorporating the passive-house concept in the Mediterranean climate. The façade’s U-value was determined by using the heat flux meter (HFM) and quantitative internal infrared thermography (QIRT) techniques under controlled climatic conditions. Once the applicability of in situ NDT for walls with low U-value had been checked, a passive house was built in 2018 and monitored in February 2019, to carry out a post-construction evaluation of the façade before the operational stage. In both case studies, the in situ measured thermal transmittance was computed following the methods reported in Gaspar et al. [75] and Tejedor et al. [61]. Furthermore, the two measurement campaigns took place during winter, to guarantee a thermal gradient from 10 to 15 °C across the building envelopes. Subsequently, a comparative analysis between theoretical and measured U-values was carried out, considering the coefficient of variation as the common statistical parameter, to evaluate the dispersion of the measurements.
This section fully describes the measurement setup (Section 2.1), the measuring equipment (Section 2.2), and both case studies (Section 2.3).

2.1. Measurement Setup

The measurement campaigns, which took place in the Mediterranean climate during February 2017 and February 2019, were conducted in an experimental mock-up and a detached house based on the passive-house concept. To ensure the same operating conditions, HFM tests and quantitative IRT tests were performed simultaneously, although with different test durations, depending on the method.

2.1.1. HFM Average Method

The HFM average method is a non-destructive method for measuring the thermal transmittance of opaque, plane building elements perpendicular to the heat flow with no significant lateral heat flow. It consists of monitoring the heat flux rate passing through the element (q) and the indoor (TIN) and outdoor (TOUT) environmental temperatures [76]. The HFM standardized average method is widely used. It is considered to estimate steady-state conditions well, by monitoring the heat-flow rate and temperatures over an adequately extended duration. According to this method, defined in ISO 9869-1:2014 [76] and described in Gaspar et al. [75], the thermal transmittance and its combined standard uncertainty (uc (U)) can be obtained by Equations (1) and (2):
U m e s   H F M W m 2 · K =   j = 1 n q j j = 1 n T I N j T O U T j
u c   H F M 2 U = δ U δ q 2 · u c 2 q + δ U δ T I N 2 · u c 2 T I N + δ U δ T O U T 2 · u c 2 T O U T = = 1 T I N T O U T 2 · u c 2 q + q T I N T O U T 2 2 · u c 2 T I N + q T I N T O U T 2 2 · u c 2 T O U T
where q is the density of the heat-flow rate per unit area in [W/m2], TIN is the environmental indoor temperature in [K], TOUT is the environmental outdoor temperature in [K], the index j enumerates the individual measurements, u(q) is the uncertainty associated with the heat-flow-rate-measuring equipment, u(TIN) is the uncertainty associated with the interior environmental temperature measuring equipment, and u(TOUT) is the uncertainty associated with the exterior environmental temperature measuring equipment.
The HFM average method is a standardized method described in ISO 9869-1:2014 [76]. This standard establishes that the duration of the test depends on the values obtained during the course of the test. In this sense, the standard defines three conditions that must be met simultaneously to end the monitoring process: (a) the test must have a minimum duration of 72 h or more, (b) the thermal transmittance obtained when the test finalized must not differ more than 5% from the value obtained 24 h before, and (c) the thermal transmittance obtained by analyzing data from the first time period of INT(2·DT/3) days must not differ more than 5% from the value obtained from the data for the last period of the same duration, where DT is the lasting of the test in days.
Moreover, the variability of results (random error e(%)) was estimated with a 95.4% confidence level, according to Atsonios et al. [77]. The coefficient of variation of the resulting U-values obtained following the HFM average method was calculated with Equations (3) and (4) [77,78]:
C V H F M % = i n U _ H F M _ m e s i U _ H F M _ m e s ¯ 2 n 1 × 1 U _ H F M _ m e s ¯ × 100
e % = 2 × C V H F M %
where U _ H F M _ m e s i is the value of thermal transmittance of the façade in the cycle i, U _ H F M _ m e s ¯ is the average of Um-values of the façade during n cycles, and n is the number of cycles (n = 3). According to the ASTM C1155-95 Standard [78], the coefficient of variation is expected to be less than 10% for the HFM average method.

2.1.2. Quantitative Internal IRT Method

In contrast to the HFM average method, quantitative internal IRT assumes that the façade is crossed by one-dimensional horizontal specific heat flux (q) resulting from radiation (qr) and convection (qc) processes under a stationary regime. According to the method extensively reported in Tejedor et al. [61], the instantaneous and average measured U-values [W/m2·K] can be defined by Equations (5) and (6):
U m e s i   I R T W m 2 · K = 0.825 + 0.387 · R a 1 6 1 + 0.492 P r 9 16 8 27 2 · λ a i r L · T I N T W A L L + ε W A L L · σ · T R E F 4 T W A L L 4 T I N T O U T .
U m e s a v g   I R T W m 2 · K = i = 1 n q r i + q c i i = 1 n T I N i T O U T i = i = 1 n U m e s i n .
where TIN and TOUT denote the inner and outer ambient air temperatures in [K], respectively, TREF is the reflected ambient temperature in [K], TWALL represents the wall-surface temperature in [K], εWALL refers to the wall surface emissivity, σ is the Stefan–Boltzmann’s constant with a value of 5.67 × 10⁻⁸ [W/m2·K4], λair is defined as the air thermal conductivity measured in [W/m·K], L is the wall height seen from the internal side of the prefabricated wall in meters, and n is the total number of thermograms. As regards Rayleigh (Ra) and Prandtl (Pr) numbers, they are dimensionless parameters for a laminar flow assuming that the wall is a vertical plate. It should be pointed out that Pr is set at 0.73 for dry air under atmospheric pressure and TIN = 20–25 °C, while the Rayleigh number is computed by Equation (7).
R a = G r · P r = g · β · T I N T W A L L · L 3 v 2 · P r
The parameters that define Ra are the following: the Grashof number (Gr), the gravitation (g = 9.8 m/s2), the volumetric temperature expansion coefficient (β = 1/Tm where Tm is the average value of TIN and TWALL), and the air viscosity (v 1.4·10−5 m2/s for TIN = 0–15 °C or v=1.5·10−5 m2/s for TIN = 15–25 °C).
In terms of operating conditions, the recommendations defined by Tejedor et al. [61] should be taken into account, to guarantee the implementation of the quantitative internal IRT method in the mock-up and the detached house. Based on this, the measurements were performed in the early morning (from 6 a.m. to 9 a.m.), to ensure the temperature difference through the wall and to avoid the incident solar radiation as an external stimulus. For a thermal gradient between 7 and 16 °C, Tejedor et al. [63] demonstrated that the variance of the measured thermal transmittance could be only predicted by changes of TOUT. The parameters TIN, TREF, and TWALL often remain constant during the monitoring process.
Finally, the variability of the results was assessed by calculating the standard deviation (SD) and the coefficient of variation (CV) among the instantaneous measurements of each test for the wall of the experimental mock-up W1 and the wall of the detached house W2 (Equations (8) and (9)). Gaspar et al. [75] stated that the impact of CV was greater on walls with low U-values. Subsequently, the 95% confidence intervals were also computed following Equation (10), to analyze whether there was a relevant difference among Umes avg resulting from quantitative internal IRT.
S D   W m 2 · K = i = 1 n U m e s i   I R T U m e s a v g   I R T 2 n
C V I R T % = S D / U m e s   a v g   I R T · 100
C I 95 % = U ¯ ± 1.96 · σ n

2.1.3. Validation of Methods

To validate the implementation of both methods, all measurements were compared with the theoretical thermal transmittance (also termed as nominal design data—Equation (11) in accordance with previous studies [21,26,27,28,29,30,61,63,75,79]. In fact, Ficco et al. [23] defined four approaches to estimate Ut and to check the QIRT results: (i) use data from historical analysis, (ii) calculate nominal design data, (iii) determine the actual U-value through endoscopy, and (iv) collect in situ data by using a standardized method (i.e., HFM). For this purpose, the Spanish Technical Building Code [80] and European Standards such as UNE EN ISO 10456:2012 [81] and UNE EN ISO 6946:2012 [82] were considered. Therefore, the adjustment between theoretical and measured U-values can be expressed as the absolute value of the relative difference between theoretical and measured U-values (Equation (12)):
U t = 1 R t = 1 R S i + i = 1 n Δ x i λ i + R S e
Δ U / U t   % = U m e s U t / U t · 100
where RT is the theoretical total thermal resistance [m2·K/W], Rsi and Rse refer to the interior and exterior superficial resistance for horizontal heat flux (0.13 and 0.04 m2·K/W, respectively), Δxi is the thickness of the layer in meters, λi is the thermal conductivity of the layer [W/(m·K)], Ut is the theoretical thermal transmittance of the façade [W/m2·K], and Umes is the measured thermal transmittance of the façade [W/m2·K].

2.2. Measuring Equipment

The technical specifications of the measuring equipment used for NDT tests are presented in Table 1. For the HFM tests, the inner equipment layout included three heat flux meter plates (HFP01, Hukseflux) with a thickness of 5.0 mm, a diameter of 80.0 mm, and a guard made of a ceramic–plastic composite, with an inside air temperature sensor (107, Campbell Scientific Inc., Barcelona, Spain) consisting of a thermistor encapsulated in epoxy-filled aluminum housing, both connected to an acquisition system (CR850, Campbell Scientific Inc., Barcelona, Spain) consisting of measurement electronics encased in a plastic shell with an integrated wiring panel with external power supply. The outer equipment consisted of an air temperature sensor and its acquisition system (175T1, Instrumentos Testo, SA, Barcelona, Spain). The optimal location of sensors was investigated with qualitative IRT, according to the procedures reported in ISO 6781:2015 [42] and UNE EN 13187:1998 [43]. In this way, it was possible to avoid unknown heterogeneities or disturbances (i.e., corners, the vicinity of junctions, direct solar radiation, and the direct influence of a heating unit) [22,34,61,76]. The transducers were installed on the internal side of the prefabricated panels, to achieve the most stable operating conditions before and during the tests. Data loggers were configured to store the 30-minute averaged data in their memories, considering a sampling frequency of 1 s and a total test duration of 7 days.
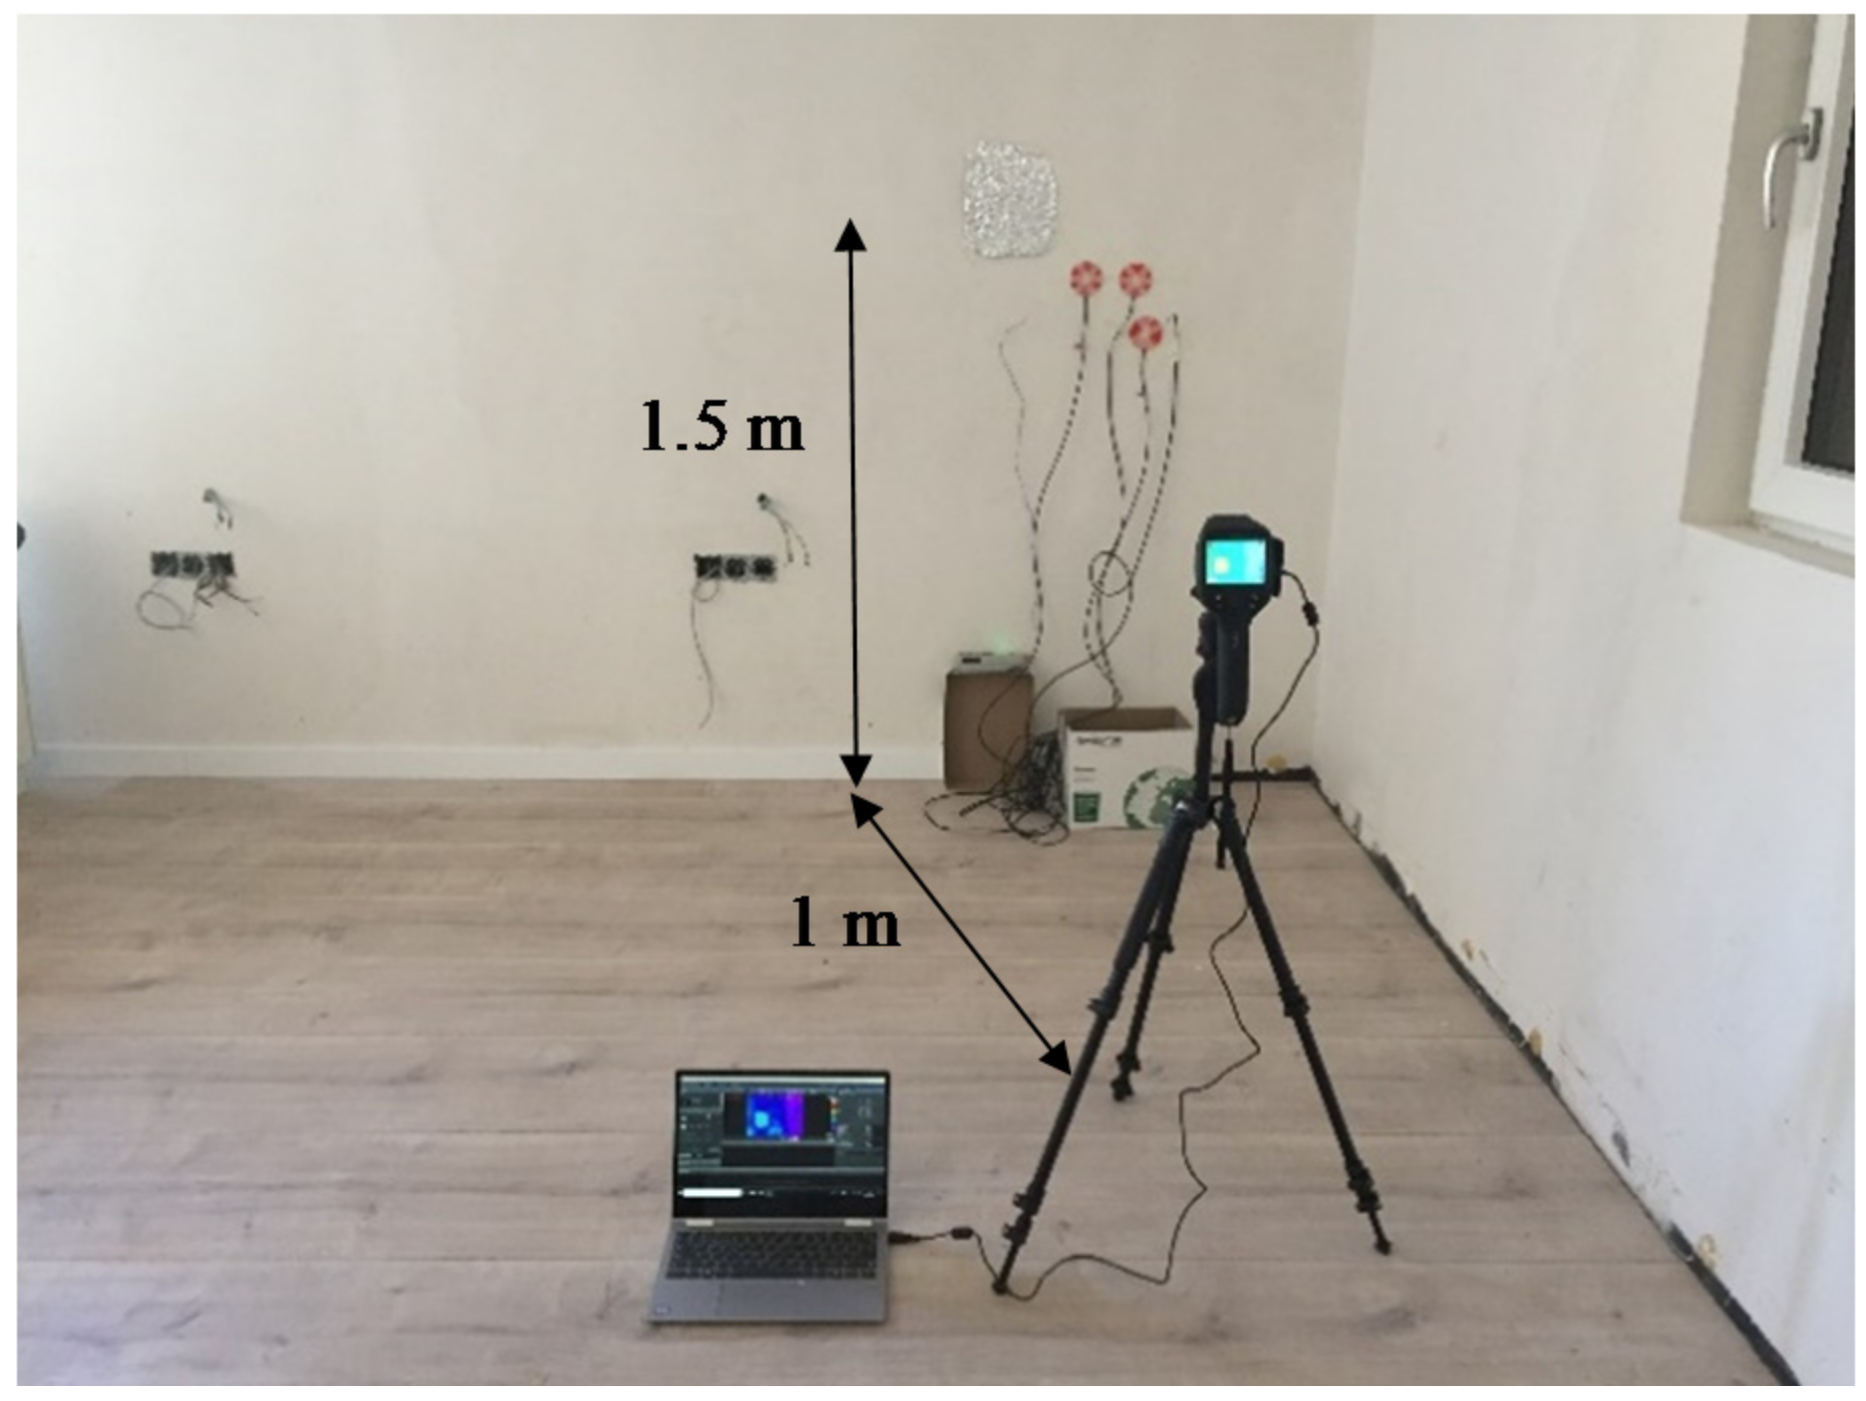
Quantitative infrared data (instantaneous wall surface temperature–TWALL- and reflected ambient temperature–TREF-) were recorded by using an IR camera (FLIR E60bx) and FLIR TOOLS+ Software [83]. Hence, each IRT test involved the post-processing of a sequential video with 120 or 180 thermograms. The wall surface emissivity (εWALL) was estimated at 0.88, for all walls, by means of aluminum crinkled foil (0.20 m × 0.15 m). The IRT measurements were performed over a period of 2–3 h, with a data acquisition interval of 1 min. For both NDTs, the inner and outer ambient air temperatures were monitored by using the same integrated sensors (107, Campbell Scientific, Inc.; 175T1, Instrumentos Testo SA). Notably, all the equipment was placed at 1.5 m above the ground floor, and the distance between the IR camera and target was set at 1 m. According to Tejedor et al. [61], the height of the walls is around of 2.5–3 m. Hence, a height of 1.5 m could be acceptable to obtain a mean value of the ambient air temperature inside the building and to avoid unknown reflection indexes attributed to the furniture or the ground. The instrumentation used is shown in Figure 2.

2.3. Case Studies

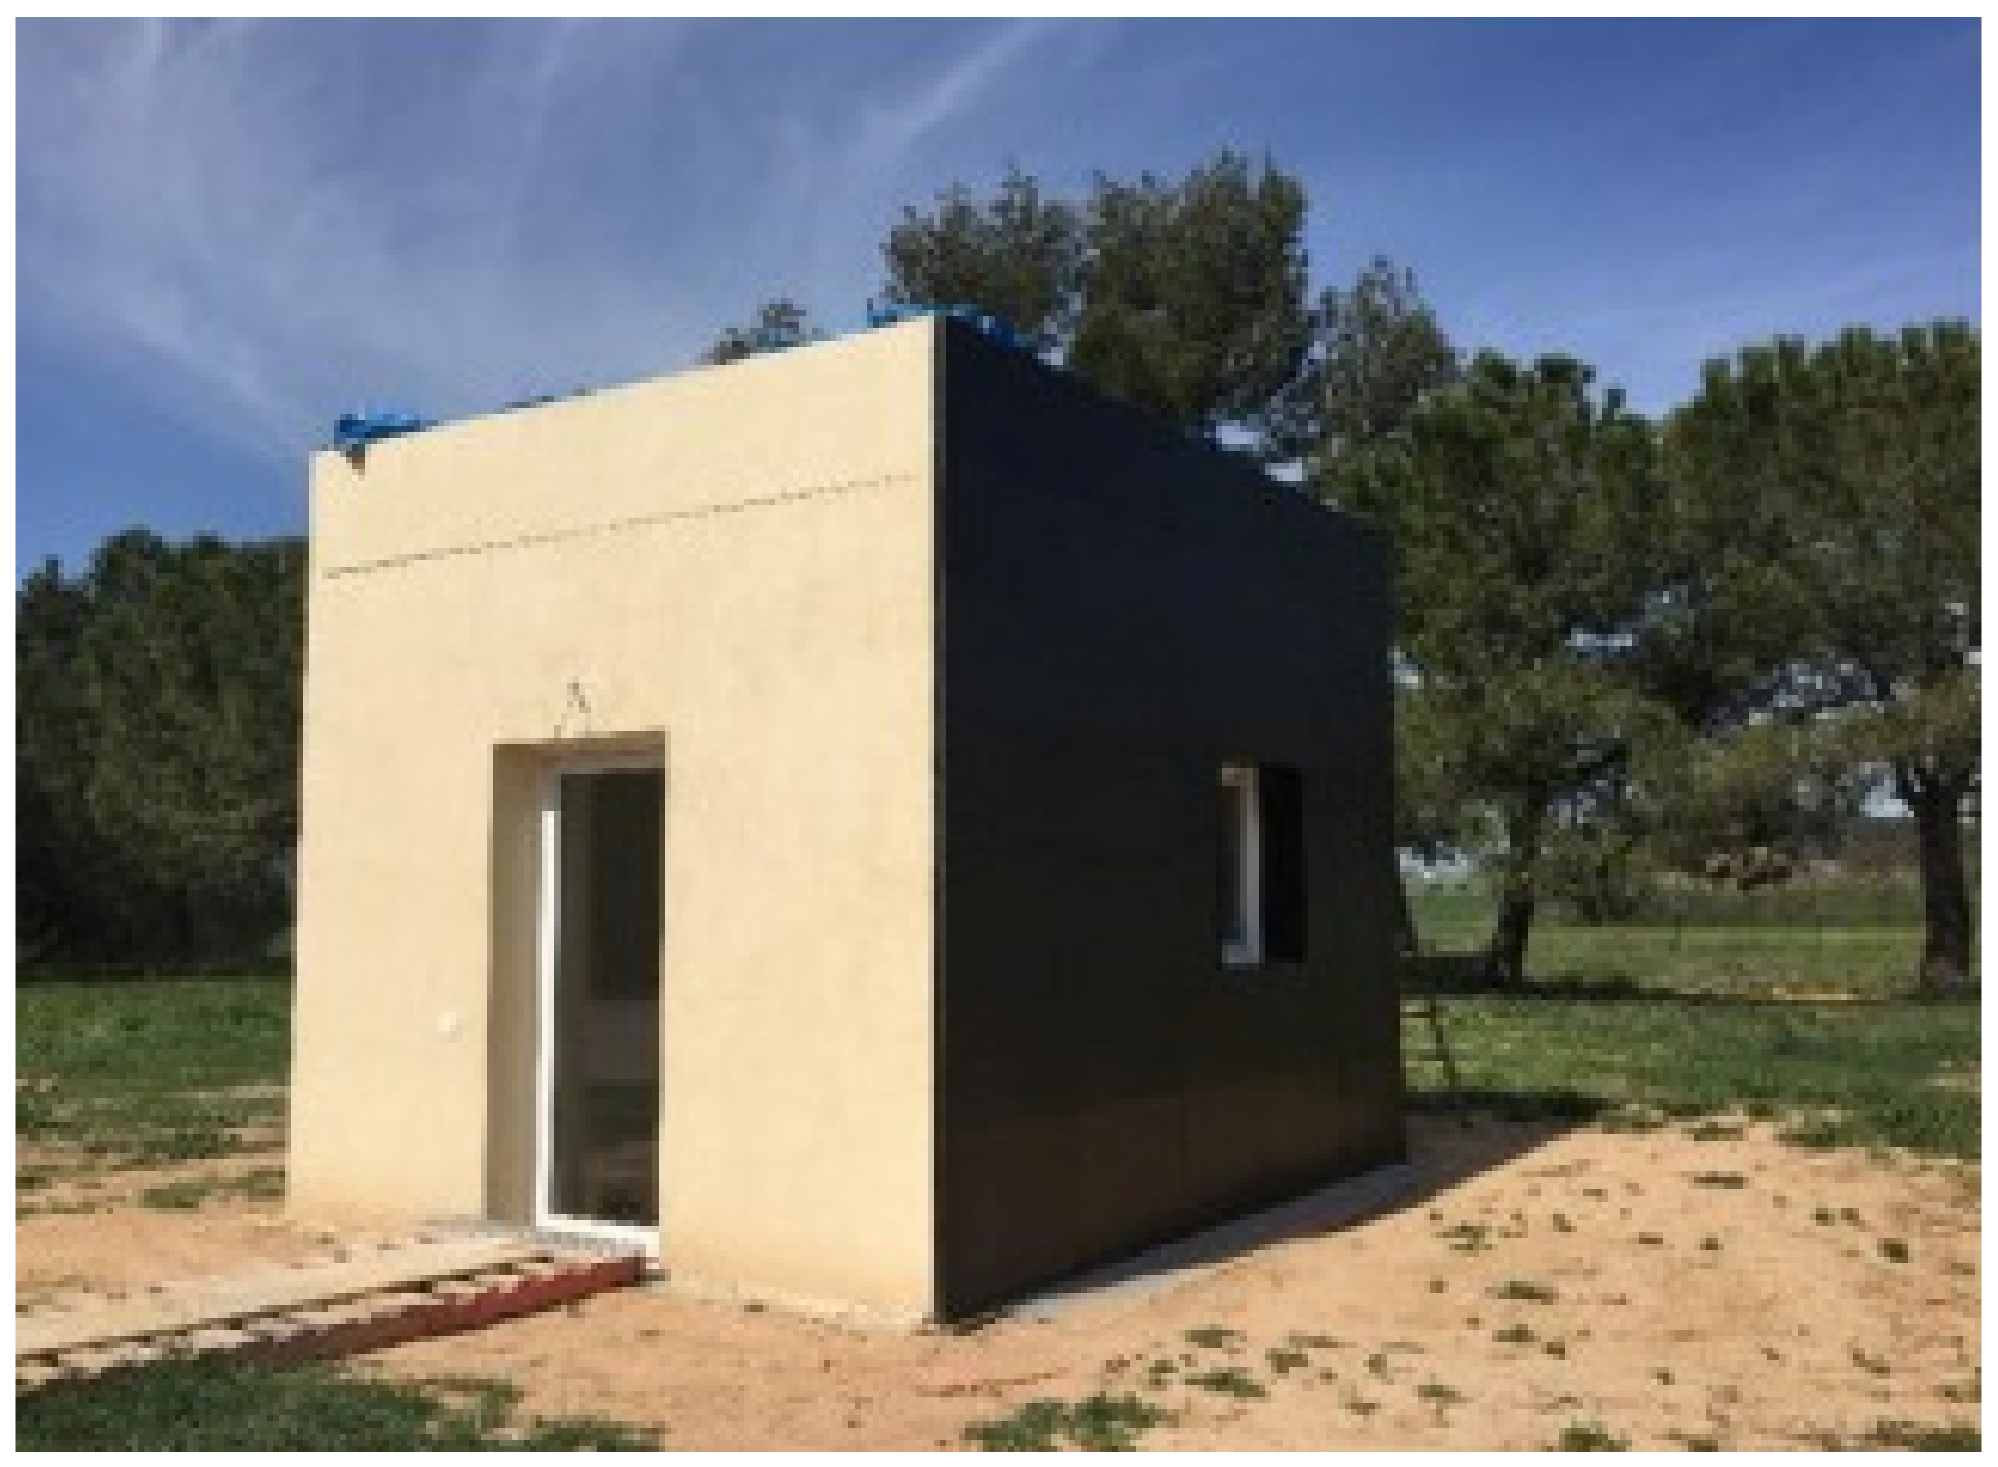
The following procedure was devised to illustrate the applicability of in situ measurement techniques to determine the thermal transmittance of highly insulated façades. Firstly, the experimental mock-up (A = 12 m2) with controlled climatic conditions was erected in January 2017, in order to determine good practices in the monitoring process of constructive solutions in the Mediterranean climate (Figure 3). In this way, it was possible to test a specimen that could ensure four of the six principles that define a passive house (PH): a high level of insulation, a minimum number of thermal bridges, highly efficient windows, and a high level of airtightness. The façade construction system consisted of a galvanized steel structure with prefabricated panels whose internal configuration was (from outside to inside) as follows: mortar, lightweight concrete, polyisocyanurate insulation (PIR), non-ventilated air cavity, lightweight concrete, and gypsum plaster. The main thermo-physical parameters are reported in detail in Table 2. Once the mock-up was erected, installations and finishes were carefully incorporated.
Having implemented the HFM and quantitative IRT as a tool of decision-making in terms of built quality, and taking into account the conclusions of the preliminary study, the wall was reproduced in the real built environment in February 2019 (Figure 4). The differences between specimens W1 (experimental mock-up) and W2 (detached house) were given by the thickness and the thermal resistance of the material layers. The technical features are shown below (Table 3). The detached house (A = 322 m2) was also characterized by high efficient doors (UD = 0.93 W/m2·K) and low-emissivity triple-glazing windows (UW = 0.99 W/m2·K) that allowed us to achieve an air renovation <0.56 h−1. As regards the building facilities, the mechanical ventilation was focused on a heat-recovery system (model ComfoAir Q450, Zehnder) with an efficiency of 95%, and the indoor environmental conditions were guaranteed by an aerothermal equipment of 6 kW (model HPSU, ROTEX).

3. Results

Two heavyweight walls with low U-value were monitored and evaluated in a stationary regime. The comparative analysis of techniques took into account the following: (i) the theoretical U-value, (ii) the U-value measured by the heat flux meter, (iii) the U-value measured by the quantitative internal infrared thermography, (iv) the test duration, and (v) the temperature gradient between inside and outside the building. The following statistical parameters were also estimated: the average value of thermal transmittance [W/(m2·K)], the standard deviation (SD) [W/(m2·K)], the coefficient of variation (CV) (%) of the measurements, and the absolute value of the relative difference between theoretical and measured U-values (%).

3.1. HFM Average Method

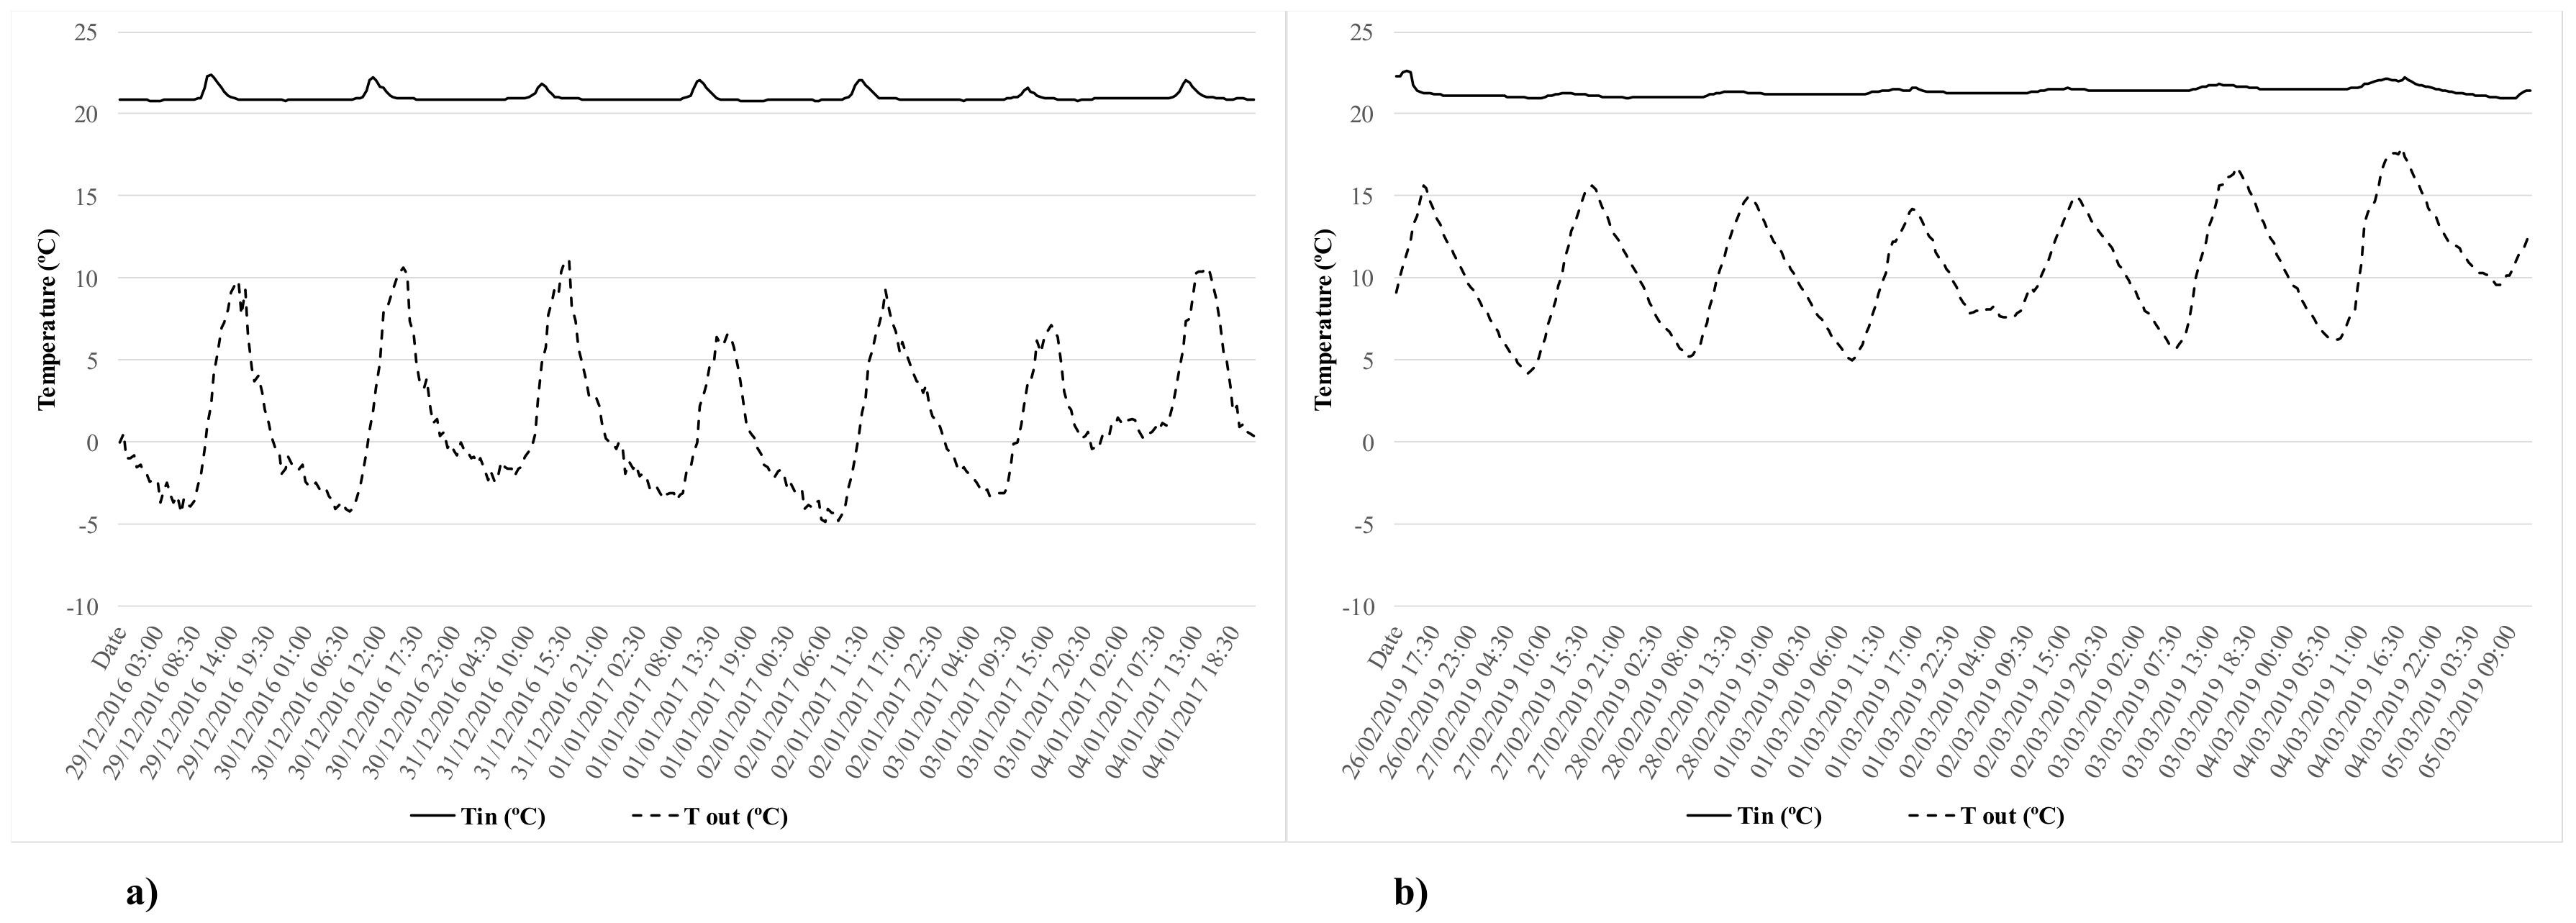
Both the experimental mock-up and the detached house were monitored for 168 h, obtaining 337 datasets of readings for each case. The experimental campaign of the building mock-up was conducted with a heater, with an average air temperature difference much higher than 15 °C [79]. However, the experimental campaign of the detached house was performed under actual environmental conditions, which ensured that the average temperature difference was greater than 10 °C [20,21] (Figure 5). Hence, the temperature during process monitoring was not a significant factor that influenced the results of the second case study. Measurement periods, as well as the average temperatures differences, are detailed in Table 4.
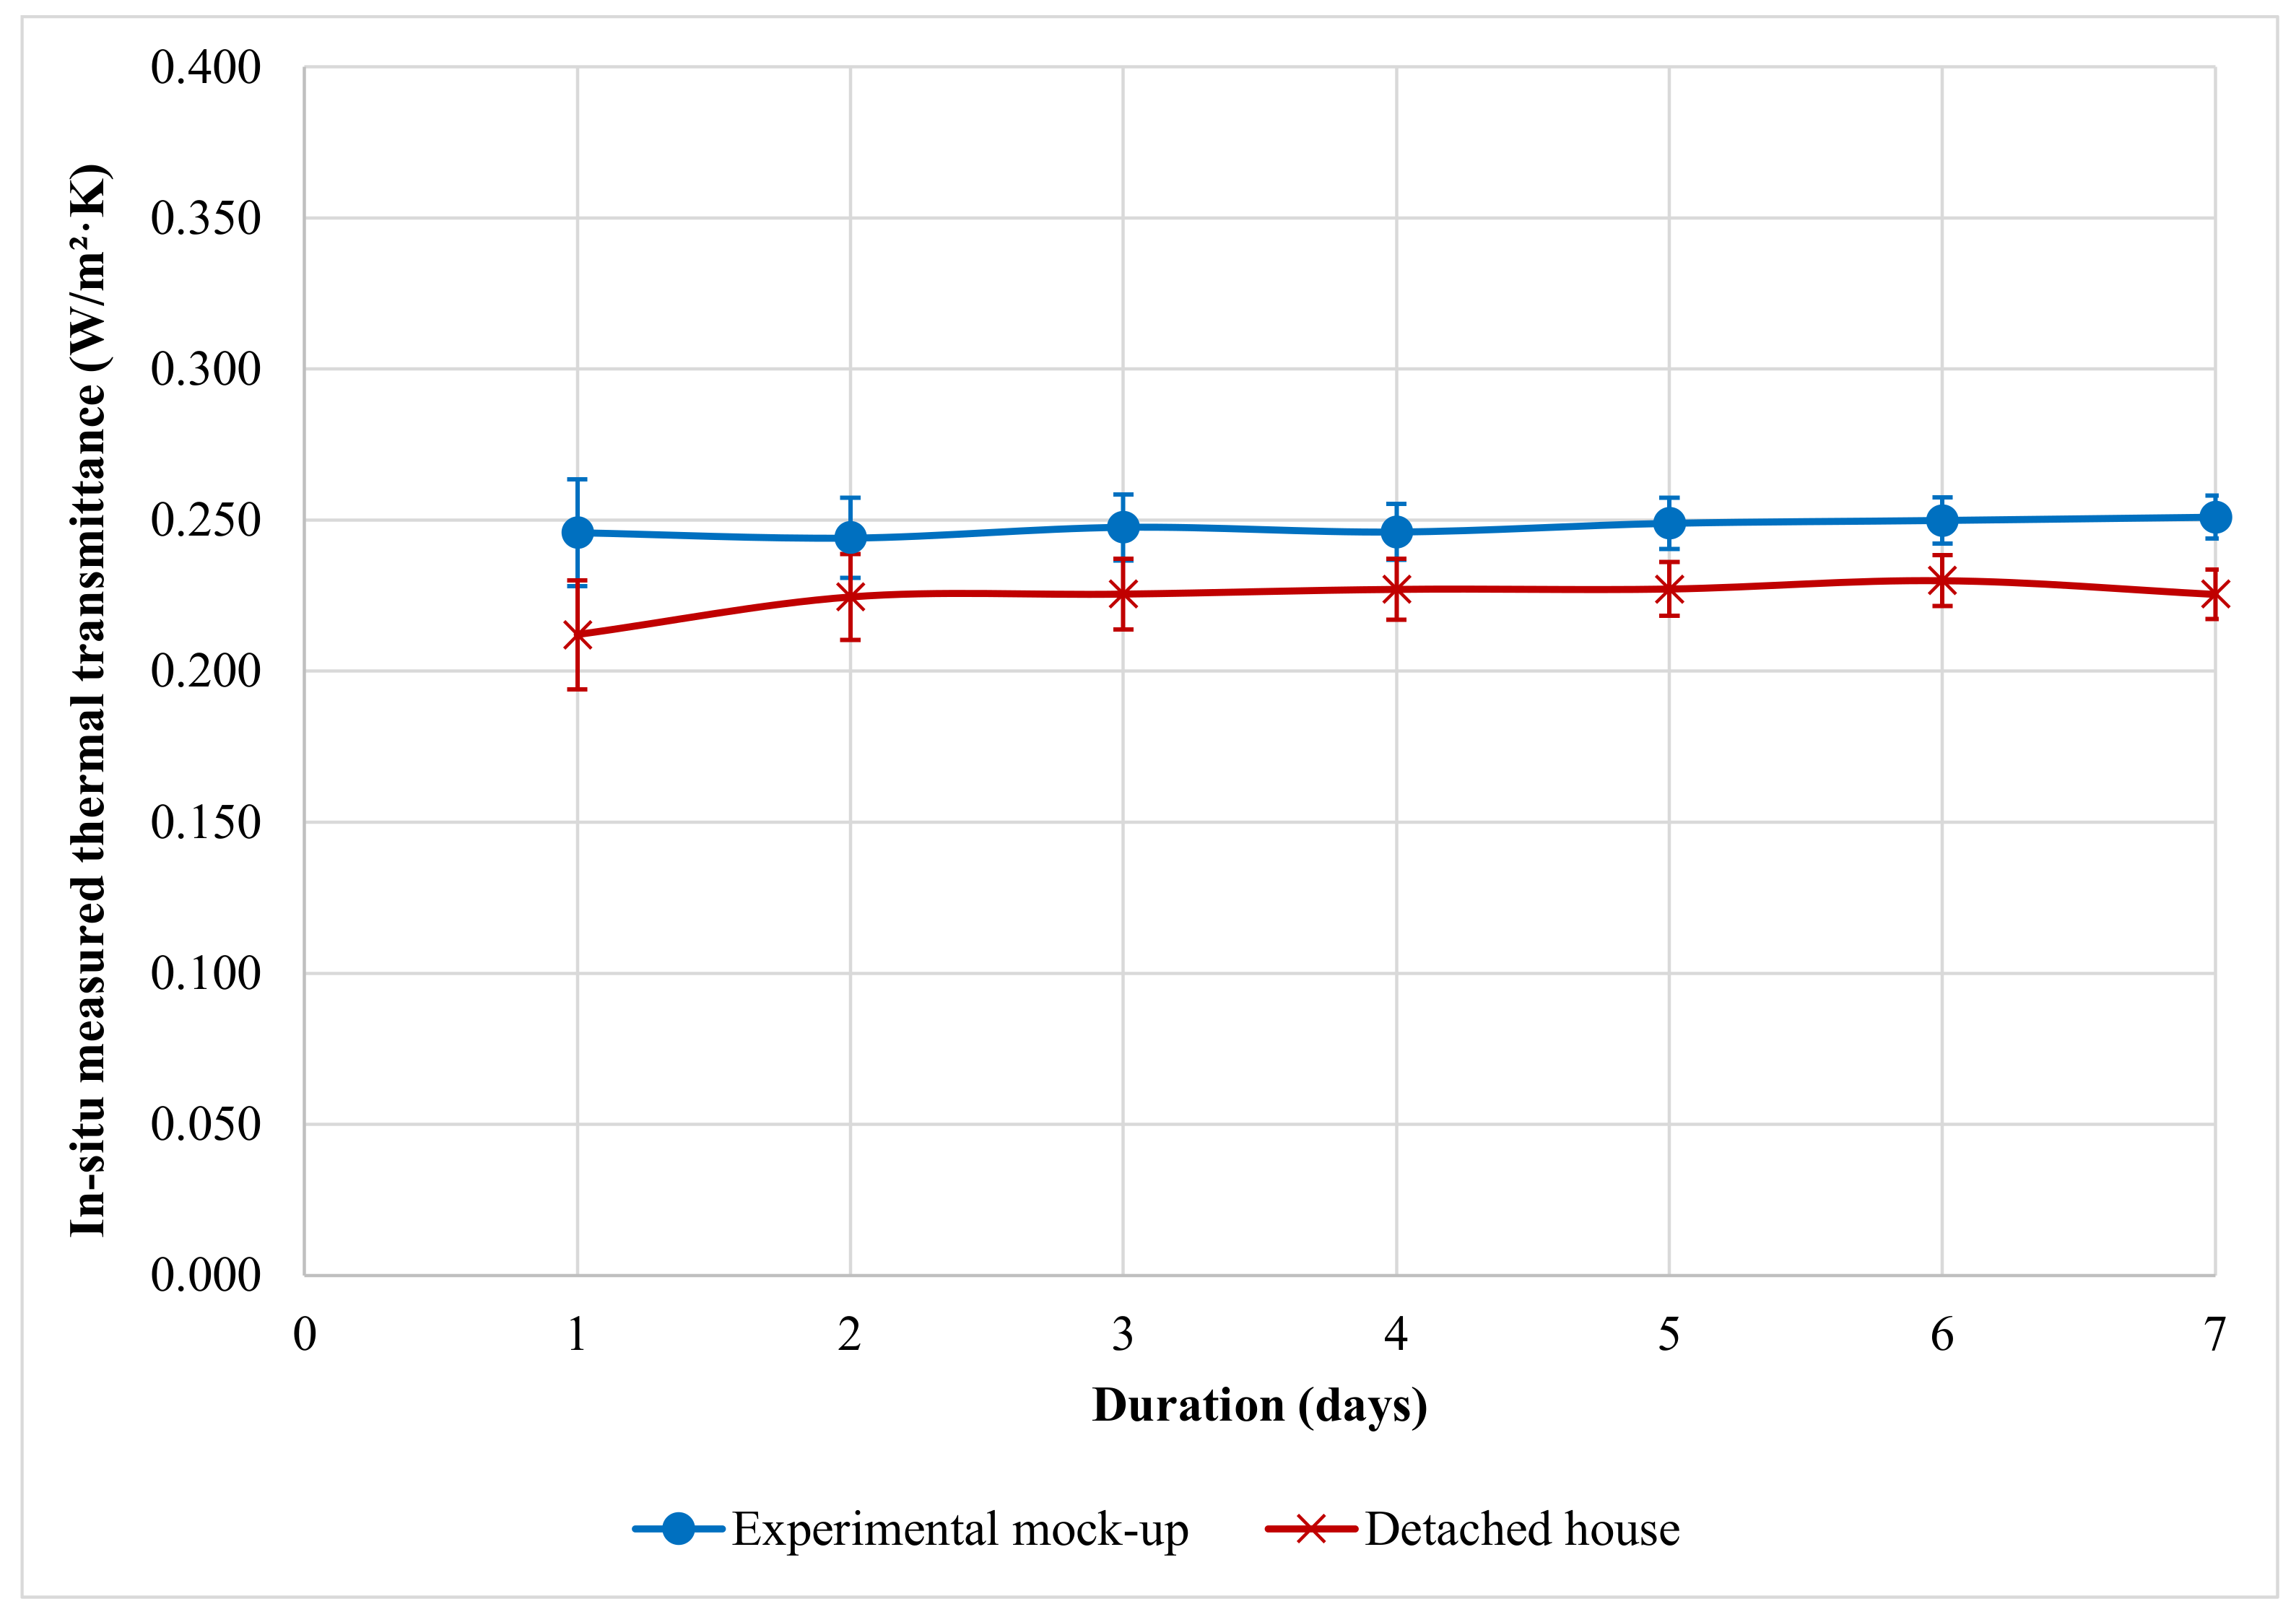
The measured thermal transmittances and their related uncertainty were calculated in 7 consecutive cycles of 24 h (Equations (1) and (2)), using accumulative data. Thus, the first cycle was calculated with data obtained during the first 24 h tested, the second cycle with data from the first 48 h tested, and successively for each cycle, up to the seventh day. The results obtained are depicted in Figure 6 and detailed in Table 4, where Um-HFM ± U(C) is the measured thermal transmittance, using the HFM average method and its associated uncertainty. It is noteworthy that uncertainties of measurement decreased as the tests were extended and when the average air temperature difference increased, which is in line with the results obtained by Asdrubali et al. [21] and Nardi et al. [28].
The minimum test duration for the experimental mock-up and the detached house was 72 h, in view of the fact that the second condition consisting of limiting the deviation between the U-value obtained at the end of the test from the value obtained 24 h earlier to 5% was fulfilled (1.4% and 0.4% respectively, as shown in Table 5), and that the third condition consisting of limiting the deviation between the U-value obtained by analyzing data from an initial period from the value obtained from data for the last period of the same duration to 5% was also fulfilled in both cases (2.3% and 1.5%, respectively, as shown in Table 6). Then, the variability of the results was verified, in both cases, through the coefficient of variation of the resulting U-values (Equations (3) and (4)). It was confirmed that the test could be ended at 72 h in both cases, since the coefficients of variation were lower than expected from 72 h of testing (Figure 7).
The measured thermal transmittance in both the experimental mock-up and the detached house was closely adjusted to the theoretical transmittance value, with absolute values of relative differences of less than 5%. However, it can be observed that the measured U-value of the experimental mock-up fit better with the theoretical U-value (1.05%) than the one of the detached house (3.06%) (Table 4). This difference in fitting could be due to two situations. Firstly, the theoretical thermal transmittance of the experimental mock-up was greater than that of the detached house. Secondly, conditions for conducting in situ tests were more optimal during the monitoring process of the experimental mock-up than those of the detached house. Consequently, the average temperature difference between indoor and outdoor environments was almost 9 °C greater during the testing process of the experimental mock-up than that of the detached house.

3.2. Quantitative Internal IRT Method

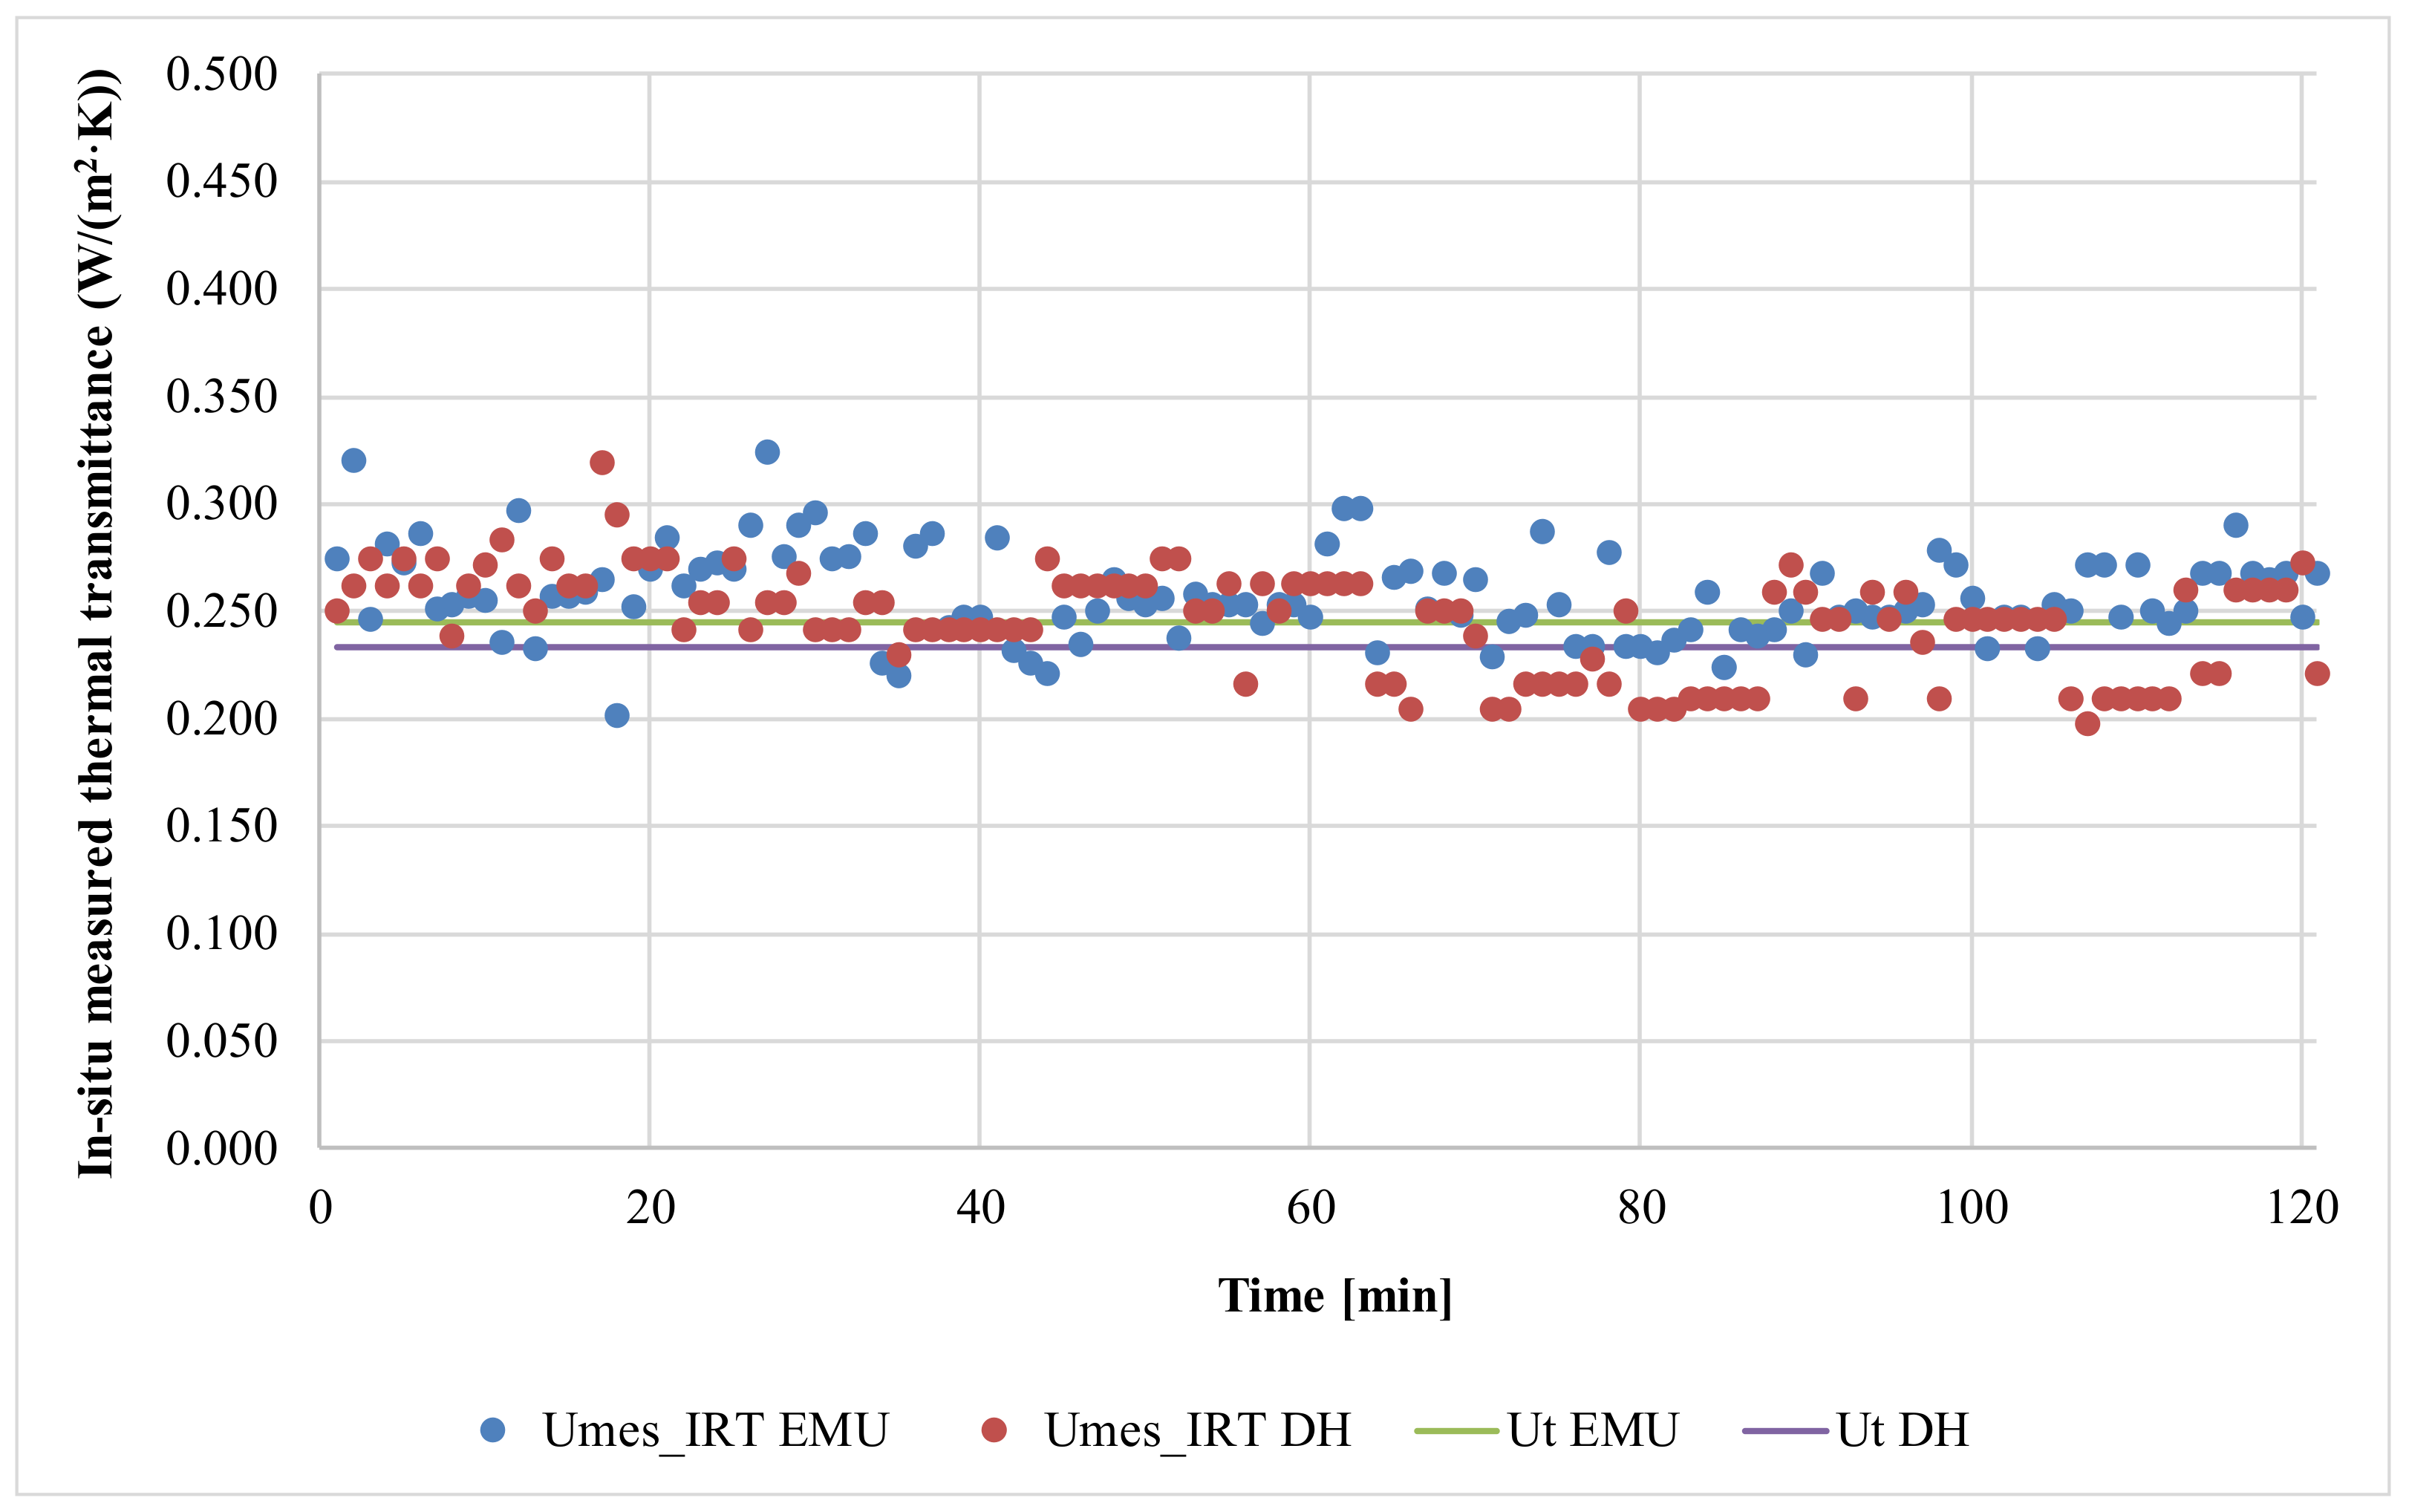
Previous studies have demonstrated that highly insulated walls (U-value < 0.400 W/m2·K) and low heat capacity per unit of area (~200 kJ/m2·K) might be more difficult to evaluate [63]. However, prefabricated panels based on the passive house concept had not been assessed by means of quantitative internal IRT. As seen in Section 2.3, the external opaque walls of the detached house were designed practically equal to the building envelopes of the experimental mock-up. In fact, the theoretical thermal transmittances were 0.245 and 0.233 W/m2·K, respectively. Concerning post-construction evaluation by thermography, the results revealed that the gap between the design nominal data and the real thermal performance was found to be 5% in both case studies (Table 7 and Figure 8). Hence, the proposed façade-building system of the mock-up fulfilled the expected thermal behavior in the real built environment. Despite this, a greater fluctuation of the measured thermal transmittance was observed for the detached house (Figure 8).
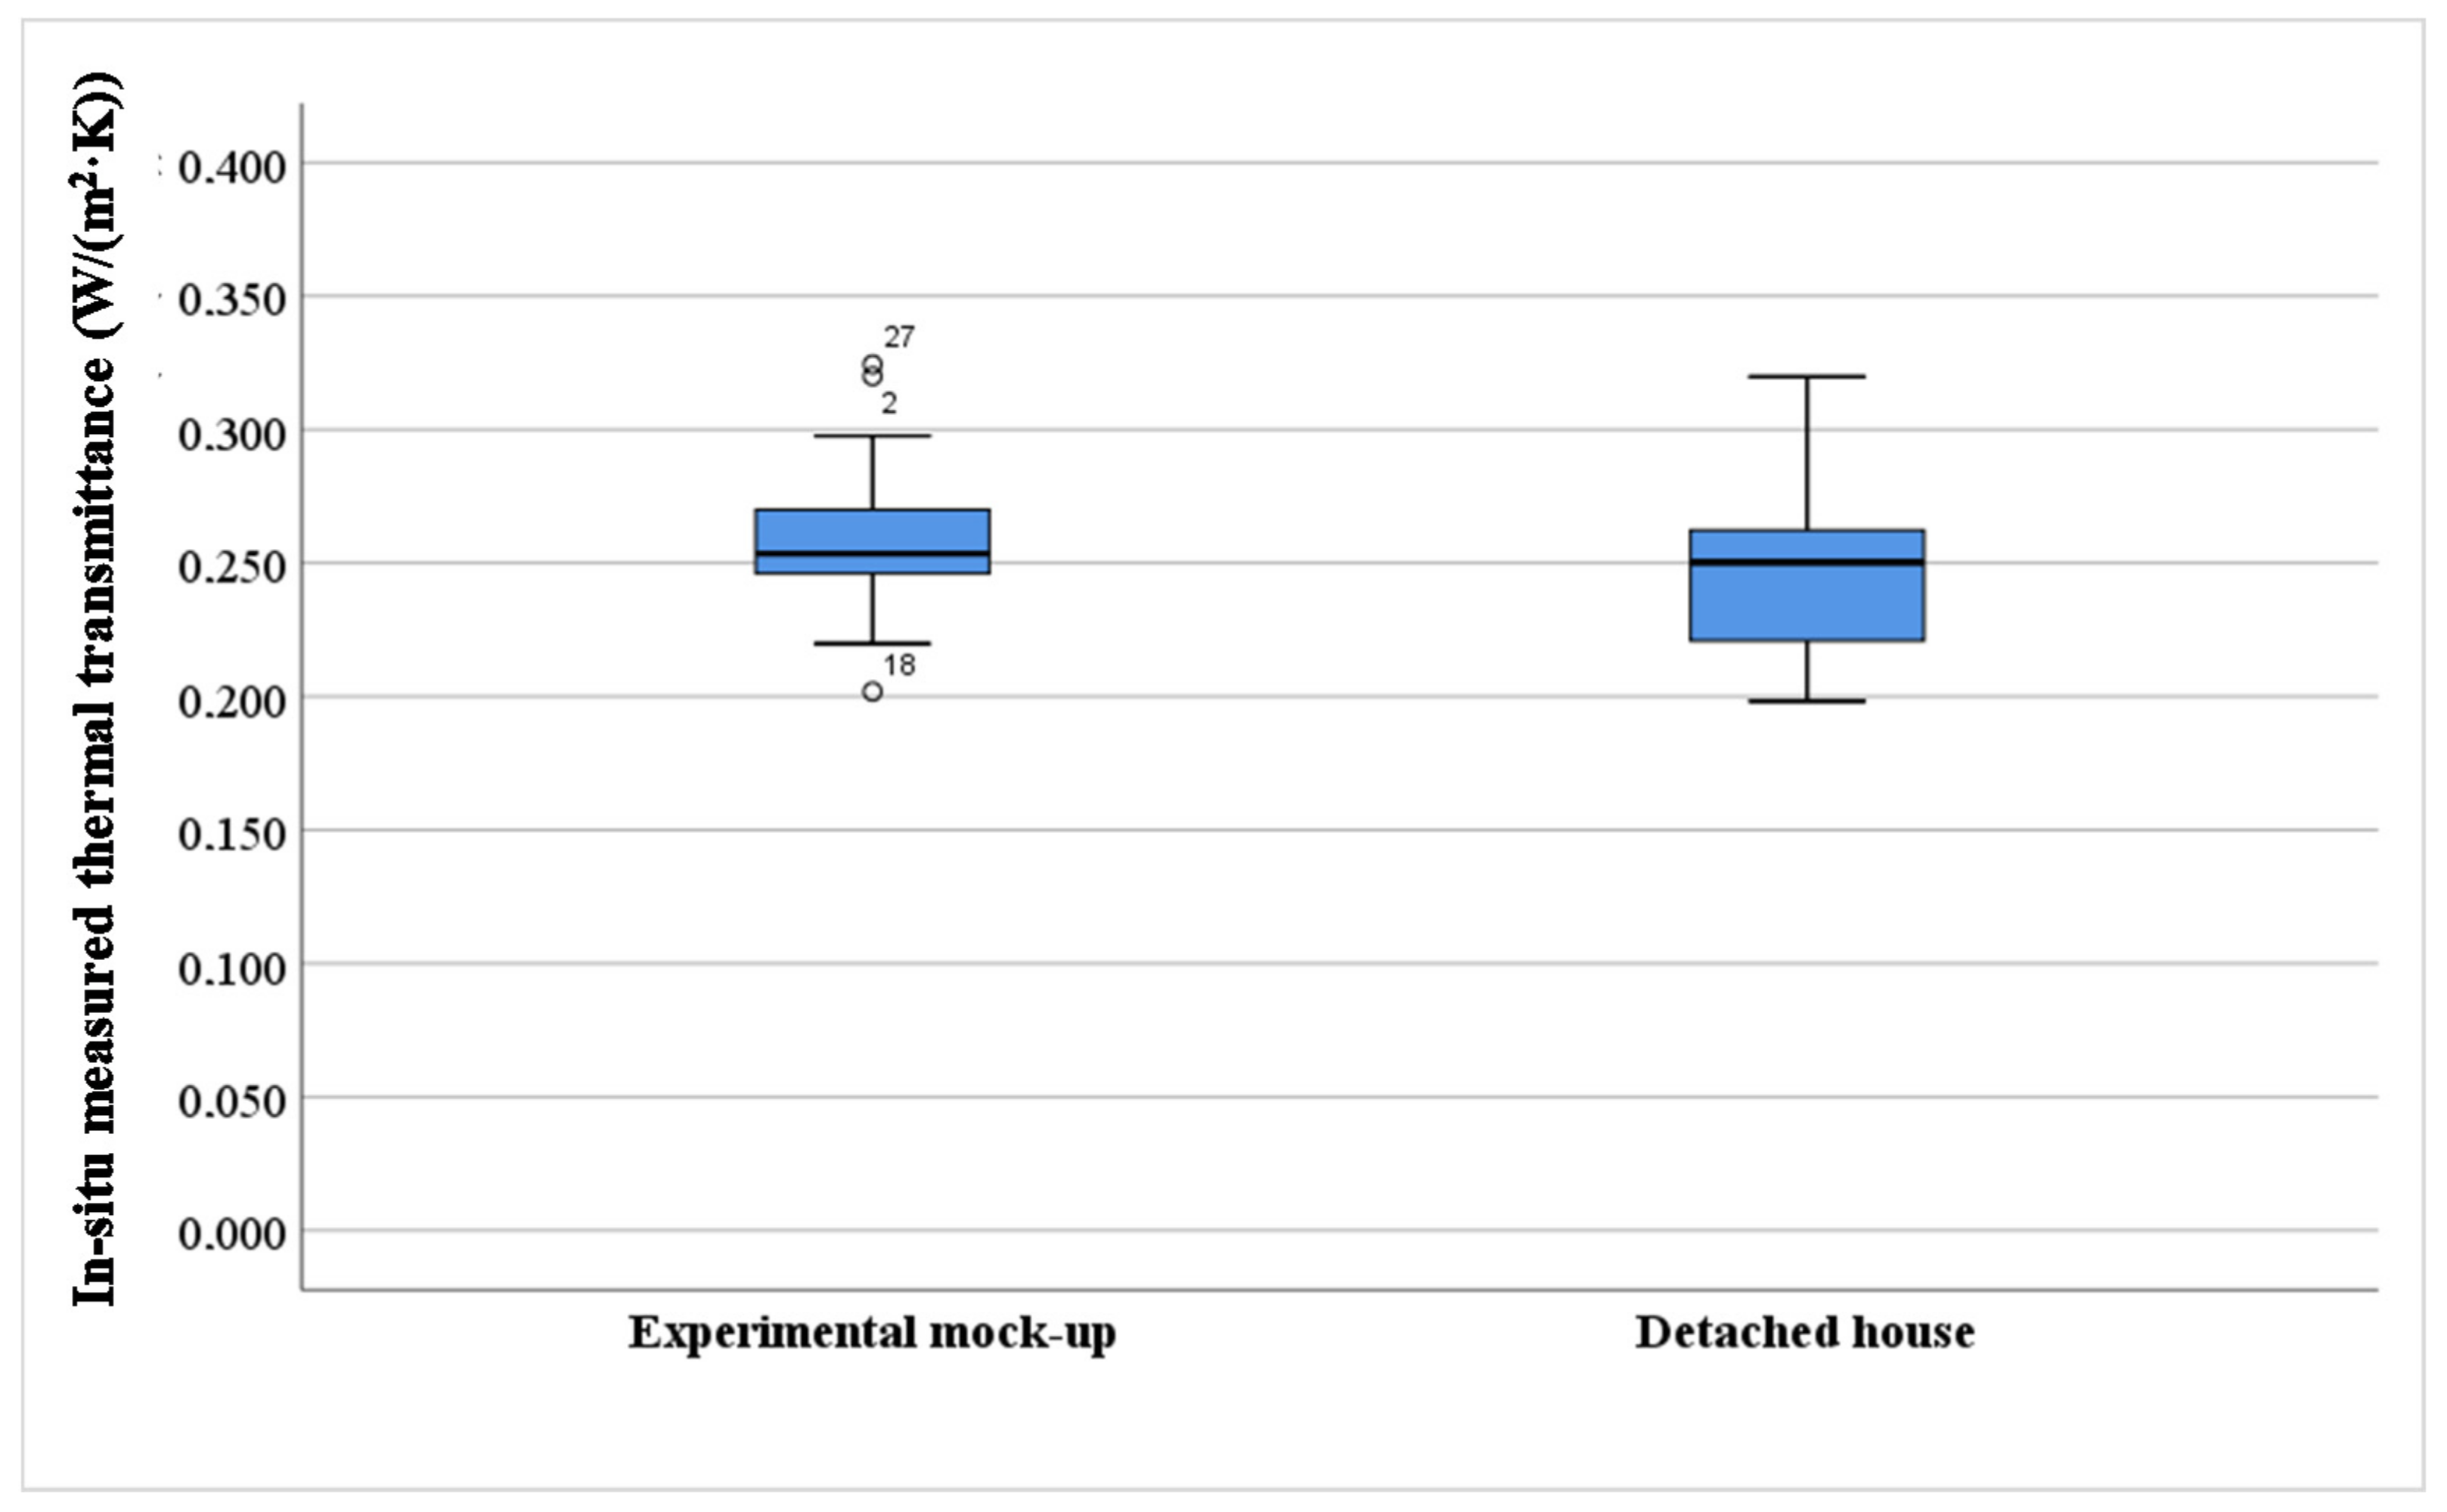
From the analysis of variability, it can be extrapolated that standard deviations were slightly similar (0.021 W/m2·K for W1 and 0.024 W/m2·K for W2) and the coefficients of variation (CV) were less than 10%. However, the plot of confidence intervals at 95% for IRT measurements (Figure 9) shows some differences between W1 and W2. It should be noted that a box plot indicates if a statistical datum is normally distributed (the median of the data is located in the middle of the box, and the quartiles are symmetric) or skewed. (the median of the data is closer to the bottom or to the top of the box, and the distribution of instantaneous measurements is asymmetric). In the case of the experimental mock-up, the minimum and maximum U-values were 0.202 and 0.324 W/m2·K (including outliers). A positive skew was also observed, since most of the instantaneous measurements fell in the upper quartile. As regards the three outliers (18, 2, and 27), they corresponded to three instantaneous measurements that were numerically distant from the other observations. Despite being outside of the whiskers of the box plot, these outliers would not affect the results because 121 data points are obtained for each test. In the case of the detached house, the minimum and maximum U-values were similar to W1 (0.198 and 0.320 W/m2·K, respectively). Nevertheless, the box of W2 had a wider interquartile range (IQR), and the distribution of the data was negatively skewed because the measurements were concentrated in the lower quartile. Taking into account that the internal assembly of the specimens was slightly similar, the spread of the data could be attributed to changes in the temperature gradient between inside and outside the building.

4. Discussion

The results of this research revealed that in situ measurement techniques can be useful to assess the build quality of a new passive house before its operational stage. Indeed, they allow us to quantify the gap between the design or modeling and the actual work. However, it is a proof of concept for both non-invasive techniques, and, consequently, further research is required. For the first time, thermography was implemented in a quantitative way, to determine the in situ thermal transmittance of passive house façades. Previous studies demonstrated that the optimal ΔT of quantitative IRT ranged between 7 and 10 °C for conventional heavy multi-leaf walls (U > 0.362 W/m2·K) [63]. In the current research, the above statement could also be assumed. Besides this, this technique is characterized to be faster than HFM, since the IRT test only takes 2 h. In contrast, HFM offers better results for PH façades in terms of accuracy and dispersion of the instantaneous measurements. The deviation between theoretical and measured U-values was found to be 1.05% (W1) and 3.06% (W2) for the HFM, compared to ~5% for QIRT. The coefficient of variation ranged from 1.39 (W1) to 6.80 (W2) for HFM, while the values for the thermographic analysis were found to be 8.06% (W1) and 9.69% (W2). Notably, the good HFM results of the experimental mock-up could be attributed to the high temperature gradient (~19 °C) that was achieved during the measurement campaign.
Determining the actual thermal transmittance of low U-value façades when weather conditions are favorable and temperature differences between the inner and outer environments are greater than 10 °C requires a minimum test duration of 72 h, using the HFM average method, and 2 h of using the QIRT method. The first condition implies that practitioners should check the short-term weather forecast before starting the test. The second condition represents a limitation in the period of time in which the test can be performed, especially when the HFM method is used. In the Mediterranean climate, due to the need to obtain large temperature differences between environments, the test should be scheduled for the coldest months (normally from October to April).
In terms of execution of the method, the practitioner should have experience in conducting measurement campaigns in the real built environment. In both methods, the tests should be performed on northern façades and preferably in the early morning, with a low wind speed (<1 m/s), since wind and incident solar radiation are adopted as external thermal stimuli that could alter convective factors or lead to a time lag of a few hours [61,75]. Despite this, some differences between HFM and QIRT were highlighted. The installation of the equipment for the HFM monitoring process may be easier for professionals to carry out by following the ISO recommendations. However, a prior inspection, with the help of qualitative IRT, is needed to detect the ideal location of heat-flow meters. In addition, HFM could be considered more invasive. To guarantee proper thermal contact between the transducer and the wall, a layer of thermal interface material (with a thickness of less than 0.01 m) should be applied. As regards the installation of equipment for the QIRT, the monitoring process requires practitioners with specific training to calibrate the IR camera in accordance with the target and to achieve a reliable sequential video recorded during the test. Parameters such as the emissivity of the wall or the reflected ambient temperature can be adjusted during post-processing with the specific software, but the wall area or the distance between the IR camera and the specimen cannot be changed later. Furthermore, the practitioner should follow some recommendations: (i) avoid measuring near corners since heated adjacent walls could impact on the results; (ii) pay attention to internal climatic conditions, because some air current peaks can lead to a non-homogeneity of heat flux and temperature on the wall; and (iii) leave the wall free of furniture, to remove uncontrolled reflection indexes.
In terms of data analysis, the HFM average method can be performed by using tools readily available to technicians, such as a simple spreadsheet. In contrast, advanced tools are required for data processing when the QIRT method is used. The technician needs to assess the 120 thermal images with the specific software (i.e., FLIR TOOLS+) and transfer the readings of wall parameters (TWALL, TREF, and εWALL) to a spreadsheet, where the numerical model is computed, taking into account measured environmental parameters, among other aspects. Nevertheless, some soft skills are common to both NDTs: (i) thermophysical knowledge about building materials (with or without anomalies), especially to implement the method or to interpret thermograms; and (ii) knowledge of data processing and statistical treatment for the visualization of results.

5. Conclusions

Passive construction is expected to increase due to European environmental regulations and the sensibility of police makers related to building energy consumption. For this reason, the use of NDT as a diagnosis tool could be essential to verify the compliance with design technical specifications. Along this line, the main contribution of this research is the analysis of the applicability of non-destructive techniques for the post-construction evaluation of thermal transmittance of passive house façades in steady-state conditions.
According to the literature review, the heat flux meter method is a non-destructive technique standardized by ISO 9869-1:2014 [76]. Currently its use in PH is not very widespread, even in the Mediterranean climate. Indeed, the literature review showed that some constraints of applying the HFM average method can arise when the practitioner wants to verify the compliance with technical specifications of projects in façades with low U-value. One of the main constraints is the high deviations obtained between the measured and its corresponding theoretical U-value, as can be seen in previous studies. According to Ficco et al. [23] and Nardi et al. [28], these deviations are more pronounced when climatic conditions are not stable during the monitoring process. Another constraint is the fact that some testing parameters for the monitoring process are not fully specified for measuring façades with low U-value by the Standard ISO 9869-1:2014 [76], such as temperature difference between indoor and outdoor environment and the test duration. Concerning the quantitative IRT, a significant reduction of the prices of IR cameras [33] led the researchers to put their efforts in the development of accurate approaches related to the thermal characterization of building envelopes. Nevertheless, a gap still exists in the implementation of QIRT in passive houses.
In the current research, the assessment of an experimental mock-up with controlled climatic conditions allowed to check the possible suitability of the NDT in highly insulated walls and to define good practices for a detached house based on PH concept under real environmental conditions. Based on the analysis of results and the respective discussion, this study demonstrated that the HFM average method and quantitative internal IRT can be executed successfully for determining the in situ U-value of passive house façades. Despite this, neither one of the NDTs was implemented in warmer climates or conducted in summer. Hence, the applicability of the HFM average method and the quantitative internal thermography has not been demonstrated under these mentioned boundary conditions, and, consequently, further research is needed. Furthermore, the practitioner should choose the method, depending on test duration, thermal gradient, experience in measurement campaigns, and knowledge in data analysis.

Author Contributions

Conceptualization, K.G. and B.T.; methodology, K.G. and B.T.; software, B.T.; validation, K.G. and B.T.; formal analysis, K.G. and B.T.; investigation, K.G. and B.T.; resources, M.C.; data curation, M.C.; writing—original draft preparation, K.G. and B.T.; writing—review and editing, M.G.; visualization, M.G.; supervision, M.C.; project administration, M.C; funding acquisition, M.C. All authors have read and agreed to the published version of the manuscript.

Funding

This research was partially funded by the Government of Catalonia, Research Grant 2017–SGR–227.

Acknowledgments

The authors acknowledge Evowall Technology for providing the experimental mock-up and the detached house and facilitating the monitoring process.

Conflicts of Interest

The authors declare no conflict of interest. The funders had no role in the design of the study; in the collection, analyses, or interpretation of data; in the writing of the manuscript; or in the decision to publish the results.

References

  1. Kylili, A.; Fokaides, P.A.; Jimenez, P.A.L. Key Performance Indicators (KPIs) approach in buildings renovation for the sustainability of the built environment: A review. Renew. Sustain. Energy Rev. 2016, 56, 906–915. [Google Scholar] [CrossRef]
  2. Wang, Y.; Du, J.; Kuckelkorn, J.M.; Kirschbaum, A.; Gu, X.; Li, D. Identifying the feasibility of establishing a passive house school in Central Europe: An energy performance and carbon emissions monitoring study in Germany. Renew. Sustain. Energy Rev. 2019, 113, 109256. [Google Scholar] [CrossRef]
  3. Johnston, D.; Siddall, M.; Ottinger, O.; Peper, S.; Feist, W. Are the energy savings of the passive house standard reliable? A review of the as-built thermal and space heating performance of passive house dwellings from 1990 to 2018. Energy Effic. 2020, 13, 1605–1631. [Google Scholar] [CrossRef]
  4. Rohdin, P.; Molin, A.; Moshfegh, B. Experiences from nine passive houses in Sweden—Indoor thermal environment and energy use. Build. Environ. 2014, 71, 176–185. [Google Scholar] [CrossRef] [Green Version]
  5. Dalbem, R.; Grala da Cunha, E.; Vicente, R.; Figueiredo, A.; Oliveira, R.; Baptista da Silva, A.C.S. Optimisation of a social housing for south of Brazil: From basic performance standard to passive house concept. Energy 2019, 167, 1278–1296. [Google Scholar] [CrossRef]
  6. Piccardo, C.; Dodoo, A.; Gustavsson, L. Retrofitting a building to passive house level: A life cycle carbon balance. Energy Build. 2020, 223, 110135. [Google Scholar] [CrossRef]
  7. Mihai, M.; Tanasiev, V.; Dinca, C.; Badea, A.; Vidu, R. Passive house analysis in terms of energy performance. Energy Build. 2017, 144, 74–86. [Google Scholar] [CrossRef]
  8. Wang, R.; Lu, S.; Feng, W. A three-stage optimization methodology for envelope design of passive house considering energy demand, thermal comfort and cost. Energy 2020, 192, 116723. [Google Scholar] [CrossRef]
  9. Tokarik, M.S.; Richman, R.C. Life cycle cost optimization of passive energy efficiency improvements in a Toronto house. Energy Build. 2016, 118, 160–169. [Google Scholar] [CrossRef]
  10. Ekström, T.; Bernardo, R.; Blomsterberg, A. Cost-effective passive house renovation packages for Swedish single-family houses from the 1960s and 1970s. Energy Build. 2018, 161, 89–102. [Google Scholar] [CrossRef]
  11. Kylili, A.; Ilic, M.; Fokaides, P.A. Whole-building Life Cycle Assessment (LCA) of a passive house of the sub-tropical climatic zone. Resour. Conserv. Recycl. 2017, 116, 169–177. [Google Scholar] [CrossRef]
  12. Wang, Y.; Kuckelborn, J.; Zhao, F.-Y.; Spliethoff, H.; Lang, W. A state of art of review on interactions between energy performance and indoor environment quality in Passive House buildings. Renew. Sustain. Energy Rev. 2017, 72, 1303–1319. [Google Scholar] [CrossRef]
  13. Liang, X.; Wang, Y.; Royapoor, M.; Wu, Q.; Roskilly, T. Comparison of building performance between Conventional House and Passive House in the UK. Energy Procedia 2017, 142, 1823–1828. [Google Scholar] [CrossRef]
  14. Guerra-Santin, O.; Tweed, C.; Jenkins, H.; Jiang, S. Monitoring the performance of low energy dwellings: Two UK case studies. Energy Build. 2013, 64, 32–40. [Google Scholar] [CrossRef]
  15. Johnston, D.; Farmer, D.; Brooke-Peat, M.; Miles-Shenton, D. Bridging the domestic building fabric performance gap. Build. Res. Inf. 2014, 44, 147–159. [Google Scholar] [CrossRef]
  16. Stamp, S. Assessing Uncertainty in Co-Heating Test: Calibrating a Whole Building Steady State Heat Loss Measurement Method. Ph.D. Thesis, University College London (UCL), London, UK, 2015. [Google Scholar]
  17. Johnston, D.; Siddall, M. The building fabric thermal performance of Passivhaus dwellings—Does it do what it says on the tin? Sustainability 2016, 8, 97. [Google Scholar] [CrossRef] [Green Version]
  18. Gupta, R.; Kotopouleas, A. Magnitude and extent of building fabric thermal performance gap in UK low energy housing. Appl. Energy 2018, 222, 673–686. [Google Scholar] [CrossRef]
  19. Baker, P. U-values and traditional buildings. In situ measurements and their comparisons to calculated values. Hist. Scotl. Alba Aosmhor Tech. Pap. 2011, 10, 70. [Google Scholar]
  20. Desogus, G.; Mura, S.; Ricciu, R. Comparing different approaches to in situ measurement of building components thermal resistance. Energy Build. 2011, 43, 2613–2620. [Google Scholar] [CrossRef]
  21. Asdrubali, F.; D’Alessandro, F.; Baldinelli, G.; Bianchi, F. Evaluating in situ thermal transmittance of green buildings masonries: A case study. Case Stud. Constr. Mater. 2014, 1, 53–59. [Google Scholar] [CrossRef]
  22. Evangelisti, L.; Guattari, C.; Gori, P.; De Lieto Vollaro, R. In situ thermal transmittance measurements for investigating differences between wall models and actual building performance. Sustainability 2015, 7, 10388–10398. [Google Scholar] [CrossRef] [Green Version]
  23. Ficco, G.; Iannetta, F.; Ianniello, E.; d’Ambrosio Alfano, F.R.; Dell’Isola, M. U-value in situ measurement for energy diagnosis of existing buildings. Energy Build. 2015, 104, 108–121. [Google Scholar] [CrossRef]
  24. Bienvenido-Huertas, D.; Rodríguez-Álvaro, R.; Moyano, J.J.; Rico, F.; Marín, D. Determining the U-value of façades using the thermometric method: Potentials and limitations. Energies 2018, 11, 360. [Google Scholar] [CrossRef] [Green Version]
  25. Evangelisti, L.; Guattari, C.; De Lieto Vollaro, R.; Asdrubali, F. A methodological approach for heat-flow meter data post-processing under different climatic conditions and wall orientations. Energy Build. 2020, 223, 110216. [Google Scholar] [CrossRef]
  26. Mandilaras, I.; Atsonios, I.; Zannis, G.; Founti, M. Thermal performance of a building envelope incorporating ETICS with vacuum insulation panels and EPS. Energy Build. 2014, 85, 654–665. [Google Scholar] [CrossRef]
  27. Albatici, R.; Tonelli, A.M.; Chiogna, M. A comprehensive experimental approach for the validation of quantitative infrared thermography in the evaluation of building thermal transmittance. Appl. Energy 2015, 141, 218–228. [Google Scholar] [CrossRef]
  28. Nardi, I.; Ambrosini, D.; Rubeis, T.; de Sfarra, S.; Perilli, S.; Pasqualoni, G. A comparison between thermographic and flow-meter methods for the evaluation of thermal transmittance of different wall constructions. J. Phys. Conf. Ser. 2015, 655, 012007. [Google Scholar] [CrossRef] [Green Version]
  29. Bros-Williamson, J.; Garnier, C.; Currie, J.I. A longitudinal building fabric and energy performance analysis of two homes built to different energy principles. Energy Build. 2016, 130, 578–591. [Google Scholar] [CrossRef] [Green Version]
  30. Samardzioska, T.; Apostolska, R. Measurement of heat-flux of new type façade walls. Sustainability 2016, 8, 1031. [Google Scholar] [CrossRef] [Green Version]
  31. Qu, Z.; Jiang, P.; Zhang, W. Development and application of infrared thermography non-destructive testing techniques. Sensors 2020, 20, 3851. [Google Scholar] [CrossRef]
  32. RESNET—Residential Energy Services Network. RESNET Interim Guideline for Thermographic Inspections of Buildings. 2012. Available online: http://www.resnet.us/standards/RESNET_IR_interim_guidelines.pdf (accessed on 4 October 2020).
  33. Nardi, I.; Lucchi, E.; De Rubeis, T.; Ambrosini, D. Quantification of heat energy losses through the building envelope: A state-of-the-art with critical and comprehensive review on infrared thermography. Build. Environ. 2018, 146, 190–205. [Google Scholar] [CrossRef] [Green Version]
  34. Bienvenido-Huertas, D.; Moyano, J.; Marín, D.; Fresco-Contreras, R. Review of in situ methods for assessing the thermal transmittance of walls. Renew. Sustain. Energy Rev. 2019, 102, 356–371. [Google Scholar] [CrossRef]
  35. Tejedor, B.; Barreira, E.; Almeida, R.M.S.F.; Casals, M. Thermographic 2D U-value map for quantifying thermal bridges in building façades. Energy Build. 2020, 224, 110176. [Google Scholar] [CrossRef]
  36. Rocha, J.H.A.; Santos, C.F.; Póvoas, Y.V. Evaluation of the infrared thermography technique for capillarity moisture detection in buildings. Procedia Struct. Integr. 2018, 11, 107–113. [Google Scholar] [CrossRef]
  37. Nardi, I.; Perilli, S.; De Rubeis, T.; Sfarra, S.; Ambrosini, D. Influence of insulation defects on the thermal performance of walls. An experimental and numerical investigation. J. Build. Eng. 2019, 21, 355–365. [Google Scholar] [CrossRef] [Green Version]
  38. Garrido, I.; Solla, M.; Lagüela, S.; Fernández, N. IRT and GPR techniques for moisture detection and characterization in buildings. Sensors 2020, 20, 6421. [Google Scholar] [CrossRef]
  39. Huang, Y.; Shih, P.; Hsu, K.-T.; Chiang, C.-H. To identify the defects illustrated on building façades by employing infrared thermography under shadow. NDT & E Int. 2020, 111, 102240. [Google Scholar] [CrossRef]
  40. Martens, U.; Schröder, K.-U. Evaluation of infrared thermography methods for analyzing the damage behavior of adhesively bonded repair solutions. Compos. Struct. 2020, 240, 111991. [Google Scholar] [CrossRef]
  41. Lucchi, E. Thermal transmittance of historical stone masonries: A comparison among standard, calculated and measured data. Energy Build. 2017, 151, 393–405. [Google Scholar] [CrossRef]
  42. International Organization for Standardization. Performance of Buildings. Detection of Heat, Air and Moisture Irregularities in Buildings by Infrared Methods—Part 3: Qualifications of Equipment Operators, Data Analysts and Report Writers; ISO 6781-3:2015; ISO: Geneva, Switzerland, 2015. [Google Scholar]
  43. International Organization for Standardization. Thermal Performance of Buildings. Qualitative Detection of Thermal Irregularities in Building Envelopes. Infrared Method; UNE EN 13187:1998; ISO: Geneva, Switzerland, 1998. [Google Scholar]
  44. American Society for Testing Materials. Standard Test Method for Minimum Detectable Temperature Difference for Thermal Imaging Systems; ASTM E1311; American Society for Testing Materials: West Conshohocken, PA, USA, 2004. [Google Scholar]
  45. American Society for Testing Materials. Standard Test Method for Measuring and Compensating for Reflected Ambient Temperature Using Infrared Imaging Radiometers; ASTM E1862; American Society for Testing Materials: West Conshohocken, PA, USA, 1997. [Google Scholar]
  46. Lucchi, E. Applications of the infrared thermography in the energy audit of buildings: A review. Renew. Sustain. Energy Rev. 2018, 82, 3077–3090. [Google Scholar] [CrossRef]
  47. Tejedor, B.; Casals, M.; Macarulla, M.; Giretti, A. U-value time series analyses: Evaluating the feasibility of in-situ short-lasting IRT tests for heavy multi-leaf walls. Build. Environ. 2019, 159, 1–19. [Google Scholar] [CrossRef]
  48. Albatici, R.; Tonelli, A. Verifica sperimentale in situ, con analisi termografiche e algoritmi di calcolo della transmittanza termica di un elemento costruttivo. In Annali Museo Civico di Rovereto. Sezione: Archeologia, Storia, Scienze Naturali, 23rd ed.; Museo Civico di Rovereto: Rovereto, Italy, 2008. [Google Scholar]
  49. Albatici, R.; Tonelli, A.M. Infrared thermovision technique for the assessment of thermal transmittance value of opaque building elements on site. Energy Build. 2010, 42, 2177–2183. [Google Scholar] [CrossRef]
  50. Vavilov, V.P. A pessimistic view of the energy auditing of building structures with the use of infrared thermography. Russ. J. Nondestruct. Test. 2010, 46, 906–910. [Google Scholar] [CrossRef]
  51. Dall’O, G.; Sarto, L.; Panza, A. Infrared screening of residential buildings for energy audit purposes: Results of a field test. Energies 2013, 6, 3859–3878. [Google Scholar] [CrossRef] [Green Version]
  52. Ham, Y.; Golparvar-Fard, M. Automated cost analysis of energy loss in existing buildings through thermographic inspections and CFD analysis. In Proceedings of the ISARC-30th International Symposium on Automation and Robotics in Construction and Mining, Montreal, QC, Canada, 11–15 August 2013. [Google Scholar] [CrossRef] [Green Version]
  53. Nardi, I.; Sfarra, S.; Ambrosini, D. Quantitative thermography for the estimation of the U-Value: State of art and a case study. J. Phys. Conf. Ser. 2014, 547, 012016. [Google Scholar] [CrossRef]
  54. Kim, J.; Lee, J.; Jang, C.; Jeong, H.; Song, D. Appropriate conditions for determining the temperature difference ratio via infrared camera. Build. Serv. Eng. 2015, 37, 1–16. [Google Scholar] [CrossRef]
  55. Ibos, L.; Monchau, J.-P.; Feuillet, V.; Candau, Y. A comparative study of in-situ measurement methods of a building wall thermal resistance using infrared thermography. Int. Conf. Qual. Control Artif. Vis. 2015. [Google Scholar] [CrossRef] [Green Version]
  56. Marino, B.M.; Muñoz, N.; Thomas, L.P. Estimation of the surface thermal resistance and heat loss by conduction using thermography. Appl. Therm. Eng. 2017, 114, 1213–1221. [Google Scholar] [CrossRef]
  57. Fokaides, P.A.; Kalogirou, S.A. Application of infrared thermography for the determination of the overall heat transfer coefficient (U-Value) in building envelopes. Appl. Energy 2011, 88, 4358–4365. [Google Scholar] [CrossRef]
  58. Ham, Y.; Golpavard-Fard, M. 3D Visualization of thermal resistance and condensation problems using infrared thermography for building energy diagnostics. Vis. Eng. 2014, 2, 12. [Google Scholar] [CrossRef] [Green Version]
  59. Tzifa, V.; Papadakos, G.; Papadopoulou, A.G.; Marinakis, V.; Psarras, J. Uncertainty and method limitations in a short-time measurement of the effective thermal transmittance on a building envelope using an infrared camera. Int. J. Sustain. Energy 2017, 36, 28–46. [Google Scholar] [CrossRef]
  60. Danielski, I.; Fröling, M. Diagnosis of buildings’ thermal performance—A quantitative method using thermography under non-steady state heat flow. Energy Procedia 2015, 83, 320–329. [Google Scholar] [CrossRef] [Green Version]
  61. Tejedor, B.; Casals, M.; Gangolells, M.; Roca, X. Quantitative internal infrared thermography for determining in-situ thermal behaviour of façades. Energy Build. 2017, 151, 187–197. [Google Scholar] [CrossRef]
  62. Marshall, A.; Francou, J.; Fitton, R.; Swan, W.; Owen, J.; Benjaver, M. Variation of the U-value measurement of a whole dwelling using infrared thermography under controlled conditions. Buildings 2018, 8, 46. [Google Scholar] [CrossRef] [Green Version]
  63. Tejedor, B.; Casals, M.; Gangolells, M. Assessing the influence of operating conditions and thermophysical properties on the accuracy of in-situ measured U-values using quantitative internal infrared thermography. Energy Build. 2018, 171, 64–75. [Google Scholar] [CrossRef]
  64. Bienvenido-Huertas, D.; Oliveira, M.; Rubio-Bullido, C.; Marín, D. A Comparative analysis of the international regulation of thermal properties in building envelope. Sustainability 2019, 11, 5574. [Google Scholar] [CrossRef] [Green Version]
  65. Lu, X.; Memari, A. Application of infrared thermography for in-situ determination of building envelope termal properties. J. Build. Eng. 2019, 26, 100885. [Google Scholar] [CrossRef]
  66. Hoyano, A.; Asano, K.; Kanamaru, T. Analysis of the heat flux from the exterior surface of buildings using time sequential thermography. Atmos. Environ. 1999, 33, 3941–3951. [Google Scholar] [CrossRef]
  67. Emmel, M.G.; Abadie, M.O.; Mendes, N. New external convective heat transfer coefficient correlations for isolated low-rise buildings. Energy Build. 2007, 39, 335–342. [Google Scholar] [CrossRef]
  68. Rabadiya, A.V.; Kirar, R. Comparative analysis of wind loss coefficient (wind heat transfer coefficient) for solar plate collector. Int. J. Emerg. Technol. Adv. Eng. (IJETAE) 2012, 2, 2250–2459. [Google Scholar]
  69. Sham, J.F.C.; Lo, T.Y.; Memon, S.A. Verification and application of continuous surface temperature monitoring technique for investigation of nocturnal sensible heat release characteristics by building fabrics. Energy Build. 2012, 53, 108–116. [Google Scholar] [CrossRef]
  70. Liu, J.; Heidarinejad, M.; Gracik, S.; Srebric, J. The impact of exterior surface convective heat transfer coefficients on the building energy consumption in urban neighbourhoods with different plan area densities. Energy Build. 2015, 86, 449–463. [Google Scholar] [CrossRef]
  71. Madding, R. Finding R-Values of stud frame constructed houses with IR Thermography. In Proceedings of the InfraMation Conference, Reno, NV, USA, 3–7 November 2008; Available online: https://www.researchgate.net/publication/285737245_Finding_R-values_of_Stud-Frame_Constructed_Houses_with_IR_Thermography (accessed on 10 November 2020).
  72. Earle, R.L.; Earle, M.D. Unit Operations in Food Processing; Elsevier: Amsterdam, The Netherlands, 1983. [Google Scholar]
  73. Holman, J.P. Heat Transfer, 8th ed.; McGraw Hill: New York, NY, USA, 1997; ISBN 978-0078447860. [Google Scholar]
  74. Bienvenido-Huertas, D.; Bermúdez, J.; Moyano, J.J.; Marín, D. Influence of ICHTC correlations on the thermal characterization of façades using the quantitative internal infrared thermography method. Build. Environ. 2019, 149, 512–525. [Google Scholar] [CrossRef]
  75. Gaspar, K.; Casals, M.; Gangolells, M. A comparison of standardized calculation methods for in situ measurements of façades U-value. Energy Build. 2016, 130, 592–599. [Google Scholar] [CrossRef]
  76. International Organization for Standardization. Thermal Insulation. Building Elements. In Situ Measurement of Thermal Resistance and Thermal Transmittance. Part 1: Heat Flow Meter Method; ISO 9869:2014; ISO: Geneva, Switzerland, 2014. [Google Scholar]
  77. Atsonios, I.A.; Mandilaras, I.D.; Kontogeorgos, D.A.; Founti, M.A. A comparative assessment of the standarized methods for the in-situ measurement of the thermal resistance of buildings walls. Energy Build. 2017, 154, 198–206. [Google Scholar] [CrossRef]
  78. American Society for Testing Materials. Standard Practice for Determining Thermal Resistance of Building Envelope Components from the In-Situ Data; ASTM C1155-95; American Society for Testing Materials: West Conshohocken, PA, USA, 2007. [Google Scholar]
  79. Gaspar, K.; Casals, M.; Gangolells, M. In-situ measurement of façades with a low U-value: Avoiding deviations. Energy Build. 2018, 170, 61–73. [Google Scholar] [CrossRef]
  80. Spain, Royal Decree 314/2006 Approving the Spanish Technical Building Code CTE-DB-HE1. 2006. Available online: http://www.boe.es/boe/dias/2006/03/28/pdfs/A11816-11831.pdf (accessed on 4 October 2020).
  81. International Organization for Standardization. Building Materials and Products—Hygrothermal Properties—Tabulated Design Values and Procedures for Determining Declared and Design Thermal Values; UNE EN ISO 10456:2012; ISO: Geneva, Switzerland, 2012. [Google Scholar]
  82. International Organization for Standardization. Building Components and Building Elements. Thermal Resistance and Thermal Transmittance. Calculation Method; UNE EN ISO 6946:2012 (ISO 6946:2007); ISO: Geneva, Switzerland, 2012. [Google Scholar]
  83. FLIR Systems. FLIR TOOLS+ Software; FLIR Systems: Wilsonwille, OR, USA, 2015. [Google Scholar]
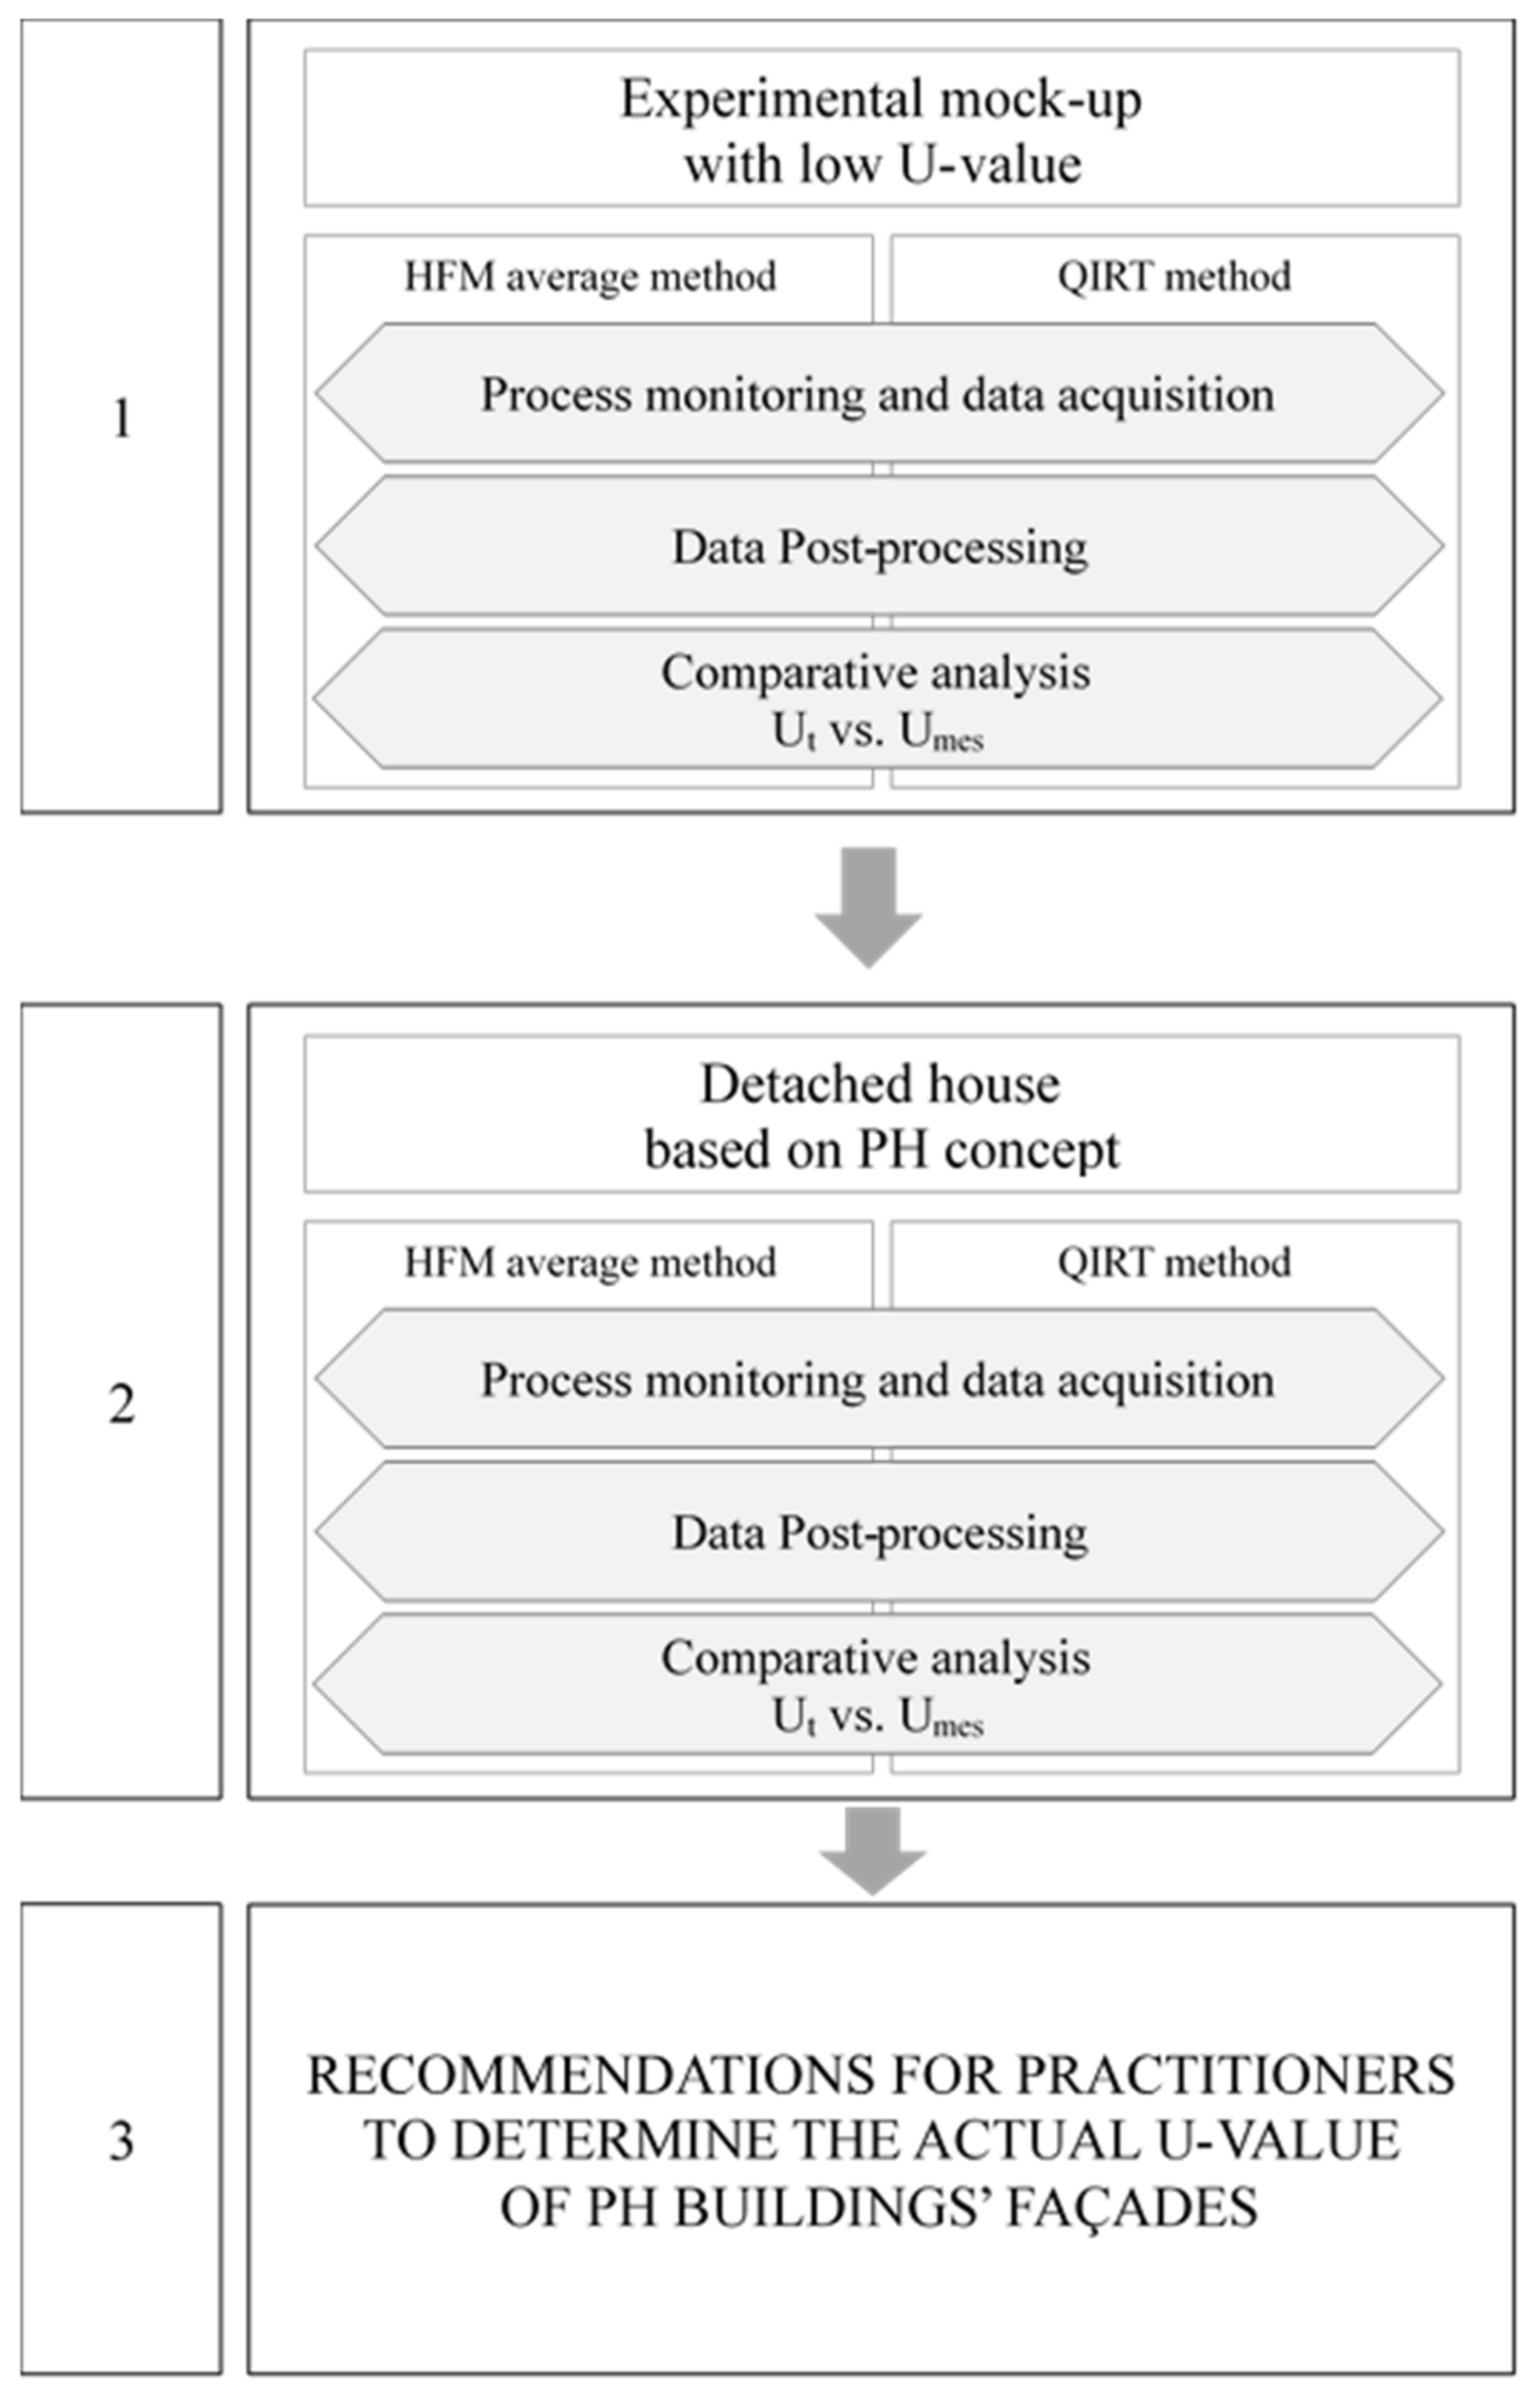
Figure 1. Flowchart of the research methodology.
Applsci 10 08337 g001
Figure 2. View of the measuring equipment used during the acquisition-of-data process.
Applsci 10 08337 g002
Figure 3. Experimental mock-up based on the passive house concept.
Applsci 10 08337 g003
Figure 4. Detached house based on the passive house concept.
Applsci 10 08337 g004
Figure 5. Temperature data obtained from the process of monitoring for both (a) the experimental mock-up and (b) the detached house.
Applsci 10 08337 g005
Figure 6. Measured U-values and their associated combined uncertainties in the experimental mock-up and the detached house for the seven cycles of test duration, using the HFM average method.
Applsci 10 08337 g006
Figure 7. Coefficient of variation of both the experimental mock-up and the detached house, using the HFM average method.
Applsci 10 08337 g007
Figure 8. In situ measured thermal transmittance over time for W1 and W2 and comparison with theoretical values.
Applsci 10 08337 g008
Figure 9. Confidence intervals at 95% for quantitative IRT measurements.
Applsci 10 08337 g009
Table 1. Main technical specifications of the equipment.
EquipmentOutputMeasuring RangeResolutionAccuracy
Heat flux meter plateq [W/m2]±2000 W/m2
Sensitivity of HFM1 61.68 μV/(W/m2)
Sensitivity of HFM2 61.29 μV/(W/m2)
Sensitivity of HFM3 63.07 μV/(W/m2)
--±5%
Inner air temperature sensorTIN (K)−35 to +50 °C0.1 °C±0.5 °C
Inner acquisition system Input ±5 Vdc at 0 to 40 °C--±0.06% of reading
Infrared camera TWALL (K)
TREF (K)
Temperature: −20 to +120 °C
CFOV: 25° × 19°; IFOV: 1.36 mrad
Spectral Range: 7.5–13 μm
Thermal sensitivity: <0.045 °C, at 30 °C
Sensor: FPA, uncooled microbolometer
320 × 240 pixels±2 °C or
±2% reading
Outer air temperature sensorTOUT (K)−35 to +55 °C0.1 °C±0.5 °C
HFM, heat flux meter; q, the element; TIN, the indoor environmental temperature; TWALL, the wall-surface temperature; TREF, the reflected ambient temperature; TOUT, the outdoor environmental temperature.
Table 2. Configuration and technical features of the experimental mock-up (from outside to inside).
N#Material
Layer
Δxi
(m)
λi
[W/(m·K)]
Rt i
[(m2·K)/W]
L
(m)
Ut
[W/(m2·K)]
W1
Experimental mock-up
1Mortar 0.0150.5500.0272.640.245
2Lightweight concrete0.0600.1600.375
3PIR insulation0.0800.0282.857
4Non-ventilated air cavity0.060---0.180
5Lightweight concrete0.0700.1600.438
6Gypsum plaster0.0150.4300.035
Δxi, thickness of the layer; λi, thermal conductivity of the layer; Rt I, theoretical thermal resistance of the layer; L, height of the wall; Ut, theoretical thermal transmittance of the building façade.
Table 3. Configuration and technical features of the detached house (from outside to inside).
No.Material
Layer
Δxi
(m)
λi
[W/(m·K)]
Rt i
[(m2·K)/W]
L
(m)
Ut
[W/(m2·K)]
W2
Detached
house
1Mortar 0.0150.5500.0272.500.233
2Lightweight concrete (EVOin)0.0450.1600.281
3PIR insulation0.0800.0282.857
4Cavity (EPS + EVOin)0.0600.1400.429
5Lightweight concrete (EVOin)0.0800.1600.500
6Gypsum plaster0.0150.4300.035
Δxi, thickness of the layer; λi, thermal conductivity of the layer; Rt i, theoretical thermal resistance of the layer; L, height of the wall; Ut, theoretical thermal transmittance of the building façade.
Table 4. Measured U-values and their associated combined uncertainties, deviation between theoretical and measured U-value, and coefficient of variation of the measured thermal transmittance in both the experimental mock-up and the detached house, using the HFM average method.
Experimental Mock-UpDetached House
UmHFM ± u c U
[W/m2·K]
U t U m U t
(%)
CV
(%)
UmHFM ± u c U
[W/m2·K]
U t U m U t
(%)
CV
(%)
Number of cycles (duration)1 (24 h)0.246 ± 0.0180.33--0.212 ± 0.0188.84--
2 (48 h)0.244 ± 0.0130.35--0.225 ± 0.0143.47--
3 (72 h)0.248 ± 0.0111.051.390.225 ± 0.0123.066.80
4 (96 h)0.246 ± 0.0090.441.400.227 ± 0.0102.371.15
5 (120 h)0.249 ± 0.0081.591.130.227 ± 0.0092.330.84
6 (144 h)0.250 ± 0.0081.981.570.230 ± 0.0081.131.43
7 (168 h)0.251 ± 0.0072.410.810.225 ± 0.0083.092.02
Measurement periodFrom 29 December 2016 to 4 January 2017From 26 February 2019 to 4 March 2019
ΔT average (°C)19.710.8
Table 5. Deviation of the U-value from the value obtained 24 h earlier, for both the experimental mock-up and the detached house, using the HFM average method.
Number of Cycle EvaluatedRelated Cycles in the EvaluationDeviation in Um-HFM (%)
Experimental Mock-UpDetached House
3 (72 h)3 vs. 21.40.4
4 (96 h)4 vs. 3−0.60.7
5 (120 h)5 vs. 41.10.0
6 (144 h)6 vs. 50.41.2
7 (168 h)7 vs. 60.4−2.0
Table 6. Deviation of U-values between the initial and final analysis period for each test duration for both the experimental mock-up and the detached house, using the HFM average method.
Experimental Mock-UPDetached House
Number of Cycle EvaluatedDuration of the Analysis Period
(Days)
Analysis PeriodUm-HFM
[W/m2·K]
Deviation of Um-HFM between Periods of Analysis (%)Um-HFM
[W/m2·K]
Deviation of Um-HFM between Periods of Analysis (%)
3 (72 h)2Initial test period2.342.32.341.5
Final test period2.402.37
4 (96 h)2Initial test period2.340.82.340.6
Final test period2.332.35
5 (120 h)3Initial test period2.360.32.351.1
Final test period2.372.37
6 (144 h)4Initial test period2.332.42.341.7
Final test period2.392.38
7 (168 h)4Initial test period2.332.22.342.0
Final test period2.392.39
Table 7. Measured U-values, deviation between theoretical and measured U-value, and coefficient of variation of the measurements in the experimental mock-up and the detached house, using internal quantitative infrared thermography (QIRT).
ParametersExperimental Mock-UpDetached House
Ut [W/m2·K]0.2450.233
Umes_IRT [W/m2·K]0.2570.245
Test duration (hours)22
ΔT Range (°C)8.2–10.413.17–15.76
SD [W/m2·K]0.0210.024
CV (%)8.069.69
ΔUIRT/Ut (%)4.905.15
Publisher’s Note: MDPI stays neutral with regard to jurisdictional claims in published maps and institutional affiliations.