Surface Texture Measurement on Complex Geometry Using Dual-Scan Positioning Strategy


Abstract
:Featured Application
Abstract
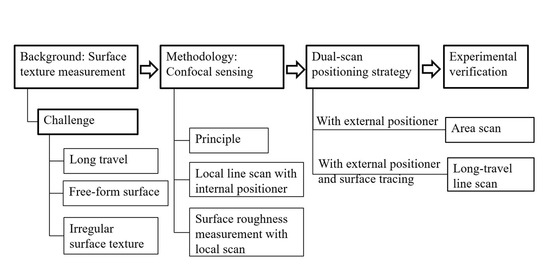
1. Introduction
2. Principle of Confocal Sensing with Internal Scanning
- (1)
- the surface is relatively flat; the surface fluctuation does not exceed the sensing range of 0.6 mm;
- (2)
- the surface is relatively smooth; the measurement of roughness parameters does not require a roughness evaluation length longer than 1.1 mm.
3. 3D Surface Topography Measurement with Dual-Scan Scanning
- (1)
- height parameters Sa and Sq, for general understanding of the surface roughness;
- (2)
- statistic parameters Ssk and Sku, to evaluate the dominant feature of the surface, peak dominant or valley dominant, as reference for further surface finishing process;
- (3)
- spatial parameters Str and Std, to characterize the uniformity and analyze the directional patterns of the surface texture, if any.
4. Surface Tracing Strategy for Long Scan Length
4.1. Surface Tracing Algorithm
4.2. Correction of Misalignment
4.3. Profile Restoration
4.4. Dual-Scan Positioning Control for Surface Profiling
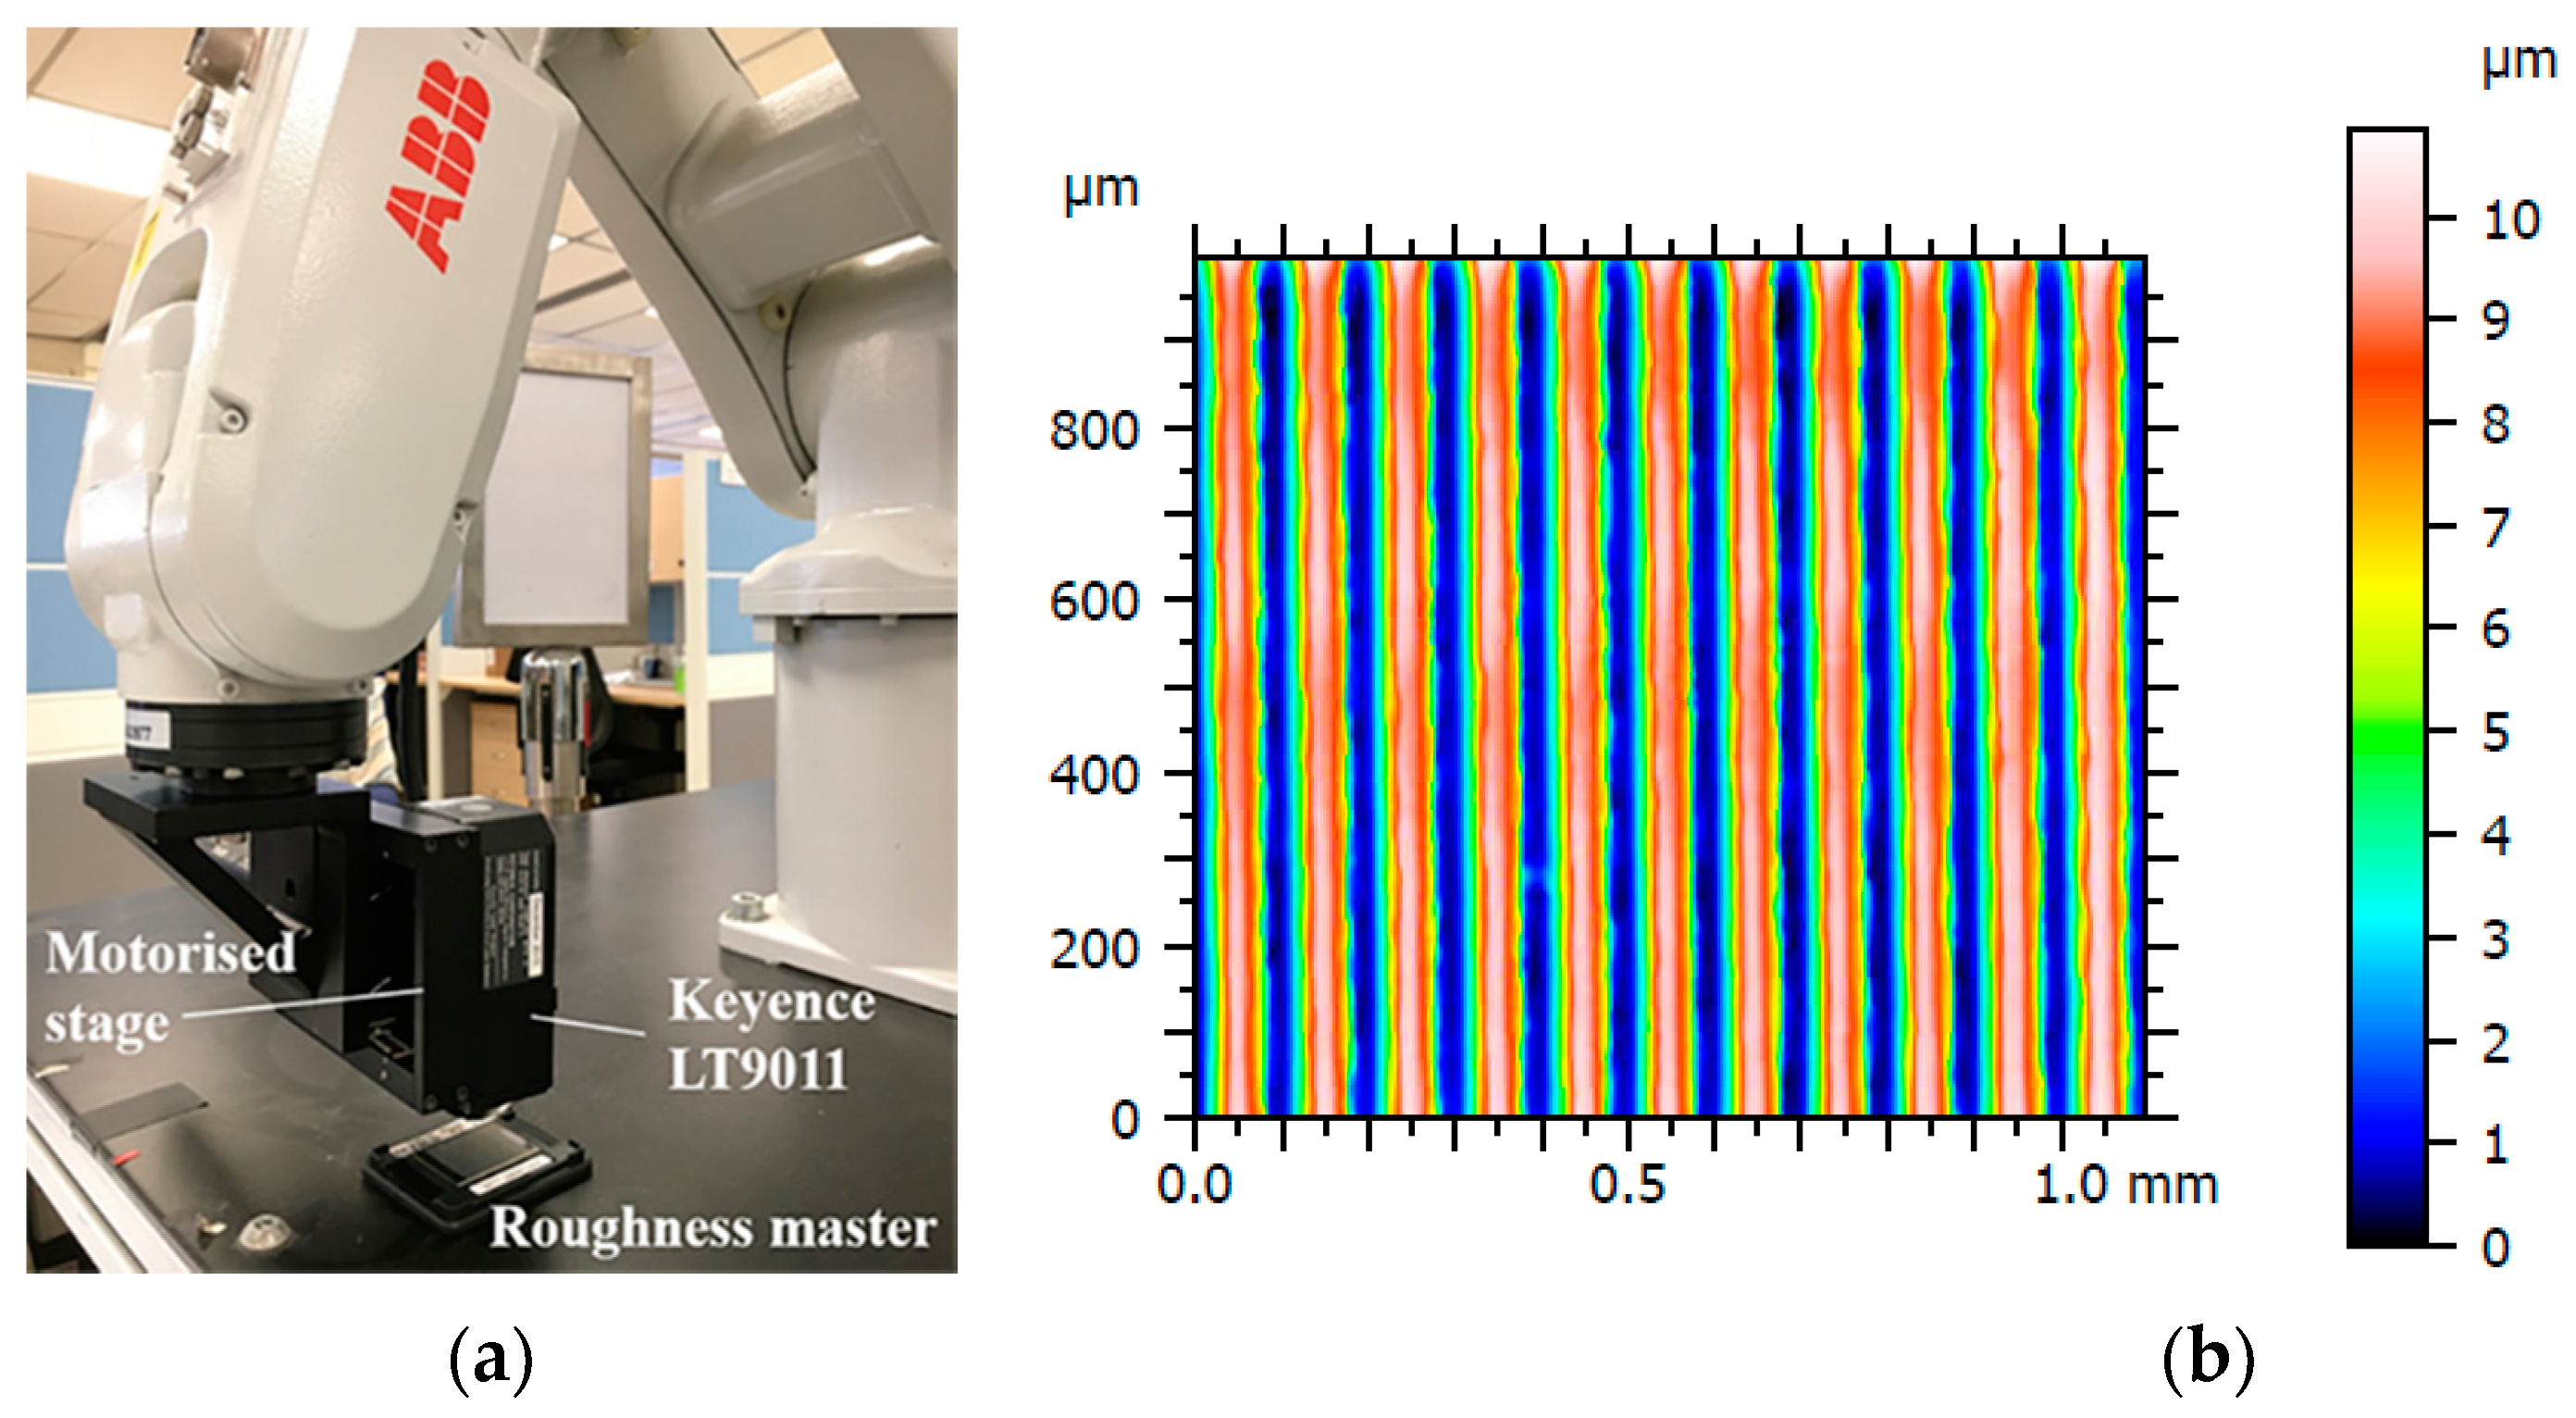
5. Experimental Verification
5.1. Robotic Vibration Test
5.2. Area Scan
5.3. Long-Travel Line Scan
6. Conclusions and Future Work
Author Contributions
Funding
Conflicts of Interest
References
- Davim, J.P. Surface Integrity in Machining; Springer: London, UK, 2010. [Google Scholar]
- Whitehouse, D. Surfaces and Their Measurement; Butterworth-Heinemann: London, UK, 2004. [Google Scholar]
- Fay, M.F.; Badami, V.G.; De Lega, X.C. Characterizing additive manufacturing parts using coherence scanning interferometry. In Proceedings of the ASPE Spring Topical Meeting on Dimensional Accuracy and Surface Finish in Additive Manufacturing, Berkely, CA, USA, 13–16 April 2014; pp. 135–138. [Google Scholar]
- Triantaphyllou, A.; Giusca, C.L.; Macaulay, G.D.; Leach, R.K.; Milne, K.A. Surface texture measurement for additive manufacture. Surf. Topogr. Metrol. Prop. 2015, 3, 024002. [Google Scholar] [CrossRef]
- Whitehouse, D.J. Surface metrology. Meas. Sci. Technol. 1997, 8, 955–972. [Google Scholar] [CrossRef]
- Bradley, C. Automated Surface Roughness Measurement. Int. J. Adv. Manuf. Technol. 2000, 16, 668–674. [Google Scholar] [CrossRef]
- Whitehouse, D. A new look at surface metrology. Wear 2009, 266, 560–565. [Google Scholar] [CrossRef]
- Cheng, F.; Fu, S.W.; Leong, Y.S. Research on optical measurement for additive manufacturing surfaces. In Proceedings of the SPIE International Conference on Optical and Photonics Engineering, Chengdu, China, 26–30 September 2016. [Google Scholar]
- British Standards Institution. BS EN ISO 4287 Profile Method—Terms, Definitions and Surface Texture Parameters; BSI: London, UK, 1998. [Google Scholar]
- Sandoz, P.; Tribillon, G.; Gharbi, T.; Devillers, R. Roughness measurement by confocal microscopy for brightness characterization and surface waviness visibility evaluation. Wear 1996, 201, 186–192. [Google Scholar] [CrossRef]
- Paddock, S.W. Confocal Microscopy; Humana Press: Totowa, NJ, USA, 1998. [Google Scholar]
- Rishikesan, V.; Samuel, G.L. Evaluation of Surface Profile Parameters of a Machined Surface Using Confocal Displacement Sensor. Procedia Mater. Sci. 2014, 5, 1385–1391. [Google Scholar] [CrossRef] [Green Version]
- Yoshizawa, T. Handbook of Optical Metrology: Principles and Applications; CRC Press: Boca Raton, FL, USA, 2009. [Google Scholar]
- Hocken, R.J.; Chakraborty, N.; Brown, C. Optical Metrology of Surfaces. CIRP Ann. Manuf. Technol. 2005, 54, 169–183. [Google Scholar] [CrossRef]
- Viotti, M.R.; Albertazzi, A.; Fantin, A.V.; Pont, A.D. Comparison between a white-light interferometer and a tactile formtester for the measurement of long inner cylindrical surfaces. Opt. Lasers Eng. 2008, 46, 396–403. [Google Scholar] [CrossRef]
- Danzl, R.; Helmli, F.; Scherer, S. Focus variation—A robust technology for high resolution optical 3D surface metrology. J. Mech. Eng. 2011, 57, 245–256. [Google Scholar] [CrossRef] [Green Version]
- Newton, L.; Senin, N.; Gomez, C.; Danzl, R.; Helmli, F.; Blunt, L.; Leach, R. Areal topography measurement of metal additive surfaces using focus variation microscopy. Addit. Manuf. 2019, 25, 365–389. [Google Scholar] [CrossRef]
- British Standards Institution. BS EN ISO 25178-2 Terms, Definitions and Surface Texture Parameters; BSI: London, UK, 2012. [Google Scholar]
- Leach, R. Characterisation of Areal Surface Texture; Springer: Berlin/Heidelberg, Germany, 2013; p. 17. [Google Scholar]
- Chen, L.C. Full-field chromatic confocal surface profilometry employing digital micromirror device correspondence for minimizing lateral cross talks. Opt. Eng. 2012, 51, 081507. [Google Scholar] [CrossRef]
- Blateyron, F. Chromatic Confocal Microscopy. Optical Measurement of Surface Topography; Springer: Berlin/Heidelberg, Germany, 2011; pp. 71–106. [Google Scholar]
- British Standards Institution. BS EN ISO 16610-21 Linear Profile Filters: Gaussian Filters; BSI: London, UK, 2012. [Google Scholar]
- Fu, S.; Cheng, F.; Tjahjowidodo, T. Surface Topography Measurement of Mirror-Finished Surfaces Using Fringe-Patterned Illumination. Metals 2020, 10, 69. [Google Scholar] [CrossRef] [Green Version]
- Fuh, Y.-K.; Fan, J.R.; Huang, C.Y.; Jang, S.C. In-process surface roughness measurement of bulk metallic glass using an adaptive optics system for aberration correction. Measurement 2013, 46, 4200–4205. [Google Scholar] [CrossRef]
- Fu, S.; Cheng, F.; Tjahjowidodo, T.; Zhou, Y.; Butler, D. A Non-Contact Measuring System for In-Situ Surface Characterization Based on Laser Confocal Microscopy. Sensors 2018, 18, 2657. [Google Scholar] [CrossRef] [PubMed] [Green Version]
- Fu, S.; Cheng, F.; Tjahjowidodo, T.; Liu, M. Development of an Image Grating Sensor for Position Measurement. Sensors 2019, 19, 4986. [Google Scholar] [CrossRef] [PubMed] [Green Version]
- Fu, S.; Cheng, F.; Tjahjowidodo, T.; Liu, M. Image grating: A novel technology for position measurement. In Proceedings of the Seventh International Conference on Optical and Photonic Engineering, Phuket, Thailand, 16–20 July 2019. [Google Scholar]
- Grochalski, K.; Wieczorowski, M.; Pawlus, P.; H’Roura, J. Thermal Sources of Errors in Surface Texture Imaging. Materials 2020, 13, 2337. [Google Scholar] [CrossRef] [PubMed]
- Fu, S.; Kor, W.S.; Cheng, F.; Seah, L.K. In-situ measurement of surface roughness using chromatic confocal sensor. Procedia CIRP 2020, 94, 780–784. [Google Scholar] [CrossRef]


| 1 | 2 | 3 | 4 | 5 | Mean | Std. Dev. | |
|---|---|---|---|---|---|---|---|
| Ra (µm) | 3.02 | 3.02 | 3.10 | 3.00 | 3.01 | 3.03 | 0.04 |
| Rt (µm) | 9.51 | 9.43 | 9.67 | 9.46 | 9.48 | 9.50 | 0.08 |
| Timing No. | 1 | 2 | 3 | 4 | 5 |
|---|---|---|---|---|---|
| Test Result (µm) | 63.38 ± 0.02 | 63.33 ± 0.02 | 63.30 ± 0.01 | 63.13 ± 0.02 | 62.62 ± 0.03 |
| Taylor Hobson CCI | Carl Zeiss Smartproof 5 | Proposed System | |
|---|---|---|---|
| Sa (µm) | 2.50 ± 0.10 | 2.42 ± 0.13 | 2.41 ± 0.12 |
| Sq (µm) | 3.26 ± 0.16 | 3.09 ± 0.19 | 3.04 ± 0.17 |
| S10z (µm) | 24.95 ± 0.16 | 23.02 ± 0.27 | 22.09 ± 0.17 |
| Ssk | −0.18 ± 0.01 | −0.14 ± 0.01 | −0.17 ± 0.02 |
| Sku | 3.40 ± 0.04 | 3.58 ± 0.04 | 3.37 ± 0.08 |
| Str | 0.19 ± 0.01 | 0.21 ± 0.00 | 0.18 ± 0.02 |
| Std (°) | 69.97 ± 0.14 | 71.04 ± 0.10 | 70.58 ± 0.13 |
| PGI 800 | Proposed System | Absolute Error | Relative Error | ||
|---|---|---|---|---|---|
| Zone 1 | Ra (µm) | 0.56 ± 0.01 | 0.58 ± 0.02 | 0.02 | 3.6% |
| Rq (µm) | 0.69 ± 0.01 | 0.72 ± 0.03 | 0.03 | 4.3% | |
| Zone 2 | Ra (µm) | 0.93 ± 0.02 | 0.97 ± 0.05 | 0.04 | 4.3% |
| Rq (µm) | 1.14 ± 0.02 | 1.19 ± 0.07 | 0.05 | 4.4% | |
| Zone 3 | Ra (µm) | 1.36 ± 0.01 | 1.42 ± 0.04 | 0.06 | 4.4% |
| Rq (µm) | 1.70 ± 0.01 | 1.78 ± 0.06 | 0.08 | 4.7% |
Publisher’s Note: MDPI stays neutral with regard to jurisdictional claims in published maps and institutional affiliations. |
© 2020 by the authors. Licensee MDPI, Basel, Switzerland. This article is an open access article distributed under the terms and conditions of the Creative Commons Attribution (CC BY) license (http://creativecommons.org/licenses/by/4.0/).
Share and Cite
Cheng, F.; Fu, S.; Chen, Z. Surface Texture Measurement on Complex Geometry Using Dual-Scan Positioning Strategy. Appl. Sci. 2020, 10, 8418. https://doi.org/10.3390/app10238418
Cheng F, Fu S, Chen Z. Surface Texture Measurement on Complex Geometry Using Dual-Scan Positioning Strategy. Applied Sciences. 2020; 10(23):8418. https://doi.org/10.3390/app10238418
Chicago/Turabian StyleCheng, Fang, Shaowei Fu, and Ziran Chen. 2020. "Surface Texture Measurement on Complex Geometry Using Dual-Scan Positioning Strategy" Applied Sciences 10, no. 23: 8418. https://doi.org/10.3390/app10238418