Article

Lincomycin-Induced Transcriptional Alterations in the Green Alga Raphidocelis subcapitata

1
Shaanxi Key Laboratory of Earth Surface System and Environmental Carrying Capacity, College of Urban and Environmental Sciences, Northwest University, Xi’an 710127, China
2
Department of Building, Civil and Environmental Engineering, Concordia University, Montreal, QC H3G 1M8, Canada
3
Department of Chemistry, City University of Hong Kong, Kowloon, Hong Kong 518057, China
*
Author to whom correspondence should be addressed.
Appl. Sci. 2020, 10(23), 8565; https://doi.org/10.3390/app10238565
Submission received: 8 November 2020 / Revised: 27 November 2020 / Accepted: 27 November 2020 / Published: 30 November 2020
(This article belongs to the Section Environmental Sciences)

Abstract

:
Lincomycin (LIN), as a waterborne contaminant, may pose a threat to algal health and may affect the provision of ecosystem services. In addition, the molecular mechanisms of lincomycin in algae are still unknown. Here, we attempted to use the transcriptome analysis to elucidate for the first time the potential impact of LIN at an environmentally relevant concentration on the algal growth, and verify the hypothesis that lincomycin can disrupt algal protein synthesis by combining with its subunits of ribosome at high-LIN level. In this study, 7-day growth inhibition tests and RNA-seq sequencing were conducted in Raphidocelis subcapitata (R. subcapitata) in response to a LIN at the concentrations of 0.5 µg L−1 (low), 5 µg L−1 (medium), and 400 µg L−1 (high) treatment groups. A negligible influence on algal growth and merely 21 (21 up- and 0 downregulated) differentially expressed genes (DEGs) was observed at low concentration of LIN, and medium groups showed a 13.4% inhibition and 92 (64 up- and 48 downregulated) DEGs, while high-LIN dosing caused 65.4% reduction in algal growth and 2514 (663 up- and 1851 downregulated) DEGs. In 0.5 and 5 µg L−1 groups, LIN upregulated the genes in the process of photosynthesis consisting of photosynthesis-antenna proteins, and porphyrin and chlorophyll metabolism pathways, suggesting that photosynthesis at low LIN exposure was more sensitive than algal growth. Whereas DEGs in the 400 µg L−1 group were mostly enriched in carbohydrate, carbon fixation in photosynthetic organisms, and nucleotide metabolism pathways. Furthermore, genes involved in detoxification processes were nearly downregulated in high-LIN group. In addition, genes encoding the antioxidant enzymes in the peroxisome pathway such as superoxide dismutase (sod2), peroxin-2 (pex2), 2,4-dienoyl-CoA reductase ((3E)-enoyl-CoA-producing) (decr2) were upregulated, which are responsible for deleting extra intracellular reactive oxygen species (ROS) caused by LIN to protect algal health, suggesting the occurrence of oxidative stress. Taken together, this is the first meticulous study unraveling the molecular mechanism of antibiotics in algae.

1. Introduction

Nowadays, the potential impact of antibiotics on the environment is an important topic of discussion and research, owing to their widespread use and slow degradation rate [1]. Lincomycin (LIN) is a commonly used antibiotic by pig and chicken farms. In 2013, the annual consumption was estimated to be 7000 tons in China [2]. LIN is not fully metabolized by animals and the majority is excreted through urine and feces, and therefore pass into the environment. Moreover, LIN is stable in the aquatic system, and has a half-life time up to 15 days and even 2033 days in certain conditions [3,4]. In line with this, a substantial amount of LIN has been measured in surface waters within the level of 175 to 1413 ng L−1 and was deemed a priority compound based on its ecological risk to algae [5,6,7].
In most aquatic systems, algae form the bases of food webs and are directly involved in nutrient cycling in the aquatic environment. To conserve their ecosystem services, certain algae have been served as model experimental organisms in toxicological risk assessments [7,8]. In particular, the freshwater green alga Raphidocelis subcapitata (R. subcapitata) is commonly employed to assess the chemical risk, owing to its global distribution, easy cultivation, and high sensitivity towards chemical exposure, establishing an excellent ecotoxicological dataset [9]. However, the majority of the ecotoxicity data are confined to EC50 levels on account of algal growth. Besides, the realistic exposure level of chemicals was far below the acute toxicity test concentrations, approximately 1–6 orders of magnitude lower [10]. Therefore, it is crucial to move to chronic testing using environmentally relevant concentrations, focusing on alteration at the genomic level [11]. LIN can disrupt the protein synthesis in bacteria by combining with the 50 S subunits of ribosomes and restrain the peptide linkage formation in transcription [12]. However, the chloroplast of plants represented a high homology with bacteria [13]. On this basis, it is inferred that LIN may inhibit the photosynthesis of photosynthetic organisms by disturbing the process of transcription and translation in their chloroplasts [14]. The responses of bacteria to LIN or macrolides with similar modes of action were demonstrated by estimating the physicochemical parameters. For example, the total photosynthesis rate of Desmodesmus subspicatus was detected to reduce 0.12 units after exposure to LIN for 4 days at 0.4 mg L−1 [15]. Moreover, roxithromycin (ROX) can inhibit fatty acid synthesis to refrain the algae growth by Fourier transform infrared spectroscopy [16]. Extra ROS is likely to produce in algal cells at antibiotics exposure (e.g., roxithromycin and clarithromycin) [17,18,19]. However, the toxic molecular mechanism in green algae R. subcapitata remains largely unknown.
The transcriptomic analysis by next-generation sequence (NGS) can facilitate the identification of molecular-level changes that underlie responses to chemical stressors [20]. This technique has been used to detected algal responses to environmental pollutants (e.g., nonylphenol and erythromycin) [10,21]. For instance, transcriptome analysis demonstrated that carbon fixation in photosynthesis, photosynthesis, fatty acid synthesis, and other pathways were changed at 0.09 mg L−1 ROX dosing groups in R. subcapitata [9]. However, there is still a lack of transcriptome studies on the antibiotic lincomycin (LIN) to algae.
In this study, a 7-day growth inhibition test was performed to examine the effects of LIN on alga R. subcapitata, consisting of the three concentrations of 0 µg L−1 (control), 0.5 µg L−1 (low), 5 µg L−1 (medium), and 400 µg L−1 (high), and followed by performing the transcriptomic analysis. It was hypothesized that high LIN exposure may disturb the pathways of the carbon fixation process in photosynthetic organisms, such as photosynthesis and the fatty acid pathway. The goals of this research were (1) to evaluate whether LIN at the environmental concentration levels affects the health of R. subcapitata and (2) to clarify the potential molecular mechanism of action of LIN inhibiting the algal growth, and further test whether this mode of action is the same as in bacteria.

2. Materials and Methods

2.1. Algal Cultivation Conditions

The Blue-Green (BG11) medium (pH = 7.1 ± 0.02) was prepared according to the principles of OECD 201 guideline [8]. Algae in 150 mL of medium were cultivated in 250 mL flasks in triplicate. Flasks and BG11 medium were autoclaved at 121 °C for 30 min for sterilization, and the inoculation concentration was adjusted to 1.0 × 10⁴ cells mL−1 with the help of a hemocytometer. All flasks were covered with cotton plugs, and muslins were placed in the culture chamber under illuminance of 5500 for 24 h at a controlled cultivation temperature of 22 ± 2 °C. Cell density was determined by a hemocytometer using a microscope, the growth curve was drawn to monitor the growth changed caused by LIN.

2.2. Toxicity Test

The growth inhibition tests were performed according to the standard procedure of OECD 201 [8]. Initially, 10 mg L−1 of stock solution of LIN was prepared by BG11 medium. After passing through the membrane to ensure that the solution is sterile, the LIN stock solution was serially diluted and spiked into growth medium to obtain four test concentrations comprising 0 μg L−1 (control), 0.5 μg L−1 (low), 5 μg L−1 (medium), and 400 μg L−1 (high). Alga was cultured to reach log phase and then inoculated into BG11 medium in triplicate to ensure a preliminary cell density of 2 × 10⁴ cells mL−1. To evaluate chronic effects and to guarantee sufficient algal biomass for the following RNA extraction in the high LIN treatment group, the growth inhibition test was extended from 4 days to 7 days specified by the OECD [8]. The number of algal cells was counted on days 2, 4, and 7 with the hemocytometer. The algae samples on day 7 were centrifuged at 10,000 rpm for 15 min, quickly immersed in liquid nitrogen, and then stored at −80 °C for RNA sequencing.

2.3. RNA Sequencing

The algal total RNA was isolated using the Trizol method [22], and a NanoDrop 2000 (Thermo Scientific, Waltham, MA, USA) was applied to verify the purity and quantity of RNA. The RNA integrity number (RIN) value was measured above 8 by 2100 Bioanalyzer (Agilent, Palo Alto, CA, USA). Purified RNAs were used to establish the cDNA libraries following Illumina’s (Shanghai Personal Biotechnology Co., Ltd, Shanghai, China) instructions. These libraries were then sequenced on Illumina NovaSeq (Shanghai Personal Biotechnology Co., Ltd, Shanghai, China) to acquire the formal image data output.

2.4. RNA-seq Data Analyses

The output Image data were transformed by software to obtain raw data in FastQ format. We used Cutadapt (v. 1.1) to trim the sequences of 3 ’end bands and discard the low-quality value (QV < 20) in the raw data [23]. To make the different genes and gene expression levels comparable between different samples, we adopted Fragments Per Kilo bases per Million fragments (FPKM) to normalize the expression of genes. We applied Hisat2 (v. 2.1.0) to estimate the matching degree of the filtered reads to Raphidocelis subcapitata 1.0 (GCA-003203535.1) [24], then the HTSeq was applied to count the read value for each gene (v. 0.11.1) [25]. The total number of reads mapped to unique locations for each sample varied from 35,303,248 to 40,270,036, and the matching coverage ranged from 95.46% to 96.08%. Afterward, Pearson correlation coefficients among each group were calculated and visualized by using the R package. Expressed genes with the |log2 Fold Change (FC)| > 1 and adj p value < 0.05 in comparison of the control to LIN-treated group were identified to differentially expressed genes (DEGs) with the “DESeq” package [26]. Samples in each treatment group were clustered using the “DESeq” package in R software to conduct principal component analysis (PCA) [26]. Volcano plots and heatmap were plotted with “ggplot2” and “Pheatmap” packages, respectively [27,28]. The amount of DEGs in each group was illustrated by plotting a Venn diagram. Gene Ontology (GO) and the Kyoto Encyclopedia of Genes and Genomes (KEGG) pathway were applied to analyze DEGs.
The “TopGO” package was used for GO enrichment analysis, whose results were classified in terms of molecular function (MF), biological process (BP), and cell component (CC). The top 10 GO terms were chosen by the minimal p value in each GO classification were chosen for display. The enriched pathways were distinguished by a condition of p value < 0.1 in KEGG pathway analysis.

2.5. Quantitative Real-Time Polymerase Chain Reaction (qRT-PCR)

We performed qRT-PCR to verify the expression levels of gene profile obtained from RNA-seq, including uroporphyrinogen-iii decarboxylase (hemE) and cysteine dioxygenase (cdo1) in the porphyrin and chlorophyll metabolism and so on. A housekeeping gene, ubiquitin-conjugating enzyme E2 G1 (ubc), from R. subcapitata was applied to normalize all gene expression levels. All PCR procedures are listed in the supplementary data in detail.

2.6. Statistical Analyses

All experiments were conducted in triplicate. Statistical analysis between LIN dosing and control groups was evaluated by one-way analysis of variance (ANOVA). A p value < 0.05 (*) indicated a significant difference (GraphPad Prism 5). Pearson correlation analysis was conducted to estimate the correlation between NGS and qRT-PCR assays, and a significant correlation was distinguished by p value < 0.05.

3. Results

3.1. Growth Inhibition Test Analysis

The growth inhibition plot of R. subcapitata during 7-day exposure to LIN is shown in Figure 1. Here, the algal growth under control conditions and low exposure of LIN (0.5 μg L−1 and 5 μg L−1) are in good agreement. At the highest tested concentration (400 μg L−1), a significant reduction in growth is observed after 2 days of cultivation. Cell density in medium and high LIN treated groups showed a significant decrease comparing with controls in day 7 with the growth inhibition of 13.4% and 65.4%, respectively (Figure 1).

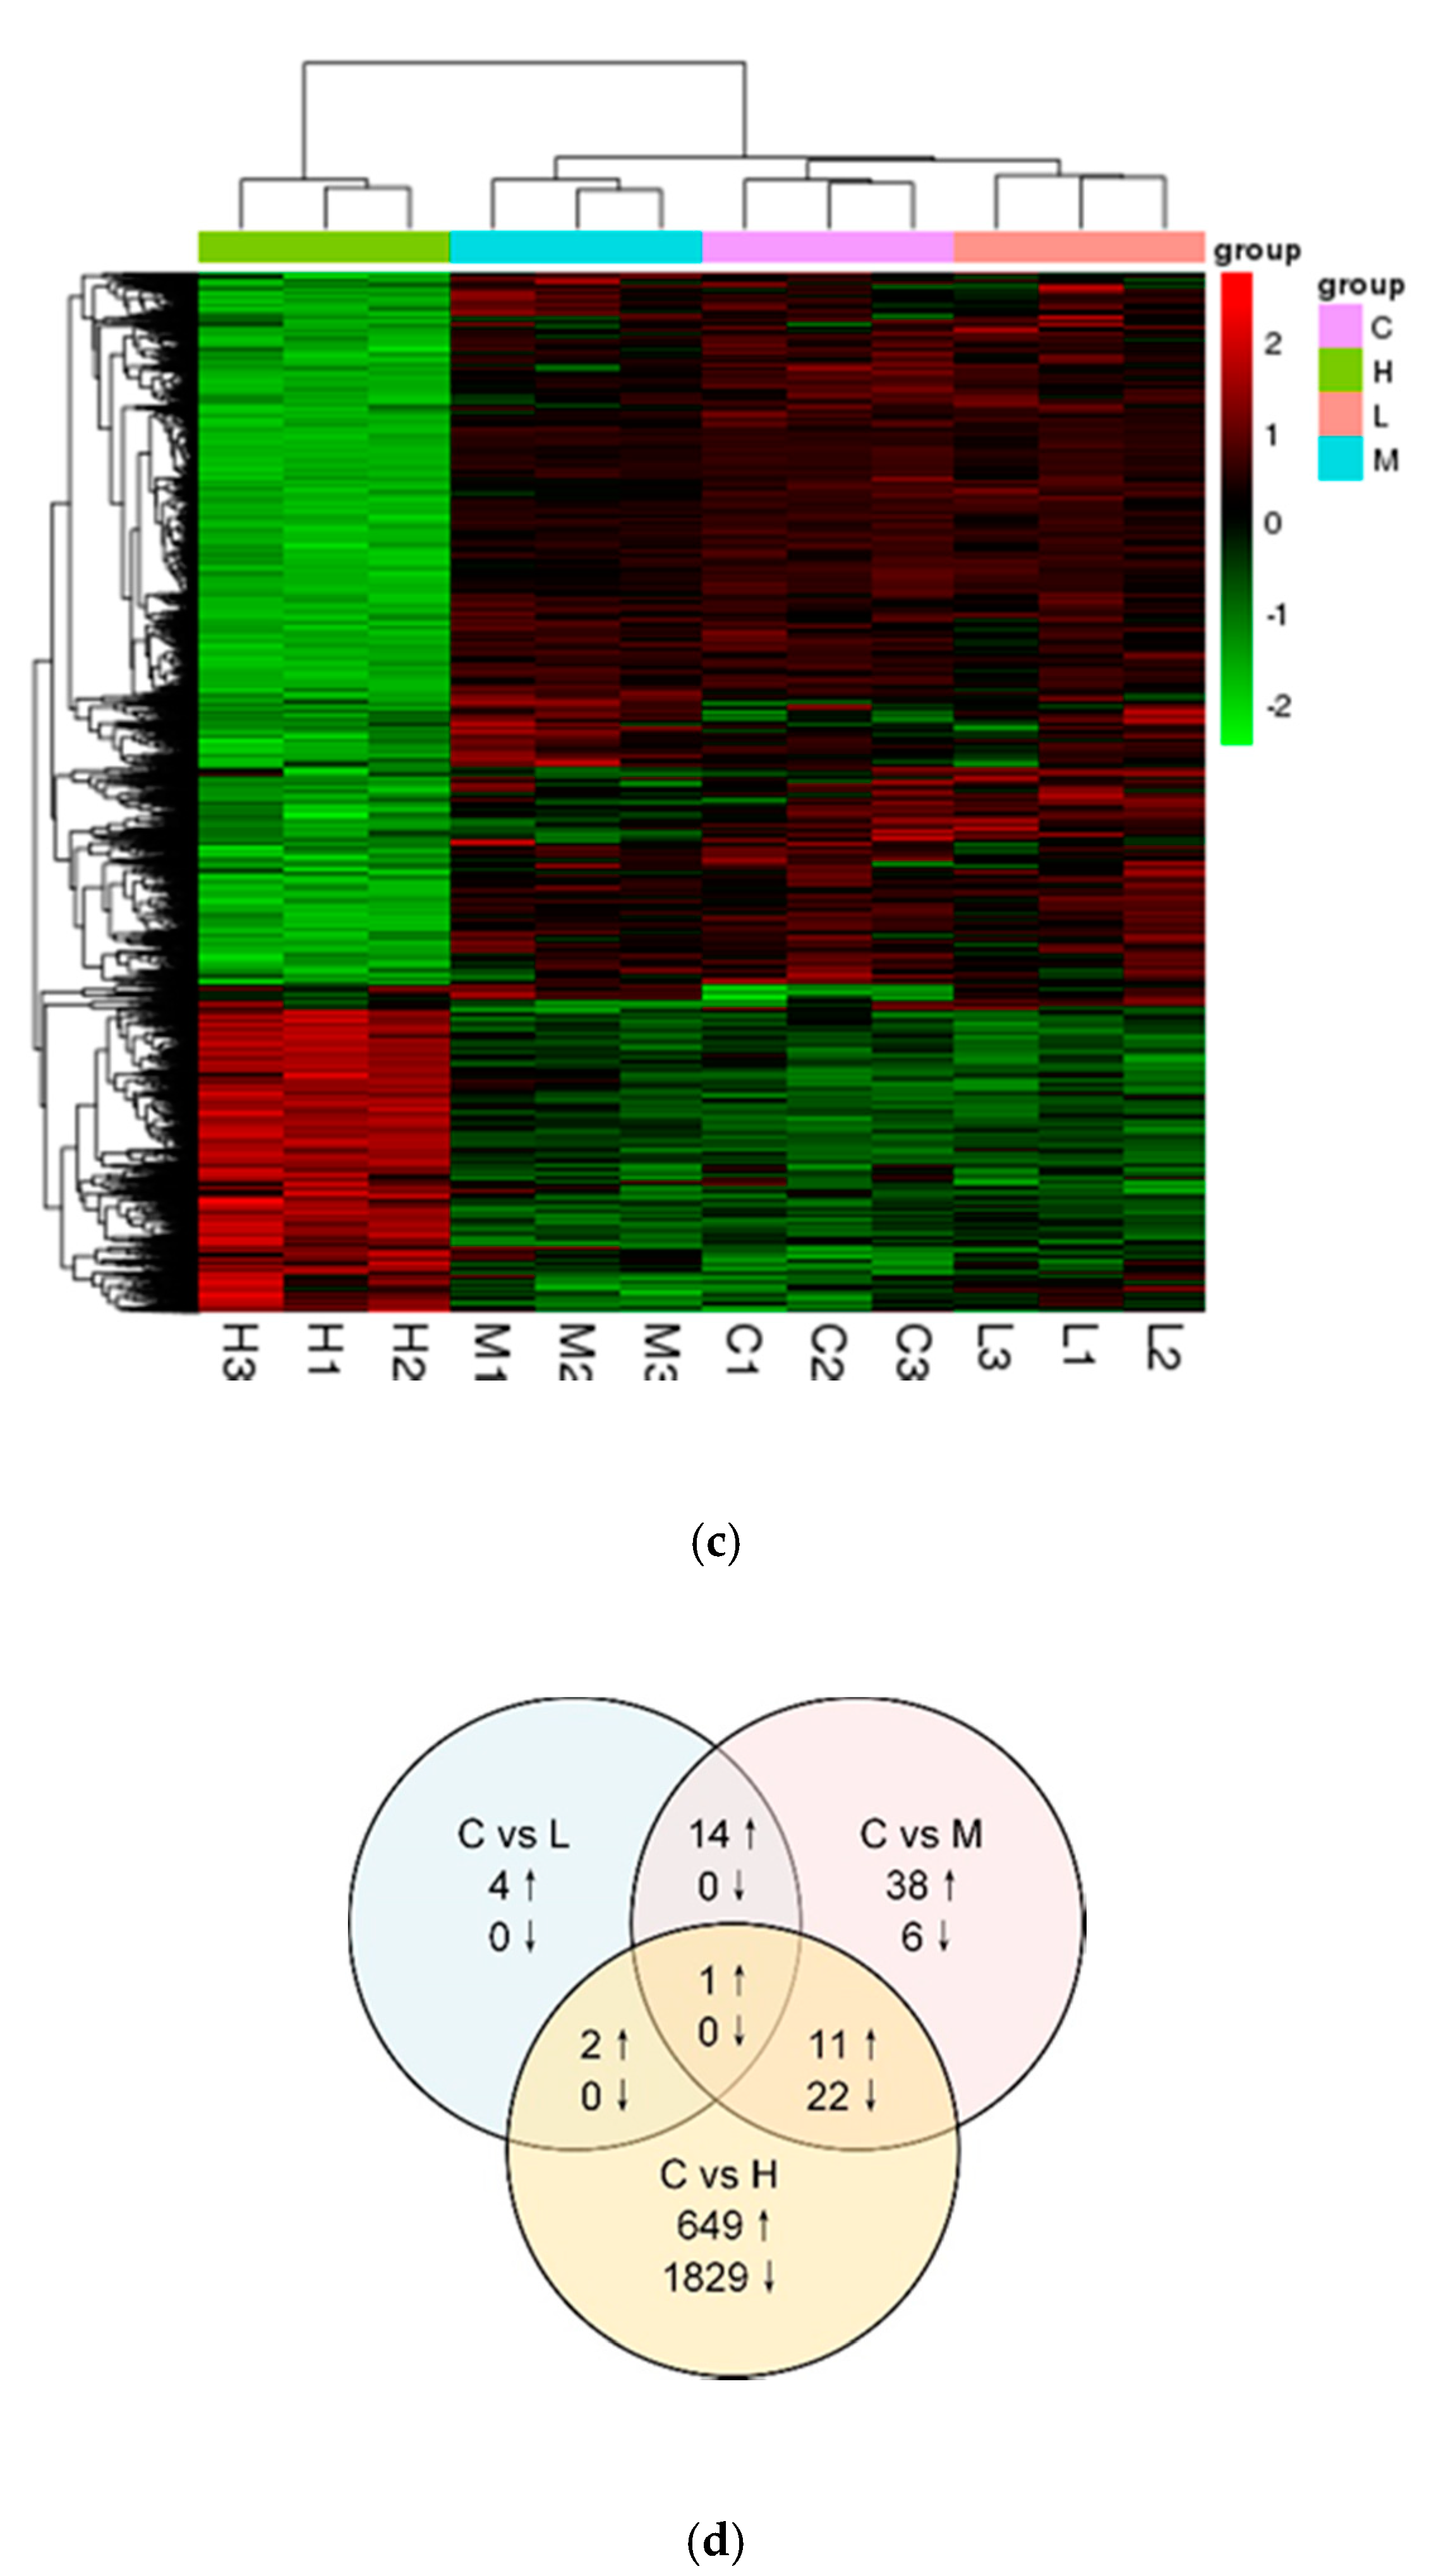
3.2. Analysis of DEGs

Based on BLAST results, a total of 13,383 (100%), 13,347 (99.73%), 7511 (56.12%), and 3680 (27.49%) genes, respectively, were matched in the Ensembl, UniProtID, GO, or KEGG databases. The correlation coefficient (R2) in each group was beyond 0.93 as found by conducting Pearson’s correlation analysis (Figure 2a), which showed a strong correlation. In line with this, a PCA of our 12 samples represented that the triplicate samples in each treatment group clustered together (Figure 2b); gene expressions in low and medium groups were not separated from those in control groups. With the increase in LIN concentration, a clear separation appeared, suggesting that high exposure of LIN may give rise to adverse effects, which is demonstrated by the significant inhibition of algal growth.
The LIN exposure sample was compared with the control to identify DEGs, and NGS screening identified 21 (21 up- and 0 downregulated), 92 (64 up- and 28 downregulated) in low and medium groups, respectively. High groups represented a significantly differentially expressed compared with the low exposure (low and medium) groups, which identified 2514 (663 up- and 1851 downregulated) genes. (Figure 2c,d and Figure S1). To verify the accuracy of RNA-seq analysis, two DEGs involved in porphyrin and chlorophyll metabolism pathways were detected by qRT-PCR. The results of this experiment are represented by linear regression curves of fold change levels determined by qRT-qPCR and NGS data, and therefore conform to the reliability of NGS analysis (Figure S2). For instance, genes hemE and cdo1 demonstrated a moderate to high correlation estimated by qRT-PCR analysis with the p value = 0.0044 and R2 = 0.57, and p value < 0.0001 and R2 = 0.86, respectively.

3.3. Analyses of GO and Functional Pathway

GO enrichment analysis was applied to identify the biological functions significantly related to DEGs, and the top 30 GO terms that consist of CC, MF, and BP in all LIN dosing groups are listed in Supplementary data (Figure S3). Furthermore, the majority of GO terms in the low group were similar to the medium group, and mainly related to photosynthesis and chloroplast. For instance, the top terms of CC and MF were both GO: 0009523 photosystem II and GO: 0009507 chloroplast in low and high treatment groups. These results were also verified by the enrichment pathway related to photosynthesis, chlorophyll metabolism, etc. in low groups. The top six enriched GO terms in the high group were associated with the processes of lipid metabolism and microtubules (e.g., lipid metabolic process, microtubule-based process, fatty acid biosynthetic process, fatty acid metabolic process in BP, microtubule binding, and tubulin binding in MF).

4. Discussion

Transcriptome analysis was performed to assess the hypothesis that high LIN exposure may disrupt the pathways of carbon fixation in photosynthetic organisms: photosynthesis and fatty acid pathways. In line with this, genes involved in carbon fixation in photosynthetic organisms were mostly upregulated, but none of the enriched pathways involved in the protein synthesis and translocation were detected. This evidence demonstrated that algae and bacteria have different LIN targets. The problem of residues of LIN has drawn public concern [29]. Based on it, this study demonstrated the negligible impact of LIN on the algal growth under the environmental concentration (0.5 μg L−1), while it showed a positive effect on the transcriptome analysis of all the DEGs involved in the photosynthesis: antenna proteins and porphyrin and chlorophyll metabolism were increased. While at the high exposure, genes involved in starch and sucrose metabolism, pentose and glucuronate interconversions, taurine and hypotaurine metabolism, and purine metabolism were dysregulated. Notably, 3680 DEGs in the high-LIN groups account for 27.49% of the total annotated genes. After mapping to the KEGG database, only a small fraction of DEGs can be enriched in the KEGG pathway database. Given that 60% of growth inhibition was detected in the high group, it was believed that the unmapped DEGs may have crucial functions during algal growth. Furthermore, most of the genes in phases I, II, and III involved in xenobiotic metabolism were downregulated. The enriched signaling pathways were discussed in the following sections to explore the impacts of LIN on R. subcapitata.

4.1. Genes involved in Photosynthesis

The exposure of R. subcapitata to 0.5 and 5 μg L−1 LIN for 7 days led to the promotion of pathways of photosynthesis: antenna proteins and porphyrin and chlorophyll metabolism pathways, suggesting that the photosynthesis activity was increased. Genes lhca2, lhca4, and lhcb1 in low LIN treatment groups and lhca4, lhcb1, and lhcb2 in the medium were upregulated. Lhcb1 and Lhcb2 encoding light-harvesting chlorophyll a/b binding proteins, which serve as supplementary roles in the process of state transitions in Arabidopsis [30]. Gene Lhca4 is associated with the red-most fluorescence emission of photosystem I of the antenna complex, which contains two stromal binding sites with chlorophylls. The upregulated Lhca4 may thus promote the binding of chlorophyll and further lead to an increase of photosynthesis activity in the medium group [31]. The conjecture was proved as well by the increased expression levels of genes chlD, chlH, hemA, hemD, hemE, hemL, and por in porphyrin and chlorophyll metabolism pathway in medium LIN treatment samples. These elevated genes suggested the promotion of the synthesis of chlorophylls a and b, which may further promote the process of light capture and energy transition [32]. A similar effect was observed on the Euglena gracilis after chloramphenicol exposure [33]. While the growth inhibition test demonstrated that there is no significant increase in algal growth at low (0.5 μg L−1) LIN exposure, and significant growth inhibition at 5 μg L−1. This suggested that for this antibiotic LIN, photosynthesis is more sensitive than growth, presumably due to photosynthesis is the first procedure in converting light to energy [34,35]. Similar effects were detected in the toxicity tests of tylosin to R. subcapitata [35]. A decreased content of chlorophyll was detected when the concentration of antibiotics rises. For instance, after 0.5 mg L−1 ROX exposure of Chlorella pyrenoidosa, the content of chlorophyll was reduced remarkably [36].
In the high-LIN dosing groups, the majority of upregulated genes were detected in the pathway of carbon fixation in photosynthetic organism. C3 photosynthetic pathway also known as Calvin Benson cycle, which with C4-dicarboxylic acid cycle (C4 photosynthetic pathway) play important roles in carbon fixation involved in the photosynthesis [37]. In this study, the expression level of genes rpa, gapa, and aldo in the Calvin Benson cycle at high-LIN exposure were mostly up-regulated (Table 1). It suggested the enhancement of C3 cycles at high-LIN exposure is conducive to accelerate CO2 concentrating process [9,38]. At the same unfavorable conditions, the promotion of the carbon fixation pathway in R. subcapitata was detected after 0.09 mg L−1 roxithromycin and 0.12 mg L−1 erythromycin, respectively [9,10].

4.2. Genes Related to Xenobiotic Metabolism

Biodegradation, including phase I, II, and III detoxification processes, is an effective way to excrete xenobiotics in algae [39,40]. In this study, after exposure to high LIN concentrations, the genes involved in all phases were nearly downregulated. In phase I, the expression of Cyt p450 and Cyt b5 genes were decreased. Cyt b5 functions as a catalyst in adjusting the activity of cyt p450 [41]. Downregulation of cyt b5 may thus reduce the activity of cyt p450, which converts the lipophilic xenobiotics to more water-soluble compounds by facilitating the excretion of certain compounds [42]. In line with this, ERY, which has the same characteristics as LIN, inhibited the cytochrome p450 activity in R. subcapitata [10]. The amidase family, which is involved in mycothiol-mediated detoxification, can be used to regenerate mycothiol, which is a common protective agent under environmental stress conditions and it mainly serves to improve cell robustness and survival [43]. AOs catalyzing the oxidation of amines to aldehydes have been proposed as sources of reactive oxygen species (ROS) in the apoplast [44]. Surprisingly, AOs were up-regulated in the high-LIN group, suggesting the elevated ROS in algae, which is a marker of oxidative stress. In phase II (conjugation progress), expression of gpx was decreased in high-LIN groups. Gpx shows a potent effect on the detoxification of peroxides from the cells and/or tissues, which protect various organisms from oxidative stresses [45,46]. Hence, the decreased gpx may reduce the detoxification ability in algae. In phase III of detoxification in photosynthesizing lives, exogenous substances are discharged into the cell wall or vacuole through exocytosis [47,48]. Surprisingly, ABC transporter family genes (ABC transporter family A, B, I, G), acting as an ATP-powered efflux pump that transport xenobiotic across biological membranes, were down-regulated. This may lead to higher toxicity by prolonging dwell time and the effect of LIN in R. subcapitata [49,50]. In accordance with this, a reduction of ABC transporter family genes was detected in both 80 (ABC transporter family A, G) and 120 µg L−1 ERY-dosing groups (ABC transporter family A, B, I, G) [10].

4.3. Genes Involved in Amino Acids, Nucleotide, and Carbohydrate Metabolism

In high-LIN groups, pathways of carbohydrate metabolism, amino acids, and nucleotide metabolism were enriched. Among this, carbohydrates are common energy and carbon storage products in algae [51]. In the present study, pentose and glucuronate interconversions and starch and sucrose metabolism pathways involved in carbohydrates pathway were both affected. After high-LIN exposure, UDPglucose 6-dehydrogenase (ugdh) involved in the synthesis of enzyme UDP-glucose was decreased. The decreased UDP-glucose may change the cytoderm structures and inhibit the process of lipid secretion in R. subcapitata [52]. Starch and sucrose play vital roles in storing energy in algae [53]. The downregulation of starch and sucrose metabolism may disrupt the photosynthesis process at high-LIN exposure [53]. Similarly, the metabolomic analysis revealed that the inhibition of amino acids, starch, and sucrose metabolism in algae Chlorella vulgaris may lead to photosynthesis inhibition, oxidative stress, and cell membrane damage [53]. Pathway of taurine and hypotaurine metabolism was also inhibited in high-LIN dosing groups. Taurine was correlated with chlorophyll content in heterotrophic dinoflagellates [54]. Moreover, in the present study, the downregulated ado and cdo1 genes were involved in the synthesis of hypotaurine. As a taurine precursor, hypotaurine is produced by cysteine. At high-LIN treatment groups, genes cysteine dioxygenase (cdo) and cysteamine dioxygenase (ado) involved in two ways of producing cysteine were both downregulated [55]. Besides, hypotaurine is an endogenous antioxidant, the decrease of these two genes ado and cdo1 suggested a reduction of intracellular hypotaurine level, which is proof of cellular responses to oxidative stress [56]. Thus, high-LIN exposure may inhibit algal growth by interfering with the hypotaurine synthesis. Furthermore, we observed that the majority of genes involved in nucleoside, nucleotide, and purine/pyrimidine pathways were downregulated in response to high-LIN treatments. In accordance with this, b-lactams, aminoglycosides, and quinolones treatments strikingly inhibited the nucleoside metabolism by decreasing the expression levels of nucleoside, nucleotide, and purine/pyrimidine base in Escherichia coli and further bring about a reduction of nucleotide building blocks [56]. It suggests that antibiotics may result in higher levels of DNA damage by disrupting the nucleotide metabolism [56]. Furthermore, pyrimidine metabolism and purine metabolism were changed after high roxithromycin exposure [9].

4.4. Genes Involved in Antioxidant Defense

Three genes involved in the peroxisome pathway consist of superoxide dismutase (sod2), peroxin-2 (pex2), 2,4-dienoyl-CoA reductase ((3E)-enoyl-CoA-producing) (decr2) were upregulated at high-LIN exposure. We suggest that the antioxidant system was activated to cope with the generate extra ROS, and further result in oxidative damage including the impairment of photosynthesis, and finally leads to growth inhibition of algae [57,58]. Besides, macrolide antibiotic roxithromycin treatment can activate the antioxidant system of algae by giving rise to the production of excessive ROS. It is demonstrated by the increase of oxidative stress biomarkers (MDA) content in alga R. subcapitata [18]. Superoxide dismutase (SOD) is a key enzyme in the antioxidant system, which functions as a pioneer in defending against ROS to protect organisms [59]. Based on this, it is demonstrated that the enhanced of SOD after 80 µg L−1 Clarithromycin exposure in algae Chlorella vulgaris [19]. Previous studies also reported that elevated SOD activities attenuate the oxidative damage caused by several pollution exposures (e.g. antibiotics dichlorohydrofluorescein and dichlorofluorescein, heavy metals Hg2+, Cd2+, Pb2+ and Cu2+) [57,60]. Furthermore, three genes were downregulated consist of long-chain acyl-CoA synthetase (acsl), acyl-CoA oxidase (acox1), and alanine-glyoxylate transaminase (agxt). acsl and acox1 were related to the synthesis of fatty acid synthesis; the decrease of these two genes may cause chloroplast damage and finally refrain the algae growth [61]. In concordance with this, the restraint of fatty acid synthesis was detected by Fourier transform infrared spectroscopy after ROX exposure in R. subcapitataa [16].

5. Conclusions

Exposure to LIN at the environmental level showed no significant effect on the growth of algae, while nearly 65.4% of growth inhibition was found in the high-LIN concentration group. The pathways related to photosynthesis were altered in all LIN treatment groups. The low and medium levels of LIN altered the transcriptome of alga R. subcapitata including photosynthesis-antenna proteins and porphyrin and chlorophyll metabolism pathways. Our results suggested that LIN at environmental concentrations can hardly affect algal growth, and photosynthesis at a low level was more sensitive than algal growth, while upregulated DEGs in carbon fixation in the photosynthesis pathway were detected at high LIN treatment groups. By contrast, the enriched pathways including nucleotide metabolism (purine and pyrimidine metabolism), amino acid metabolism and carbohydrate metabolism were detected in the high-LIN treatment groups. Furthermore, in high-LIN treatment groups, DEGs involved in antioxidant defense process suggested the occurrence of oxidative stress caused by LIN. Transcriptome analysis suggested diverse modes of action of LIN in R. subcapitata and bacteria.

Supplementary Materials

The following are available online at https://www.mdpi.com/2076-3417/10/23/8565/s1. Figure S1: Volcano plot of gene expression profile in three treatment groups, Figure S2: The results of qRT-PCR, Figure S3: GO enrichment analysis of differentially expressed genes (DEGs) in three lincomycin treated groups.

Author Contributions

Conceptualization, Q.Z. and Y.B.; Formal analysis, Q.Z. and Y.B.; Funding acquisition, J.G.; Investigation, Q.Z., Z.C., and Y.B.; Methodology, Q.Z., J.M., Y.B. and J.G.; Supervision, Q.Z.; Writing—original draft, Y.B., Y.T.; Writing—review & editing: all authors. All authors have read and agreed to the published version of the manuscript.

Funding

This work was supported by the Key Research and Development Program of ShaanXi Province: No. 2020SF-387 and ShaanXi Thousand Talent Program for Young Outstanding Scientists given to Jiahua Guo: No. 334041900007. This work was also supported by the Young Talent fund of University Association for Science and Technology in ShaanXi, China [No. 20200414].

Conflicts of Interest

The authors declare no conflict of interest.

References

  1. Sarmah, A.K.; Meyer, M.T.; Boxall, A.B. A global perspective on the use, sales, exposure pathways, occurrence, fate and effects of veterinary antibiotics (VAs) in the environment. Chemosphere 2006, 65, 725–759. [Google Scholar] [CrossRef] [PubMed]
  2. Zhang, Q.; Ying, G.; Pan, C.; Liu, Y.; Zhao, J. Comprehensive evaluation of antibiotics emission and fate in the river basins of China: Source analysis, multimedia modeling, and linkage to bacterial resistance. Environ. Sci. Technol. 2015, 49, 6772–6782. [Google Scholar] [CrossRef] [PubMed]
  3. Andreozzi, R.; Canterino, M.; Giudice, R.L.; Marotta, R.; Pinto, G.; Pollio, A. Lincomycin solar photodegradation, algal toxicity and removal from wastewaters by means of ozonation. Water Res. 2006, 40, 630–638. [Google Scholar] [CrossRef] [PubMed]
  4. Ren, S.; Lu, A.; Guo, X.; Zhang, Q.; Wang, Y.; Guo, X.; Wang, L.; Zhang, B. Effects of co-composting of lincomycin mycelia dregs with furfural slag on lincomycin degradation, degradation products, antibiotic resistance genes and bacterial community. Bioresour. Technol. 2019, 272, 83–91. [Google Scholar] [CrossRef] [PubMed]
  5. Zhou, L.; Li, J.; Zhang, Y.; Kong, L.; Jin, M.; Yang, X.; Wu, Q. Trends in the occurrence and risk assessment of antibiotics in shallow lakes in the lower-middle reaches of the Yangtze River basin, China. Ecotoxicol. Environ. Saf. 2019, 183, 109511. [Google Scholar] [CrossRef] [PubMed]
  6. Kleywegt, S.; Pileggi, V.; Yang, P.; Hao, C.; Zhao, X.; Rocks, C.; Thach, S.; Cheung, P.; Whitehead, B. Pharmaceuticals, hormones and bisphenol A in untreated source and finished drinking water in Ontario, Canada—Occurrence and treatment efficiency. Sci. Total Environ. 2011, 409, 1481–1488. [Google Scholar] [CrossRef]
  7. Guo, J.; Boxall, A.; Selby, K. Do pharmaceuticals pose a threat to primary producers? Crit. Rev. Environ. Sci. Technol. 2015, 45, 2565–2610. [Google Scholar] [CrossRef]
  8. OECD. Test No. 201: Freshwater alga and cyanobacteria, growth inhibition test. In OECD Guidelines for the Testing of Chemicals, Section 2; OECD Publishing: Paris, France, 2011; Volume 2, p. 25. [Google Scholar] [CrossRef] [Green Version]
  9. Guo, J.; Bai, Y.; Chen, Z.; Mo, J.; Li, Q.; Sun, H.; Zhang, Q. Transcriptomic analysis suggests the inhibition of DNA damage repair in green alga Raphidocelis subcapitata exposed to roxithromycin. Ecotoxicol. Environ. Saf. 2020, 201, 110737. [Google Scholar] [CrossRef]
  10. Guo, J.; Ma, Z.; Peng, J.; Mo, J.; Li, Q.; Guo, J.; Yang, F. Transcriptomic analysis of Raphidocelis subcapitata exposed to erythromycin: The role of DNA replication in hormesis and growth inhibition. J. Hazard. Mater. 2021, 402, 123512. [Google Scholar] [CrossRef]
  11. Brockmeier, E.K.; Hodges, G.; Hutchinson, T.H.; Butler, E.; Hecker, M.; Tollefsen, K.E.; Garcia-Reyero, N.; Kille, P.; Becker, D.; Chipman, K. The role of omics in the application of adverse outcome pathways for chemical risk assessment. Toxicol. Sci. 2017, 158, 252–262. [Google Scholar] [CrossRef]
  12. Drugbank. Available online: https://go.drugbank.com/drugs/DB01627 (accessed on 15 October 2020).
  13. Manuell, A.; Beligni, M.; Yamaguchi, K.; Mayfield, S. Regulation of Chloroplast Translation: Interactions of RNA Elements, RNA-Binding Proteins and the Plastid Ribosome; Portland Press Limited: London, UK, 2004. [Google Scholar]
  14. Brain, R.A.; Hanson, M.L.; Solomon, K.R.; Brooks, B.W. Aquatic plants exposed to pharmaceuticals: Effects and risks. Rev. Environ. Contam. Toxicol. 2008, 192, 67–115. [Google Scholar] [PubMed]
  15. Guo, J.; Selby, K.; Boxall, A.B. Effects of Antibiotics on the Growth and Physiology of Chlorophytes, Cyanobacteria, and a Diatom. Arch. Environ. Contam. Toxicol. 2016, 71, 589–602. [Google Scholar] [CrossRef] [PubMed] [Green Version]
  16. Xiong, Q.; Hu, L.; Liu, Y.; Wang, T.; Ying, G. New insight into the toxic effects of chloramphenicol and roxithromycin to algae using FTIR spectroscopy. Aquat. Toxicol. 2019, 207, 197–207. [Google Scholar] [CrossRef] [PubMed]
  17. Kabra, A.N.; Ji, M.K.; Choi, J.; Kim, J.R.; Govindwar, S.P.; Jeon, B.H. Toxicity of atrazine and its bioaccumulation and biodegradation in a green microalga, Chlamydomonas mexicana. Environ. Sci. Pollut. Res. Int. 2014, 21, 12270–12278. [Google Scholar] [CrossRef] [PubMed]
  18. Han, Q.; Zheng, Y.; Qi, Q.; Peng, J.; Song, J.; Guo, J.; Guo, J. Involvement of oxidative stress in the sensitivity of two algal species exposed to roxithromycin. Ecotoxicology 2020, 29, 625–633. [Google Scholar] [CrossRef]
  19. Guo, J.; Peng, J.; Lei, Y.; Kanerva, M.; Li, Q.; Song, J.; Guo, J.; Sun, H. Comparison of oxidative stress induced by clarithromycin in two freshwater microalgae Raphidocelis subcapitata and Chlorella vulgaris. Aquat. Toxicol. 2020, 219, 105376. [Google Scholar] [CrossRef]
  20. Huang, W.; Ye, J.; Zhang, J.; Lin, Y.; He, M.; Huang, J. Transcriptome analysis of Chlorella zofingiensis to identify genes and their expressions involved in astaxanthin and triacylglycerol biosynthesis. Algal Res. 2016, 17, 236–243. [Google Scholar] [CrossRef]
  21. Cheng, Q.; Zhou, Q.; Jin, Z.; Jiang, Y.; Xu, L.; Jiang, H.; Zhao, Y. Bioaccumulation, growth performance, and transcriptomic response of Dictyosphaerium sp. after exposure to nonylphenol. Sci. Total Environ. 2019, 687, 416–422. [Google Scholar] [CrossRef]
  22. Chomczynski, P.; Sacchi, N. The single-step method of RNA isolation by acid guanidinium thiocyanate–phenol–chloroform extraction: Twenty-something years on. Nat. Protoc. 2006, 1, 581–585. [Google Scholar] [CrossRef]
  23. Martin, M. Cutadapt removes adapter sequences from high-throughput sequencing reads. EMBnet. J. 2011, 17, 10–12. [Google Scholar] [CrossRef]
  24. Kim, D.; Langmead, B.; Salzberg, S.L. HISAT: A fast spliced aligner with low memory requirements. Nat. Methods 2015, 12, 357–360. [Google Scholar] [CrossRef] [PubMed] [Green Version]
  25. Anders, S.; Pyl, P.T.; Huber, W. HTSeq—A Python framework to work with high-throughput sequencing data. Bioinformatics 2015, 31, 166–169. [Google Scholar] [CrossRef] [PubMed]
  26. Anders, S.; Huber, W. Differential expression analysis for sequence count data. Genome Biol. 2010. [Google Scholar] [CrossRef] [PubMed] [Green Version]
  27. Wickham, H. ggplot2: Elegant Graphics for Data Analysis; Springer: New York, NY, USA, 2016. [Google Scholar]
  28. Kolde, R.; Kolde, M.R. Package ‘pheatmap’. R Package 2015, 1, 790. [Google Scholar]
  29. Yan, P.; Mo, Z.; Dong, J.; Chen, F.; Qian, J.; Xia, J.; Xu, L.; Zhang, J.; Li, H. Construction of Mn valence-engineered MnO2/BiOCl heterojunction coupled with carriers-trapping effect for enhanced photoelectrochemical lincomycin aptasensor. Sens. Actuators B Chem. 2020, 320, 128415. [Google Scholar] [CrossRef]
  30. Pietrzykowska, M.; Suorsa, M.; Semchonok, D.A.; Tikkanen, M.; Boekema, E.J.; Aro, E.M.; Jansson, S. The light-harvesting chlorophyll a/b binding proteins Lhcb1 and Lhcb2 play complementary roles during state transitions in Arabidopsis. Plant Cell 2014, 26, 3646–3660. [Google Scholar] [CrossRef] [Green Version]
  31. Su, X.; Ma, J.; Pan, X.; Zhao, X.; Chang, W.; Liu, Z.; Zhang, X.; Li, M. Antenna arrangement and energy transfer pathways of a green algal photosystem-I–LHCI supercomplex. Nat. Plants 2019, 5, 273. [Google Scholar] [CrossRef]
  32. Qian, H.; Li, J.; Pan, X.; Sun, Z.; Ye, C.; Jin, G.; Fu, Z. Effects of streptomycin on growth of algae Chlorella vulgaris and Microcystis aeruginosa. Environ. Toxicol. 2012, 27, 229–237. [Google Scholar] [CrossRef]
  33. Ben-Shaul, Y.; Markus, Y. Effects of chloramphenicol on growth, size distribution, chlorophyll synthesis and ultrastructure of Euglena gracilis. J. Cell Sci. 1969, 4, 627–644. [Google Scholar]
  34. Hankamer, B.; Lehr, F.; Rupprecht, J.; Mussgnug, J.H.; Posten, C.; Kruse, O. Photosynthetic biomass and H2 production by green algae: From bioengineering to bioreactor scale-up. Physiol. Plant. 2007, 131, 10–21. [Google Scholar] [CrossRef]
  35. van der Grinten, E.; Pikkemaat, M.G.; van den Brandhof, E.J.; Stroomberg, G.J.; Kraak, M.H. Comparing the sensitivity of algal, cyanobacterial and bacterial bioassays to different groups of antibiotics. Chemosphere 2010, 80, 1–6. [Google Scholar] [CrossRef] [PubMed] [Green Version]
  36. Li, J.; Min, Z.; Li, W.; Xu, L.; Han, J.; Li, P. Interactive effects of roxithromycin and freshwater microalgae, Chlorella pyrenoidosa: Toxicity and removal mechanism. Ecotoxicol. Environ. Saf. 2020, 191, 110156. [Google Scholar] [CrossRef] [PubMed]
  37. Fan, J.; Xu, H.; Li, Y. Transcriptome-based global analysis of gene expression in response to carbon dioxide deprivation in the green algae Chlorella pyrenoidosa. Algal Res. 2016, 16, 12–19. [Google Scholar] [CrossRef]
  38. Li, X.; Yuan, Y.; Cheng, D.; Gao, J.; Kong, L.; Zhao, Q.; Wei, W.; Sun, Y. Exploring stress tolerance mechanism of evolved freshwater strain Chlorella sp. S30 under 30 g/L salt. Bioresour. Technol. 2018, 250, 495–504. [Google Scholar] [CrossRef]
  39. Pan, C.; Peng, F.; Ying, G. Removal, biotransformation and toxicity variations of climbazole by freshwater algae Scenedesmus obliquus. Environ. Pollut. 2018, 240, 534–540. [Google Scholar] [CrossRef]
  40. Pflugmacher, S.; Wiencke, C.; Sandermann, H. Activity of phase I and phase II detoxication enzymes in Antarctic and Arctic macroalgae. Mar. Environ. Res. 1999, 48, 23–36. [Google Scholar] [CrossRef]
  41. Ahuja, S.; Jahr, N.; Im, S.C.; Vivekanandan, S.; Popovych, N.; Le Clair, S.V.; Huang, R.; Soong, R.; Xu, J.; Yamamoto, K. A model of the membrane-bound cytochrome b5-cytochrome P450 complex from NMR and mutagenesis data. J. Biol. Chem. 2013, 288, 22080–22095. [Google Scholar] [CrossRef] [Green Version]
  42. Zanger, U.M.; Raimundo, S.; Eichelbaum, M. Cytochrome P450 2D6: Overview and update on pharmacology, genetics, biochemistry. Naunyn-Schmiedeberg’s Arch. Pharmacol. 2004, 369, 23–37. [Google Scholar] [CrossRef]
  43. Si, M.; Long, M.; Chaudhry, M.T.; Xu, Y.; Zhang, P.; Zhang, L.; Shen, X. Functional characterization of Corynebacterium glutamicum mycothiol S-conjugate amidase. PLoS ONE 2014, 9, e115075. [Google Scholar] [CrossRef]
  44. Bolwell, G.P.; Wojtaszek, P. Mechanisms for the generation of reactive oxygen species in plant defence—A broad perspective. Physiol. Mol. Plant Pathol. 1997, 51, 347–366. [Google Scholar] [CrossRef]
  45. Roy, G.; Sarma, B.K.; Phadnis, P.P.; Mugesh, G. Selenium-containing enzymes in mammals: Chemical perspectives. J. Chem. Sci. 2005, 117, 287–303. [Google Scholar] [CrossRef] [Green Version]
  46. Vítová, M.; Bišová, K.; Hlavová, M.; Zachleder, V.; Rucki, M.; Čížková, M. Glutathione peroxidase activity in the selenium-treated alga Scenedesmus quadricauda. Aquat. Toxicol. 2011, 102, 87–94. [Google Scholar] [CrossRef] [PubMed]
  47. Avery, S.V.; Codd, G.A.; Gadd, G.M. Characterisation of Caesium Transport in the Microalga Chlorella salina; Portland Press Ltd.: London, UK, 1995. [Google Scholar]
  48. Jabusch, T.W.; Swackhamer, D.L. Subcellular accumulation of polychlorinated biphenyls in the green alga Chlamydomonas reinhardtii. Environ. Toxicol. Chem. Int. J. 2004, 23, 2823–2830. [Google Scholar] [CrossRef] [PubMed]
  49. Sharom, F.J.; Kretzschmar, T.; Burla, B.; Lee, Y.; Martinoia, E.; Nagy, R. Functions of ABC transporters in plants. Essays Biochem. 2011, 50, 145–160. [Google Scholar] [CrossRef] [Green Version]
  50. Lopez-Ortiz, C.; Dutta, S.K.; Natarajan, P.; Peña-Garcia, Y.; Abburi, V.; Saminathan, T.; Nimmakayala, P.; Reddy, U.K. Genome-wide identification and gene expression pattern of ABC transporter gene family in Capsicum spp. PLoS ONE 2019, 14, e0215901. [Google Scholar] [CrossRef]
  51. Raven, J.A.; Beardall, J. Carbohydrate metabolism and respiration in algae. Photosynthesis in Algae. 2003, Volume 1, pp. 205–224. Available online: https://www.researchgate.net/publication/226999701_Carbohydrate_Metabolism_and_Respiration_in_Algae (accessed on 30 November 2020).
  52. Li, D.W.; Balamurugan, S.; Yang, Y.F.; Zheng, J.W.; Huang, D.; Zou, L.G.; Yang, W.D.; Liu, J.S.; Guan, Y.; Li, H.Y. Transcriptional regulation of microalgae for concurrent lipid overproduction and secretion. Sci. Adv. 2019, 5, eaau3795. [Google Scholar] [CrossRef] [Green Version]
  53. Yuan, P.; Zhou, Q.; Hu, X. The phases of WS2 nanosheets influence uptake, oxidative stress, lipid peroxidation, membrane damage, and metabolism in algae. Environ. Sci. Technol. 2018, 52, 13543–13552. [Google Scholar] [CrossRef]
  54. Tevatia, R.; Allen, J.; Rudrappa, D.; White, D.; Clemente, T.E.; Cerutti, H.; Demirel, Y.; Blum, P. The taurine biosynthetic pathway of microalgae. Algal Res. 2015, 9, 21–26. [Google Scholar] [CrossRef] [Green Version]
  55. Nishimura, T.; Higuchi, K.; Yoshida, Y.; Sugita-Fujisawa, Y.; Kojima, K.; Sugimoto, M.; Santo, M.; Tomi, M.; Nakashima, E. Hypotaurine is a substrate of GABA transporter family members GAT2/Slc6a13 and TAUT/Slc6a6. Biol. Pharm. Bull. 2018, 41, 1523–1529. [Google Scholar] [CrossRef] [Green Version]
  56. Liu, F.; Pang, S.J. Stress tolerance and antioxidant enzymatic activities in the metabolisms of the reactive oxygen species in two intertidal red algae Grateloupia turuturu and Palmaria palmata. J. Exp. Mar. Biol. Ecol. 2010, 382, 82–87. [Google Scholar] [CrossRef]
  57. Belenky, P.; Jonathan, D.Y.; Porter, C.B.; Cohen, N.R.; Lobritz, M.A.; Ferrante, T.; Jain, S.; Korry, B.J.; Schwarz, E.G.; Walker, G.C. Bactericidal antibiotics induce toxic metabolic perturbations that lead to cellular damage. Cell Rep. 2015, 13, 968–980. [Google Scholar] [CrossRef] [Green Version]
  58. Xiong, J.; Kurade, M.B.; Abou-Shanab, R.A.; Ji, M.; Choi, J.; Kim, J.O.; Jeon, B. Biodegradation of carbamazepine using freshwater microalgae Chlamydomonas mexicana and Scenedesmus obliquus and the determination of its metabolic fate. Bioresour. Technol. 2016, 205, 183–190. [Google Scholar] [CrossRef] [PubMed]
  59. Liu, J.; Lu, G.; Ding, J.; Zhang, Z.; Wang, Y. Tissue distribution, bioconcentration, metabolism, and effects of erythromycin in crucian carp (Carassius auratus). Sci. Total Environ. 2014, 490, 914–920. [Google Scholar] [CrossRef] [PubMed]
  60. Okamoto, O.; Pinto, E.; Latorre, L.; Bechara, E.; Colepicolo, P. Antioxidant modulation in response to metal-induced oxidative stress in algal chloroplasts. Arch. Environ. Contam. Toxicol. 2001, 40, 18–24. [Google Scholar] [PubMed]
  61. Heredia-Martínez, L.G.; Andrés-Garrido, A.; Martínez-Force, E.; Pérez-Pérez, M.E.; Crespo, J.L. Chloroplast damage induced by the inhibition of fatty acid synthesis triggers autophagy in Chlamydomonas. Plant Physiol. 2018, 178, 1112–1129. [Google Scholar] [CrossRef] [Green Version]
Figure 1. A 7-day growth inhibition plot of R. subcapitata. Asterisk (*) demonstrates a significant difference (p < 0.05) in control and LIN dosing groups. Data expressed as mean ± SD of three parallel measurements (n = 3).
Applsci 10 08565 g001
Figure 2. Transcriptomic analysis of LIN dosing groups in alga R. subcapitata on day 7. (a) Correlation test of DEGs in each group. (b) PCA of FPKM profiles of DEGs after adding ROX. (c) A heatmap of centered and scaled FPKM values of DEGs in all dosing groups of R. subcapitata. (d) Venn diagram of the distribution of DEGs in each group. C: control group; L: low treatment group; M: medium treatment group; H: high treatment group.
Applsci 10 08565 g002aApplsci 10 08565 g002b
Table 1. List of main KEGG pathways changed by lincomycin treatment (p < 0.1).
PathwayCategoryUp-geneDown-genep ValueFDR
Control vs. Low
Photosynthesis—antenna proteinsEnergy metabolismlhca2, lhca4, lhcb1-1.43 × 10−74.30 × 10−7
Porphyrin and chlorophyll metabolismMetabolism of cofactors and vitaminshemE, hepe-0.00440.0065
photosynthesisEnergy metabolismpsbY-0.0960.096
Control vs. Medium
Photosynthesis - antenna proteinsEnergy metabolismlhca4, lhcb1, lhcb2-2.60 × 10−162.34 × 10⁻¹⁵
Porphyrin and chlorophyll metabolismMetabolism of cofactors and vitaminschlD, chlH, hemA, hemD, hemE, hemL, por-2.51× 10−81.13× 10−7
Control vs. High
Pentose and glucuronate interconversionsCarbohydrate metabolismrpe, xk1ugdh, ugp2, ugt0.00220.15
Starch and sucrose metabolismCarbohydrate metabolismglgA, isa, spp, tps, waxyE2.4.4.14, E3.2.1.2, E3.2.1.4, ugp20.00340.15
Amino sugar and nucleotide sugar metabolismCarbohydrate metabolismE3.2.1.14, uap1E1.6.2.2, gmpp, rhm, ugdh, ugp20.0560.74
Taurine and hypotaurine metabolismMetabolism of other amino acids-ado, cdo10.0140.41
Arginine and proline metabolismAmino acid metabolismaguA, E3.5.1.4p4ha, pip0.0650.74
Purine metabolismNucleotide metabolismapa1_2, ndk, pkadk, ade2, adprm, E2.7.1.20, fhit, purH, relA, rrm1, rrm20.0380.74
Pyrimidine metabolismNucleotide metabolismndk, udk, upb1cmpk1, pyrB, rrm1, rrm20.0980.90
Carbon fixation in photosynthetic organismsEnergy metabolismaldo, gapa, tbl1Gapdh, ppdK0.0630.74
Publisher’s Note: MDPI stays neutral with regard to jurisdictional claims in published maps and institutional affiliations.

