Article

Study on the Mechanical Criterion of Ice Lens Formation Based on Pore Size Distribution

1
State Key Laboratory of Frozen Soil Engineering, Northwest Institute of Eco-Environment and Resources, Chinese Academy of Sciences, Lanzhou 730000, China
2
College of Resources and Environment, University of Chinese Academy of Sciences, Beijing 100049, China
*
Author to whom correspondence should be addressed.
Appl. Sci. 2020, 10(24), 8981; https://doi.org/10.3390/app10248981
Submission received: 5 November 2020 / Revised: 6 December 2020 / Accepted: 9 December 2020 / Published: 16 December 2020
(This article belongs to the Section Civil Engineering)

Abstract

:
Ice lens is the key factor which determines the frost heave in engineering construction in cold regions. At present, several theories have been proposed to describe the formation of ice lens. However, most of these theories analyzed the ice lens formation from a macroscopic view and ignored the influence of microscopic pore sizes and structures. Meanwhile, these theories lacked the support of measured data. To solve this problem, the microscopic crystallization stress was converted into the macro mean stress through the principle of statistics with the consideration of pore size distribution. The mean stress was treated as the driving force of the formation of ice lens and induced into the criterion of ice lens formation. The influence of pore structure and unfrozen water content on the mean stress was analyzed. The results indicate that the microcosmic crystallization pressure can be converted into the macro mean stress through the principle of statistics. Larger mean stress means the ice lens will be formed easier in the soil. The mean stress is positively correlated with initial water content. At the same temperature, an increase to both the initial water content and the number of pores can result in a larger mean stress. Under the same initial water content, mean stress increases with decreasing temperature. The result provides a theoretical basis for studying ice lens formation from the crystallization theory.

1. Introduction

With the development of national defense and economic construction, an increasing number of foundation engineering projects have been built in cold regions in China, such as the Qinghai-Tibet Highway, Qinghai-Tibet Railway, Qinghai-Tibet Transmission and Harbin-Dalian high speed railway [1,2,3]. These projects have promoted the research on frost heave. With the gradual improvement of engineering grades and the strict requirement of deformation, a large number of important foundation projects have put forward for the purpose of preventing and controlling frost heave. According to the frost heave ratio, different measures are used to solve the problem of frost heave. Therefore, to obtain an accurate evaluation of frost heave is an important issue for engineers.
It was found that frost heave was caused by water migration into the freezing zone and forming ice lenses [4,5,6]. The early frost heave model can predict frost heave, but it cannot reflect the formation of ice lens. To simulate the formation of ice lens, many frost heave models including the criterion of ice lens formation have been proposed [7,8,9]. These criterions can be divided into two types: the thermal method and the mechanical method. Generally, these criterions of the mechanical method can be divided into four groups.
(1) Segregation pressure
In 1972, Miller [10] proposed the frozen fringe theory (second model of frost heave). The frozen fringe theory assumed that water migration was blocked by the frozen fringe. Consequently, the rate of frost heave was lower than that in the capillary theory. Based on the frozen fringe theory, some scholars pointed out that when the ice pressure is greater than the separation pressure, the soil matrix will break and a new ice lens will be formed [11,12]. The segregation pressure P sep can be expressed as:
P sep = P ob + 2 σ iw R f P R
where P ob is the overburden pressure, σ iw is the solid-water interfacial free energy, and R is the soil particle radius.
(2) Pore ice pressure
Different from Gilpin’s result, Hopke believed that when the ice pressure bore the entire external load, the ice lens was formed. The ice pressure can be calculated by using the generalized Clapeyron equation [13]:
P i T = ρ i P w T ρ w L T T 0
where ρi is the density of ice (ρi = 917 kg/m3); ρw is the density of water; T0 is the freezing point of water; T is the temperature and L is the latent heat of solidification per unit mass (L = 334.56 kJ/kg). Pi(T) and Pw(T) are the distribution functions of ice pressure and water pressure.
(3) Neutral stress (pore pressure)
Miller pointed out that when the effective pressure in the soil drops to zero, the ice lens will form [10]. Due to the existence of unfrozen water, there is pore water pressure. By introducing Bishop’s formula, the neutral stress can be expressed as:
P n = χ P w + ( 1 χ ) P i
χ = n 1 W n
where Pn is the neutral stress (or pore pressure); χ is the correlation coefficient; n is the pore volume and Wn is the pore water content.
This neutral stress has been adopted and further investigated by other researchers [5,14]. Based on the principles of equilibrium, continuity and energy in the multi-phase porous medium, Chen et al. [15] thought effective stress, water pressure and ice pressure combined to form the load:
σ = σ s + P i A i A + P w ( 1 A i A )
where σ is the total stress; σ s is the effective stress; A is the pore area and A i is the contact area of ice particles.
(4) Premelting film theory
Premelting film theory showed that the thickness of the film at the cold end was greater than that at warm end due to the different temperature. This temperature gradient resulted in the movement of substance. Based on the thermodynamic equilibrium theory, Rempel et al. described the formation and evolution process of the ice lens [8,16]. The intermolecular interactions between soil particles and ice produce the net thermomolecular force FT:
F T = Γ P T d Γ = Γ ( γ wi κ ρ i L T m T T m ) d Γ
where γwi is the surface energy of the solid-liquid interface (γwi = 0.0818 J/m2) and κ is defined as the curvature of the crystal-liquid interface.
As seen, the parameters and their values used in different theoretical methods are not the same and these differences lead to different calculation results. In general, these models contain several characteristic stresses: ice pressure, water pressure and segregation pressure. However, due to the limitations of testing techniques, it is difficult to obtain accurate measured data of pore ice pressure, pore water pressure and other pressures. Moreover, these models analyzed the ice lens formation from a macroscopic point of view, which ignored the influence of microscopic pore sizes and structures. In summary, there are two main problems in the presented criterions of ice lens formation: (1) the macroscopic phenomenon of frost heave can hardly be explained by microscopic mechanism; (2) the theoretical models cannot be verified by experimental results. Therefore, it is hard to unify the expression of the criterions for the ice lens formation.
In order to reveal the mechanical mechanism of ice lens formation and consummate the frost heave theory, a theoretical model of microscopic crystallization was established in this study. First, the microcrystalline stress was converted to the macroscopic mean stress. Second, the relationship between the mean stress and the driving force of the ice lens formation was discussed. Third, the influence of pore structure and unfrozen water content on the mean stress was analyzed. Finally, the formation mechanism of ice lens in the freezing process of soil was expounded and the comprehensive mechanical criterion of ice lens growth was obtained. The results can provide a theoretical basis for the study of ice lens formation and frost heave in the future.

2. Theoretical Model

In this section, the theory model of ice lens formation was established based on pore size distribution. First, the microscopic crystallization stress was converted into macro mean stress through the principle of statistics with the consideration of pore size distribution. Second, the relationship between macro mean stress and the driving force of the ice lens formation was discussed. Finally, a new criterion of ice-less formation was proposed. The details were listed as follows.

2.1. Hypotheses

As a complex porous medium, different soil structure can be expressed by pore structure and pore size distribution. Generally, scanning electron microscope (SEM) was an effective method to obtain the soil structure and pore characteristics (Figure 1).
In order to better describe the soil freezing process, the following hypotheses were allowed:
(1)
The pores in soil were simplified as spheres with different radii and connected by cylindrical channels with different radii. Moreover, the cylindrical tubes are fully saturated.
(2)
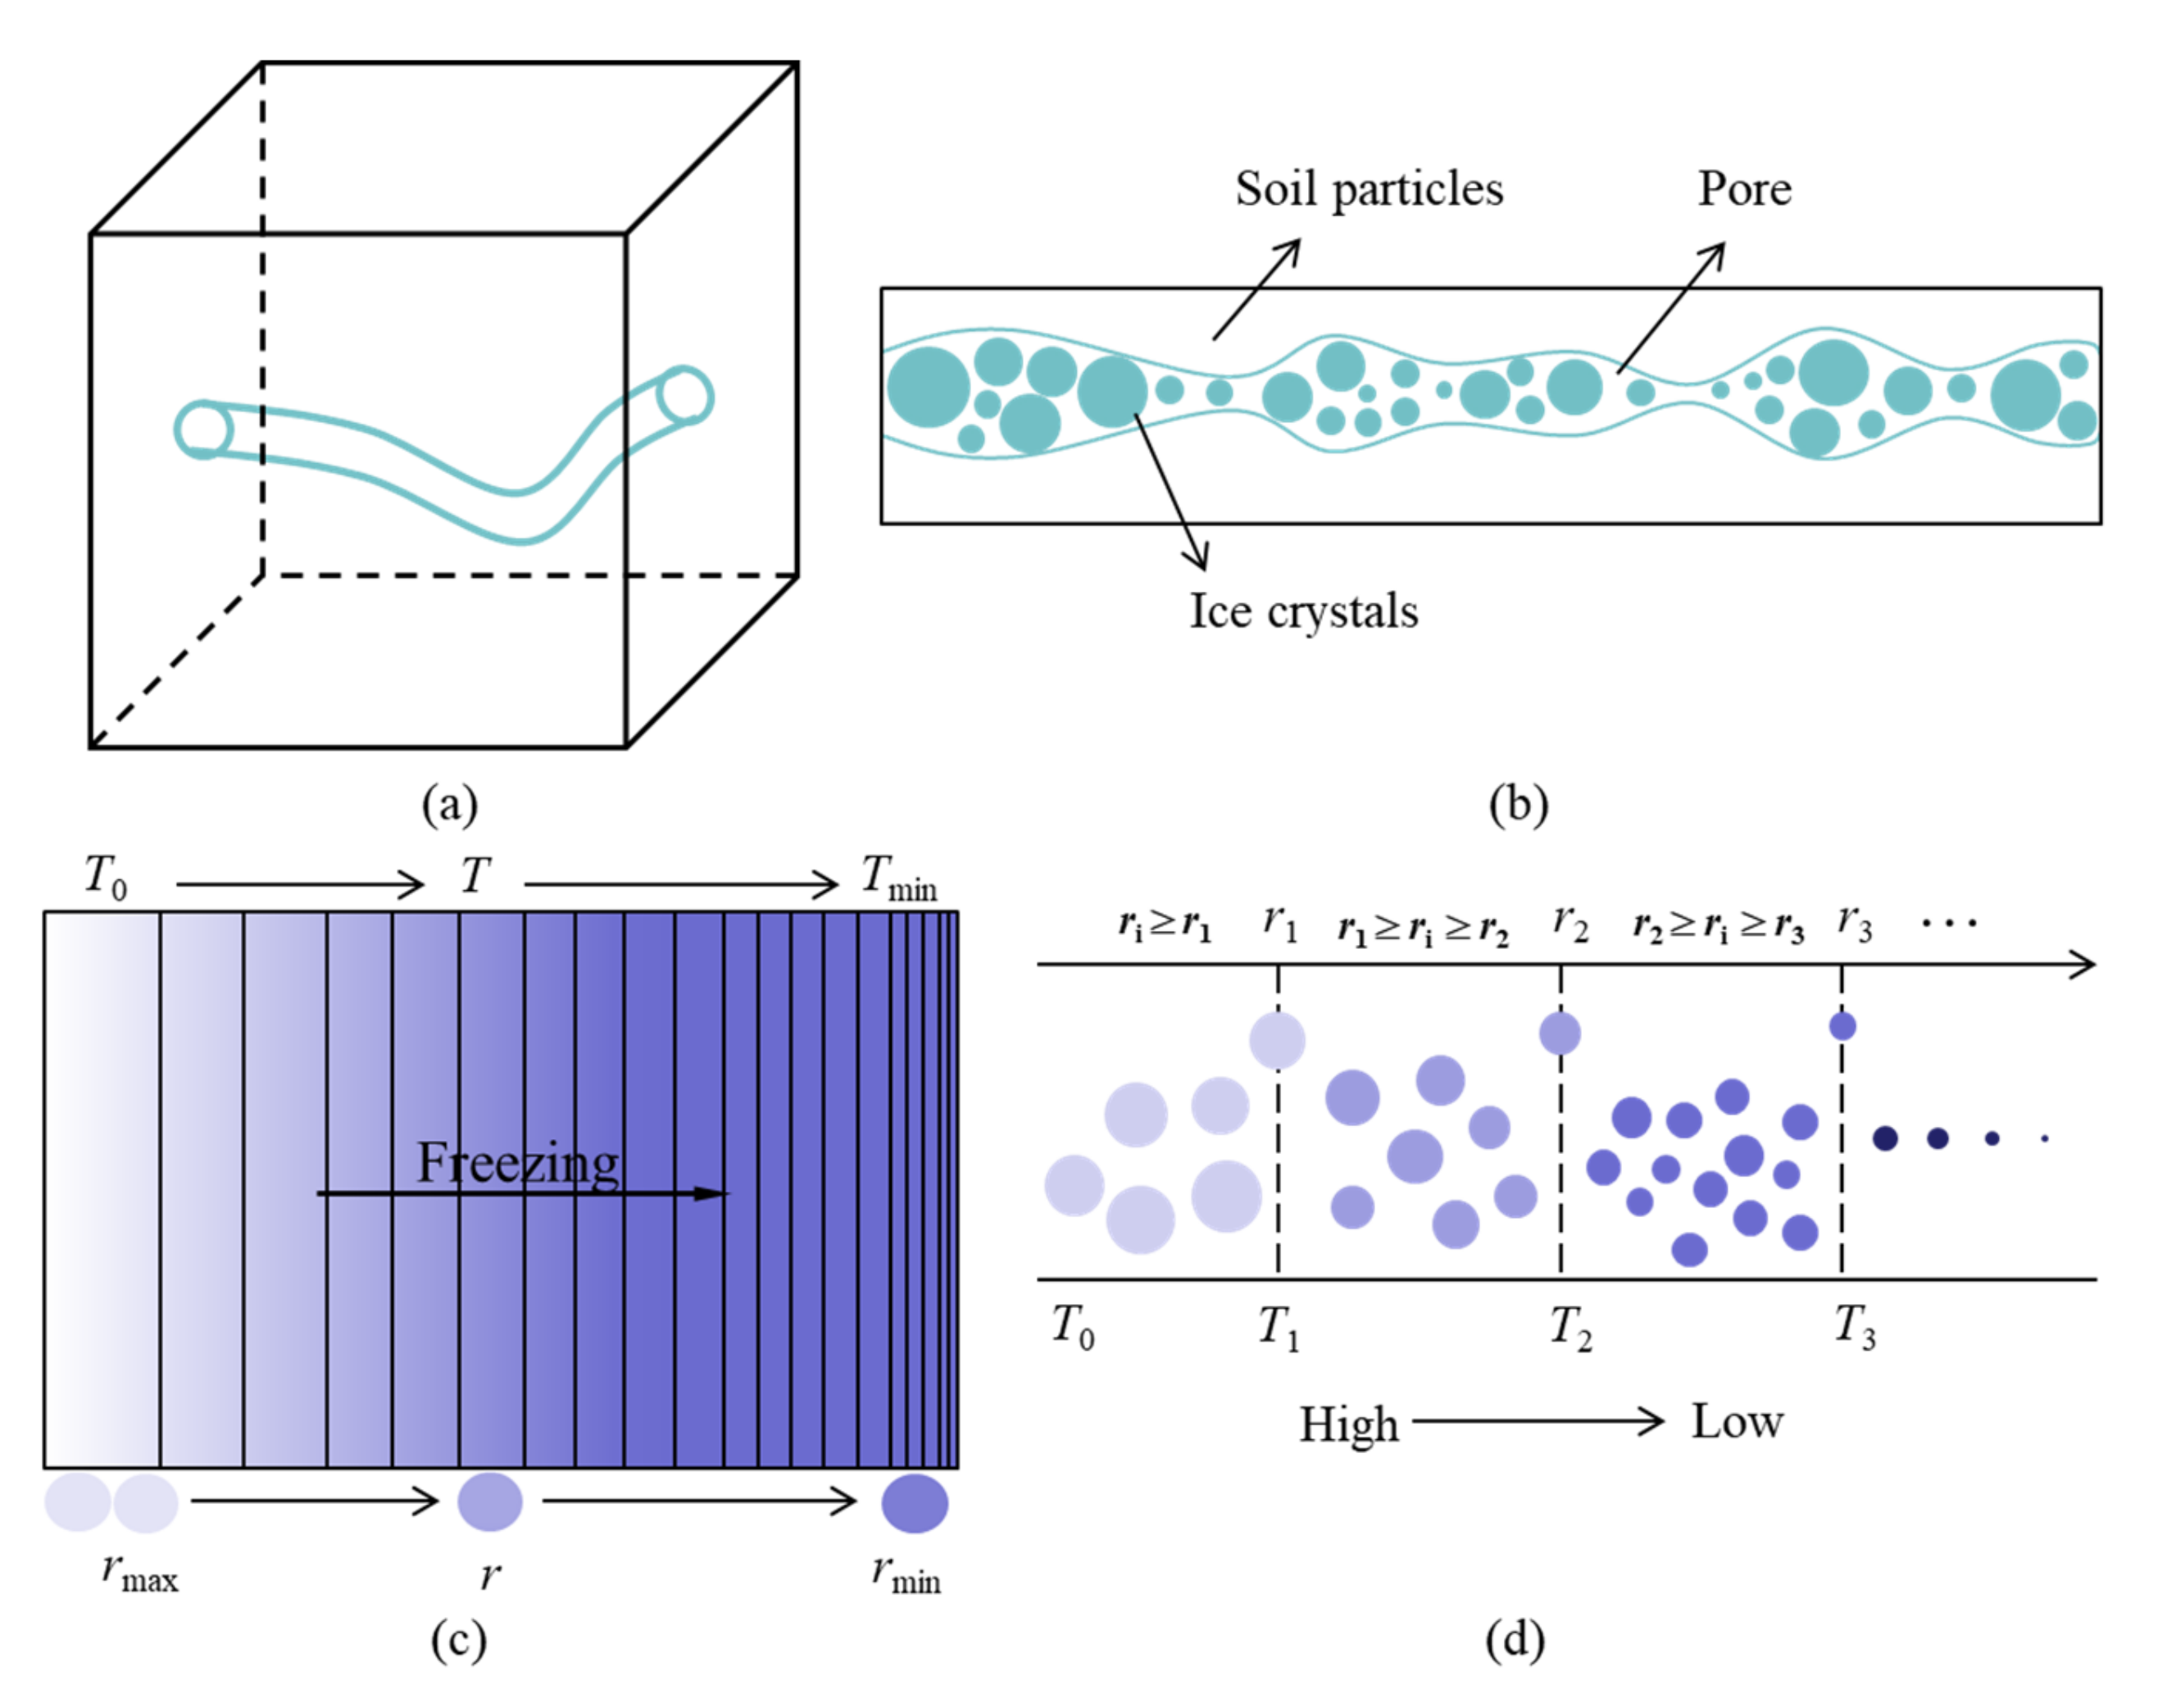
Pores are uniformly distributed in the saturated soil (Figure 2a,b)
(3)
The freezing process started from the pores with larger radius (Figure 2c,d).
(4)
Spherical crystals with different radii are distributed evenly in the pores.
In order to provide a practical way to describe the formation of ice lens, the real structure of soil (Figure 1) was converted into the conceptualized soil structure (Figure 2) based on the bundle of cylindrical capillary (BCC) model.

2.2. Equilibrium of a Single Crystal in a Pore

For small crystals in solution, the pressure on the internal crystal is the sum of the pressure PF generated by the ice/water interface and the pressure Pw of the water, as illustrated in Figure 3 [18,19]. It is supposed that the crystal grows due to the supersaturation of the pore solution. Additionally, in the equilibrium state, there is:
P i = P w + P F

2.2.1. Chemical Equilibrium

The chemical potentials of the water and ice are related to their respective molar volumes and molar entropies. According to the Gibbs–Duhem equation [19]:
d μ w = S w d T + v w d P w d μ i = S i d T + v i d P i
When the water at the equilibrium state, there is μ w = μ i and dPw = dPi; thus:
μ wo = μ io μ w = μ i
If the pressure is applied to the ice, then Equation (8) can be rewritten as with the initial condition of Equation (9):
P w P i d P = T 0 T i S i S w v i d T
where T0 is the temperature at unstressed crystal at pressure Pw; T is the equilibrium temperature under applied pressure Pi.
Rearranging Equation (10) gives:
P i P w = T 0 T Δ S fv d T Δ S fv d T
Δ S fv = S i S w v i ; Δ T = T T 0
where ΔSfv is the entropy of fusion per unit volume of crystal, ΔSfv = 1.2 MPa/K [20].

2.2.2. Growth of the Crystal in the Pore

The capillary pressure inside the crystal is given by Laplace’s equation [21,22,23]:
P i = P w + γ w i κ w i
With crystal growth and dissolution, the surface energy of the crystal will change due to the variation of crystal volume. For crystals formed in water, the surface energy of the crystal is equal to the product of the crystal/liquid surface free energy and the surface area of the crystal (Equation (14)). Meanwhile, the surface energy of the crystal is equal to the work done on the volume increment by the stress P applied by the crystal (Equation (15)). Suppose there is a spherical crystal with radius r, volume V and surface area A in the water, according to the energy principle [24]:
p d V = γ w i d A
p = γ w i d A d V = γ w i d ( 4 π r 2 ) d ( 4 π r 3 / 3 ) = 2 γ w i r
P F = 2 γ w i r

2.2.3. The Crystallization Stress of an Ideal Spherical Crystal

For the pores with the same radius, the relationship between the crystallization pressure p and the mean stress P can be described as [25]:
P = V V V S + V V p = n p
where p is the crystallization pressure; P is the mean stress; VV is the pore volume; Vs is the soil volume and n is the porosity.

2.3. The Crystallization Stress of True Porous Media

The pores in the soil actually have different radii. When the temperature is lower than freezing point, the crystals begin to form in big pores. Once the pores are filled with crystals, the pore wall will suspend further crystal growth. Consequently, the crystal will be subjected to the pressure from the pore wall induced by phase change. Macroscopically, this crystallization pressure is manifested as a pulling force inside the medium [20]. When the sum of the crystallization pressure is greater than the tensile strength of the soil, cracks will be generated in the soil [26,27]. Therefore, it is an important issue to obtain the sum of the crystallization pressures for judging whether the crack is formed or not. To achieve this goal, we introduce the statistical method.
Previous results indicate that the pore sizes have certain probability distribution characteristics [17,28,29]. The distribution function can be expressed as:
f ( r ) = A exp ( r B ) + C
where A, B and C are the fitting parameters. The maximum pore diameter can be estimated by the following equation:
r max = B × ln C A
The total pore volume can be expressed as:
V V = n V = r = 0 r max N r V r
where Nr is the number of pores with radius r. Dividing the total number of pores N on both sides of the Equation (20) gives:
n V N = r = 0 r max N r N V r
The right-hand side of the equation can be expressed as
r = 0 r max N r N V r = 0 r max f ( r ) 4 3 π r 3 d r
Substituting Equation (22) into Equation (21) gives:
N = 3 n V 4 π 0 r max f ( r ) r 3 d r
Substituting Equation (23) into Equation (17), the mean stress can be expressed as
P ( r ) = r i r max 4 3 N π r 3 f ( r ) d r V p ( r )
where ri is the radius between δ and rmax.
Substituting Equation (23) into Equation (24) gives:
P ( r i ) = n 0 r max f ( r ) r 3 d r r i r max f ( r ) r 3 p ( r ) d r
As shown in Equation (25), both the crystallization pressure and the pore size distribution function are the key parameters for determining the mean stress. In this study, the crystallization pressure is obtained from the crystallization theory and the pore distribution function is obtained from the soil freezing characteristic curve.

2.4. Determination of Pore Size Distribution from the Soil Freezing Characteristic Curve

2.4.1. Relationship between Freezing Point and Pore Radius

According to capillary theory, freezing point has a close relationship to pore radius and this relationship can be described by Equation (26) [30]:
T 0 T = T 0 γ w i r L ρ i
where T is the freezing point of the water in the pores with pore radius of r.
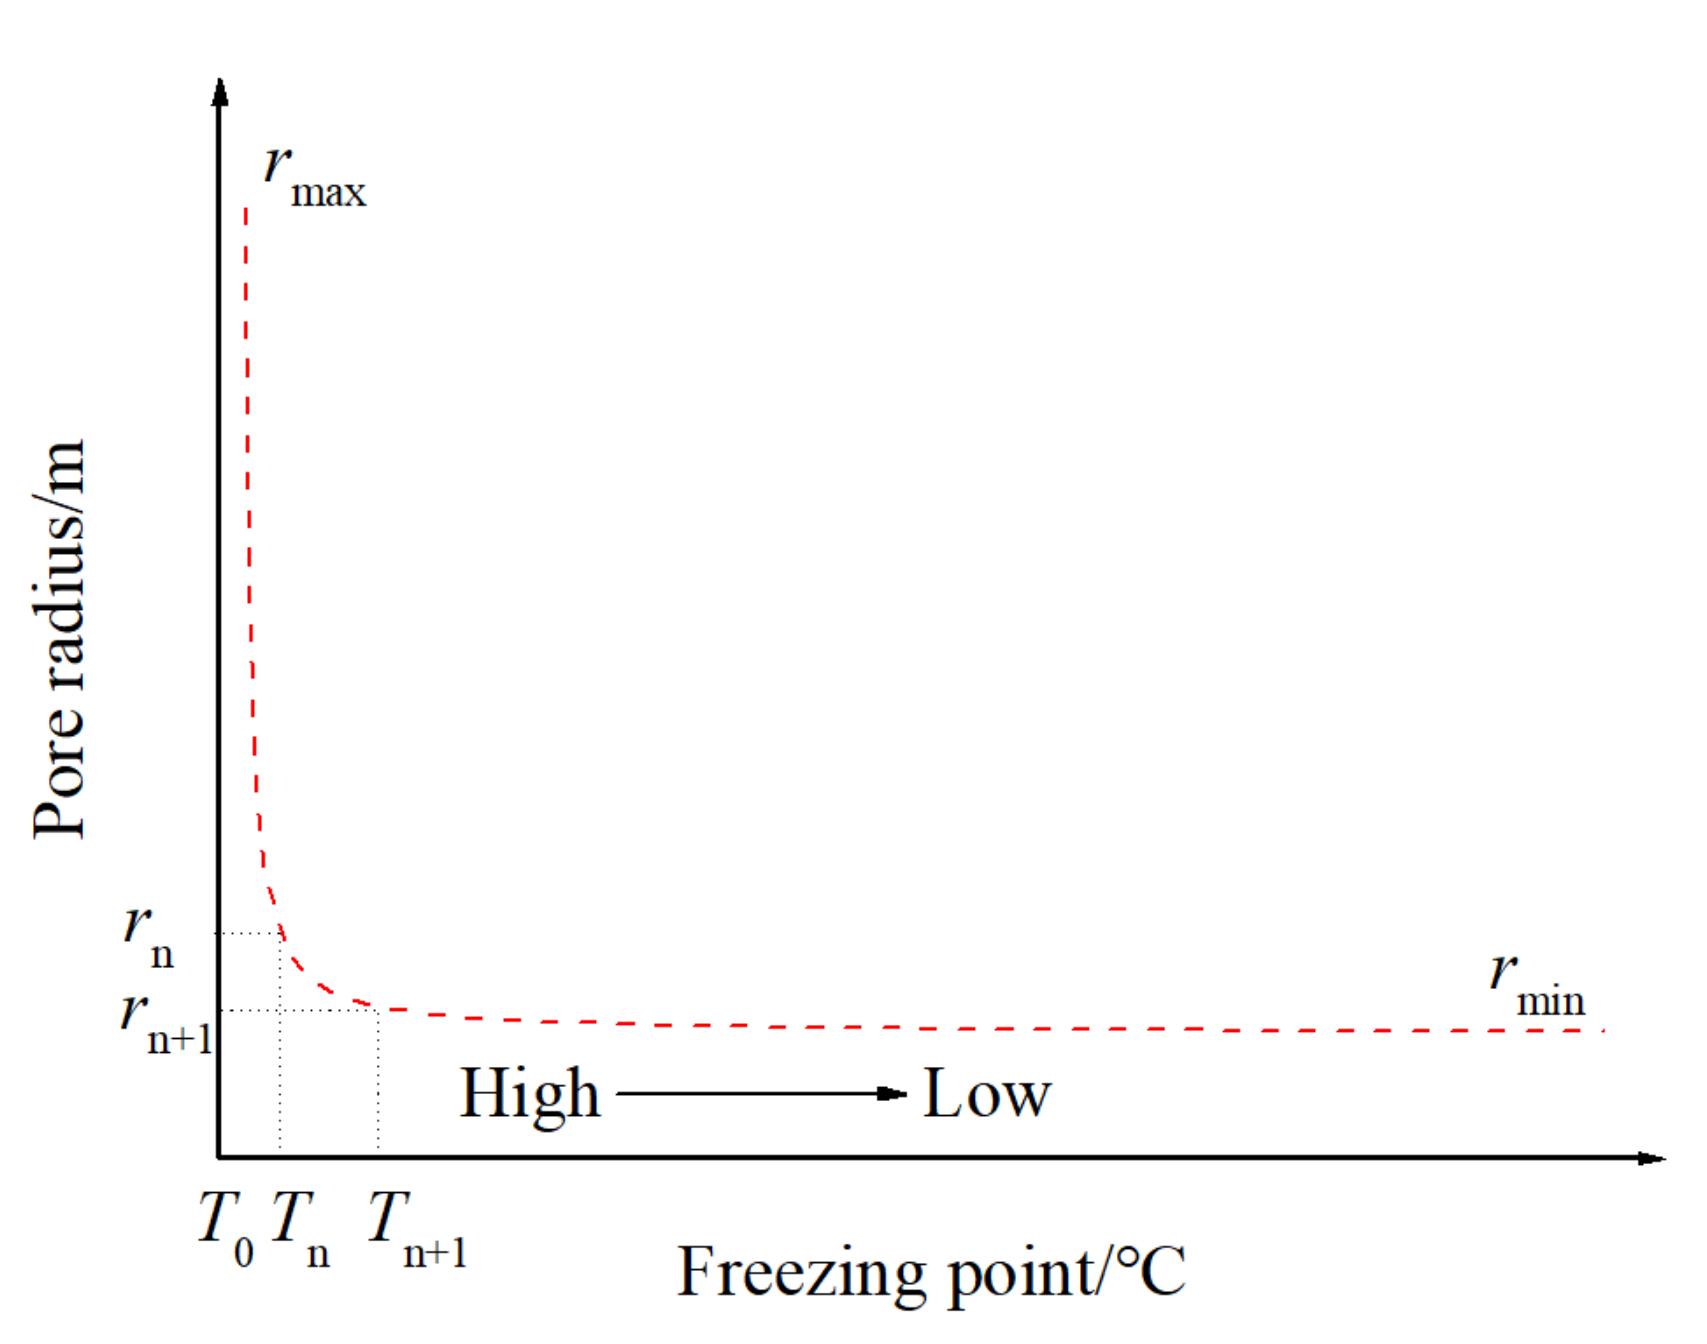
According to Equation (26) and Figure 4, the second hypothesis above is further explained: ice formation occurs in the larger pore first, which corresponds to the highest freezing point.

2.4.2. Determination of Pore Size Distribution from the Unfrozen Water Content

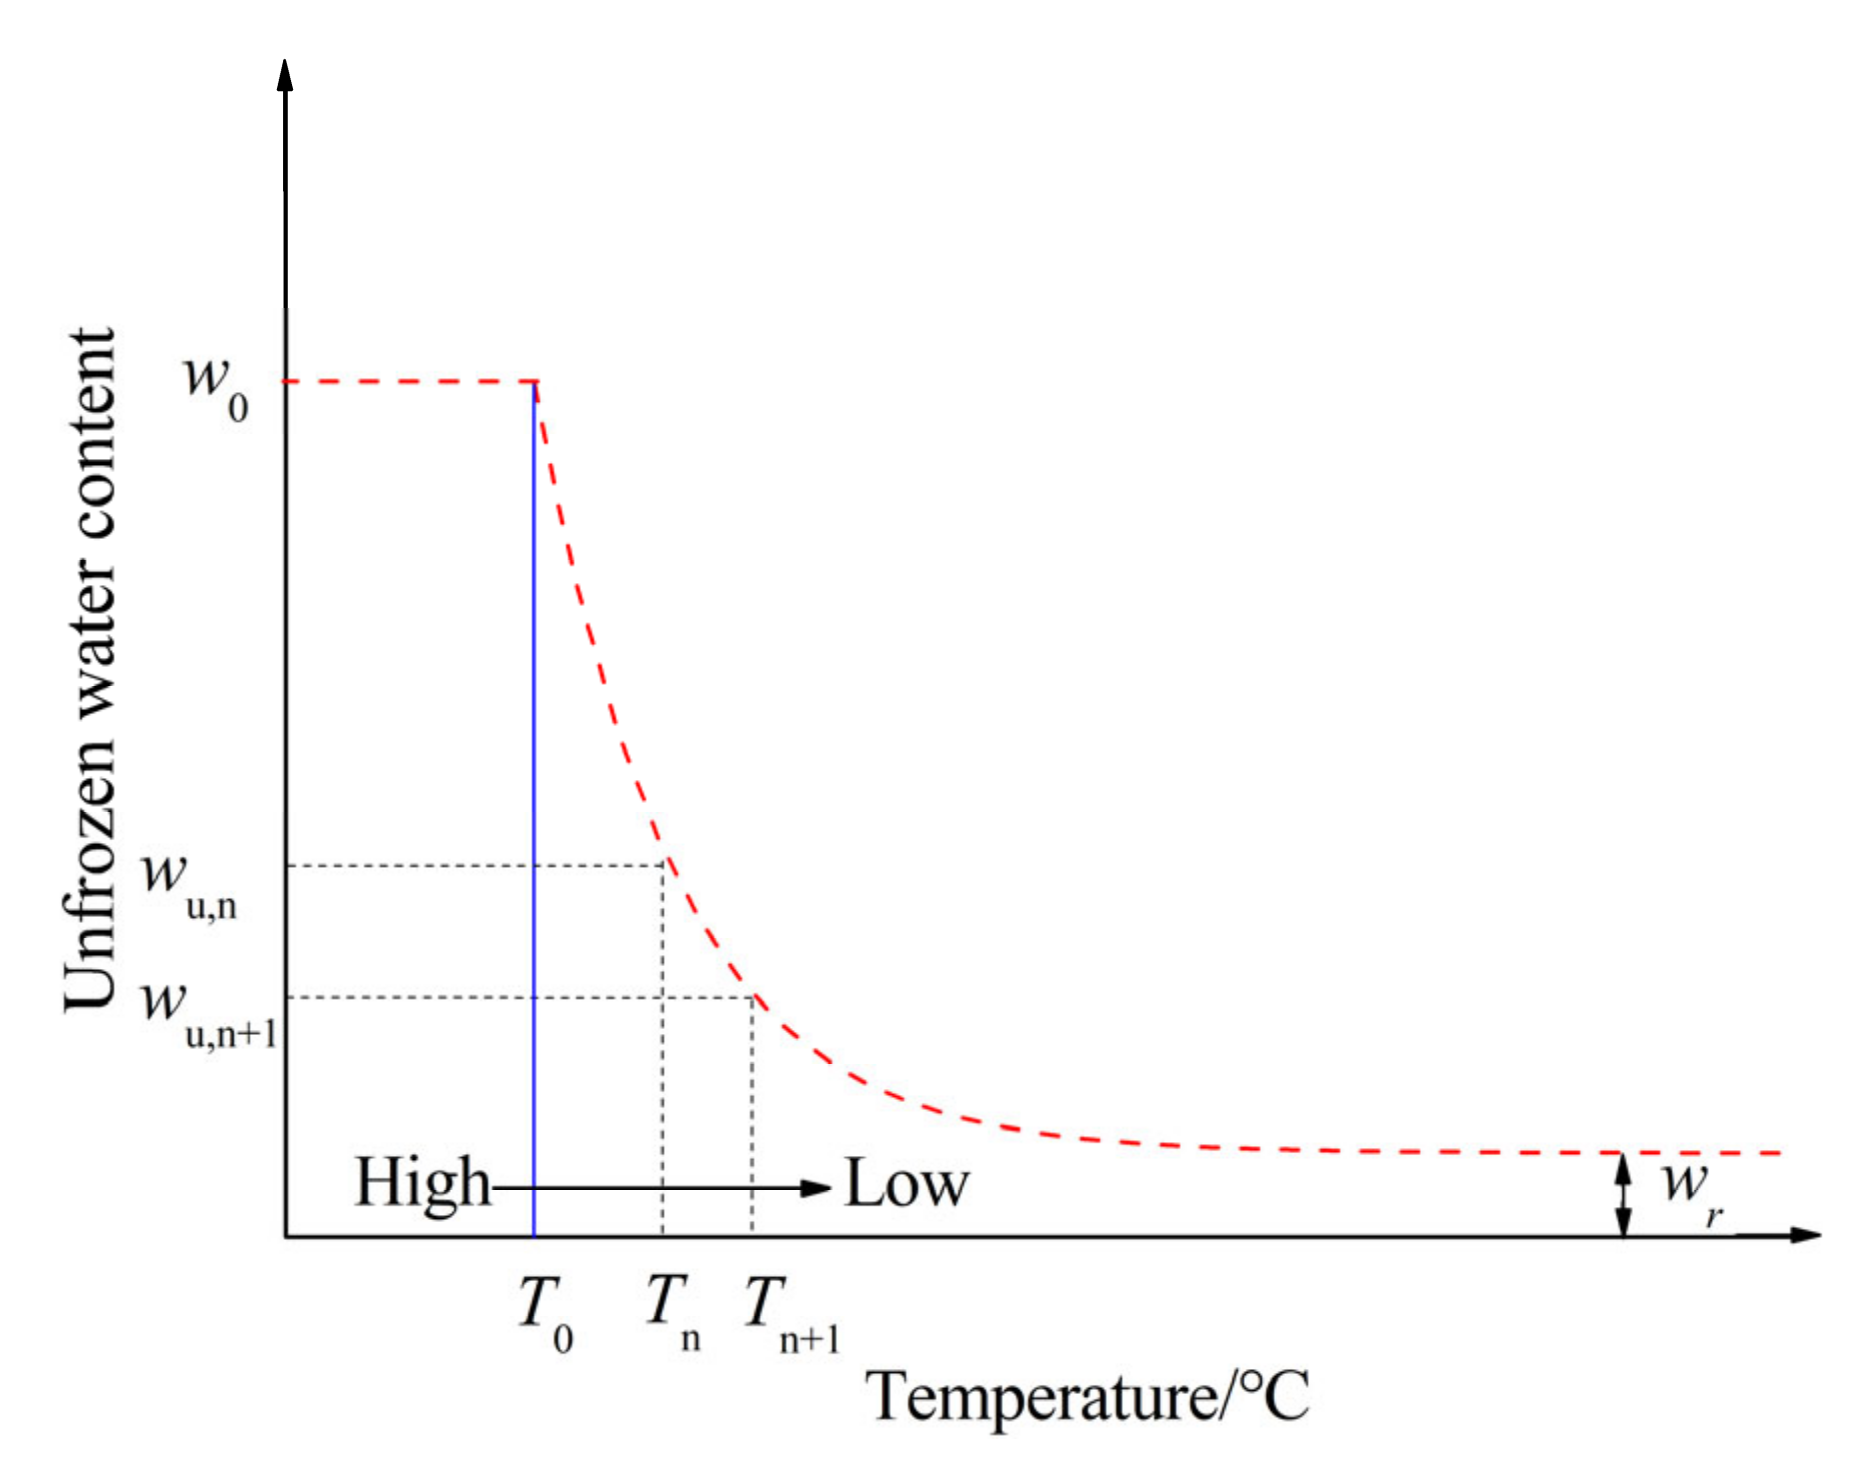
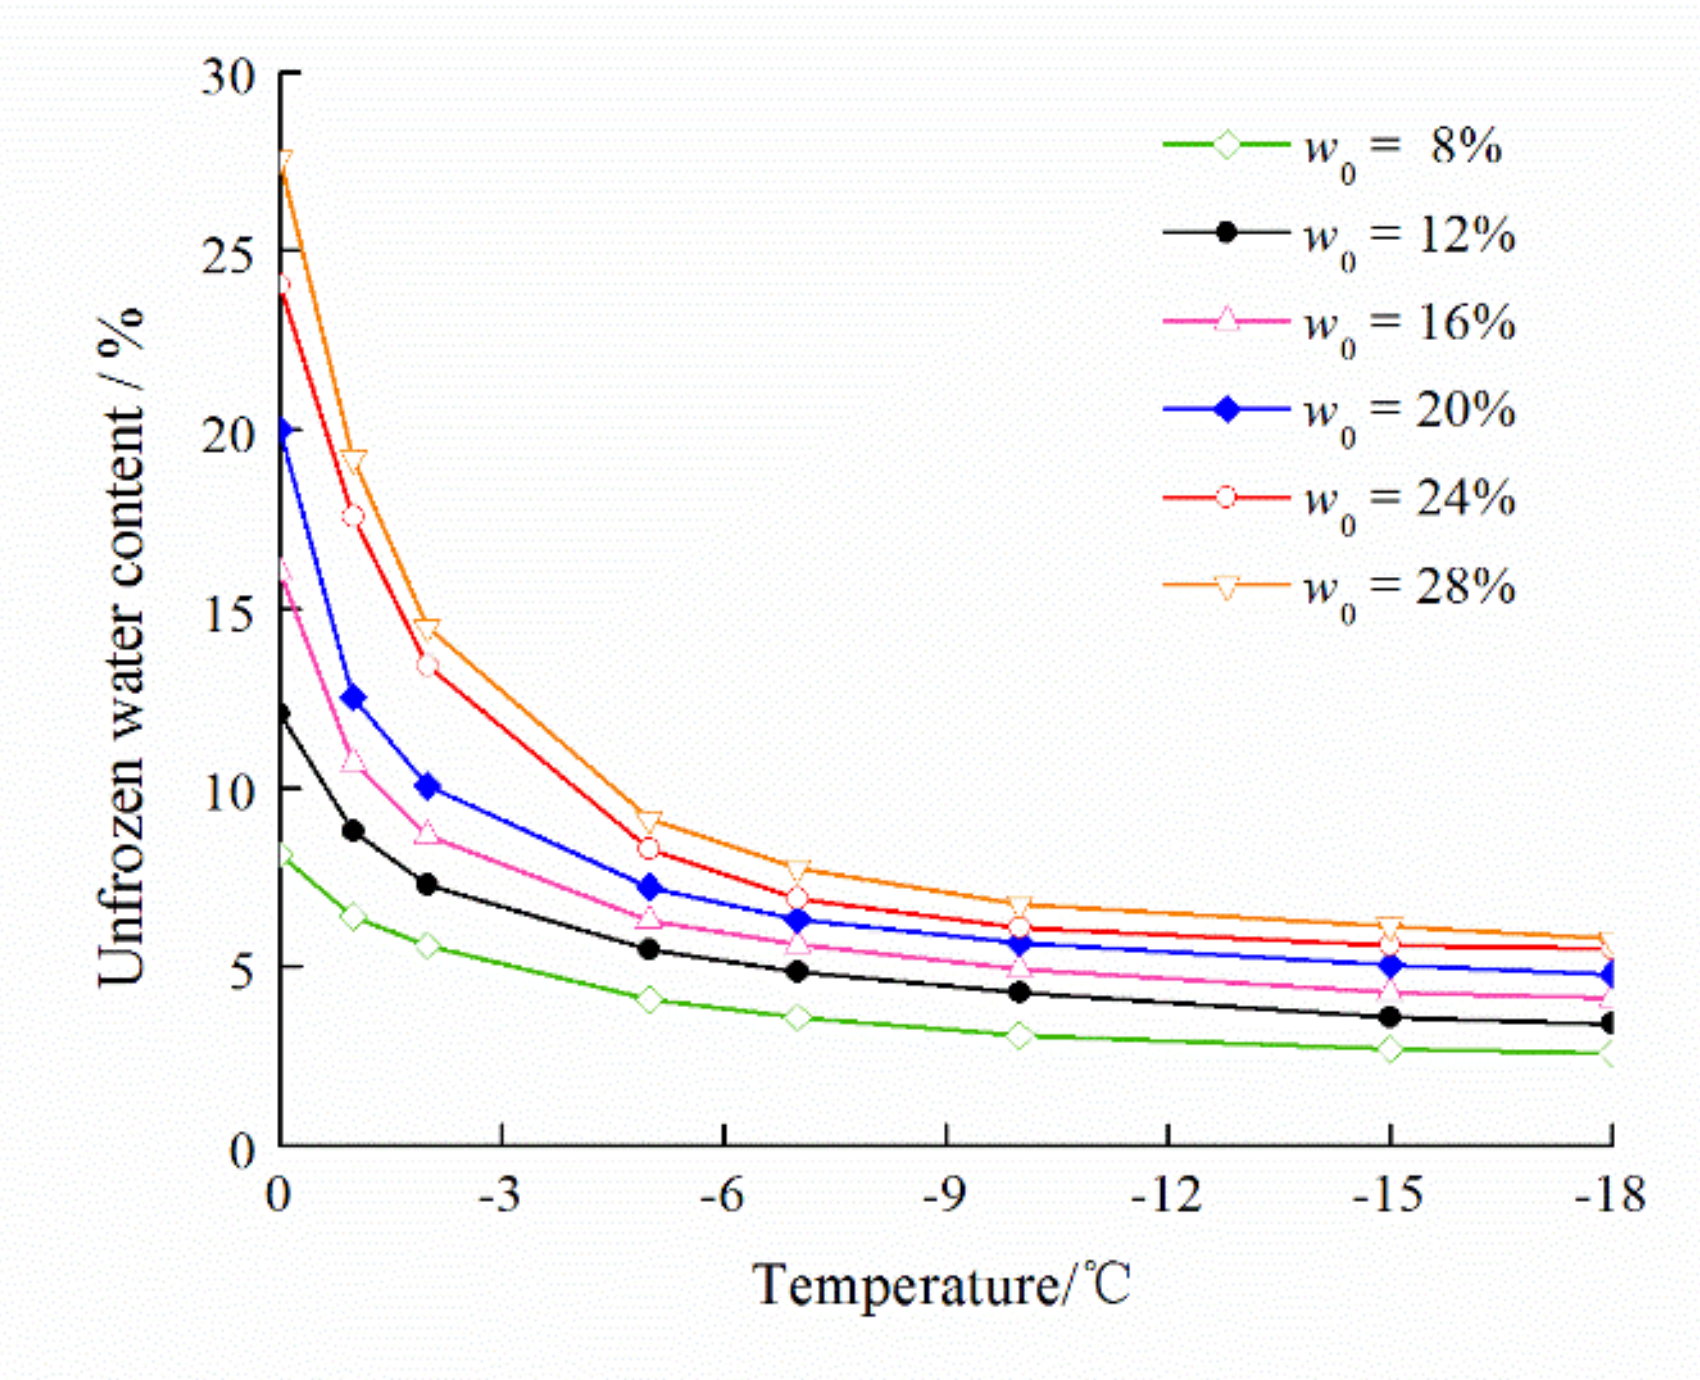
The soil freezing characteristic curve is used to describe the relationship between unfrozen water content and temperature [31]. As shown in Figure 5, unfrozen water content decreases with dropping temperature.
When T is higher than T0, the unfrozen water content wu equals the initial unfrozen water content w0 at the temperature T0 and ice is absent in the system. When T is lower than T0, water phase change results in decreasing unfrozen water content and increasing ice content. According to the conservation of mass, the increment of ice content is equal to the reduction of unfrozen water content. Therefore, the following formula can be obtained:
Δ V i = Δ w u ρ i = w u , n ( T n ) w u , n + 1 ( T n + 1 ) ρ i
where ΔVi is the change of the ice volume and Δwu is the change of the unfrozen water content.
From Equation (26), the variation of ice crystal radius can be calculated using the following equation:
Δ r pore = r ( T n ) + δ r ( T n + 1 ) + δ = r ( T n ) r ( T n + 1 ) = T 0 γ w i L ρ i ( Δ T ( T 0 T n ) ( T 0 T n + 1 ) )
where ΔT = TnTn+1 and δ is the thickness of the water layer adsorbed on the pore surface. When Δrpore is very small, rm is selected to represent the average radius in the temperature range ( T n T n + 1 ),
r m = r n Δ r pore 2 = r n T 0 γ w i 2 L ρ i Δ T ( T 0 T n ) ( T 0 T n + 1 )
Therefore, in the temperature range ( T n T n + 1 ), the number (Nrm) of pores with radius (rm) can be obtained by the following equation,
N rm = Δ V i V rm = w u , n ( T n ) w u , n + 1 ( T n + 1 ) ρ i 4 3 π ( r m ) 3 = 3 w u , n ( T n ) w u , n + 1 ( T n + 1 ) 4 π ρ i r n T 0 γ w i 2 L ρ i Δ T ( T 0 T n ) ( T 0 T n + 1 ) 3

2.5. Formation of Ice Lens

When water flows toward the freezing front, it will be frozen directionally and forms a layer of segregation ice [32,33,34,35,36]. Scholars proposed a large number of theoretical models for describing the formation of ice lens. Through the comparative analysis of the criteria of ice lens formation, it can be seen that the mechanical criterions of ice lens formation have two components: driving force for promoting the formation of ice lens and constraining force for preventing the formation of ice lens. When the driving force equals or exceeds the constraining force, the connection between soil particles will be broken, and a new ice lens will be generated. This criterion can be expressed in a generic form:
σ por σ R
where σ por is the driving force of ice lens formation and σ R is constraining force of ice lens formation.
Gilpin [11] and Nixon [37] believed that a new ice lens was formed when the ice pressure equaled or exceeded the sum of the overburden pressure and the separation pressure. He et al. [38] showed that a new ice lens forms when the pore water pressure equals or exceeds the sum the effective pressure and cohesive force. Zhang [39] shows that the driving force of the ice lens formation generally includes pore water pressure, pore ice pressure, pore pressure, unfrozen water film pressure, and so on. However, the formation mechanisms of these different pressures are not well understood.

2.5.1. Driving Force of Ice Lens Formation

In the previous section, the crystallization pressure generated by a single crystal in porous medium has been discussed. Through analysis we realized that the driving force of soil failure was the crystallization pressure. The crystallization pressure in a single pore did not indicate whether cracks will grow, but this crystallization pressure can be treated as part of the mean stress which destroys the pore matrix. Therefore, we adopt mean stress as the driving force of ice lens formation,
σ por = P ( r i )

2.5.2. Constraining Force of Ice Lens Formation

Wu et al. [40] pointed out that the constraining force of the ice lens formation is mainly composed of the external constraining force (such as, overburden pressure) and the internal constraining force (such as cohesive, tensile stress), which can be expressed as,
σ R = σ ex + σ in
where σR is the total constraining force; σex is the external constraining force and σin is the internal constraining force. When the sample has no external load, the constraining force depends on the tensile stress of the soil. Equation (33) can be rewritten as:
σ R = σ t

2.5.3. The New Criterion of Ice Lens Formation

When the driving force exceeds the tensile stress of the soil, the internal crack in the soil will occur. With the continuous action of the driving force, the soil will continue to form cracks. In other words, whether the ice lens is formed or not is determined by the relationship between mean stress and tensile stress. Consequently, a new criterion of ice lens formation was proposed as,
P ( r i ) σ t
where P(ri) is the mean stress. For the sample without overburden pressure, if the driving force is greater than the tensile stress, the soil skeleton will be broken and the ice lens generated.

3. Experiment Design

3.1. Experiment Materials

Lanzhou loess was used in this study. The particle size distribution is shown in Figure 6 and the basic physical parameters are shown in Table 1. Distilled water was used to prepare soil samples. The samples were prepared with different mass water contents, from 8%, 12%, 16%, 20%, 24% to 28%. In order to obtain a homogenized state, the soil samples were arranged in the soil sample box for 24 h. Finally, the soil sample was put into the automatic temperature control refrigerator for testing.

3.2. Experiment Methods

3.2.1. Unfrozen Water Content

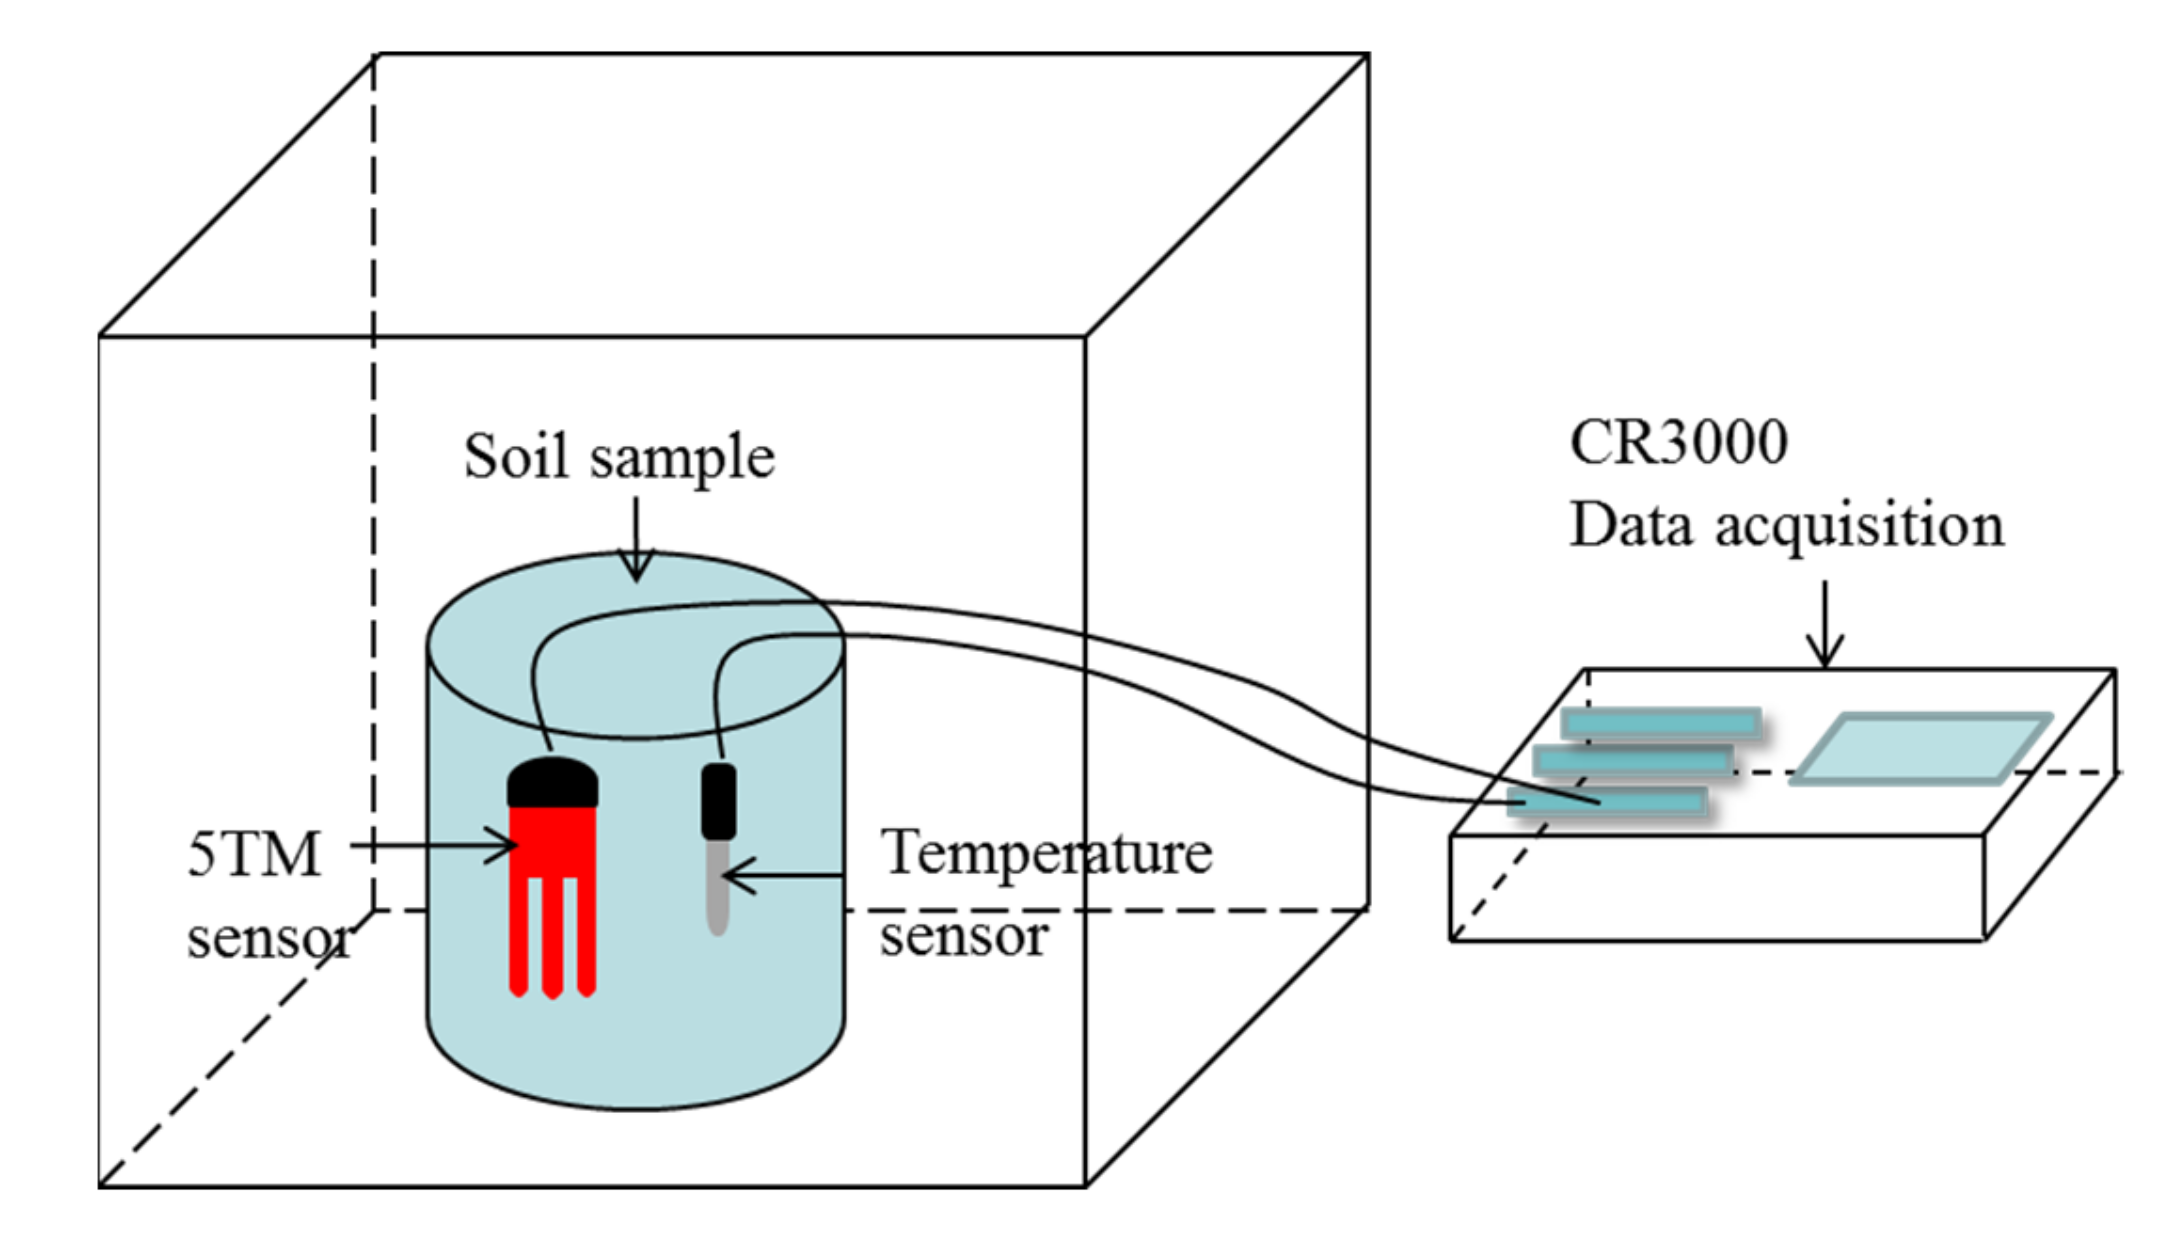
The schematic of the unfrozen water content test apparatus is shown in Figure 7. As can be seen, an automatic temperature control refrigerator, thermostat, CR3000 data acquisition instrument, 5 TM sensor and temperature probe were used in the test. The temperature range was −40 to 60 °C, with an accuracy of ±0.1 °C. The temperature probe with an accuracy of ±0.05 °C was used to measure the soil temperature. The test principle of 5 TM sensors is through the measurement of the dielectric constant to reflect the variation of the unfrozen water content. The following equation is the conversion of unfrozen water content and dielectric constant:
θ u = 4.3 × 10 6 ε a 3 5.5 × 10 4 ε a 2 + 2.92 × 10 2 ε a 5.3 × 10 2
w u = θ u ρ d
where θu is the volume unfrozen water content; wu is the mass unfrozen water content; εa is the dielectric constant and ρd is the dry density of soil.
The initial test conditions were listed in Table 2. In the closed system experiments, there is no water supply during the freezing process.

3.2.2. Tensile Strength

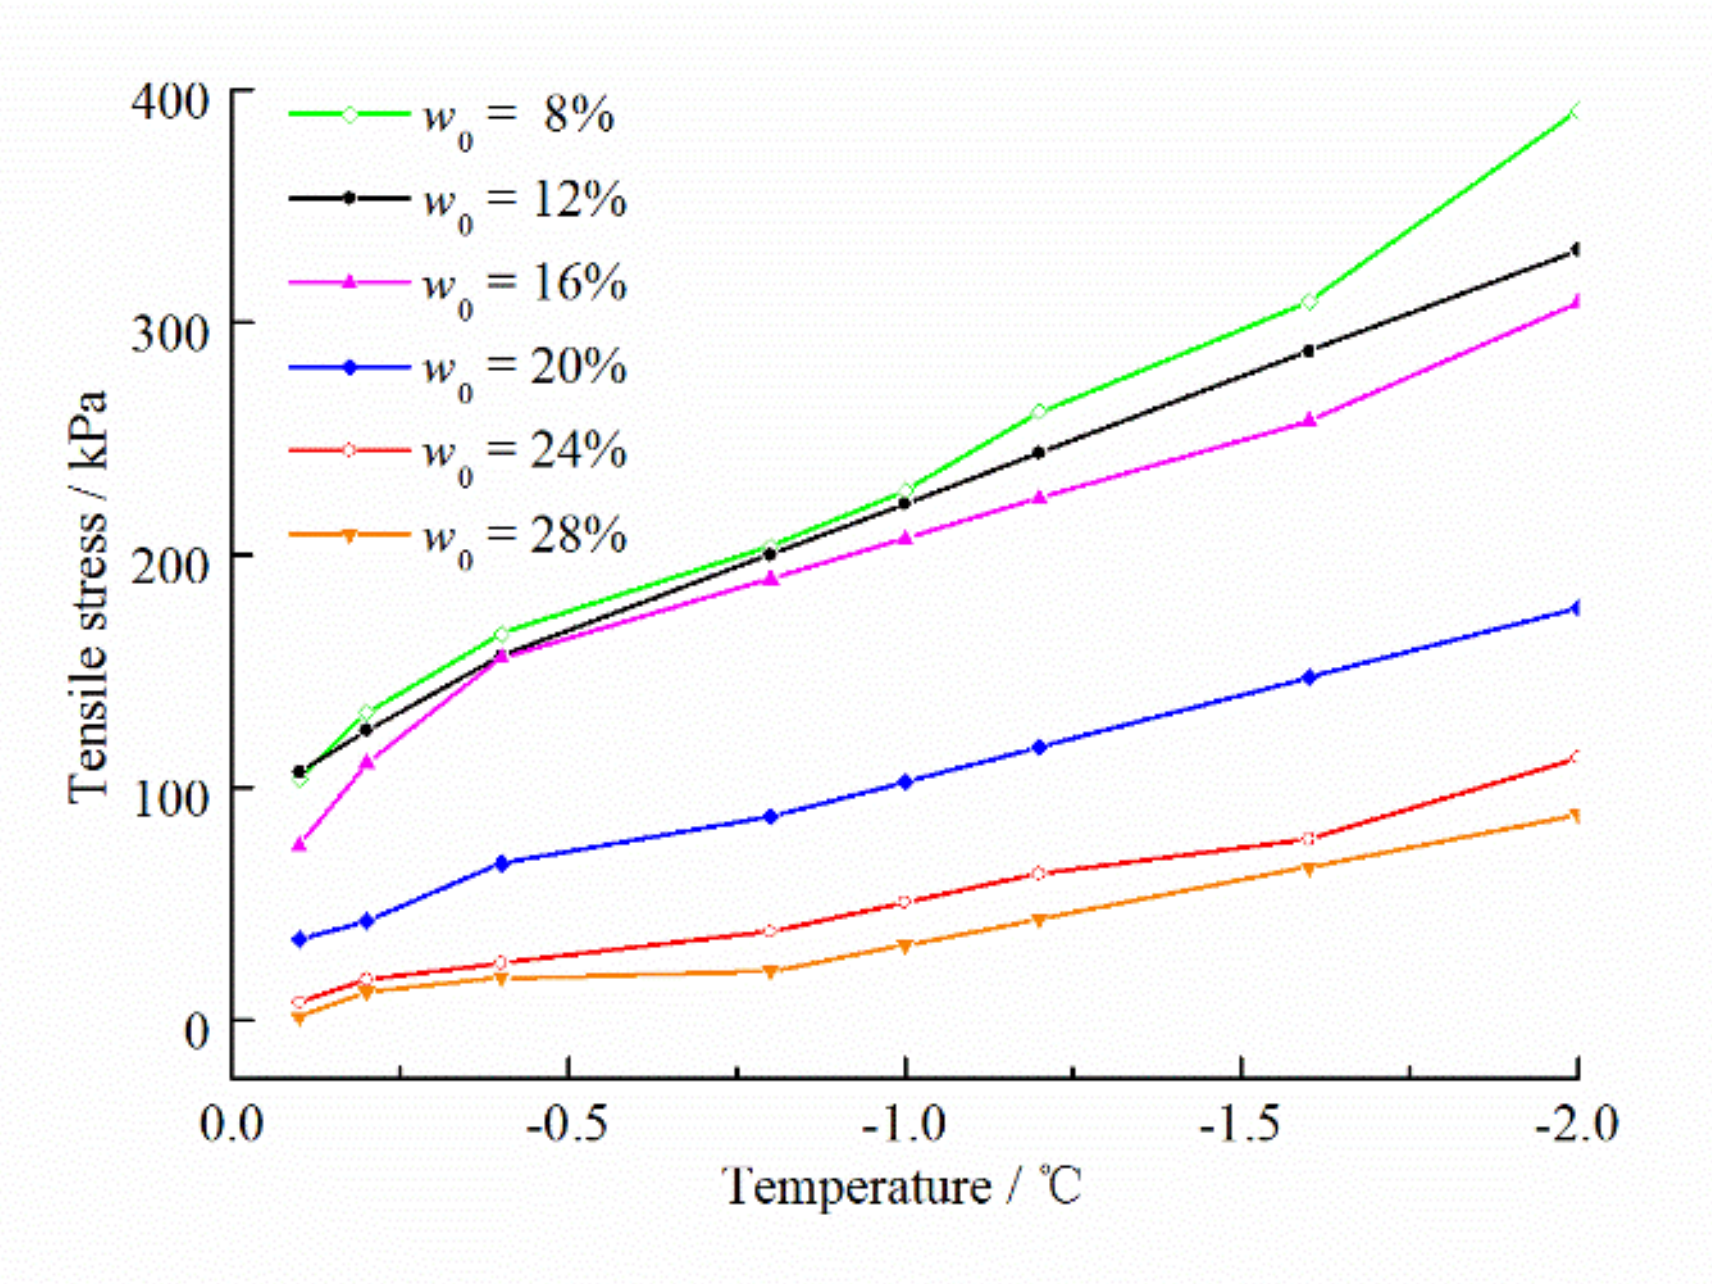
According to Equation (35), tensile strength is an important parameter for determining whether ice lenses are produced. In this study, the Brazilian splitting method (radial-splitting method) was used to determine the tensile strength of the loess sample (diameter: 61.8 mm; height: 61.8 mm; the initial water content: 8%, 12%, 16%, 20%, 24%, and 28%). The test temperature range is from 0 to −2 °C. The loading rate is 0.618 mm/min and the accuracy of the temperature is ±0.1 °C. The test apparatus is presented in Figure 8.
In the radial-splitting method, the tensile strength can be calculated as follows:
σ t = 2 P π d l
where σ t is the tensile strength; P is the peak load; d is diameter of soil sample and l is height of soil sample.

4. Results and Discussions

4.1. Unfrozen Water Content

Figure 9 gives the relationship between the unfrozen water content and temperature. As shown, the unfrozen water content of the soil samples with different initial water content changes similarly to the temperature and decreases with the decrease of temperature in the freezing process. In the early stage of freezing (0 to −2 °C), the unfrozen water content of the soil sample with a high initial water content changes earlier than that of the soil sample with a low initial water content. The main reason is that water in the large pores has been frozen in this temperature range, and the free water content of soil samples with high initial water content is higher, so the change is faster. When the temperature is basically constant (−16 to −18 °C), the unfrozen water content of soil samples with different initial water content tends to be stable, the difference of residual unfrozen water content is smaller, within the range of 3%–6%. However, the unfrozen water content of soil samples with larger initial water content is still larger than that of soil samples with smaller initial water content, but the correlation decreases, indicating that the influence of initial water content is weakened.

4.2. Pore Size Distribution

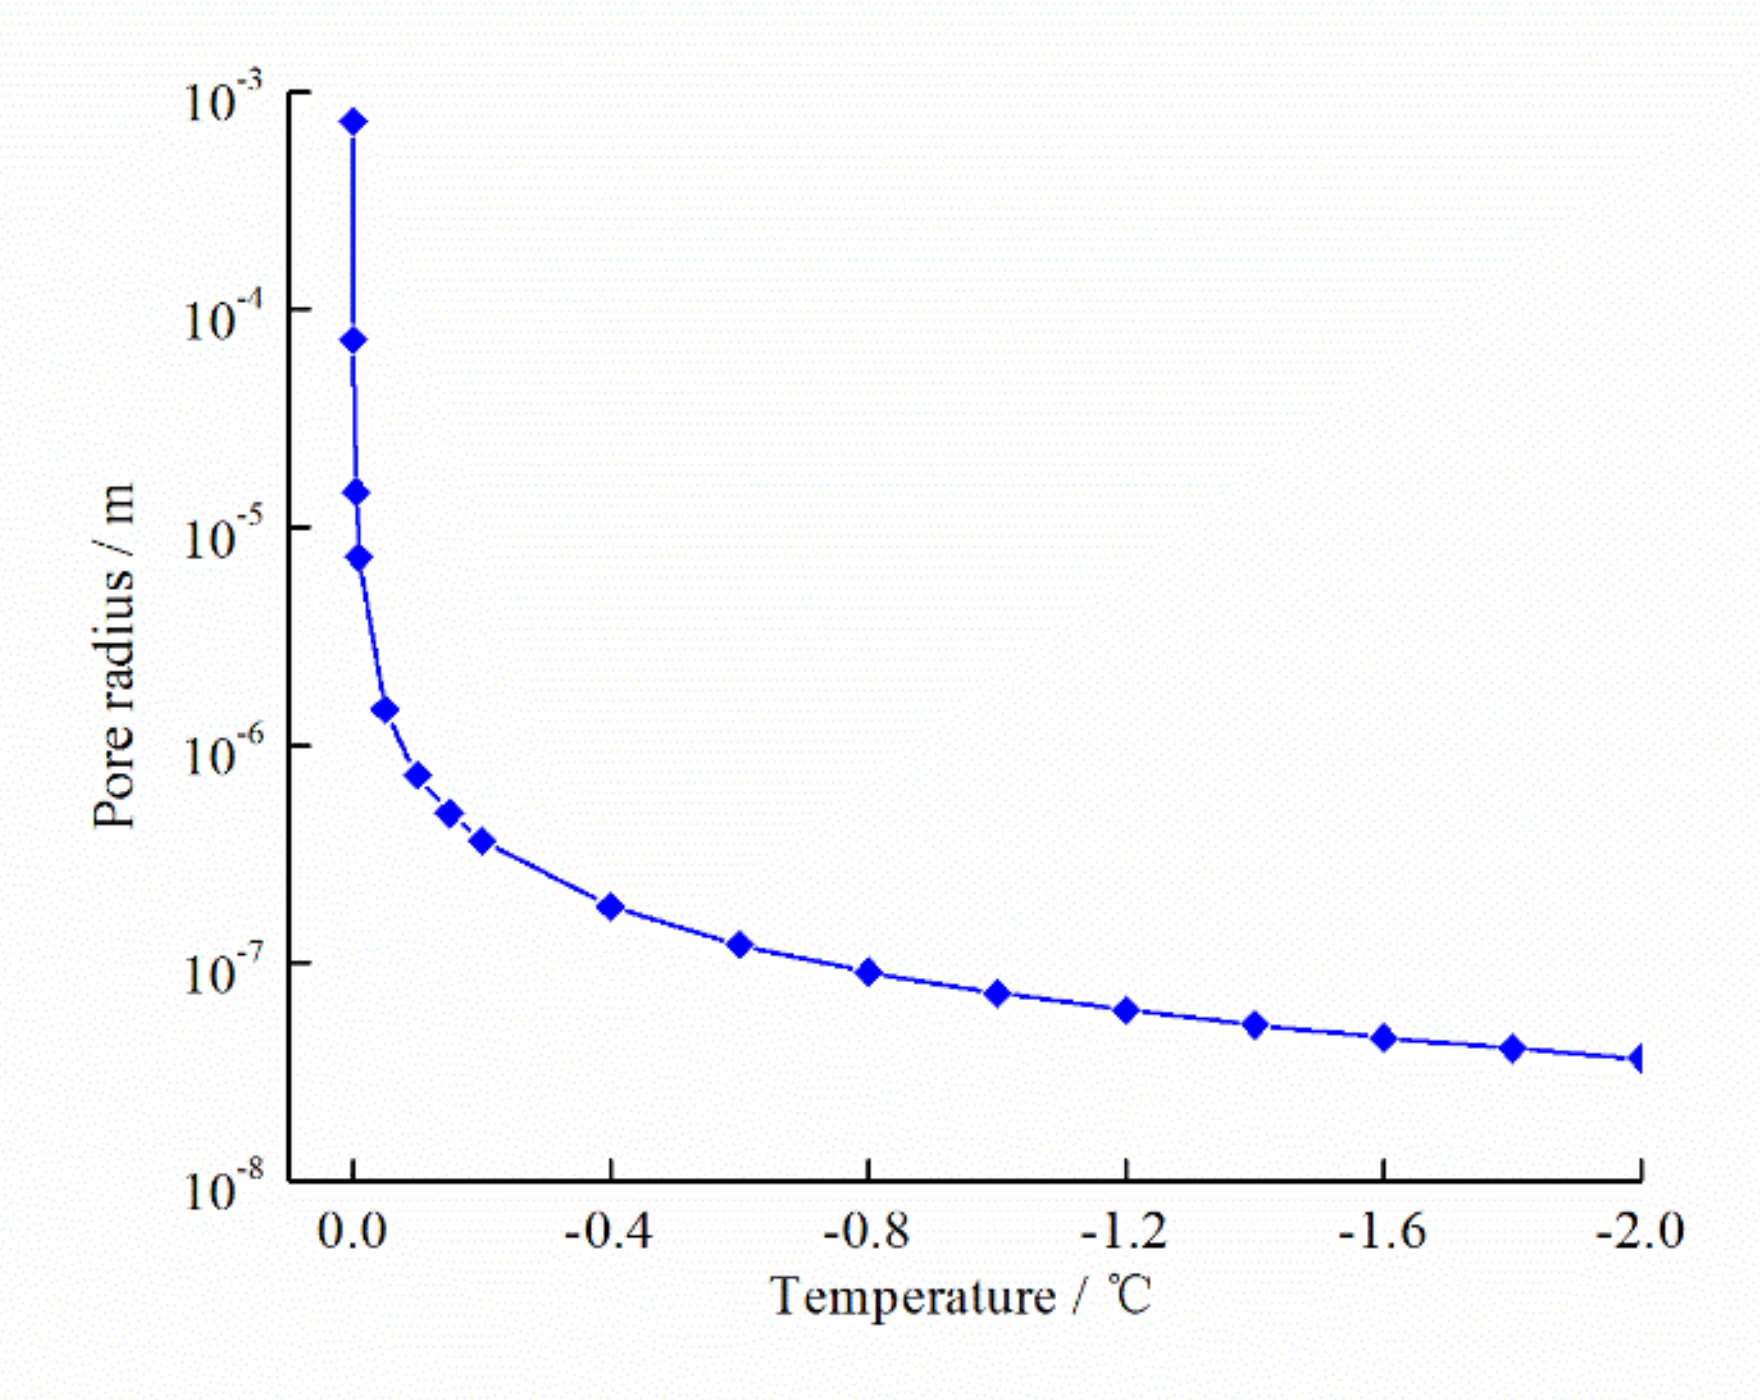
In a closed system, frost heave is caused by the water-ice phase change. According to Equation (26) and Figure 2d, the relationship between crystal radius and temperature in Figure 10 is obtained. Previous studies indicated that the segregate temperature of ice lens was in the range of 0 to −2 °C [41,42,43]. Therefore, only the pore radius in the temperature range of 0 to −2 °C is calculated. The result shows that the crystal radius decreases gradually with the decrease in temperature. Meanwhile, the radius is in the range of 3.84 × 10⁻⁸–7.28 × 10⁻⁴ m.
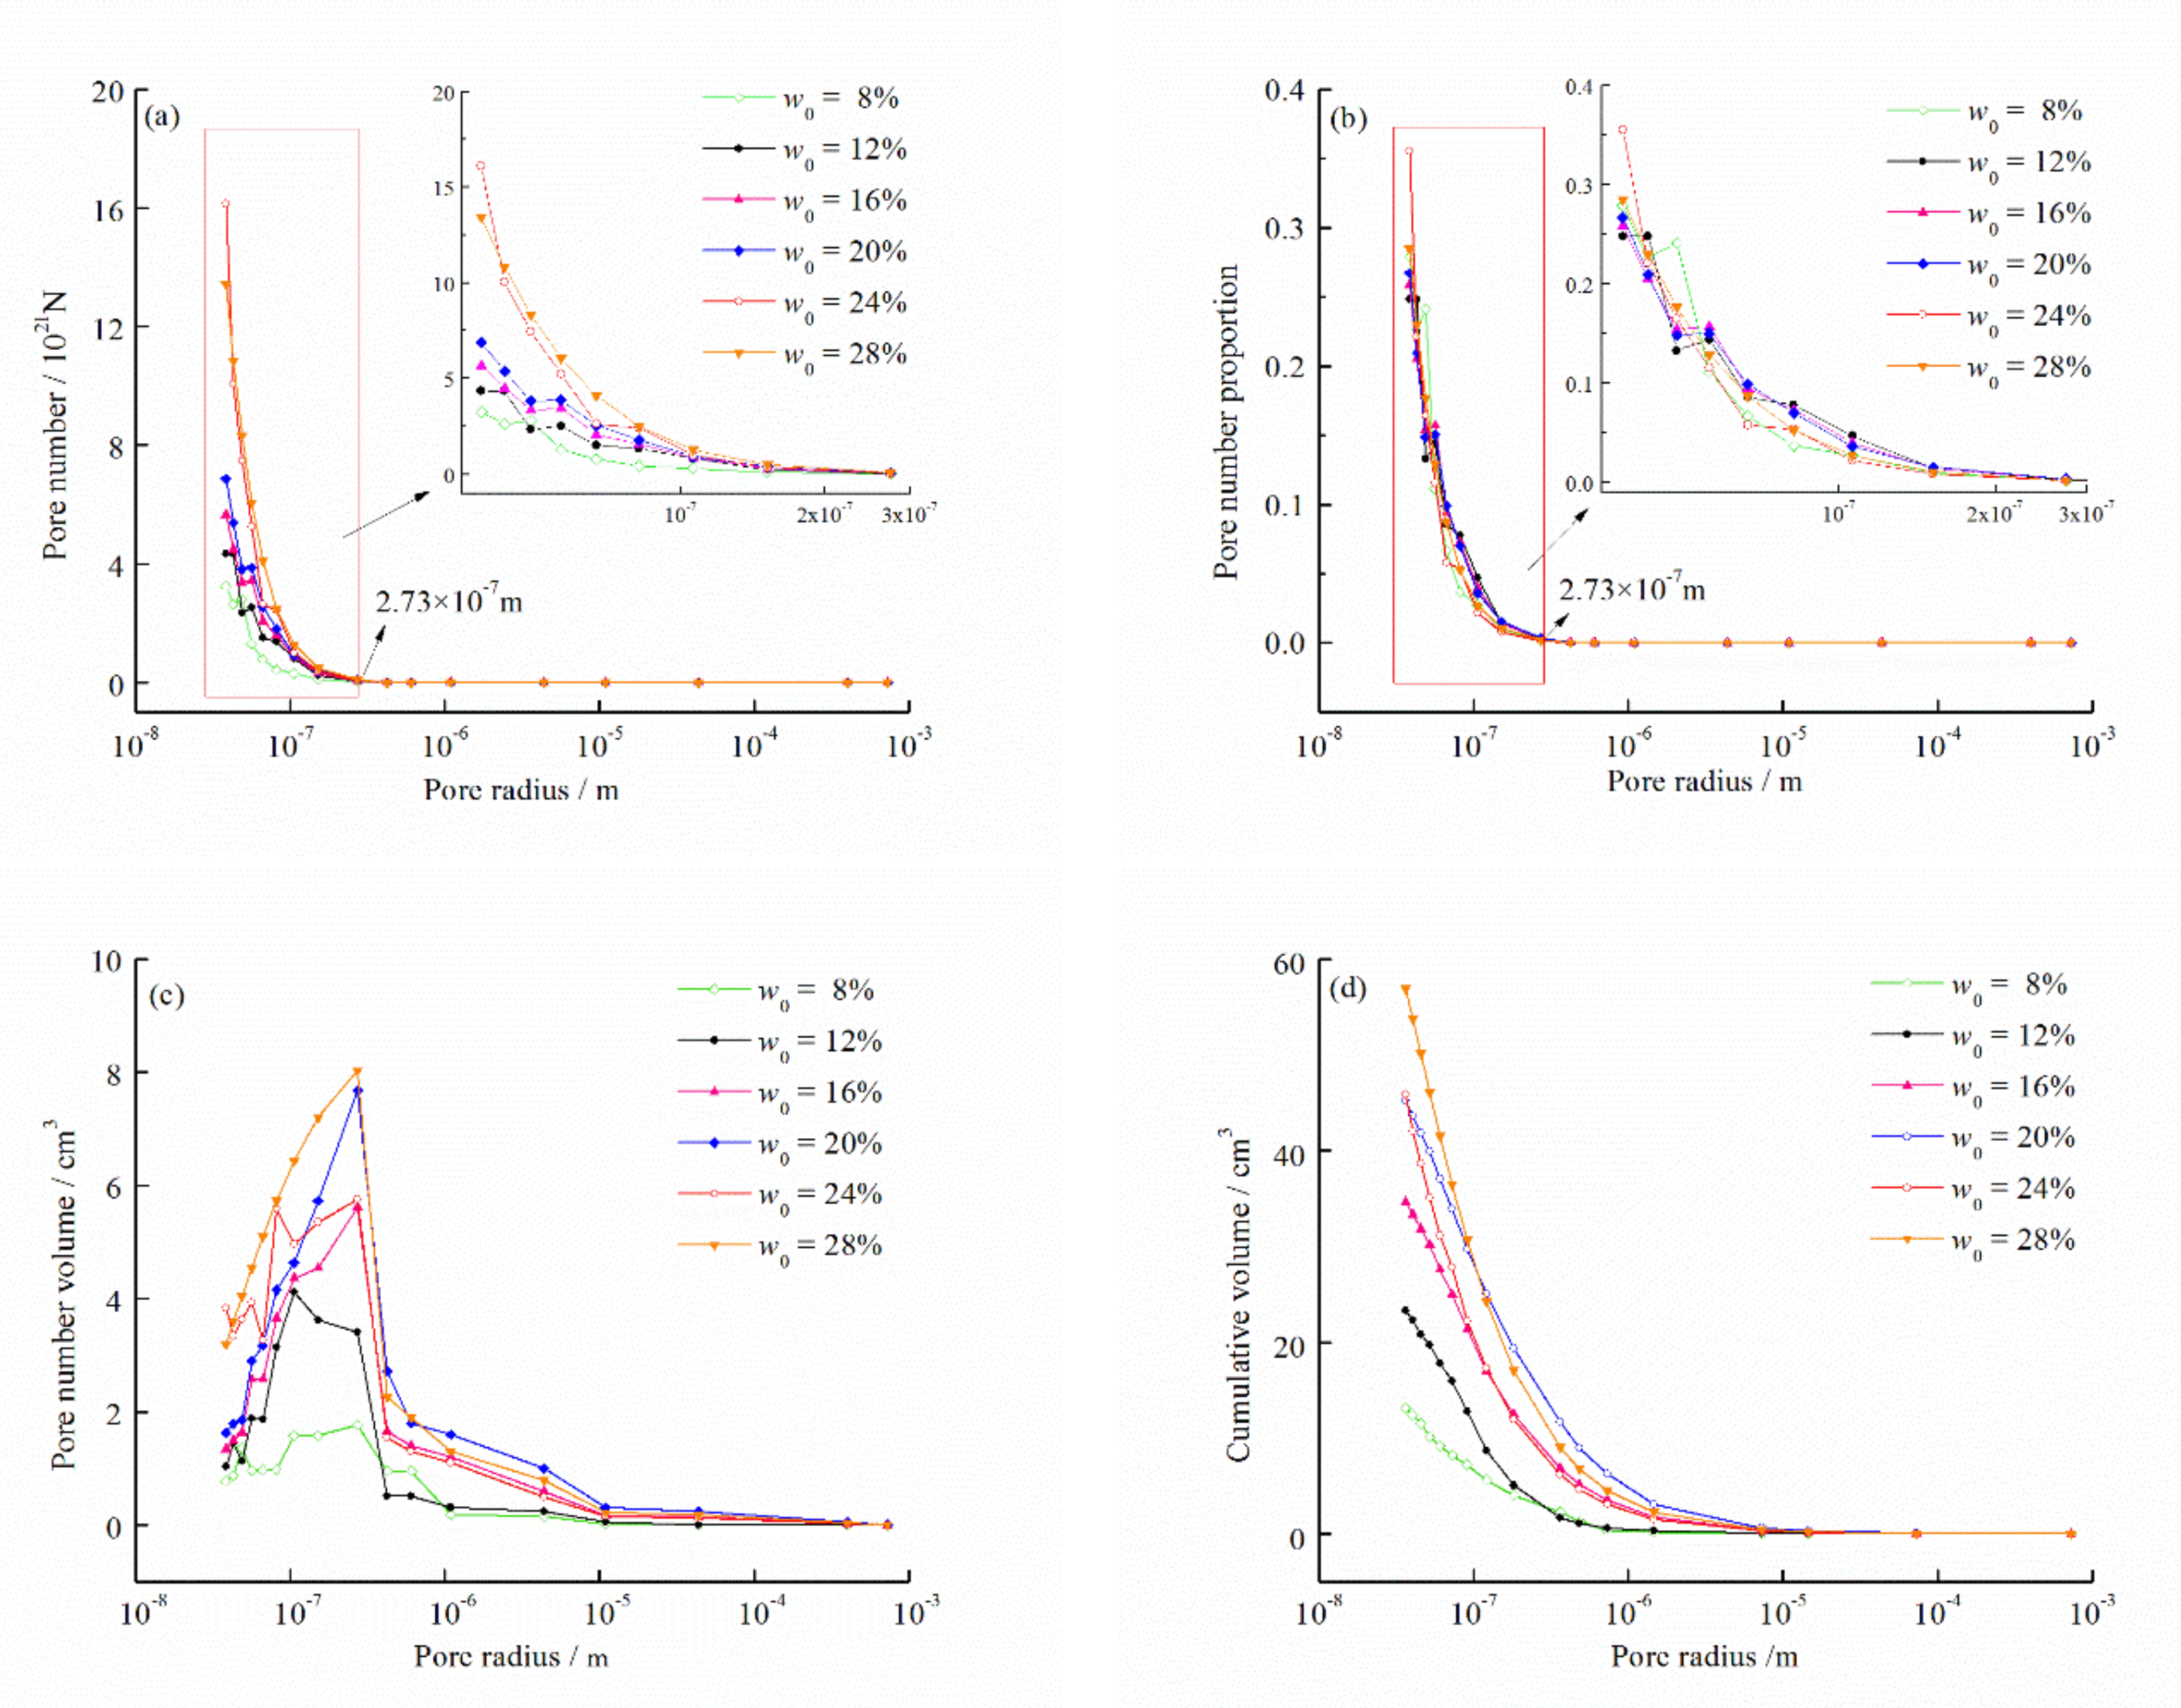
The difference in the pore size distribution has a significant influence on the unfrozen water content. As shown in Figure 2d and Figure 10, when T = Ti, the radius ri will be obtained. At this temperature, the pores with radii larger than ri are frozen. Therefore, the pore size distribution can be obtained by combining Equations (18)–(21) and Equations (27)–(30). As shown in Figure 11, the distribution curves become denser with the decrease of temperature. As shown in Figure 11a, the pore number with different initial water content changes basically along the same trend, and the pore number decreases with the increase of pore radius. When ri < 2.73 × 10⁻⁷ m, the initial water content has a great impact on the pore number, while when ri > 2.73 × 10⁻⁷ m, the initial water content has little impact on the pore number. The overall trend of pore ratio decreases gradually with the increase of pore diameter (Figure 11b). The pore size distribution appeared to peak in the range of 10−7 to 10−6 m, and it is found that there is no direct relationship between the peak position and the initial water content (Figure 11c). Figure 11d is the cumulative curve of pore volume and pore radius. With different initial water content, pore volume decreases with increase of pore radius.

4.3. Microscopic Mean Stress

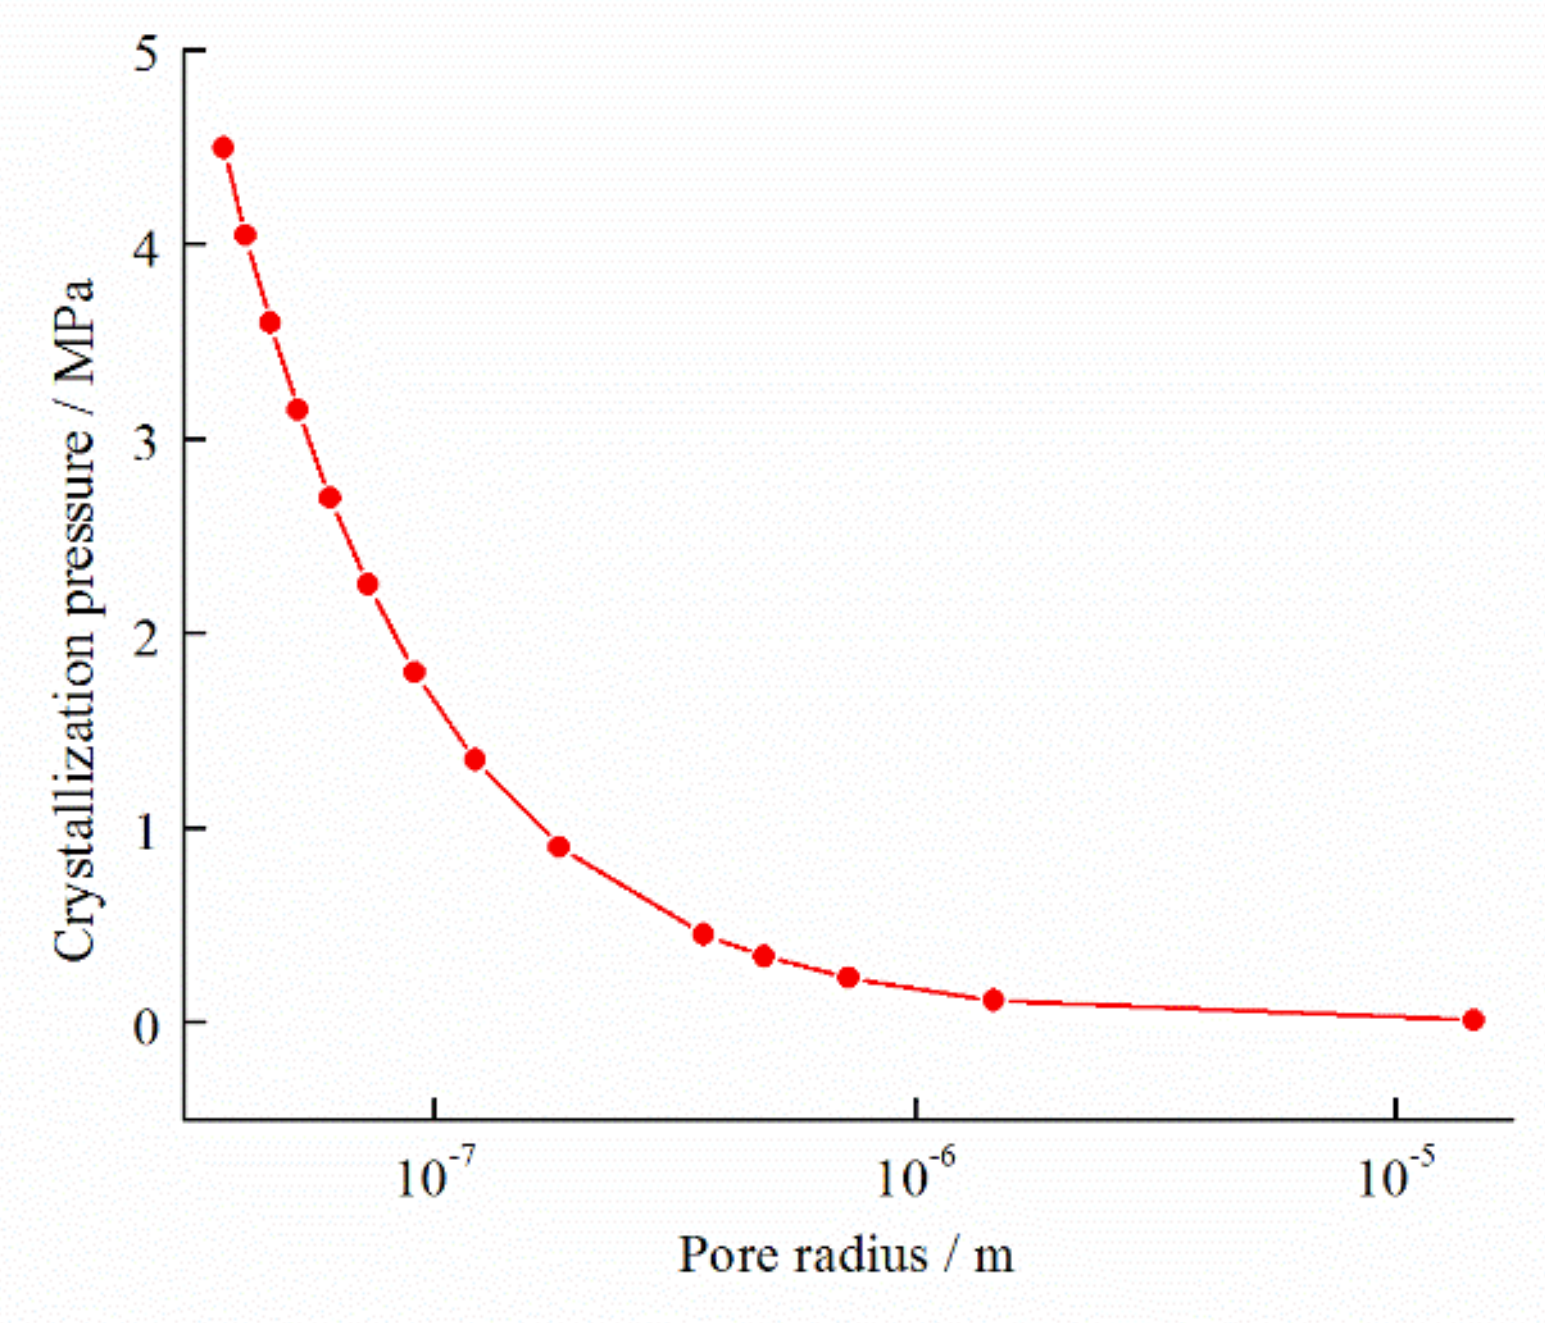
According to Equations (14)–(16), the relationship between the pore radius and the crystallization pressure for a single crystal in a pore can be obtained, as shown in Figure 12. There is a negative correlation between the crystal stress and the pore radius.
Figure 13a gives the relationship between the microcrystalline mean stress and the pore radius, which was calculated by Equation (25). As shown, the microscopic mean stress is positively correlated with initial water content. Additionally, at the same initial water content, with the increase of pore radius, the mean stress gradually decreases and tends to a stable value. Within the temperature range of ice lens formation (0 to −2 °C), the greater the initial water content was the greater microscopic mean stress there is at the same pore radius, as shown in Figure 13b. With the decrease of temperature, the mean stress gradually increases. The smaller initial water content has a smaller variation of mean stress.

4.4. Tensile Stress

The relationship between tensile stress and temperature under different initial water content is shown in Figure 14. In the range of −2 ~ 0 °C, the tensile stress of soil samples with different initial water content changes similarly with the temperature, that is increases gradually with the decrease of temperature.

4.5. Comparison of the Mean Stress and the Tensile Strength

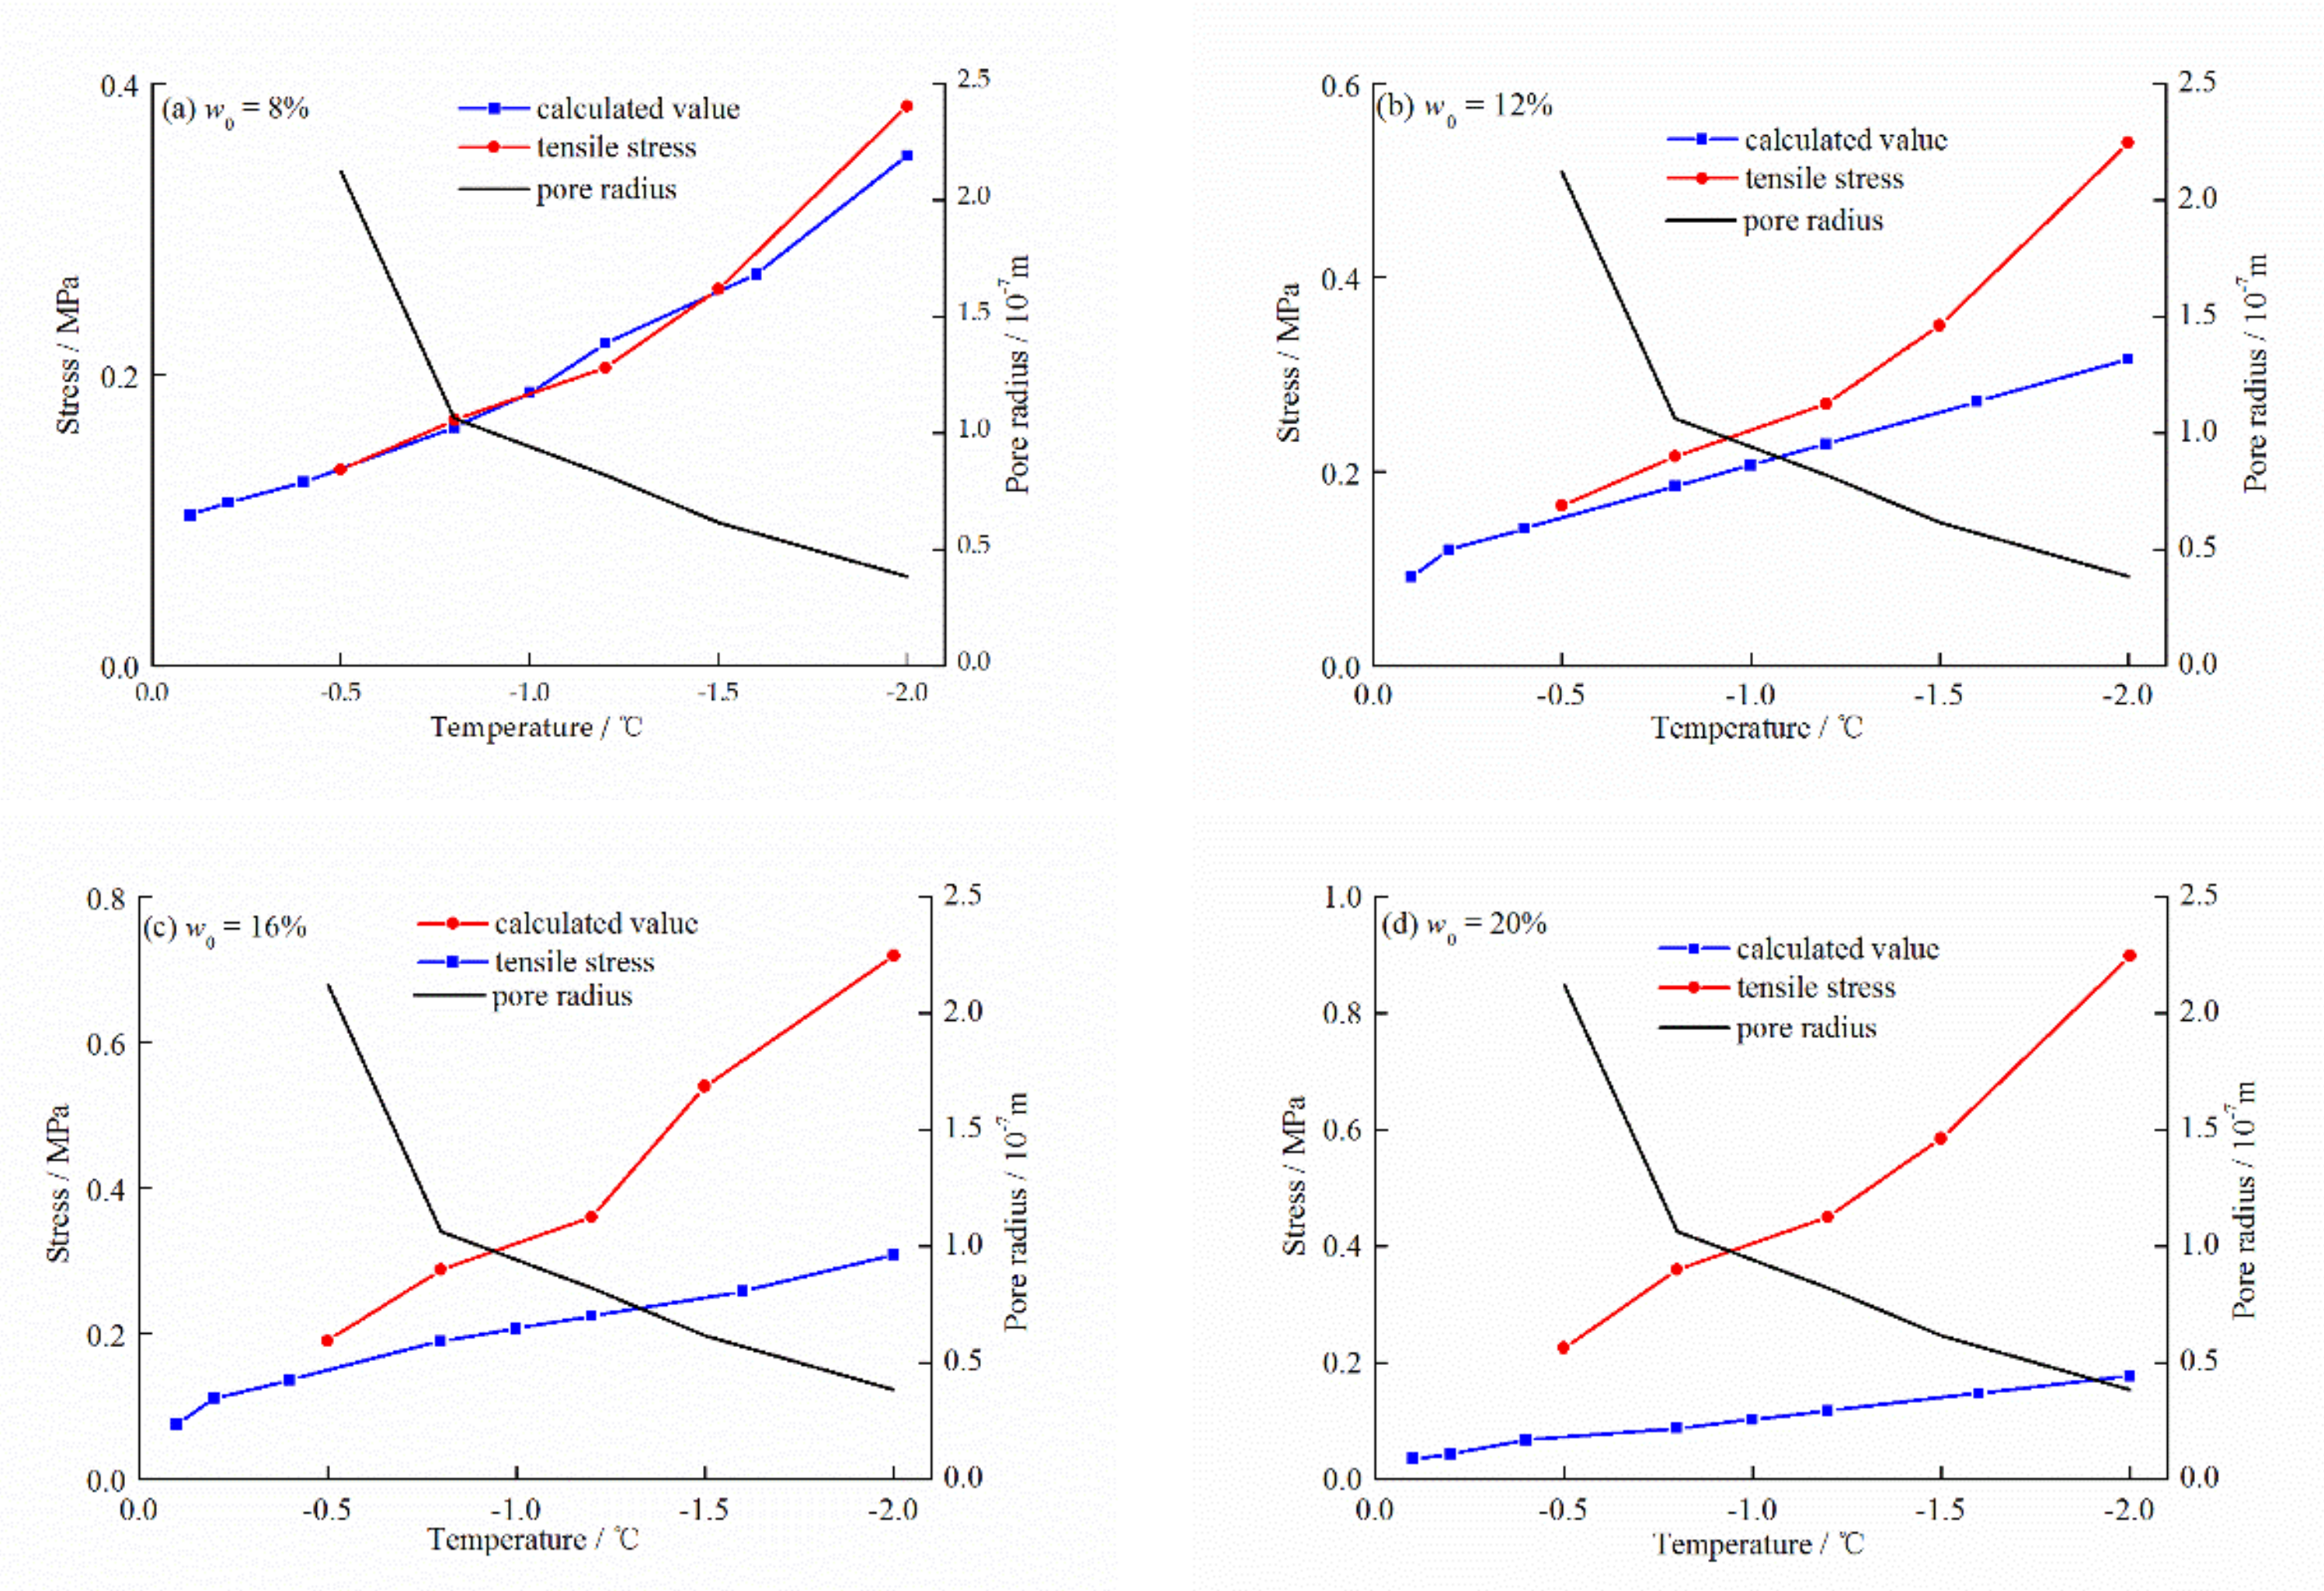
The comparison of the tested tensile stress and the calculated mean stress in the temperature range of 0 to −2 °C is shown in Figure 15. It can be found that the tensile stress and the mean stress are negatively correlated with temperature, and gradually increase with the decrease of temperature. Moreover, the calculated mean stress is larger than the tensile stress at all temperature points. When the initial water content is 8%, the calculated value differs little from the tensile stress. The main reason is that the free water content of soil with low initial water content is lower and it is not going to change much, so the mean stress is smaller. Under other initial water content, these calculated values are greater than the test values. According to Equation (35), when the driving force of ice lens formation is greater than of the constraining force, the ice lens will be formed under this condition. Thus, this also illustrates the feasibility and rationality of the micro-theoretical method.

5. Conclusions

Based on the microscopic crystallization theory, a theoretical model is developed for mechanical criterion of formation of ice lens considering the initial water content, temperature, pore radius and pore size distribution. A new mechanical criterion of formation of ice lens was proposed based on the existing criterion. Through analysis, the following conclusions can be drawn:
(1) The mean stress on the pore matrix transformed by crystallization pressure on the pore wall is the driving force for the formation of ice lens. In addition, in the absence of external load, the tensile stress is the full internal constraining force that exerts significant control over the formation of ice lens.
(2) Within the temperature range of ice lens formation (0 to −2 °C), the calculated mean stress is greater than the tensile stress, which indicates that the ice lens will be formed under this condition. In this way, the microscopic mechanism of formation of ice lens is connected with the macroscopic mechanics. This illustrates that the microscopic crystallization theory can be used to explain the mechanical mechanism of the ice lens formation.
(3) Based on the experimental data from the test of unfrozen water content and microscopic crystallization theory, the pore size distribution curves of soil are obtained. Furthermore, a new method for calculating pore size distribution based on the relationship between the ice crystals and temperature is obtained. Through controlling of temperature and initial water content, a larger and wider pore size distribution can be obtained.
Furthermore, the mechanism of crystallization in porous materials (such as rock, cement, geopolymer, etc.) has received attention in cold region engineering. Due to the intrinsic heterogeneity and complexity of the material in terms of water content, pore geometries, connective channels between pores, solid grain properties, et cetera., the extensive applicability of the crystallization theory still needs to be further extended and studied.

Author Contributions

Conceptualization, Y.L. and F.M.; methodology, Y.L. and D.L.; validation, Y.L., L.C. and F.M.; formal analysis, Y.L. and F.M.; investigation, Y.L. and F.M.; resources, Y.L. and L.C.; data curation, Y.L.; writing—original draft preparation, Y.L.; writing—review and editing, Y.L., D.L., L.C. and F.M.; supervision, D.L. and F.M.; funding acquisition, F.M. and D.L. All authors have read and agreed to the published version of the manuscript.

Funding

This research received no external funding.

Acknowledgments

This research was supported by the National Natural Science Foundation of China (No. 41701060 and No. 41271080) and the program of the State Key Laboratory of Frozen Soil Engineering (Grant No. SKLFSE-ZT-17).

Conflicts of Interest

The authors declare no conflict of interest.

References

  1. Ma, W.; Niu, F.J.; Mu, Y.H. Basic research on the major permafrost projects in the Qinghai-Tibet Plateau. Adv. Earth Sci. 2012, 27. [Google Scholar] [CrossRef]
  2. Wang, G.S.; Yu, Q.H.; Guo, L.; You, Y.H.; Wang, S.J.; Yu, Y. Prevention and control of freezing and thawing disasters in electric transmission lines constructed in permafrost regions. J. Glaciol. Geocryol. 2014, 36, 137–143. [Google Scholar] [CrossRef]
  3. Yu, F.; Qi, J.L.; Lai, Y.M.; Sivasithamparam, N.; Yao, X.L.; Zhang, M.Y.; Liu, Y.Z.; Wu, G.L. Typical embankment settlement/heave patterns of the Qinghai-Tibet highway in permafrost regions: Formation and evolution. Eng. Geol. 2016, 214, 147–156. [Google Scholar] [CrossRef]
  4. Taber, S. Frost Heaving. J. Geol. 1929, 37, 428–461. [Google Scholar] [CrossRef]
  5. Thomas, H.R.; Cleall, P.J.; Li, Y. Modelling of cryogenic processes in permafrost and seasonally frozen soils. Geotechnique 2009, 59, 173–184. [Google Scholar] [CrossRef]
  6. Ming, F.; Zhang, Y.; Li, D.Q. Experimental and theoretical investigations into the formation of ice lenses in deformable porous media. Geosci. J. 2016, 20, 667–679. [Google Scholar] [CrossRef]
  7. O’Neill, K.; Miller, R.D. Exploration of a rigid ice model of frost heave. Water Resour. Res. 1985, 21, 281–296. [Google Scholar] [CrossRef]
  8. Rempel, A.W.; Wettlaufer, J.S.; Worster, M.G. Premelting dynamics in a continuum model of frost heave. J. Fluid Mech. 2004, 498, 227–244. [Google Scholar] [CrossRef] [Green Version]
  9. Zhou, Y.; Zhou, G.Q.; Zhou, J.S.; Wang, J.Z. Ice lens growth process involving coupled moisture and heat transfer during freezing of saturated soil. Chin. J. Geotech. Eng. 2010, 32, 578–585. [Google Scholar]
  10. Miller, R.D. Lens initiation in secondary heaving. In Proceedings of the International Symposium on Frost Action in Soils, Lulea, Sweden, 16–18 February 1977; pp. 68–74. [Google Scholar]
  11. Gilpin, R.R. A model for the prediction of ice lensing and frost heave in soils. Water Resour. Res. 1980, 16, 918–930. [Google Scholar] [CrossRef]
  12. Derjaguin, B.V.; Churaev, N.V. The theory of frost heaving. Prog. Surf. Sci. 1993, 67, 391–396. [Google Scholar] [CrossRef]
  13. Hopke, S.W. A model for frost heave including overburden. Cold Reg. Sci. Technol. 1980, 3, 111–127. [Google Scholar] [CrossRef]
  14. Sheng, D.C.; Axelsson, K.; Knutsson, S. Frost heave due to ice lens formation in freezing soils1. Theory and verification. Hydrol. Res. 1995, 26, 125–146. [Google Scholar] [CrossRef]
  15. Chen, F.X. The theoretical frame of multi-phase porous medium for the freezing soil. Chin. J. Geotech. Eng. 2002, 24, 213–217. [Google Scholar] [CrossRef]
  16. Dash, J.G.; Rempel, A.W.; Wettlaufer, J.S. The physics of premelted ice and its geophysical consequences. Rev. Mod. Phys. 2006, 78, 695–741. [Google Scholar] [CrossRef] [Green Version]
  17. Zhang, Y.; Bing, H. Experimental study of the effect of freezing thawing cycles on porosity characters of silty clay by using mercury intrusion porosimetry. J. Glaciol. Geocryol. 2015, 19, 620–624. [Google Scholar] [CrossRef]
  18. Lecampion, B. Stress-induced crystal preferred orientation in the poromechanics of in-pore crystallization. J. Mech. Phys. Solids 2010, 58, 1701–1715. [Google Scholar] [CrossRef]
  19. Zhang, H.M.; Yang, G.S. Damage mechanical characteristics of rock under freeze-thaw and load coupling. Eng. Mech. 2011, 28, 161–195. [Google Scholar]
  20. Wall, F.T. Chemical Thermodynamics; Freeman: San Francisco, CA, USA, 1965; pp. 157–158. [Google Scholar]
  21. Scherer, G.W. Freezing gels. J. Non-Cryst. Solids 1993, 155, 1–25. [Google Scholar] [CrossRef]
  22. Adamson, A.W.; Gast, A.P. Physical Chemistry of Surfaces, 5th ed.; John Wiley and Sons: New York, NY, USA, 1967; pp. 379–389. [Google Scholar]
  23. Adamson, A.W. Physical chemistry of surfaces Wiley. Phys. Chem. Surf. 1990, 524, A467. [Google Scholar] [CrossRef]
  24. Scherer, G.W. Stress from crystallization of salt. Cem. Concr. Res. 2004. [Google Scholar] [CrossRef]
  25. Ju, X.D. Study on the Mechanism of Crystallization Damage for the Porous Media of Rocks; Institute of Rock and Soil Mechanics University of Chinese Academy of Sciences: Wuhan, China, 2014. [Google Scholar]
  26. Ju, X.D.; Feng, W.J.; Zhang, Y.J.; Zhao, H.B. Crystallization stresses in brittle porous media. Chin. J. Geotech. Eng. 2016, 38, 1246–1253. [Google Scholar] [CrossRef]
  27. Wang, C.; Lai, Y.M.; Zhang, M.Y. Estimating soil freezing characteristic curve based on pore-size distribution. Appl. Therm. Eng. 2017, 124, 1049–1060. [Google Scholar] [CrossRef]
  28. Xiao, Z.A.; Lai, Y.M.; You, Z.M. Study on the Water and Salt Migration Process and Deformation Mechanism of Daline Freezing Soil; Northwest Institute of Eco-Environment and Resources, Chinese Academy of Sciences: Lanzhou, China, 2017. [Google Scholar]
  29. You, Z.M.; Lai, Y.M.; Zhang, M.Y.; Liu, E.L. Quantitative analysis for the effect of microstructure on the mechanical strength of frozen silty clay with different contents of sodium sulfate. Environ. Earth Sci. 2017, 76, 143. [Google Scholar] [CrossRef]
  30. Watanabe, K.; Mizoguchi, M. Amount of unfrozen water in frozen porous media saturated with solution. Cold Reg. Sci. Technol. 2002, 34, 103–110. [Google Scholar] [CrossRef]
  31. Anderson, D.M.; Tice, A.R. The unfrozen interfacial phase in frozen soil water systems. In Physical Aspects of Soil Water and Salts in Ecosystems; Springer: Berlin/Heidelberg, Germany, 1973. [Google Scholar] [CrossRef]
  32. Everett, D.H. The thermodynamics of frost damage to porous solids. Trans. Faraday Soc. 1961, 57, 1541–1551. [Google Scholar] [CrossRef]
  33. Konrad, J.M.; Duquennoi, C. A model for water transport and ice lensing in freezing soils. Water Resour. Res. 1993, 29, 3109–3124. [Google Scholar] [CrossRef]
  34. Dash, J.G.; Fu, H.; Wettlaufer, J.S. The premelting of ice and its environmental consequences. Rep. Prog. Phys. 1995, 58, 115–167. [Google Scholar] [CrossRef]
  35. Miyata, Y. A thermodynamic study of liquid transportation in freezing porous media. JSME Int. J. 1998, 41, 601–609. [Google Scholar] [CrossRef] [Green Version]
  36. Watanabe, K.; Mizoguchi, M. Ice configuration near a growing ice lens in a freezing porous medium consisting of micro glass particles. J. Cryst. Growth 2000, 213, 135–140. [Google Scholar] [CrossRef]
  37. Nixon, J.F. Discrete ice lens theory for frost heave in soils. Can. Geotech. J. 1991, 28, 843–859. [Google Scholar] [CrossRef]
  38. He, P.; Cheng, G.; Yu, Q.; Zhu, Y.L.; Xu, X.Z. A couple model of heat, water and stress fields of saturated soil during freezing. J. Glaciolgy Geocryol. 2000, 22, 135–138. [Google Scholar]
  39. Zhang, L.H.; Ma, W.; Yang, C.S.; Yuan, C. Investigation of the pore water pressures of coarse-grained sandy soil during open-system step-freezing and thawing tests. Eng. Geol. 2014, 181, 233–248. [Google Scholar] [CrossRef]
  40. Wu, D.; Lai, Y.M.; Zhang, M.Y. Thermo-hydro-salt-mechanical coupled model for saturated porous media based on crystallization kinetics. Cold Reg. Sci. Technol. 2017, 133, 94–107. [Google Scholar] [CrossRef]
  41. Penner, E. Aspects of ice lens growth in soils. Cold Reg. Sci. Technol. 1986, 13, 91–100. [Google Scholar] [CrossRef] [Green Version]
  42. Watanabe, K.; Mizoguchi, M.; Ishizaki, T. Experimental study on microstructure near freezing front during soil freezing. Trans. Jpn. Soc. Irrig. Drain. Reclam. Eng. 1997, 65, 53–58. [Google Scholar]
  43. Zhang, Q. Tests on Evolution of Segregation Ice of Artificial Frozen Soils; China University of Mining and Technology: Xuzhou, China, 2005. (In Chinese) [Google Scholar]
Figure 1. Scanning electron microscope (SEM) images of soil (a) The magnification is 50; (b) The magnification is 200 [17].
Applsci 10 08981 g001
Figure 2. Schematic diagrams of the model: (a) parallel configurations of pore structure of soils; (b) a saturated freezing pore and (c,d) diagrams of bundle of cylindrical capillary (BCC) model.
Applsci 10 08981 g002
Figure 3. Schematic diagram for the force properties of crystal.
Applsci 10 08981 g003
Figure 4. Relationship between pore radius and freezing point.
Applsci 10 08981 g004
Figure 5. Freezing characteristic curve of soil.
Applsci 10 08981 g005
Figure 6. Particle size distribution.
Applsci 10 08981 g006
Figure 7. Schematic of the test apparatus.
Applsci 10 08981 g007
Figure 8. Schematic of the test apparatus.
Applsci 10 08981 g008
Figure 9. The curve of unfrozen water content under different initial water content and temperature.
Applsci 10 08981 g009
Figure 10. The relationship between the pore radius and temperature.
Applsci 10 08981 g010
Figure 11. Pore size distribution of soil: (a) pore number; (b) pore number proportion; (c) pore number volume and (d) cumulative volume.
Applsci 10 08981 g011
Figure 12. The relation curve of pore radius and crystallization pressure.
Applsci 10 08981 g012
Figure 13. Variation of the microscopic mean stress with the pore radius (a) and the temperature (b).
Applsci 10 08981 g013
Figure 14. Variation of the tensile stress with the temperature.
Applsci 10 08981 g014
Figure 15. Variation of tensile stress with temperature under different initial water content.
Applsci 10 08981 g015aApplsci 10 08981 g015b
Table 1. Basic physical parameters of loess samples.
Soil TypeMaximum Dry Density (g/cm3)Plastic LimitLiquid LimitPlasticity IndexOptimum Water Content
Loess1.7615.60%27.20%8.4016.00%
Table 2. Experiment condition.
Experiment Condition Initial Water ContentWit Density (g/cm3)Experiment Temperature (°C)Soil Sample Diameter (mm)Soil Sample Height (mm)
L18%1.95−18.0062.0084.76
L212%1.9983.11
L316%2.0481.16
L420%2.1078.90
L524%2.1377.70
L628%2.1776.15
Publisher’s Note: MDPI stays neutral with regard to jurisdictional claims in published maps and institutional affiliations.