Article

Monitoring Spatiotemporal Evolution of Urban Heat Island Effect and Its Dynamic Response to Land Use/Land Cover Transition in 1987–2016 in Wuhan, China

1
Faculty of Resources and Environmental Science, Hubei University, Wuhan 430062, China
2
Key Laboratory of Regional Development and Environmental Response, Wuhan 430062, China
*
Author to whom correspondence should be addressed.
Appl. Sci. 2020, 10(24), 9020; https://doi.org/10.3390/app10249020
Submission received: 11 November 2020 / Revised: 7 December 2020 / Accepted: 10 December 2020 / Published: 17 December 2020
(This article belongs to the Special Issue Advanced Remote Sensing Technologies for Disaster Monitoring)

Abstract

:
Monitoring the relationship between the urban heat island (UHI) effect and land use/land cover (LULC) is of great significance in land use planning to adapt to climate change. However, the dynamic response of the UHI effect to LULC change over space and time has not been deeply studied. In this study, a transfer matrix method was carried out to monitor the class-to-class transitions between different LULC types, as well as those between different NLST (normalized land surface temperature) levels over space and time. The spatiotemporal correlation and dynamic coupling between UHI variation and LULC change from 1987 to 2016 were simulated based on multi-temporal remote sensing data in Wuhan, China. The results showed that high temperature (level V) and sub-high temperature (level IV) were mainly concentrated in construction land, while the majority of low temperature (level I) was distributed in water bodies. During the study period, the most notable changes were the rapid increase in construction land, as well as the continuous shrinkage of farmland and water bodies. The inward transfer of construction land was mainly from farmland and water bodies, with the transferred area of 218.3 km2 (69.2%) and 78.9 km2 (25.0%). These transitions were mainly responsible for the thermal deterioration in the study area. The transition of farmland to construction land contributed the most (66.3% and 81.6%) to thermal deterioration in the original medium temperature area (level III). The transition of water bodies to construction land was the main driving force in rapidly upgrading NLST level I into level IV (55.8%) and level V (58.6%). These findings provided detailed information for decision support in optimizing land use structure to fight against the thermal deterioration caused by urbanization.

1. Introduction

Urban heat island (UHI) effect, a phenomenon whereby urban areas experience higher air and surface temperatures when compared to the rural areas, has attracted increasing attention due to its adverse impacts on the economy and environment [1,2,3]. The increased temperatures in urban areas increase energy use for air conditioning and alter the energy layout [4,5,6]. In turn, higher energy consumption raises the anthropogenic waste heat and pollution level [7,8,9], which directly warms the environment and enhances the pollution levels in urban areas. The persistent deterioration of the urban environment has a serious impact on the health of urban residents. Heat waves in summer significantly lead to thermal discomfort, heat-related diseases and a higher mortality rate [10,11,12,13]. Understanding the formation and development of the UHI effect helps to draft appropriate mitigation strategies and deal with the negative effects.
It is well documented that the drastic change in land use/land cover (LULC) associated with urbanization and human activities is a powerful driving force in UHI effect formation and local climate variation [14,15]. With the tremendous growth of population in urban areas, the demand for urban roads, commercial, residential, industrial and other construction lands increases correspondingly [16,17,18]. A large number of natural landscapes, such as agricultural land, forest land and water body, are increasingly replaced by impervious surfaces such as roads, buildings and parking lots [19,20,21]. The modification of surface characteristics and LULC pattern alter the surface radiative, soil water content and thermal properties, and then change the thermal characteristic pattern over urban areas [14,22,23,24,25].
Extensive studies on the relationship between LULC change and UHI effect have been performed based on Landsat imagines. Classically, land use pattern was mapped based on land use classification and spatially correlated with land surface temperature (LST) distribution [26,27] to describe the spatial coupling between LULC and LST. The average LST and standard deviation values for each LULC category were counted and compared to identify the impact of LULC change on UHI effect [28,29,30]. The findings confirmed that LULC characteristics did have an impact on LST variation, but how it works is not clear. Further studies focused on the influence of LULC composition and configuration on LST variation. The relationship between LST values and some landscape metrics such as area, density, shape index, adjacent index and diversity index were quantitively modeled [31,32]. In addition, some LULC-related indices such as impervious surface areas (ISA) [33,34], normalized difference vegetation index (NDVI) [35,36], normalized difference built-up index (NDBI) [16,37] and modified normalized difference water index (MNDWI) [26,38] were used to indicate urban surface LULC characteristics. Their spatial correlations with LST values were quantified to specify the contribution of LULC variation on the UHI effect [14].
Previous studies showed that there exists a high spatial consistency between the LULC pattern and LST distribution [14,15]. Construction land is always occupied by higher LST values, while water bodies and highly vegetated areas are covered by lower ones [39,40,41,42]. When the construction land expanded, the area defined as UHI increased accordingly [27,29,43,44]. These studies paid more attention to LST comparison among different LULC categories over time and lacked detailed information on how the UHI effect responds to LULC change over space and time. However, the urban environment is characterized by high spatial heterogeneity and temporal variability [27,45]. UHI effect is considered to be context-sensitive, which varies significantly over space and time [30,46]. Previous studies mainly focused on the result comparison of the spatial coupling between the LULC pattern and LST distribution between different time points, which cannot provide detailed description of the influencing process of LULC change on the UHI effect [15,27,28,29]. Monitoring the spatiotemporal impact of LULC change on LST variation helps to understand the dynamic response process of the UHI effect to LULC change [14,15]. It is of great significance for urban planners but less discussed.
Therefore, the objective of this study is to investigate the dynamic response of UHI variation to LULC change over space and time. Specifically, it aims to (1) monitor class-to-class transitions between different LULC types from 1987 to 2016, (2) monitor the spatiotemporal variation of thermal characteristics based on level-to-level transitions between different LST levels, (3) spatially correlate the LULC pattern with LST distribution, (4) dynamically couple LULC change with UHI variation and (5) discuss the contribution of LULC transition to thermal characteristic variation.

2. Materials and Methods

2.1. Study Area

Wuhan is located at 29°58′~31°22′N, 113°41′~115°05′E with a subtropical humid climate. It has well-marked seasons and plenty of sunshine and rainfall. The annual mean sunshine duration and total solar radiation reach 1810~2100 h and 0.0104~0.0113 kcal/m2, respectively. The mean annual temperature ranges from 15.80 °C to 17.50 °C, with the highest temperature recorded at 41.30 °C (on August 10, 1934) and the lowest at −18.10 °C (on 30 January 1977). As recorded, from 1969 to 2016, there are 29 years and 3 years when the peak temperature in summer was over 38 °C and 40 °C. The average annual rainfall is 1150~1450 mm, which mainly occurred in summer. Thus, Wuhan has been known as one of the “Four Furnaces in China” for its hot and humid summer.
As the capital of Hubei Province, Wuhan, is one of the metropolitan cities in China (Figure 1). It is also the most important industrial, scientific and educational base and integrated transportation hub in central China. It covers an area of about 8500 km2 with a population of over 11 million. Wuhan has witnessed unprecedented urbanization in the past three decades, resulting in a serious UHI effect. Furthermore, continuous urbanization and economic development have been intensifying the UHI effect and expanding the UHI extent in Wuhan [28]. There are 13 municipal districts, 7 of which are distributed in built-up areas, namely Jiangan, Jianghan, Qiaokou, Hanyang, Qingshan, Wuchang and Hongshan districts. This study was mainly concentrated within the 3rd ring-road area, Wuhan economic and technical development area and Wuhan Iron and Steel (Group) Company (WISCO).

2.2. Data Pre-Processing and Land Use/Land Cover Classification

Four Landsat imagines acquired on 26 September 1987, 4 October 1996, 31 July 2007 and 23 July 2016 were downloaded from the Chinese geospatial data cloud website (http://www.gscloud.cn/), as shown in Table 1. After being rectified and georeferenced to the UTM projection system (ellipsoid WGS84, datum WGS84, zone 50), the four images were interpreted by the supervised classification method in ArcGIS and ENVI software. Considering the surface characteristics, such as surface radiative, soil water content and thermal properties [22,23,24,25], they were categorized into four main categories, namely farmland (arable agriculture lands but not orchards), greening land (forestland, grassland, orchards and urban green spaces), water bodies (rivers, lakes, reservoirs and pond waters) and construction land (the developed areas covered by impervious surfaces, such as commercial land, residential land and industrial land). Based on the Google earth correction and classification accuracy assessment, the overall classification accuracies and kappa coefficients were 87.3%, 92.2%, 89.0% and 93.0% and 0.81, 0.90, 0.84 and 0.85 in 1987, 1996, 2007 and 2016, respectively.

2.3. LST Derivation

Due to the uncertain calibration parameters of TIRS11, only the thermal infrared TIRS10 was used to retrieve the LST values from Landsat-8 images [47]. A method of single-channel Algorithm was performed to obtain LST values for 23 July 2016 based on TIRS 10 [48] and for 26 September 1987, 4 October 1996 and 31 July 2007 based on band 6 [49]. Radiation calibration [50] and atmospheric correction [51] were carried out in ENVI. The spectral radiance was then transformed into the brightness temperature throughEquation (1):
T s e n s o r = K 2 / ln ( 1 + K 1 / L s a t )
where Tsensor means the brightness temperature (K), Lsat means the radiometric intensity (obtained from radiation calibration), K1 = 607.76 w/(m2 × ster × m) and K2 = 1260.56 K are for band 6 of Landsat-5, while K1 = 774.89 w/(m2 × ster × m) and K2 = 1321.08 K are for band 10 of Landsat-8 [47].
Then emissivity correction is necessary. For band 6 of Landsat-5 and TIRS10 of Landsat-8, the emissivity is 0.9925, 0.9230 and 0.9940 [49] and 0.9908, 0.9212 and 0.9816 [48] for water, built-up area and fully vegetated area, respectively. For partly vegetated areas, the emissivity can be determined as Equation (2):
ε = 1.0094 + 0.047 ln(NDVI)
For Landsat-5 images, LST values can be calculated as Equation (3):
LST = Tsensor / (1 + (λ × Tsensor/ρ) ln ε)
where λ represents the wavelength of the band 6 for Landsat-5 with the value of 11.50 μm, ρ = 1.438 × 10², and ε is the emissivity.
For Landsat-8 images, LST values can be calculated as Equations (4) and (5):
LST = γ(φ1 × Tsensor + φ2)/ε + φ3) +δ
γ ≈ Tsensor 2/(bγ × Lsat), δ ≈ TsensorTsensor 2/bγ
where bγ = 1324K, φ1, φ2 and φ3 can be determined based on the relationship with the atmospheric moisture content [49].
The LST values were obtained from multi-temporal Landsat images acquired at different dates in different years, which had a different LST range and lacked direct comparability [14,15]. To make the thermal characteristics in different observed years comparable, the derived LST values from the images were normalized by Equation (6) [27]:
T = (ttmin)/(tmaxtmin)
where T is the normalized land surface temperature (NLST), t refers to the retrieved LST for a certain pixel, and tmax and tmin represent the minimum and maximum LST values in the study area, respectively.

2.4. Modeling the UHI and LULC Variation

The transfer matrix is an appropriate method to clarify the transition amount, extent and direction between different LULC types, as well as between different NLST levels. It is of great significance for exploring the dynamic correlation between LULC change and UHI variation. This process can be finished in ArcGIS through overlaying the different LULC and UHI maps in 1987–1996, 1996–2007, 2007–2016 and 1987–2016 using Equation (7):
S i j = S 11 S 12 S 13 S 1 n S 21 S 22 S 23 S 2 n S 31 S 32 S 33 S 3 n S n 1 S n 2 S n 3 S n n
where S refers to the area, n represents the number of temperature levels or land use types transferred, and i and j (i, j = 1, 2,…,n) are the LULC types and NLST levels before and after the transition, respectively.

3. Results and Discussion

3.1. Spatiotemporal Variation of Urban Thermal Characteristics

3.1.1. Spatial Distribution of Different Surface Temperature Levels

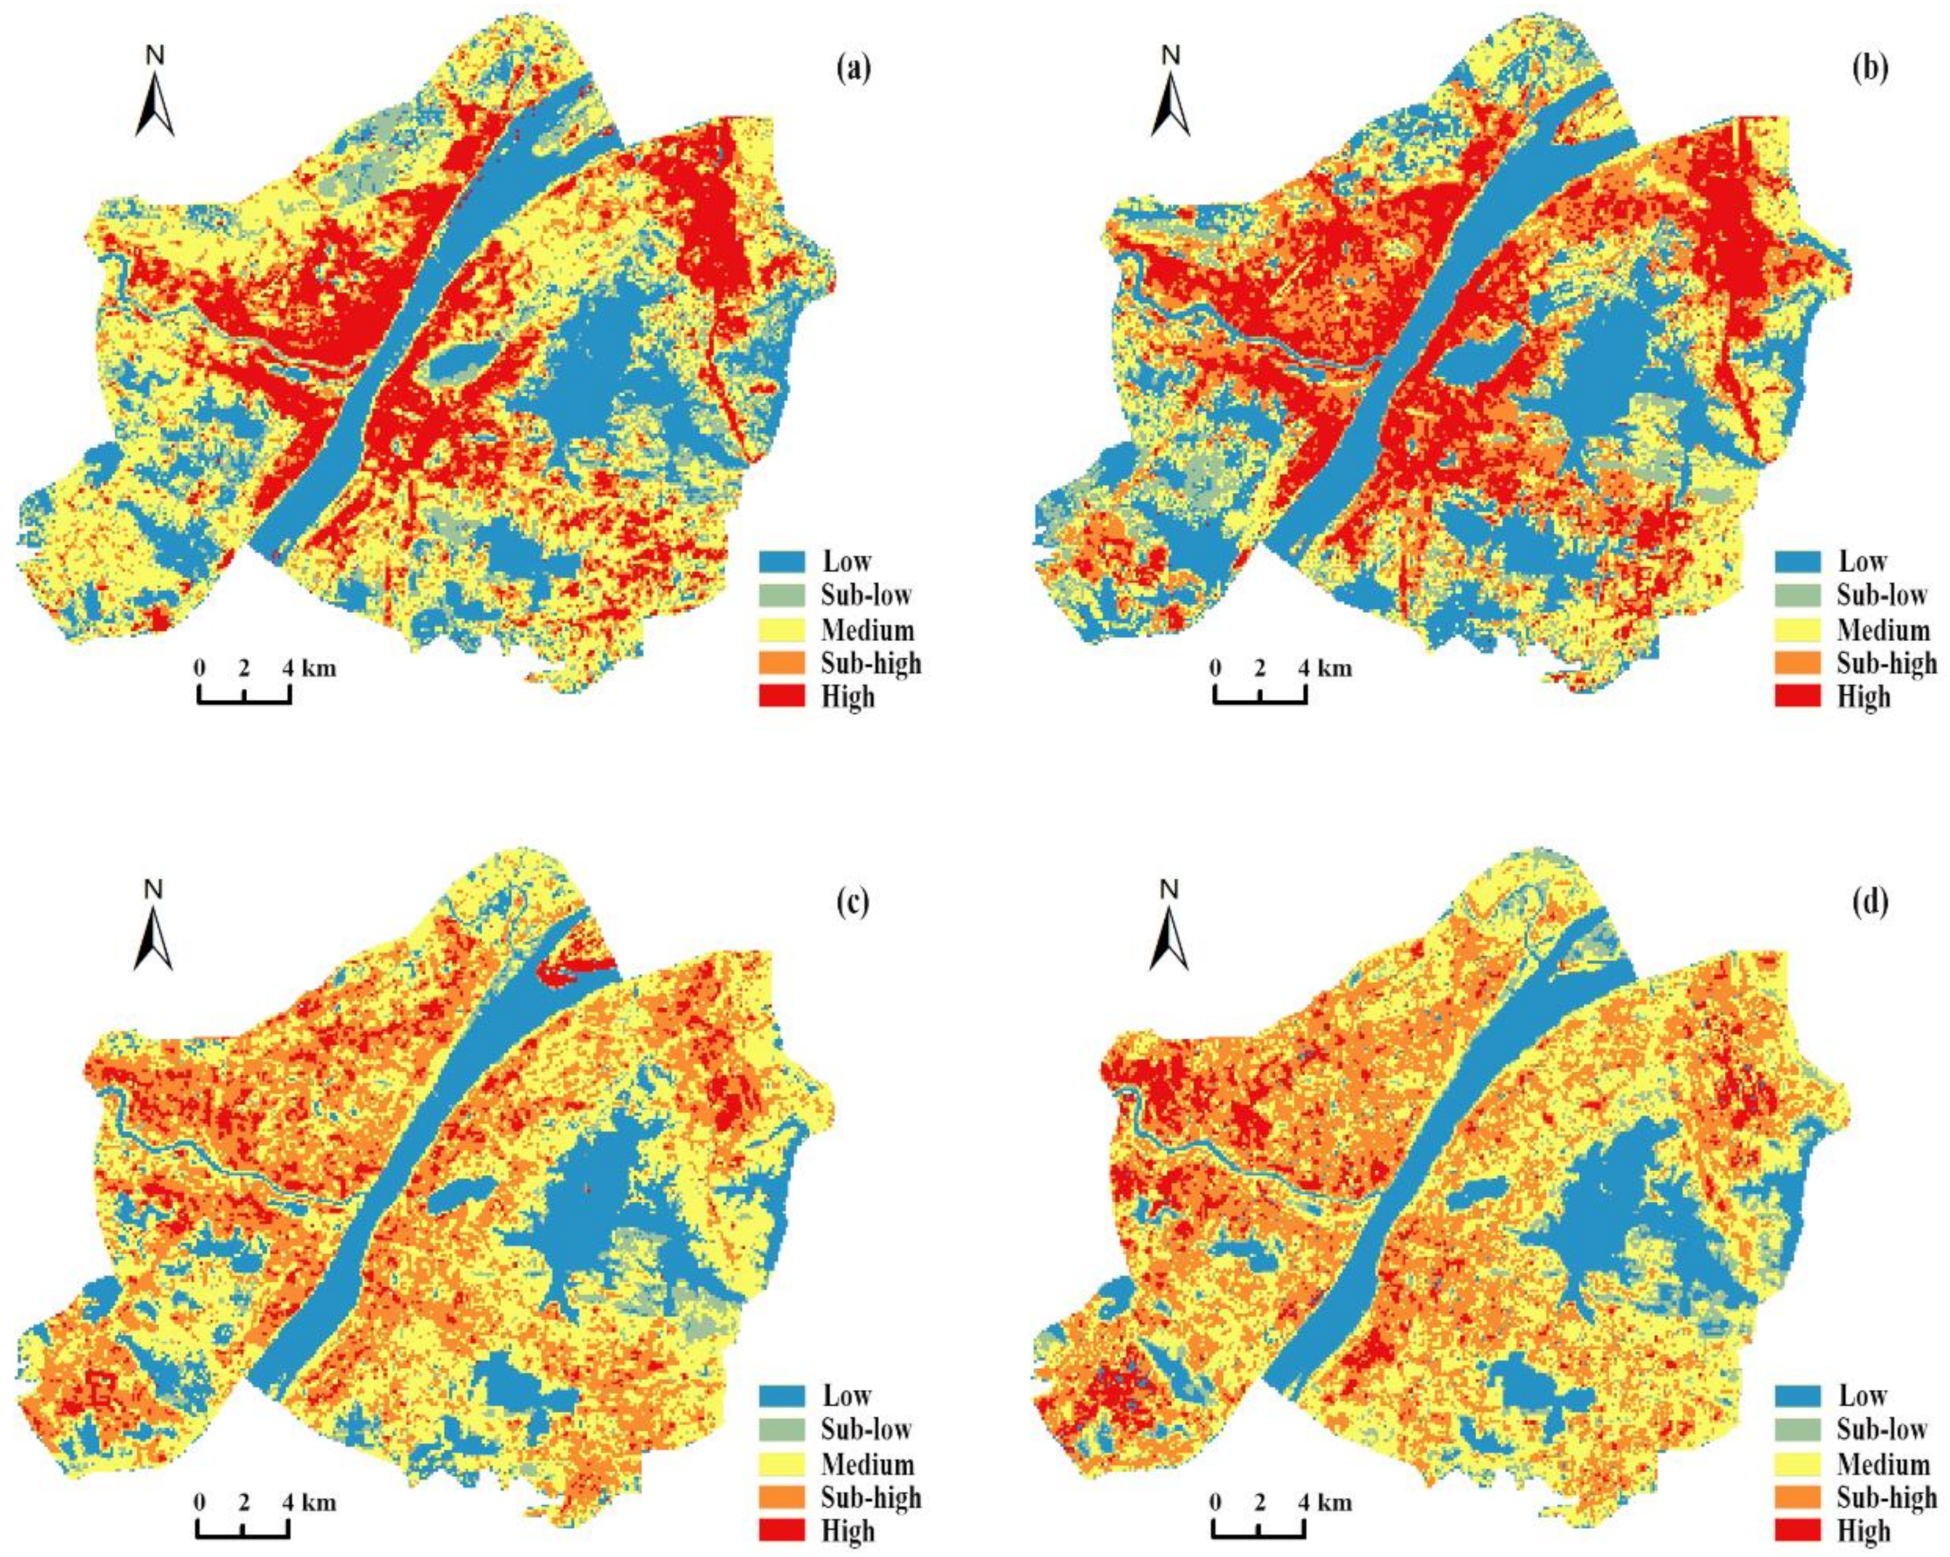
Figure 2 drafts the spatial distribution maps of different NLST levels. Lower temperatures (levels I and II) had significant spatial correlation with large urban water bodies such as the Yangte River, Han River, East Lake and Shahu Lake, expressing a cooling effect [32]. However, the distribution patterns of different temperature levels varied over time. Figure 2a,b share similar patterns in 1987 and 1996 with higher temperatures (levels IV and V, defined as urban heat island in this study) were mainly distributed along the main roads and concentrated in urban industrial areas in the city core. Compared with the surrounding scattered lower temperatures, the concentrated higher temperature area presented an obvious “heat island” effect. Figure 2c,d indicate that higher temperatures sprawled throughout the study area in 2007 and 2016. Areas covered by a higher temperature were scattered rather than concentrated in the study area, which expanded the spatial extent rather than the intensity of the heat island effect.
Table 2 and Table 3 summarize the areal coverage and the area change of different NLST levels in different study years. Generally, the area of lower temperatures (levels I and II) decreased by 27.9%, a total area loss of 62.5 km2 from 1987 to 2016. The areal coverage of higher temperatures (levels IV and V) increased from 223.1 km2 in 1987 to 280.7 km2 in 2016, an increase of 58.2 km2. Wuhan experienced thermal environment deterioration during the 29-year period. Specifically, the area of level IV (sub-high temperature) increased continuously, with an area of 95.3 km2, 145.1 km2, 216.2 km2 and 234.5 km2 in 1987, 1996, 2007 and 2016, respectively. The area change of the other temperature levels also varied over different sub-periods.

3.1.2. LST Variation during 1987–2016

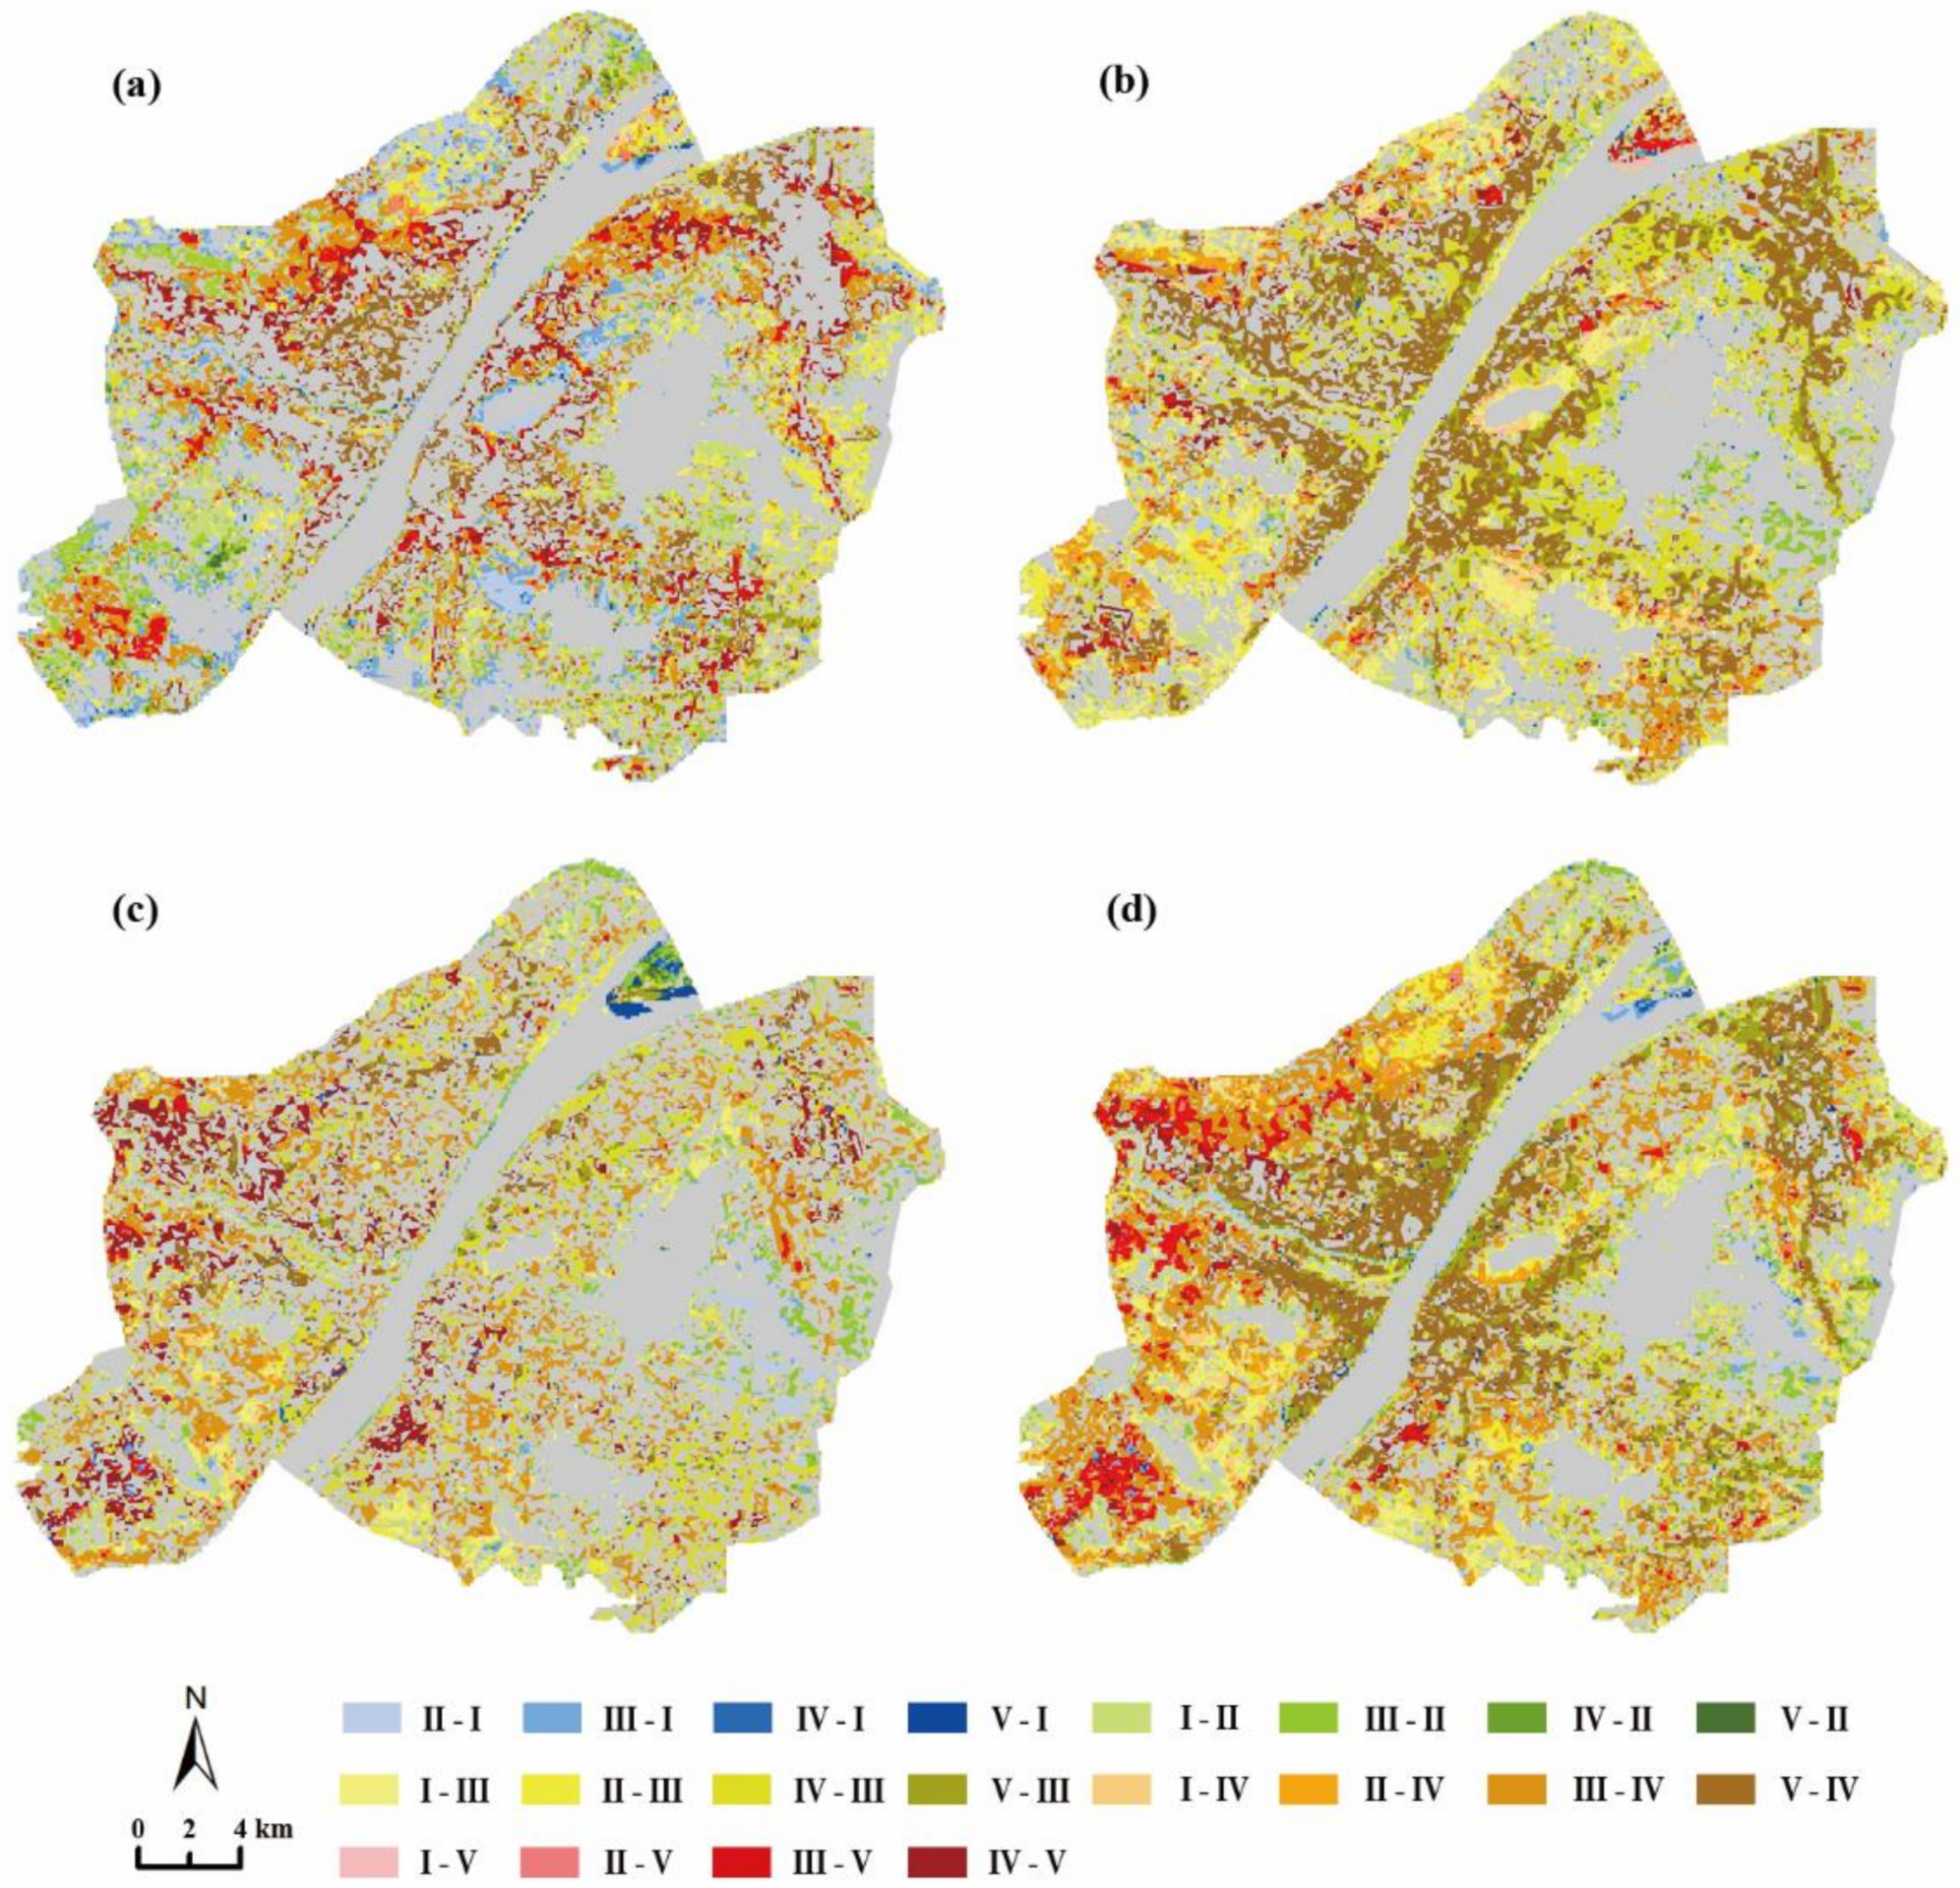
Figure 3 and Table 4 display the spatiotemporal transitions among different NLST levels during the study periods. The specific transition directions and extents in varied sub-periods differed from each other.
Between 1987 and 1996, the most dominant NLST level conversion was from medium temperature (level III) to sub-high temperature (level IV). The converted area was 67.7 km2, accounting for 47.8% of the outward transfer of level III (the transfer from level III to other NLST levels, the same below) and 67.5% of the inward transfer of level IV (the transfer from other NLST levels to level IV, the same below). It was mainly detected in the newly expanded construction areas in Qingshan, Jianghan and Zhuankou districts (Figure 3a).
Between 1996 and 2007, the most common transitions were from high temperature (level V) to sub-high temperature (level IV) (86.6 km2) and from sub-high temperature (level IV) to medium temperature (level III) (66.9 km2). They were mainly distributed along the dense streets and traffic road in the inner city (Figure 3b). It should be noted that the decreased LST levels did not mean an improvement in the thermal environment. Actually, the majority of the study area during this sub-period was involved in warmer temperatures due to rapid urbanization, which lowered the temperature difference between NLST levels and changed the area proportion of different LST levels.
Between 2007 and 2016, the main LST transition was from medium temperature (level III) to sub-high temperature (level IV), with the converted area of 79.2 km2. It contributed 76.3% to the inward transfer of level IV and 73.6% to the outward transfer of level III. The next largest transition was that from sub-high temperature (level IV) to medium temperature (level III) (56.9 km2). The interconversions between level III and level IV were scattered in the densely developed areas (Figure 3c).
Overall, between 1987 and 2016 (Figure 3d), 186.7 km2 of sub-high temperature (level IV) was transferred from other LST levels. Among them, 89.4 km2 and 73.5 km2 were from medium temperature (level III) and high temperature (level V), respectively. The transition from level III to level IV was the main contributor to both the inward transfer of level IV (47.9%) and the outward transfer of level III (70.7%).

3.2. Spatiotemporal Variation of Land Use/Land Cover

3.2.1. LULC Spatial Distribution in Different Study Years

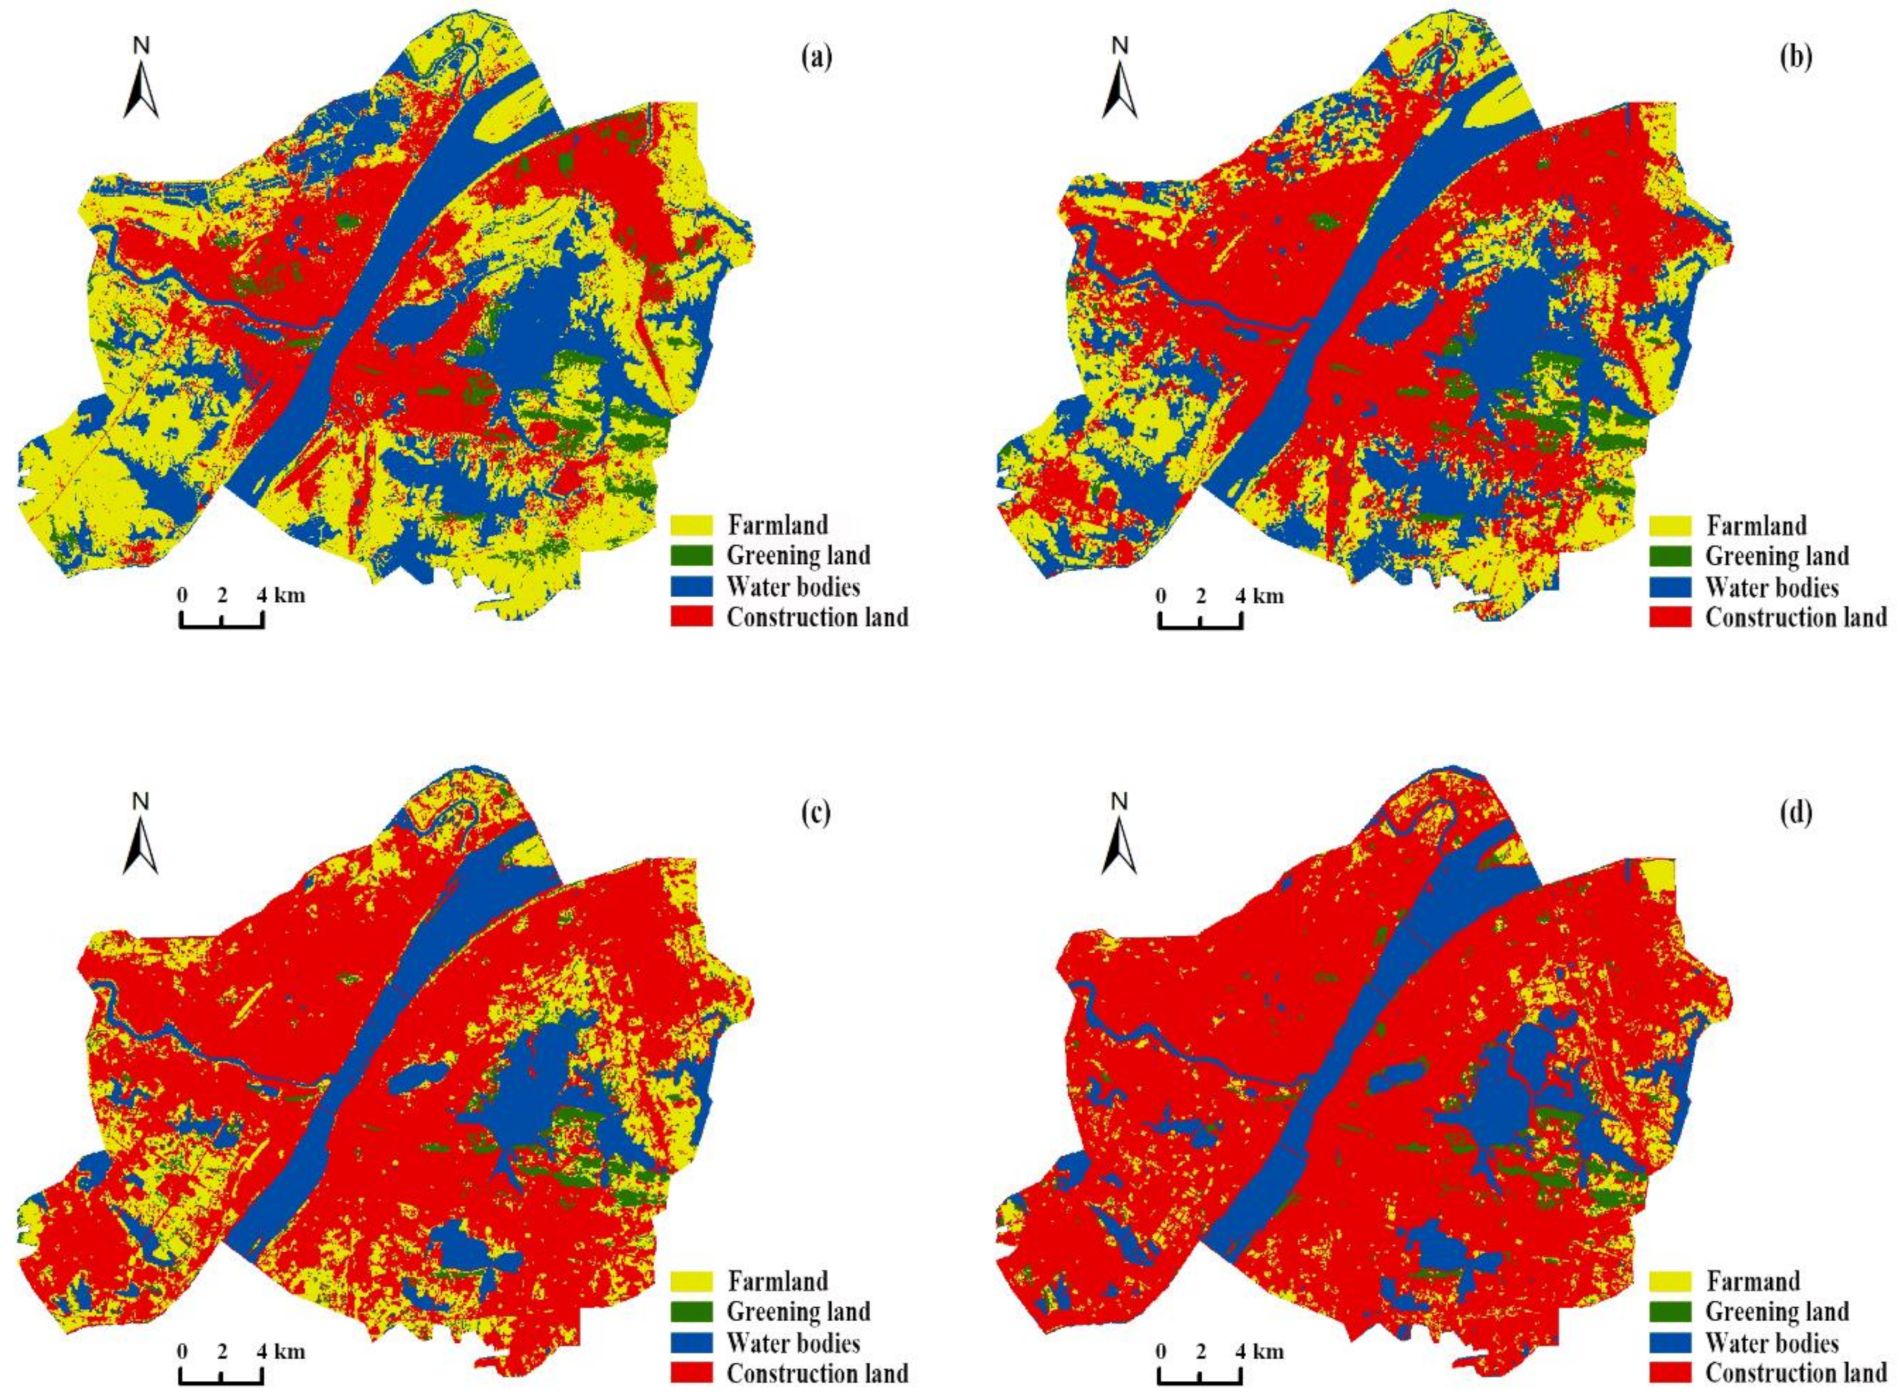
The spatial distribution of different LULC types were mapped in Figure 4, and the related LULC area combined with their area changes from 1987 to 2016 were counted in Table 5 and Table 6. The area of construction land increased from 189.5 km2 in 1987 to 497.4 km2 in 2016, an increase of 162.5% during the 29-year period. The areas of natural surfaces, i.e., farmland, water bodies and greening land, generally decreased. The largest area loss occurred in farmland, which decreased from 264.5 km2 in 1987 to 51.1 km2 in 2016, a decrease of 213.4 km2 (80.7%). Water bodies and greening land followed, with decreases of 82.2 km2 (42.2%) and 12.3 km2 (36.9%) during the entire study period, respectively.
The LULC distribution transitioned from a pattern dominated by farmland in 1987 to construction land in 2016. The construction land was detected to have a continuous area expansion from 1987 to 2016. It covered 27.8% of the study area in 1987 but expanded to 43.0% in 1996, 61.6% in 2007 and 72.9% in 2016. It was mainly distributed in the city core along the Yangtze River and Han River in 1987 (Figure 4a) and gradually sprawled to the third ring road in 1996 and 2007 (Figure 4b,c). In 2016, the majority of the study area was occupied by construction land (Figure 4d). As a result, farmland was gradually encroached, with its area coverage decreasing from 38.8% in 1987 to 25.2% in 1996, 18.6% in 2007 and 7.5% in 2016. Rapid urban expansion led to a drastic increase in the area of construction land and decrease of natural resources.

3.2.2. LULC Variation during 1987–2016

Figure 5 and Table 7 illustrate the LULC dynamics based upon type to transition for the four study periods. Generally, the most dominant land transition was from farmland to construction land in all cases with transition areas of 90.4 km2, 92.4 km2, 88.1 km2 and 218.3 km2 during 1987–1996, 1996–2007, 2007–2016 and 1987–2016, respectively. However, the transition directions and spatial extents varied significantly over different sub-periods.
In the period 1987–1996, the outward transfer of farmland (124.8 km2) was much more than its inward transfer (32.2 km2). The area loss of farmland was mainly returned to construction land (72.4%) and water bodies (22.9%). Farmland was the major contributor to the inward transfer of construction land (78.1%). It was mainly distributed along the newly built roads (Figure 5a).
In the period 1996–2007, the area of construction land increased by 127.0 km2 (shown in Table 6) About 62.2%, 32.6% and 5.18% of the inward transfer of construction land (148.5 km2) were from farmland, water body and greening land, respectively. Besides farmland (102.5 km2), water body had a significant outward transfer with an area of 90.3 km2. Newly expanded built-up area was at the expense of the farmland and water bodies around the city core (Figure 5b).
In the period 2007–2016, the inward transfer of construction land was 105.1 km2, including 88.1 km2 from farmland, 10.8 km2 from green land and 6.1 km2 from water bodies. The outward transfer of farmland was 94.0 km2, 93.2% of which was converted into construction land. As Figure 5c shown, farmland near the third ring-road in Wuhan was almost completely replaced by construction land.
In the entire period 1987–2016, 218.3 km2 of farmland was transferred to construction land. It accounted for 95.4% of the outward transfer of farmland and contributed to 69.2% of the inward transfer of construction land. In addition, the transition of construction land from water bodies and greening land was 78.9 km2 (25.0%) and 18.4 km2 (5.8%), respectively. Figure 5d indicates that the majority of farmland area in the study area was occupied by construction land due to urban expansion. Several large urban lakes, such as Huangtang Lake, East Lake, Shahu Lake and South Prince Lake, were partly occupied by construction land.

3.3. Response of Urban Heat Island Effect to Land Use/Land Cover Change

3.3.1. Spatial Correlation between LULC Types and NLST Levels

Table 8 presents the minimum (MIN), maximum (MAX), average (MEAN) and standard deviation (STDEV) of NLST values for different LULC categories. Similar patterns were detected in all study years. Construction land was covered by the highest average NLST values, ranging from 0.43 to 0.65, followed by farmland (0.28~0.52), greening land (0.27~0.46) and water bodies (0.10~0.13). The significant difference in average NLST values between different LULC categories means that the UHI effect exists in all cases, which could be supported by the spatial consistence between the NLST patterns (Figure 2) and LULC distribution (Figure 4). Due to the impervious surface and associated materials, construction land is characterized by higher radiation absorption and greater thermal capacity [14,24]. Thus, extreme hot spots and heat islands were detected in construction land in all cases. In comparison, the other three natural land covers expressed relatively lower NLST values [26,27]. Among them, water bodies were covered by the lowest NLST values and defined as cool islands. There was an ongoing increase in the STDEV values for almost all the LULC categories from 1987 to 2016, indicating an increasing temperature difference within a certain LULC type. This is partly attributed to closer and closer interaction and interpenetration among different land covers [15,30].
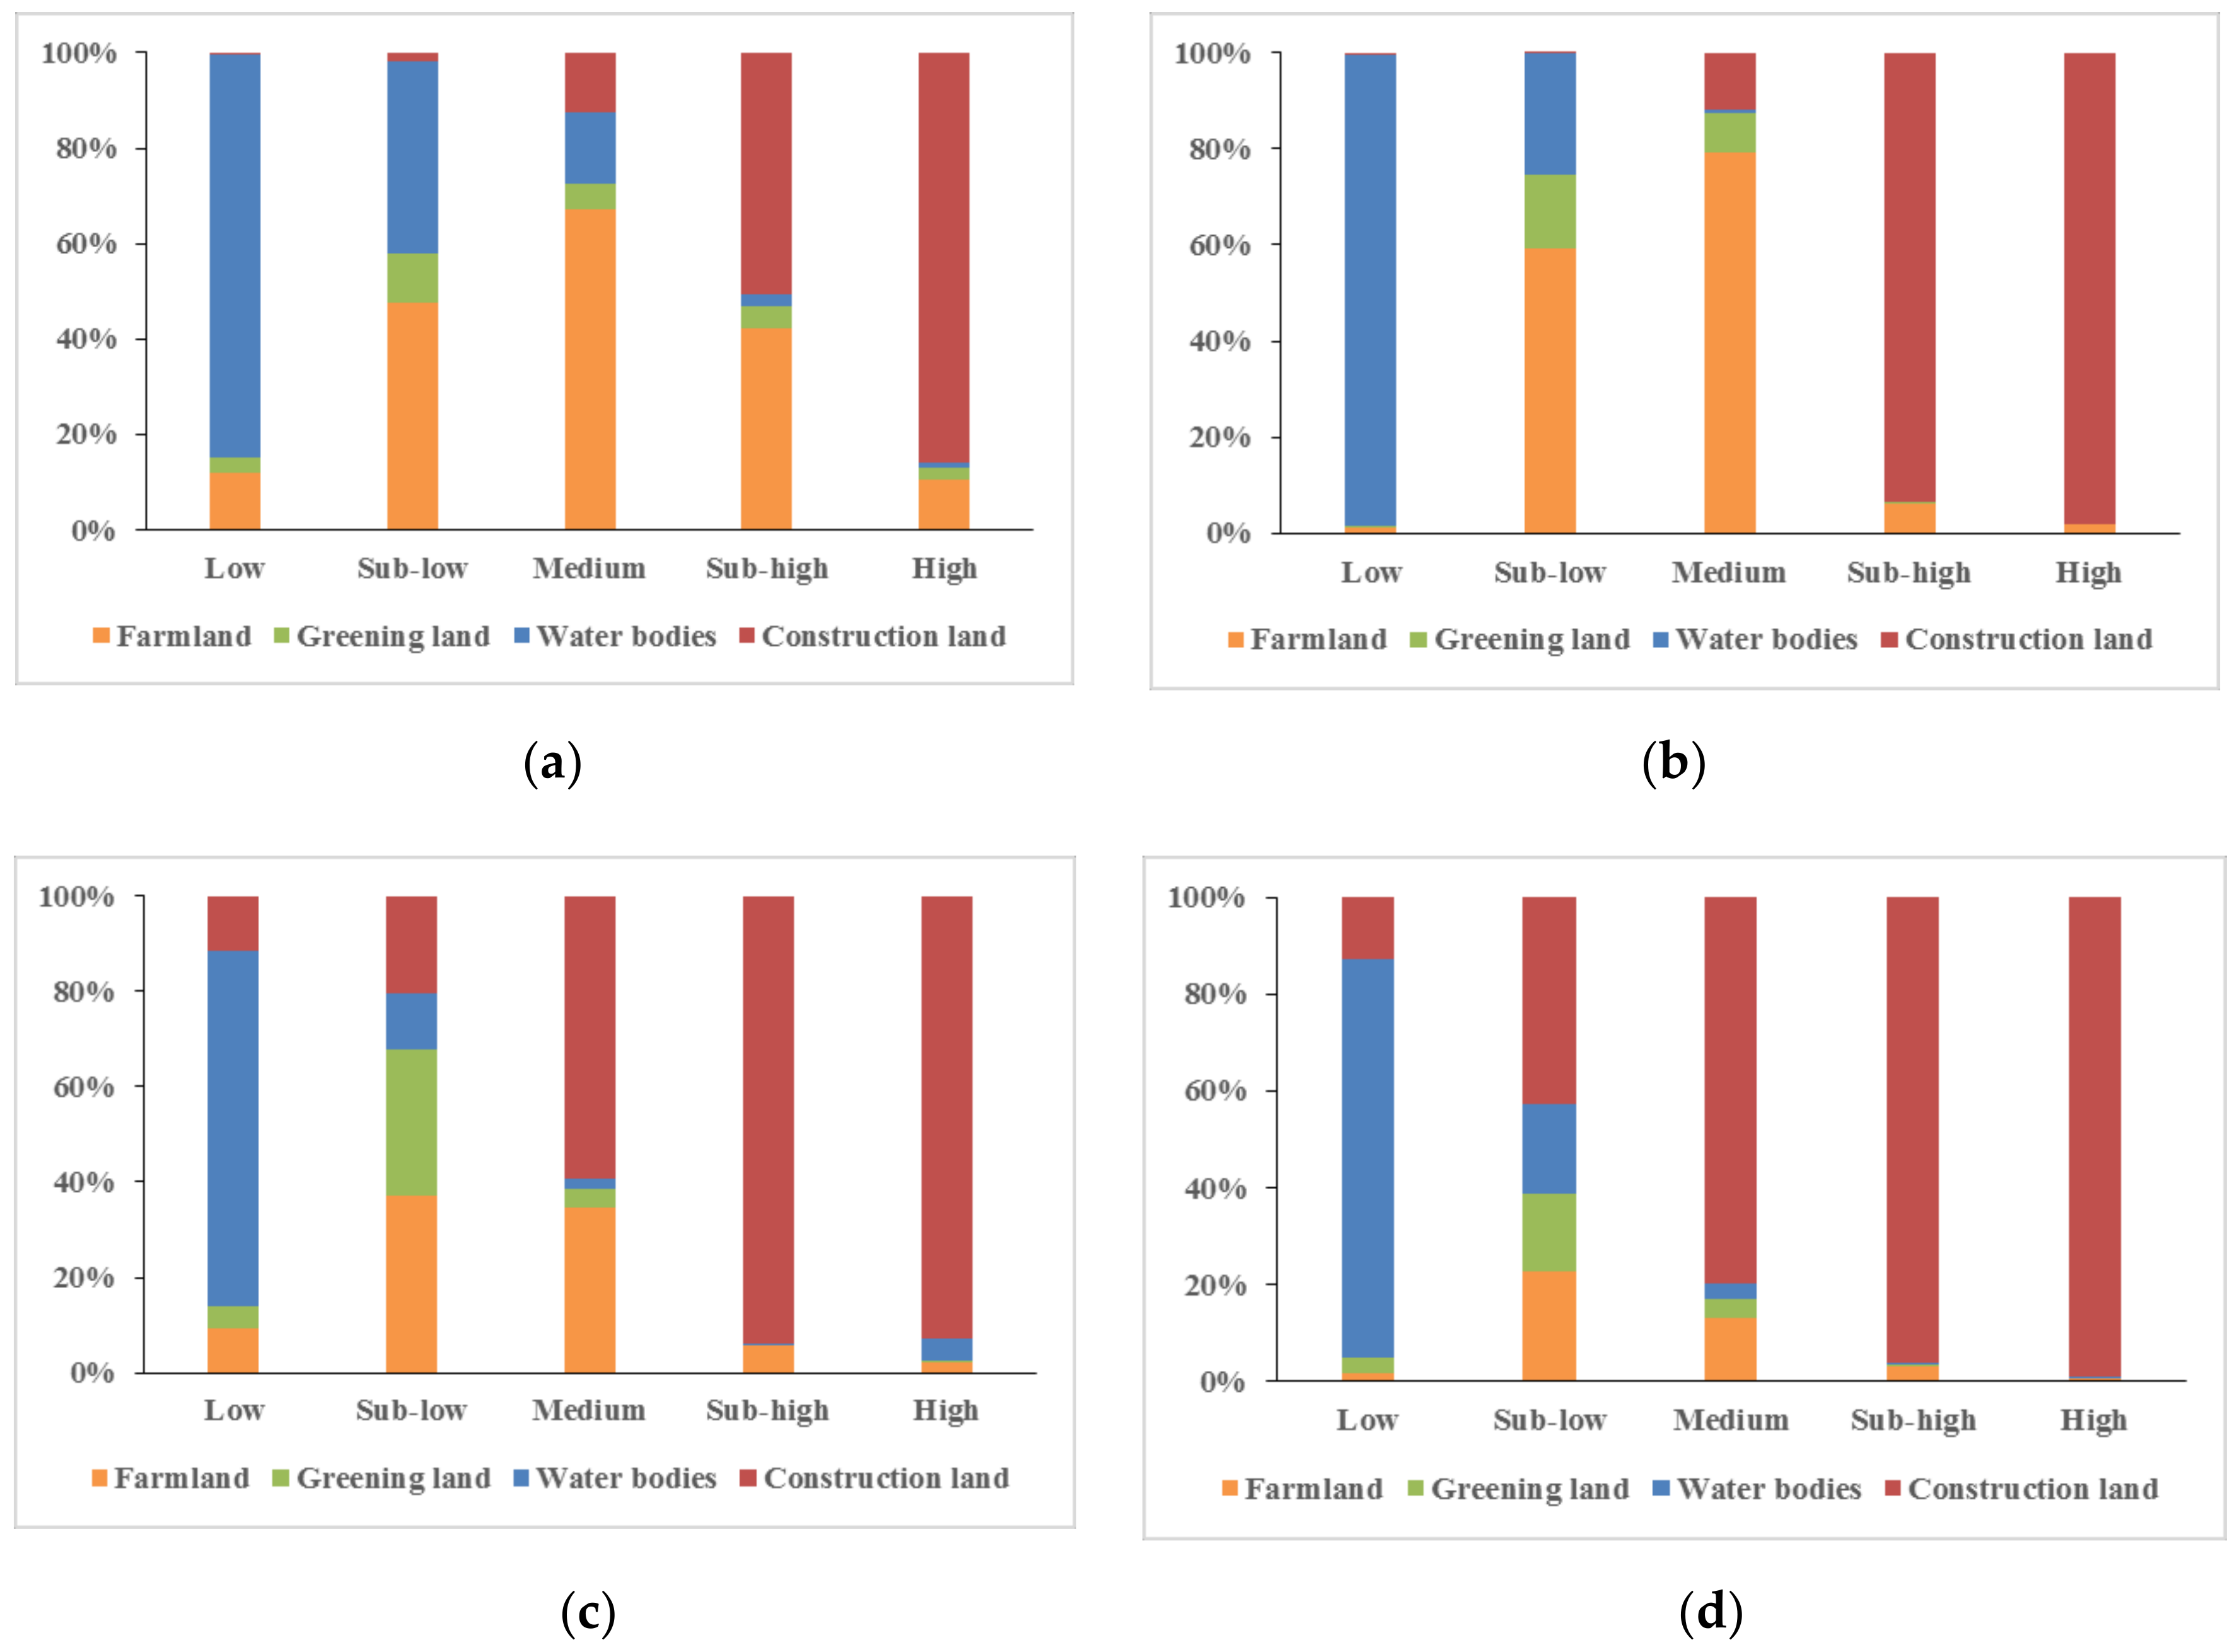
To make the relationship between the NLST and LULC clearer, the area proportion of different LULC types was counted for each NLST level in the four observed years. Figure 6 shows that 74.5~98.1% of low temperature (level I) and 11.5~40.2% of sub-low temperature (level II) were distributed in water bodies. In other words, the Yangtze River, Han River and other large urban lakes were the main contributors to mitigating the UHI effect. However, 85.8~99.2% of high temperature (levels V) and 50.8~96.3% of sub-high temperature (level IV) were concentrated in construction land. The developed areas with dense buildings and interconnected road networks contributed the most to the UHI effect.

3.3.2. Dynamic Response of UHI Evolution to LULC Transition

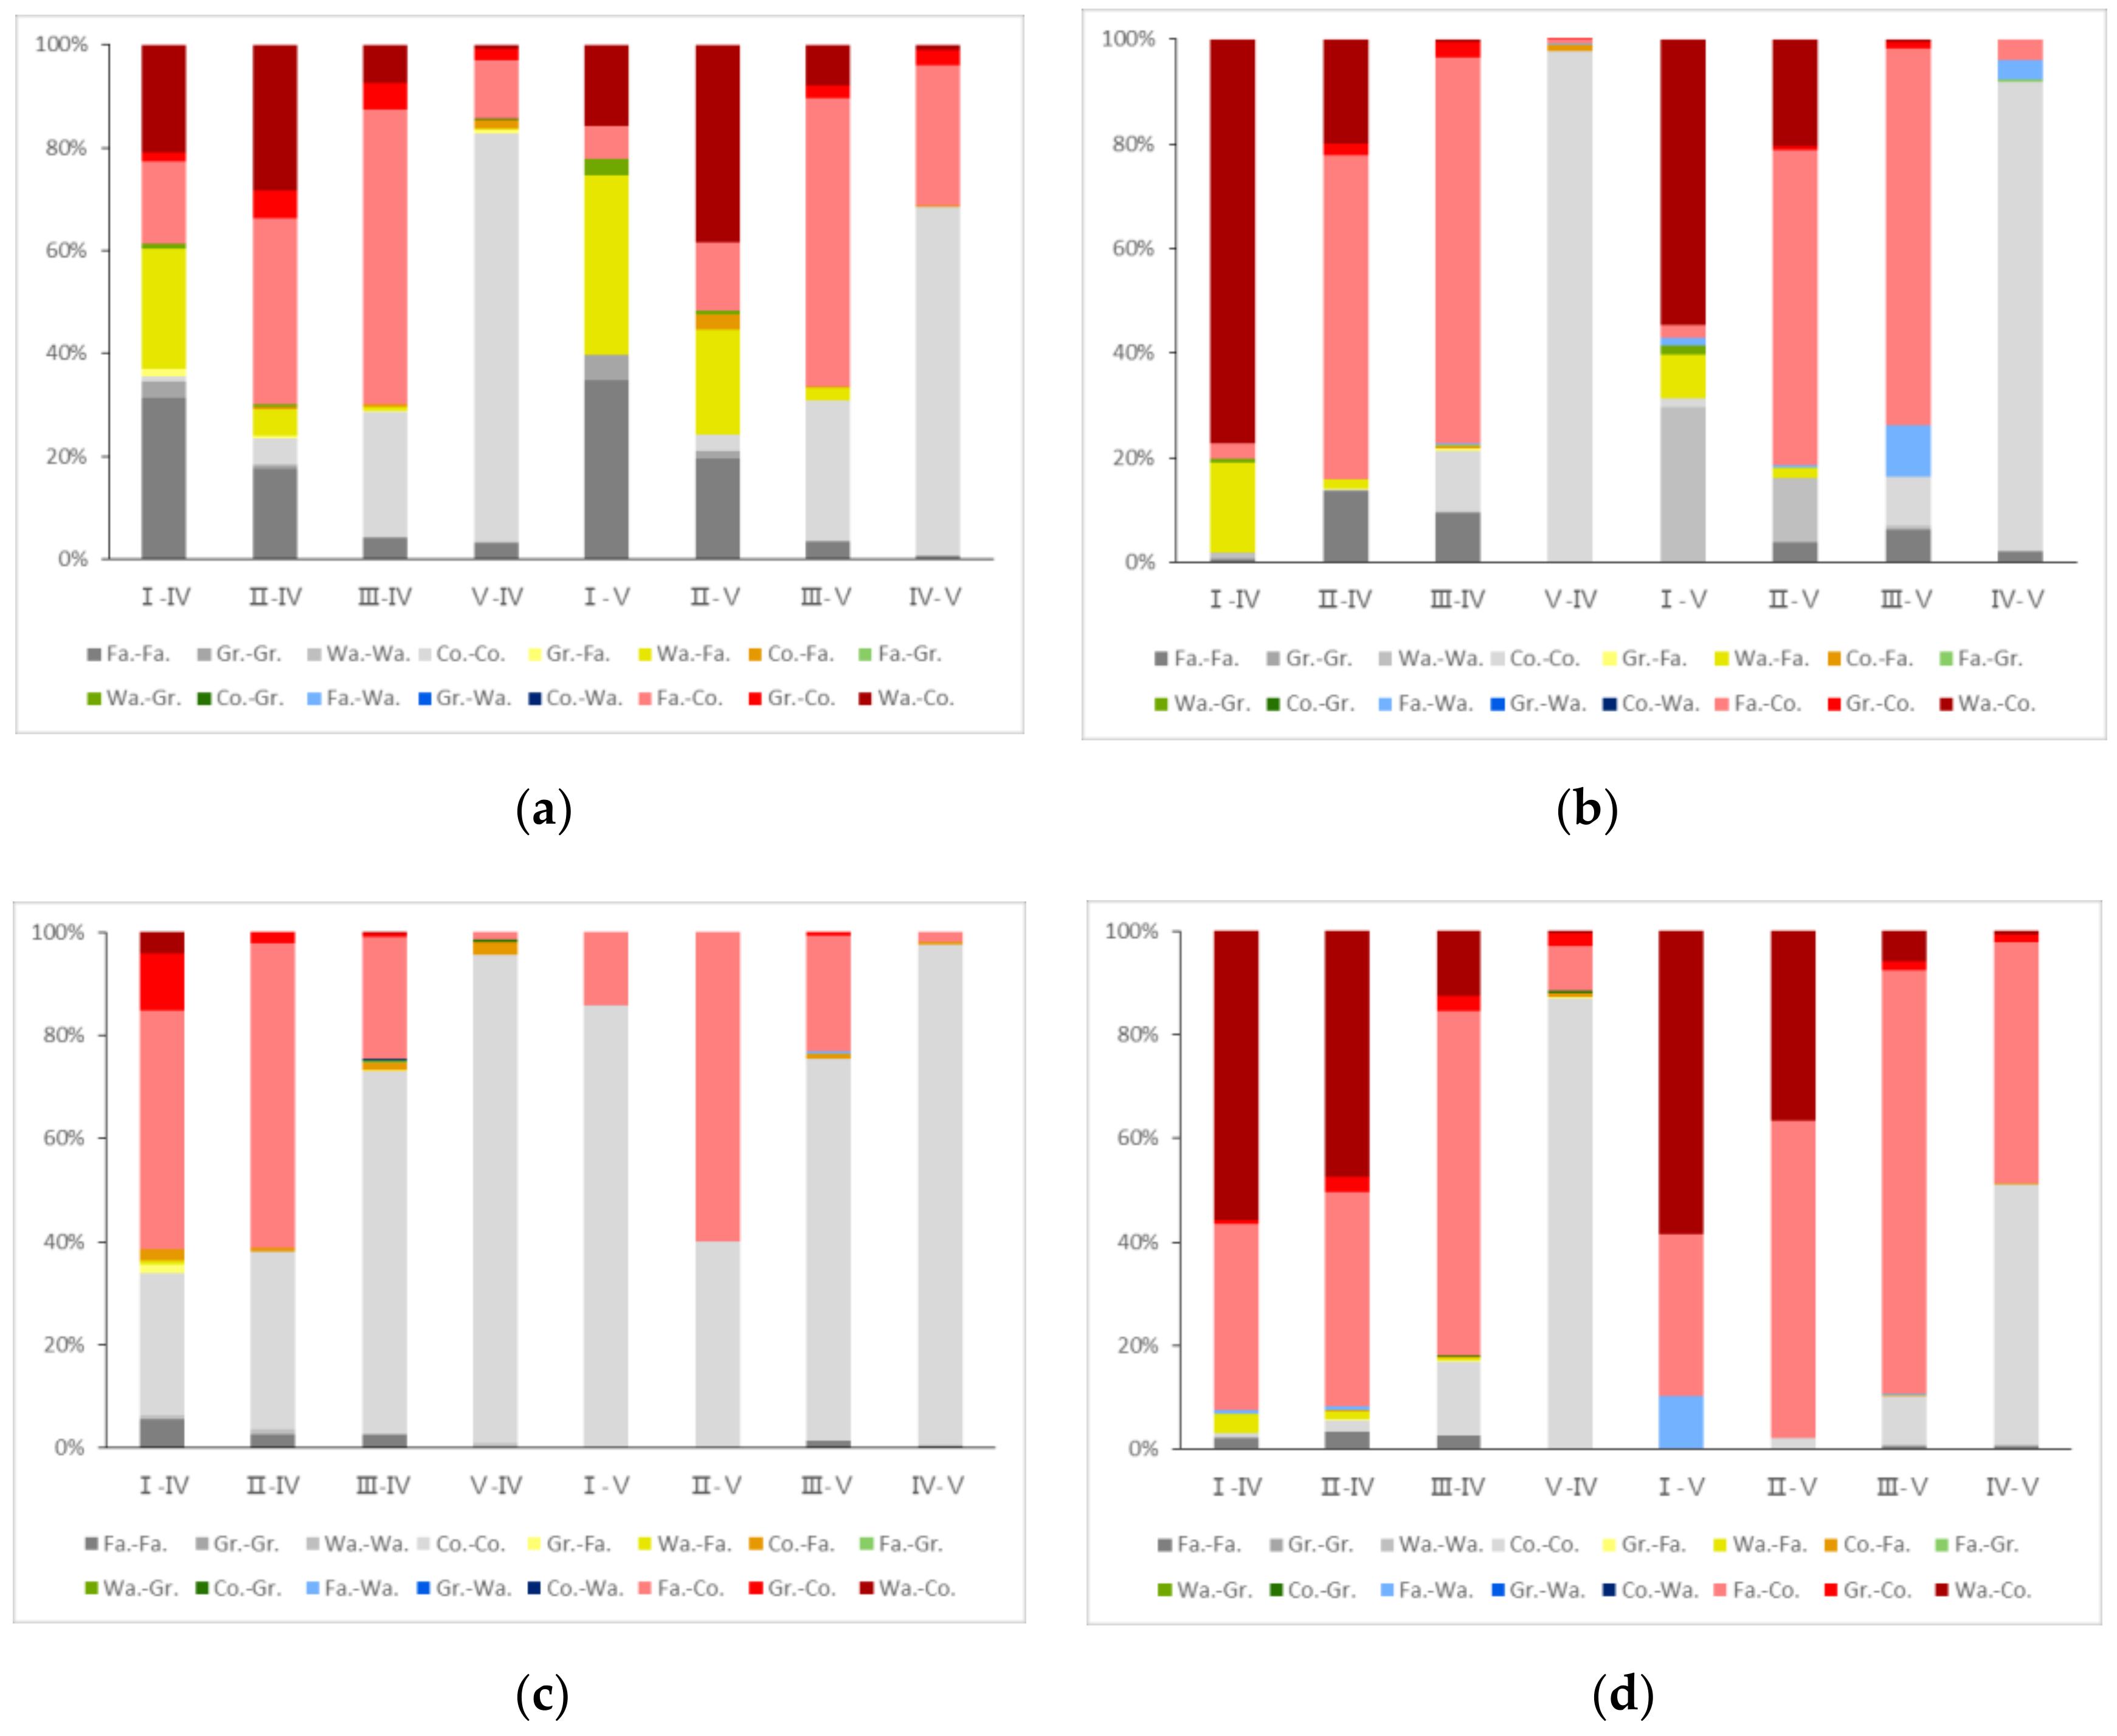
When masking the spatiotemporal variation maps of NLST levels (Figure 3) over the corresponding LULC transition ones (Figure 5) during the observed sub-periods, we found that the thermal characteristic variation did not always correspond to the LULC transition as expected [15,25,29]. To further investigate the dynamic response of the UHI effect to LULC change, the land transition types and their contributions to enhanced NLST levels were counted. Figure 7 illustrates the area proportion of different land transition types for the inward transfer types of high temperature (level V) and sub-high temperature (level IV). In general, the large amount of construction land transferred from other LULC types significantly raised the NLST level and deteriorated the thermal environment [20,26,30,44]. However, the main LULC transitions contributing to thermal deterioration varied in different sub-periods.
During 1987–1996 (Figure 7a), the three main contributors of raising NLST level I to level IV and level V were the land transitions from water bodies to farmland (23.4% and 34.9%), from water bodies to construction land (21.0% and 15.9%) and from farmland to construction land (16.1% and 6.4%). The land transitions from water bodies to construction land and from farmland to construction land contributed 38.3% and 56.1% to thermal variation from level II to level V and from level III to level V, respectively. The conversion of farmland to construction land was the main driving force in a slightly deteriorating thermal environment. For example, it contributed 57.4% to pushing level III to level IV.
During 1996–2007 (Figure 7b), the land transition from water bodies to construction land was the major contributor to the outward transfer of NLST level I to level IV and level V, with contributions of 77.2% and 54.6%, respectively. In addition, the transition from farmland to construction land contributed more than 60% to the inward of UHI levels (levels IV and V) from non-UHI levels (levels II and III). Overall, the inward transfer of construction land from the other LULC types was mainly responsible for the thermal deterioration in this period. Previous studies confirmed that the UHI effect is context sensitive [14,42,46]. Rapid urbanization had significantly changed the context characteristics of the study area during this sub-period, which warmed the whole area but weakened the temperature difference among different LST levels.
During 2007–2016, the mutual transitions among different NLST levels were not frequent (shown in Figure 3 and Table 4) excluding the one from level III to IV, due to relatively stable LULC conditions (Figure 7c). The expansion of construction land slowed obviously in our study area, as urban expansion of Wuhan in this sub-period had sprawled outside the third ring-road [28]. The inward transfer of level IV and level V from other NLST levels was attributed to the land transition from farmland to construction land near the third ring-road.
During 1987–2016 (Figure 7d), on the whole, the land transitions from water bodies and farmland to construction land were responsible for the majority of thermal deterioration. Specifically, the transition of water bodies to construction land was the main driving force in rapidly upgrading NLST level I, leading to 55.8% and 58.6% of level I being converted into level IV and level V, respectively. The transition of farmland to construction land contributed the most to thermal deterioration in the original medium temperature area (level III), pushing 66.3% and 81.6% of level III into level IV and level V, respectively.

4. Conclusions

In this study, multi-temporal remote sensing data during 1987–2016 at intervals of about 10 years were used to monitor the LULC change and UHI variation. A transfer matrix method was carried out to simulate the mutual transformation between different LULC types, as well as different NLST classes over space and time. Then, the spatiotemporal correlation and dynamic response between the UHI effect and LULC change were visualized. It provided detailed information to further understand how LULC change influenced the UHI effect over space and time, based on class-to-class transfer analysis rather than change statistics in the categorized area.
The spatial distributions of NLST levels were detected to strongly correspond with LULC types in all study years. They showed that 85.8~99.2% of high temperature (level V) and 50.8~96.3% of sub-high temperature (level IV) were concentrated in construction land, especially in urban industrial areas and along the main roads in the city core. Construction land was covered by the highest average NLST values, followed by farmland, greening land and water bodies. With the lowest average NLST values, water bodies presented an obvious “cool island” effect.
The most notable changes were the rapid increase in construction land, as well as the continuous shrinkage of farmland and water bodies. The inward transfer of construction land was mainly from farmland and water bodies, with the transferred area of 218.3 km2 (69.2%) and 78.9 km2 (25.0%). To some extent, the rapid urban expansion was at the expense of farmland and water bodies. As a direct response to LULC change, the area of lower temperatures (levels I and II) decreased by 27.9%, a total area loss of 62.5 km2 from 1987 to 2016, while higher temperatures (levels IV and V) increased from 223.1 km2 in 1987 to 280.7 km2 in 2016, an increase of 58.2 km2.
Generally, the land transitions from farmland and water bodies to construction land were responsible for the majority of thermal deterioration. Specifically, the transition of farmland to construction land contributed most to thermal deterioration in the original medium temperature area (level III). The transition of water bodies to construction land was the main driving force in rapidly upgrading NLST level I (low temperature). With the natural resources such as farmland and water bodies increasingly replaced by construction land, the thermal environment was significantly deteriorated. Consequently, more and more people were involved in warmer temperatures and suffered from heatstroke. Nevertheless, the expansion of construction land is irreversible due to the drastic population growth and strong development demand. Therefore, it is necessary to optimize land use structure by building ventilation corridors and protecting large-scale water bodies, so as to fight against the thermal deterioration caused by urbanization.

Author Contributions

Conceptualization, Q.X.; methodology, Q.X. and Q.S.; software, Q.S. and Z.O.; data analysis, Q.S. and Z.O.; writing—review and editing, Q.X. All authors have read and agreed to the published version of the manuscript.

Funding

This research was funded by the Natural Science Foundation of Hubei Province of China (2019CFB538) and the National Natural Science Foundation of China (41401186).

Conflicts of Interest

The authors declare no conflict of interest.

References

  1. Salata, F.; Golasi, I.; Petitti, D.; Vollaro, E.D.L.; Coppi, M.; Vollaro, A.D.L. Relating microclimate, human thermal comfort and health during heat waves: An analysis of heat island mitigation strategies through a case study in an urban outdoor environment. Sust. Cities Soc. 2017, 30, 79–96. [Google Scholar] [CrossRef]
  2. Wong, L.P.; Alias, H.; Aghamohammadi, N.; Aghazadeh, S.; Sulaiman, N.M.N. Urban heat island experience, control measures and health impact: A survey among working community in the city of Kuala Lumpur. Sust. Cities Soc. 2017, 35, 660–668. [Google Scholar] [CrossRef]
  3. Santamouris, M. Recent progress on urban overheating and heat island research. Integrated assessment of the energy, environmental, vulnerability and health impact. Synergies with the global climate change. Energy Build. 2020, 207, 109482. [Google Scholar] [CrossRef]
  4. Kolokotroni, M.; Giannitsaris, I.; Watkins, R. The effect of the London urban heat island on building summer cooling demand and night ventilation strategies. Sol. Energy 2006, 80, 383–392. [Google Scholar] [CrossRef]
  5. Li, X.; Zhou, X.; Yu, S.; Li, H.; Li, W. Urban heat island impacts on building energy consumption: A review of approaches and findings. Energy 2019, 174, 407–419. [Google Scholar] [CrossRef]
  6. Yang, X.; Peng, L.L.H.; Jiang, Z.; Chen, Y.; Yao, L.; He, Y.; Xu, T. Impact of urban heat island on energy demand in buildings: Local climate zones in Nanjing. Appl. Energy 2020, 260, 114279. [Google Scholar] [CrossRef]
  7. Han, S.; Bian, H.; Tie, X.; Xie, Y.; Sun, M.; Liu, A. Impact of nocturnal planetary boundary layer on urban air pollutants: Measurements from a 250-m tower over Tianjin, China. J. Hazard. Mater. 2009, 162, 264–269. [Google Scholar] [CrossRef]
  8. Abbassi, Y.; Ahmadikia, H.; Baniasadi, E. Prediction of pollution dispersion under urban heat island circulation for different atmospheric stratification. Build. Environ. 2019, 168, 106374. [Google Scholar] [CrossRef]
  9. Doan, V.Q.; Kusaka, H.; Nguyen, T.M. Roles of past, present, and future land use and anthropogenic heat release changes on urban heat island effects in Hanoi, Vietnam: Numerical experiments with a regional climate model. Sust. Cities Soc. 2019, 47, 101479. [Google Scholar] [CrossRef]
  10. Basu, R.; Samet, J.M. Relation between elevated ambient temperature and mortality: A review of the epidemiologic evidence. Epidemiol. Rev. 2002, 24, 190–202. [Google Scholar] [CrossRef]
  11. Hattis, D.; Ogneva-Himmelberger, Y.; Ratick, S. The spatial variability of heat-related mortality in Massachusetts. Appl. Geogr. 2012, 33, 45–52. [Google Scholar] [CrossRef]
  12. Johnson, D.P.; Stanforth, A.; Lulla, V.; Luber, G. Developing an applied extreme heat vulnerability index utilizing socioeconomic and environmental data. Appl. Geogr. 2012, 35, 23–31. [Google Scholar] [CrossRef]
  13. Wang, D.; Lau, K.K.-L.; Ren, C.; Goggins, W.B.; Shi, Y.; Ho, H.C.; Lee, T.-C.; Lee, L.-S.; Woo, J.; Ng, E. The impact of extremely hot weather events on all-cause mortality in a highly urbanized and densely populated subtropical city: A 10-year time-series study (2006–2015). Sci. Total Environ. 2019, 690, 923–931. [Google Scholar] [CrossRef] [PubMed]
  14. Ward, K.; Lauf, S.; Kleinschmit, B.; Endlicher, W. Heat waves and urban heat islands in Europe: A review of relevant drivers. Sci. Total Environ. 2016, 569–570, 527–539. [Google Scholar] [CrossRef] [PubMed]
  15. Deilami, K.; Kamruzzaman, M.; Liu, Y. Urban heat island effect: A systematic review of spatio-temporal factors, data, methods, and mitigation measures. Int. J. Appl. Earth Obs. Geoinf. 2018, 67, 30–42. [Google Scholar] [CrossRef]
  16. Sharma, R.; Ghosh, A.; Joshi, P.K. Spatio-temporal footprints of urbanisation in Surat, the Diamond City of India (1990–2009). Environ. Monit. Assess. 2013, 185, 3313–3325. [Google Scholar] [CrossRef] [PubMed]
  17. Morris, K.I.; Chan, A.; Morris, K.J.K.; Ooi, M.C.G.; Oozeer, M.Y.; Abakr, Y.A.; Nadzir, M.S.M.; Mohammed, I.Y.; Al-Qrimli, H.F. Impact of urbanization level on the interactions of urban area, the urban climate, and human thermal comfort. Appl. Geogr. 2017, 79, 50–72. [Google Scholar] [CrossRef]
  18. Salvati, L.; Zambon, I.; Chelli, F.M.; Serra, P. Do spatial patterns of urbanization and land consumption reflect different socioeconomic contexts in Europe? Sci. Total Environ. 2018, 625, 722–730. [Google Scholar] [CrossRef]
  19. Chuai, X.; Huang, X.; Wu, C.; Li, J.; Lu, Q.; Qi, X.; Zhang, M.; Zuo, T.; Lu, J. Land use and ecosystems services value changes and ecological land management in coastal Jiangsu, China. Habitat Int. 2016, 57, 164–174. [Google Scholar] [CrossRef]
  20. Asabere, S.B.; Acheampong, R.A.; Ashiagbor, G.; Beckers, S.C.; Keck, M.; Erasmi, S.; Schanze, J.; Sauer, D. Urbanization, land use transformation and spatio-environmental impacts: Analyses of trends and implications in major metropolitan regions of Ghana. Land Use Pol. 2020, 96, 104707. [Google Scholar] [CrossRef]
  21. Reba, M.; Seto, K.C. A systematic review and assessment of algorithms to detect, characterize, and monitor urban land change. Remote Sens. Environ. 2020, 242, 111739. [Google Scholar] [CrossRef]
  22. Rotem-Mindali, O.; Michael, Y.; Helman, D.; Lensky, I.M. The role of local land-use on the urban heat island effect of Tel Aviv as assessed from satellite remote sensing. Appl. Geogr. 2015, 56, 145–153. [Google Scholar] [CrossRef]
  23. Jamei, E.; Rajagopalan, P.; Seyedmahmoudian, M.; Jamei, Y. Review on the impact of urban geometry and pedestrian level greening on outdoor thermal comfort. Renew. Sust. Energ. Rev. 2016, 54, 1002–1017. [Google Scholar] [CrossRef]
  24. Berihun, M.L.; Tsunekawa, A.; Haregeweyn, N.; Meshesha, D.T.; Adgo, E.; Tsubo, M.; Masunaga, T.; Fenta, A.A.; Sultan, D.; Yibeltal, M. Exploring land use/land cover changes, drivers and their implications in contrasting agro-ecological environments of Ethiopia. Land Use Pol. 2019, 87, 104052. [Google Scholar] [CrossRef]
  25. Sejati, A.W.; Buchori, I.; Rudiarto, I. The spatio-temporal trends of urban growth and surface urban heat islands over two decades in the Semarang Metropolitan Region. Sust. Cities Soc. 2019, 46, 101432. [Google Scholar] [CrossRef]
  26. Singh, P.; Kikon, N.; Verma, P. Impact of land use change and urbanization on urban heat island in Lucknow city, Central India. A remote sensing based estimate. Sust. Cities Soc. 2017, 32, 100–114. [Google Scholar] [CrossRef]
  27. Grigoraș, G.; Urițescu, B. Land Use/Land Cover changes dynamics and their effects on Surface Urban Heat Island in Bucharest, Romania. Int. J. Appl. Earth Obs. Geoinf. 2019, 80, 115–126. [Google Scholar] [CrossRef]
  28. Xie, Q.; Zhou, Z.; Teng, M.; Wang, P. A multi-temporal Landsat TM data analysis of the impact of land use and land cover changes on the urban heat island effect. J. Food Agric. Environ. 2012, 10, 803–809. [Google Scholar]
  29. Silva, J.S.; Silva, R.M.D.; Santos, C.A.G. Spatiotemporal impact of land use/land cover changes on urban heat islands: A case study of Paço do Lumiar, Brazil. Build. Environ. 2018, 136, 279–292. [Google Scholar] [CrossRef]
  30. Yu, Z.; Yao, Y.; Yang, G.; Wang, X.; Vejre, H. Strong contribution of rapid urbanization and urban agglomeration development to regional thermal environment dynamics and evolution. For. Ecol. Manag. 2019, 446, 214–225. [Google Scholar] [CrossRef]
  31. Li, J.; Song, C.; Cao, L.; Zhu, F.; Meng, X.; Wu, J. Impacts of landscape structure on surface urban heat islands: A case study of Shanghai, China. Remote Sens. Environ. 2011, 115, 3249–3263. [Google Scholar] [CrossRef]
  32. Hou, H.; Estoque, R.C. Detecting cooling effect of landscape from composition and configuration: An Urban Heat Island study on Hangzhou. Urban For. Urban Green. 2020, 53, 126719. [Google Scholar] [CrossRef]
  33. Yuan, F.; Bauer, M.E. Comparison of impervious surface area and normalized difference vegetation index as indicators of surface urban heat island effects in Landsat imagery. Remote Sens. Environ. 2007, 106, 375–386. [Google Scholar] [CrossRef]
  34. Mathew, A.; Khandelwal, S.; Kaul, N. Spatial and temporal variations of urban heat island effect and the effect of percentage impervious surface area and elevation on land surface temperature: Study of Chandigarh city, India. Sust. Cities Soc. 2016, 26, 264–277. [Google Scholar] [CrossRef]
  35. Weng, Q.; Lu, D.; Schubring, J. Estimation of land surface temperature-vegetation abundance relationship for urban heat island studies. Remote Sens. Environ. 2004, 89, 467–483. [Google Scholar] [CrossRef]
  36. Raynolds, M.K.; Comiso, J.C.; Walker, D.A.; Verbyla, D. Relationship between satellite-derived land surface temperatures, arctic vegetation types, and NDVI. Remote Sens. Environ. 2008, 112, 1884–1894. [Google Scholar] [CrossRef]
  37. Zhang, Y.; Odeh, I.O.A.; Han, C. Bi-temporal characterization of land surface temperature in relation to impervious surface area, NDVI and NDBI, using a sub-pixel image analysis. Int. J. Appl. Earth Obs. Geoinf. 2009, 11, 256–264. [Google Scholar] [CrossRef]
  38. Chen, X.-L.; Zhao, H.-M.; Li, P.-X.; Yin, Z.-Y. Remote sensing image-based analysis of the relationship between urban heat island and land use/cover changes. Remote Sens. Environ. 2006, 104, 133–146. [Google Scholar] [CrossRef]
  39. Gago, E.J.; Roldan, J.; Pacheco-Torres, R.; Ordóñez, J. The city and urban heat islands: A review of strategies to mitigate adverse effects. Renew. Sust. Energ. Rev. 2013, 25, 749–758. [Google Scholar] [CrossRef]
  40. Li, X.; Zhou, X.; Asrar, G.R.; Imhoff, M.; Li, X. The surface urban heat island response to urban expansion: A panel analysis for the conterminous United States. Sci. Total Environ. 2017, 605–606, 426–435. [Google Scholar] [CrossRef]
  41. Zhou, X.; Chen, H. Impact of urbanization-related land use land cover changes and urban morphology changes on the urban heat island phenomenon. Sci. Total Environ. 2018, 635, 1467–1476. [Google Scholar] [CrossRef] [PubMed]
  42. Sun, Y.; Gao, C.; Li, J.; Wang, R.; Liu, J. Evaluating urban heat island intensity and its associated determinants of towns and cities continuum in the Yangtze River Delta Urban Agglomerations. Sust. Cities Soc. 2019, 50, 101659. [Google Scholar] [CrossRef]
  43. Zhang, H.; Qi, Z.-F.; Ye, X.-Y.; Cai, Y.-B.; Ma, W.-C.; Chen, M.-N. Analysis of land use/land cover change, population shift, and their effects on spatiotemporal patterns of urban heat islands in metropolitan Shanghai, China. Appl. Geogr. 2013, 44, 121–133. [Google Scholar] [CrossRef]
  44. Son, N.-T.; Chen, C.-F.; Chen, C.-R.; Thanh, B.-X.; Vuong, T.-H. Assessment of urbanization and urban heat islands in Ho Chi Minh City, Vietnam using Landsat data. Sust. Cities Soc. 2017, 30, 150–161. [Google Scholar] [CrossRef]
  45. Shifaw, E.; Sha, J.; Li, X.; Bao, Z.; Zhou, Z. An insight into land-cover changes and their impacts on ecosystem services before and after the implementation of a comprehensive experimental zone plan in Pingtan island, China. Land Use Pol. 2019, 82, 631–642. [Google Scholar] [CrossRef]
  46. Deilami, K.; Kamruzzaman, M.; Hayes, J.F. Correlation or causality between Land Cover Patterns and the Urban Heat Island Effect? Evidence from Brisbane, Australia. Remote Sens. 2016, 8, 716. [Google Scholar] [CrossRef] [Green Version]
  47. Xu, H. Retrieval of the reflectance and land surface temperature of the newly-launched Landsat 8 satellite. Chin. J. Geophys. 2015, 58, 741–747. (In Chinese) [Google Scholar]
  48. Jiménez-Muñoz, J.C.; Sobrino, J.A.; Skokovi’, D.; Mattar, C.; Cristóbal, J. Land Surface Temperature retrieval eethods from Landsat-8 thermalinfrared sensor data. IEEE Geosci. Remote Sens. Lett. 2014, 11, 1840–1843. [Google Scholar] [CrossRef]
  49. Sobrino, J.A.; Jimene-Munoz, J.C.; Paolini, L. Land surface temperature retrieval from Landsat TM5. Remote Sens. Environ. 2004, 90, 434–440. [Google Scholar] [CrossRef]
  50. Chander, G.; Markham, B. Revised Landsat-5 TM radiometric calibration procedures and postcalibration dynamic ranges. IEEE Trans. Geosci. Remote Sens. 2003, 41, 2674–2677. [Google Scholar] [CrossRef] [Green Version]
  51. Chavez, P.S. Image-based atmospheric corrections-revisited and improved. Photogramm. Eng. Remote Sens. 1996, 62, 1025–1036. [Google Scholar]
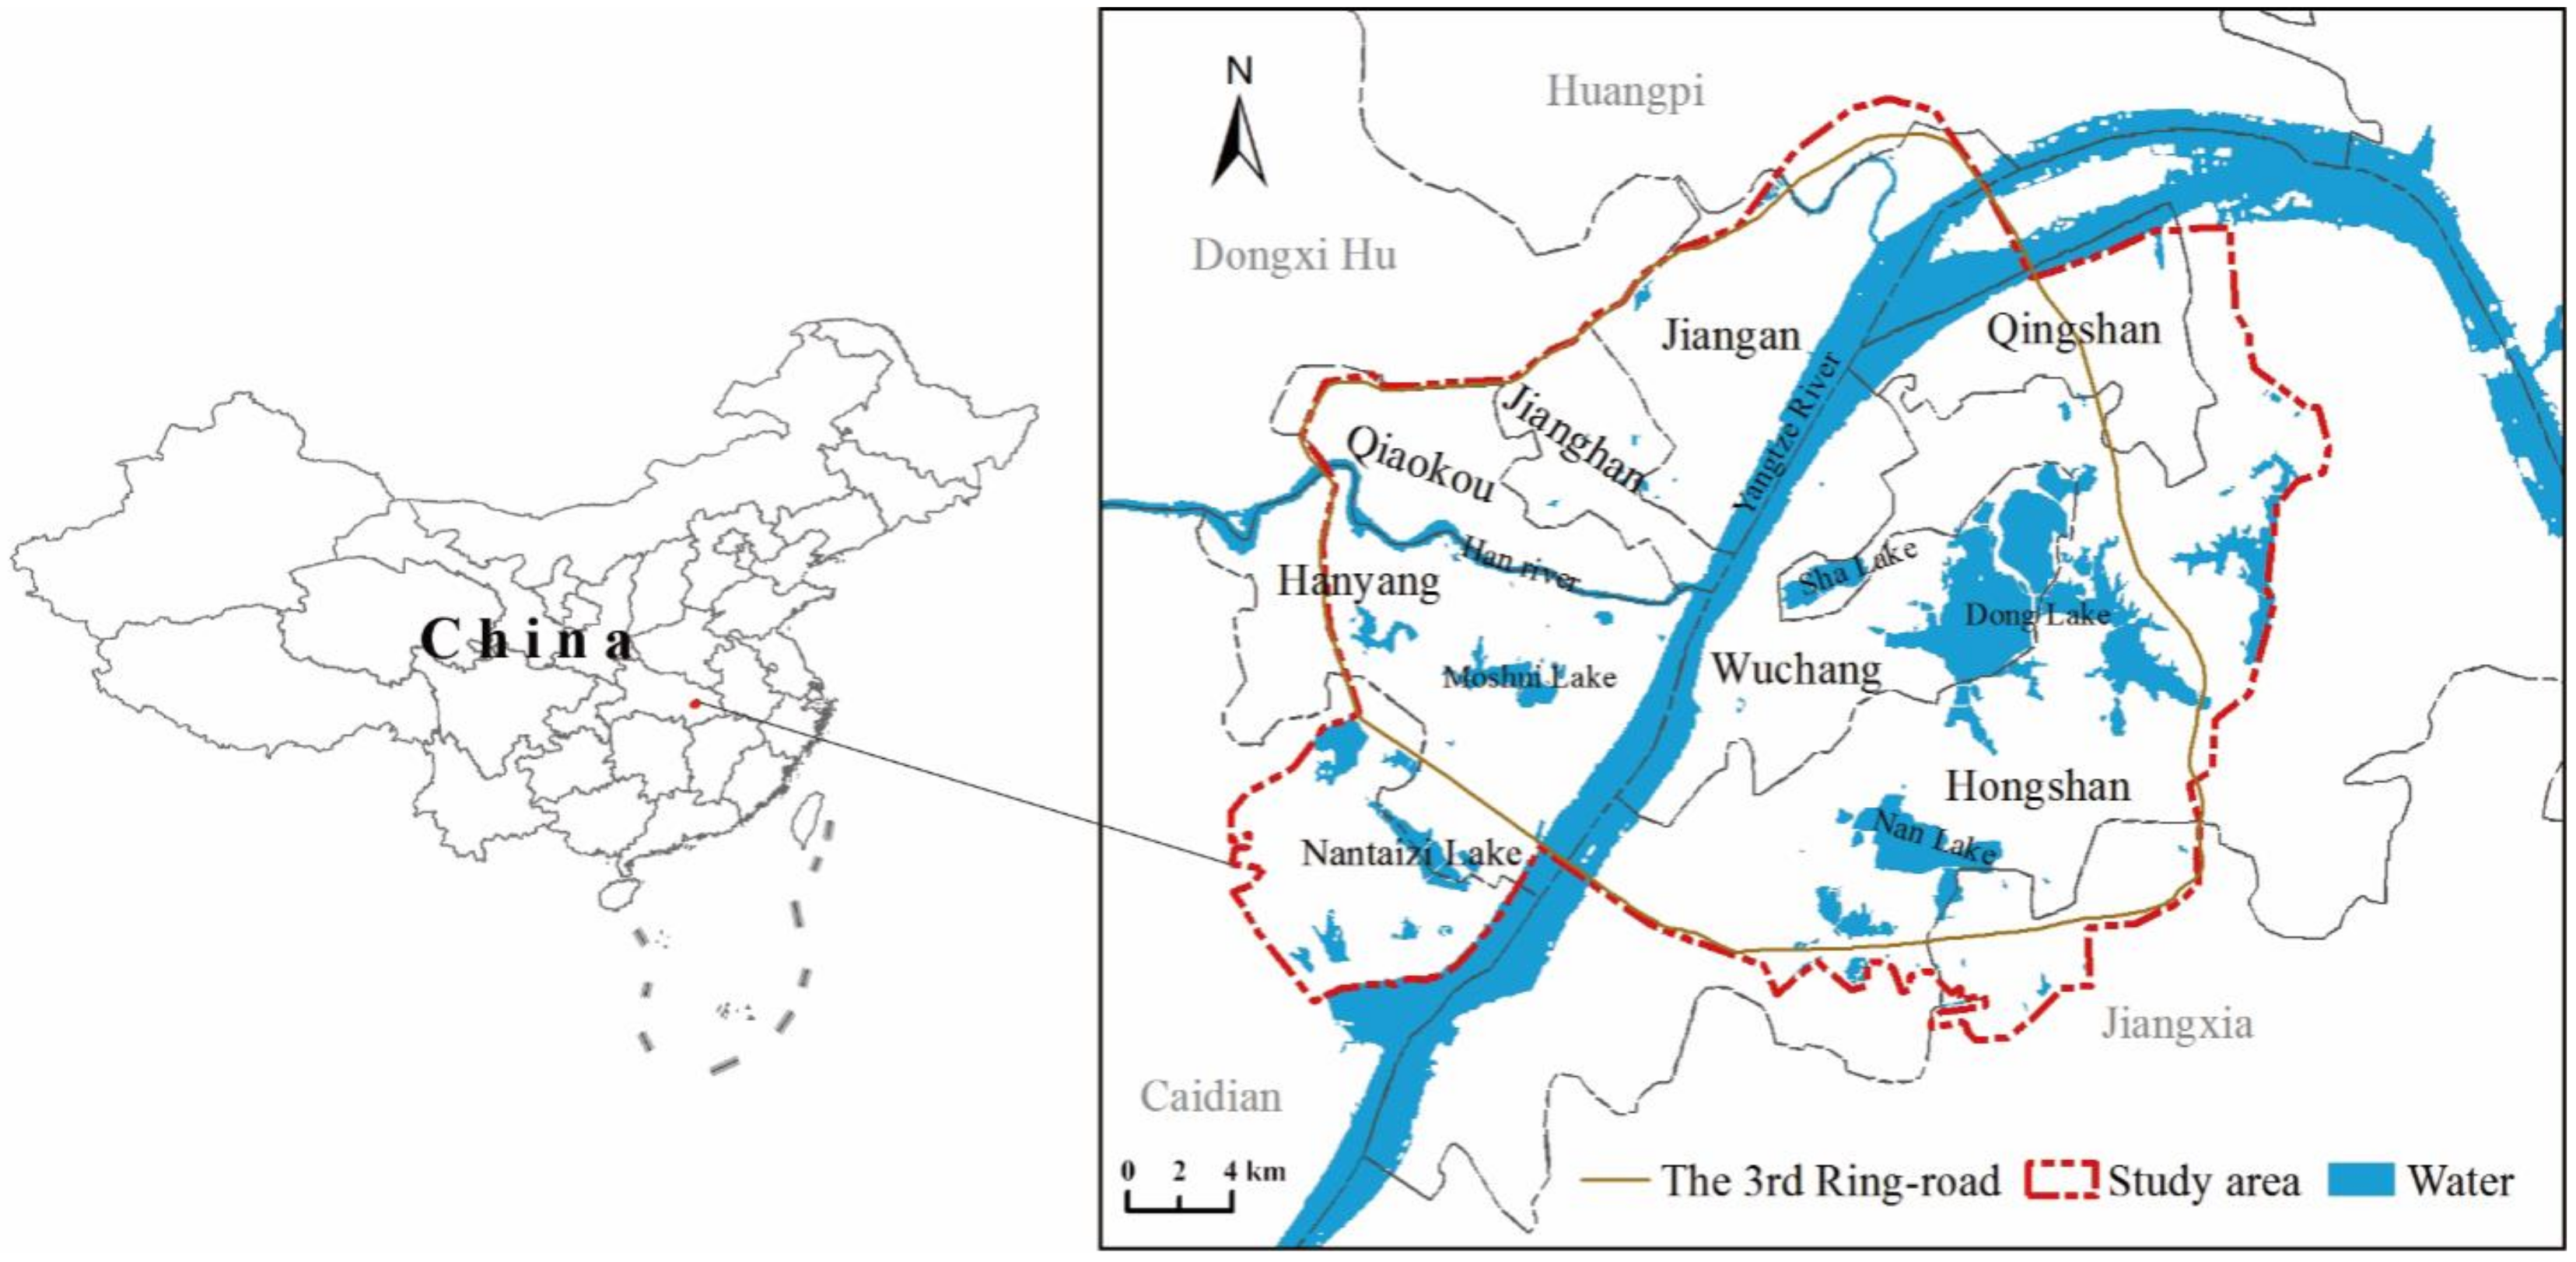
Figure 1. The location of the study area.
Applsci 10 09020 g001
Figure 2. Spatial distribution maps of normalized land surface temperature (NLST) levels in 1987 (a), 1996 (b), 2007 (c) and 2016 (d).
Applsci 10 09020 g002
Figure 3. NLST variation maps during 1987–1996 (a), 1996–2007 (b), 2007–2016 (c) and 1987–2016 (d).
Applsci 10 09020 g003
Figure 4. Spatial distribution of land use/land cover in 1987 (a), 1996 (b), 2007 (c) and 2016 (d).
Applsci 10 09020 g004
Figure 5. LULC transition maps during 1987–1996 (a), 1996–2007 (b), 2007–2016 (c) and 1987–2016 (d).
Applsci 10 09020 g005
Figure 6. Area proportion of different LULC types for each NLST level during 1987 (a), 1996 (b), 2007 (c) and 2016 (d).
Applsci 10 09020 g006
Figure 7. Area proportion of different LULC transitions for the inward transfer types of high temperature (level V) and sub-high temperature (level IV) during 1987–1996 (a), 1996–2007 (b), 2007–2016 (c) and 1987–2016 (d). In the legend, Fa., Gr., Wa. and Co. represent LULC types, namely farmland, greening land, water body and construction land, respectively. The symbol “-” indicates the transition process between different LULC types. For example, Gr.-Fa. represents the conversion from greening land to farmland.
Applsci 10 09020 g007
Table 1. Data details of the Landsat images used in this study.
SensorDate of AcquisitionPath/RowResolution (m)Cloud Cover (%)Thermal Infrared Band
Landsat-5 TM1987/09/26123/03930/1200.00band 6
Landsat-5 TM1996/10/04123/03930/1200.01band 6
Landsat-5 TM2007/07/31123/03930/1200.47band 6
Landsat-8 OLI/TIRS2016/07/23123/03930/1000.41band 10/band 11
Table 2. Area statistics of different NLST levels in 1987, 1996, 2007 and 2016 in Wuhan (km2).
NLST Level1987199620072016
Area%Area%Area%Area%
ILow149.822.0181.926.7130.619.2117.117.2
IISub-low74.310.958.98.631.24.644.66.5
IIIMedium234.834.4155.322.8257.937.8239.235.1
IVSub-high95.314.0145.121.3216.231.7234.434.4
VHigh127.818.7140.820.746.16.846.96.9
Table 3. Area changes (km2) of each NLST level during four observed sub-periods in Wuhan.
NLST Level1987–19961996–20072007–20161987–2016
Area Change%Area Change%Area Change%Area Change%
ILow32.221.5−51.4−28.2−13.5−10.3−32.7−21.8
IISub-low−15.4−20.8−27.7−47.013.442.9−29.8−40.1
IIIMedium−79.6−33.9102.766.1−18.8−7.34.31.8
IVSub-high49.852.371.149.018.28.4139.1145.9
VHigh13.110.2−94.7−67.20.71.6−80.9−63.3
Table 4. Transfer matrix among different NLST levels during 1987–2016 (km2).
PeriodNLST LevelLowSub-LowMediumSub-HighHighTotal
1987–1996Low-11.610.0.1.20.623.4
Sub-low27.0-27.04.51.359.8
Medium26.629.2-67.718.0141.5
Sub-high1.12.719.0-27.850.5
High0.90.86.127.0-34.7
Total55.644.361.9100.447.7-
1996–2007Low-9.937.710.42.360.3
Sub-low4.4-31.112.11.649.2
Medium3.410.0-39.66.159.1
Sub-high0.81.466.9-8.677.7
High0.30.226.186.6-113.3
Total9.021.5161.8148.818.6-
2007–2016Low-12.513.13.00.128.6
Sub-low5.0-12.62.80.120.4
Medium5.119.1-79.24.2107.6
Sub-high2.81.656.9-24.485.7
High2.20.66.318.9-28.0
Total15.133.888.8103.828.7-
1987–2016Low-17.224.57.60.349.5
Sub-low7.6-35.916.31.861.6
Medium5.812.4-89.418.9126.4
Sub-high1.31.536.6-8.347.7
High2.10.833.873.5-110.1
Total16.831.8130.8186.729.2-
Note: For each study period, the NLST categories in the columns represent the NLST levels at the start time point, and those in rows indicate the NLST levels at the end time point. The values are the transferred area from the NLST level of the start time point to that of the end time point. For example, the value “11.6” means that 11.6 km2 of low temperature (level I) was transferred into sub-low temperature (level II) during 1987–1996.
Table 5. Area statistics of different land use/land cover (LULC) categories in 1987, 1996, 2007 and 2016 in Wuhan (km2).
LULC Category1987199620072016
Area%Area%Area%Area%
Farmland (Fa.)264.538.8171.925.2126.618.651.17.5
Greening land (Gr.)33.34.923.03.426.43.921.03.1
Water bodies (Wa.)194.728.6194.128.5108.916.0112.516.5
Construction land (Co.)189.527.8293.143.0420.161.6497.472.9
Table 6. Area changes (km2) of each LULC category during four observed sub-periods in Wuhan.
LULC Category1987–19961996–20072007–20161987–2016
Area Change%Area Change%Area Change%Area Change%
Farmland (Fa.)−92.7−35.0−45.3−26.4−75.5−59.6−213.4−80.7
Greening land (Gr.)−10.3−31.03.414.8−5.4−20.4−12.3−36.9
Water bodies (Wa.)−0.6−0.3−85.2−43.93.63.3−82.2−42.2
Construction land (Co.)103.654.7127.043.477.318.4307.9162.5
Table 7. Transfer matrix among different LULC categories during 1987–2016 in Wuhan (km2).
PeriodLULC CategoryFarmlandGreening LandWater BodiesConstruction LandTotal
1987–1996Farmland-5.828.690.4124.8
Greening land7.2-1.311.019.5
Water bodies17.51.1-14.332.9
Construction land7.52.22.4-12.1
Total32.29.132.3115.7-
1996–2007Farmland-5.64.592.4102.5
Greening land3.8-0.27.711.7
Water bodies34.37.5-48.590.3
Construction land19.12.00.5-21.5
Total57.215.15.2148.5-
2007–2016Farmland-3.82.188.194.0
Greening land2.8-0.710.814.3
Water bodies0.50.3-6.16.9
Construction land15.34.87.6-27.8
Total18.59.010.5105.1-
1987–2016Farmland-4.95.7218.3228.9
Greening land3.5-0.118.422.0
Water bodies7.91.6-78.988.5
Construction land4.13.20.4-7.7
Total15.59.76.3315.6-
Table 8. Normalized land surface temperature in different LULC categories, minimum (MIN), maximum (MAX), average (MEAN) and standard deviation (STDEV).
YearNLSTFarmlandGreening LandWater BodiesConstruction Land
1987MIN0.000.000.000.12
MAX0.690.590.730.94
MEAN0.280.270.130.43
STDEV0.090.110.090.08
1996MIN0.000.000.000.00
MAX0.980.970.960.99
MEAN0.360.320.100.64
STDEV0.120.110.100.11
2007MIN0.000.000.000.00
MAX0.940.990.990.99
MEAN0.420.380.130.65
STDEV0.130.120.150.12
2016MIN0.070.060.000.00
MAX0.900.690.891.00
MEAN0.520.460.120.64
STDEV0.120.230.150.14
Publisher’s Note: MDPI stays neutral with regard to jurisdictional claims in published maps and institutional affiliations.