Article

Effect of Thermal Exposure on Oil Shale Saturation and Reservoir Properties

1
Center for Hydrocarbon Recovery, Skolkovo Institute of Science and Technology, 121205 Moscow, Russia
2
Department of Geology and Oil and Gas Production, Tyumen Industrial University, 625000 Tyumen, Russia
*
Author to whom correspondence should be addressed.
Appl. Sci. 2020, 10(24), 9065; https://doi.org/10.3390/app10249065
Submission received: 15 November 2020 / Revised: 7 December 2020 / Accepted: 8 December 2020 / Published: 18 December 2020
(This article belongs to the Special Issue Advanced Oil Recovery Technologies)

Abstract

:
The experimental and numerical modeling of thermal enhanced oil recovery (EOR) requires a detailed laboratory analysis of core properties influenced by thermal exposure. To acquire the robust knowledge on the change in rock saturation and reservoir properties, the fastest way is to examine the rock samples before and after combustion. In the current paper, we studied the shale rock properties, such as core saturation, porosity, and permeability, organic matter content of the rock caused by the combustion front propagation within the experimental modeling of the high-pressure air injection. The study was conducted on Bazhenov shale formation rock samples. We reported the results on porosity and permeability evolution, which was obtained by the gas pressure-decay technique. The measurements revealed a significant increase of porosity (on average, for 9 abs. % of porosity) and permeability (on average, for 1 mD) of core samples after the combustion tube experiment. The scanning electron microscopy showed the changes induced by thermal exposure: the transformation of organic matter with and the formation of new voids and micro and nanofractures in the mineral matrix. Low-field Nuclear Magnetic Resonance (NMR) was chosen as a primary non-disruptive tool for measuring the saturation of core samples in ambient conditions. NMR T1–T2 maps were interpreted to determine the rock fluid categories (bitumen and adsorbed oil, structural and adsorbed water, and mobile oil) before and after the combustion experiment. Changes in the distribution of organic matter within the core sample were examined using 2D Rock-Eval pyrolysis technique. Results demonstrated the relatively uniform distribution of OM inside the core plugs after the combustion.

1. Introduction

Unconventional reserves are of strategic importance to replenish the resource base in Russia and worldwide, and their successful development can play a crucial role in increasing oil production and repeatedly compensate for the decline in production from depleted traditional reservoirs [1,2,3].
Recently, thermal enhanced oil recovery methods have attracted a high level of interest because of their possible application to shale reservoirs [4,5]. One of the effective techniques is high-pressure air injection (HPAI), which involves the initiation of an oxidation front in the formation which does not only displace the oil by combustion gases, heated fluids, and steam but also causes an increase in the reservoir pressure and temperature [6,7]. The necessary critical conditions in the formation can be achieved artificially, in the laboratory by an external impact on the rock, for example, by thermal exposure. The most critical experiment for evaluating the effect and obtaining technological parameters is a combustion tube test [7,8]. The combustion tube (CT) test is the physical modeling of thermal exposure on porous media in formation conditions. It is conducted to assess the HPAI potential for a particular reservoir type as well as to obtain parameters for further upscaling of the technology in the field.
High-temperature exposure results in a significant evolution of the shale porosity and permeability due to kerogen transformation. This affects the reservoir properties and leads to a change in the rock’s porous structure and the expansion of the stimulated reservoir area. The change in petrophysical properties during thermal conversion is often evaluated by defining the porosity and permeability change [9]. Multiple studies are devoted to the study of the pore evolution during the controlled pyrolysis of the shales [10,11,12]. According to the published studies, heating (pyrolysis) of organic-rich shales generally leads to an increase in porosity and pore connectivity [13,14,15]. Tiwari et al. [16] investigate the oil shale before and after the pyrolysis and demonstrates changes in the pore structure of raw and pyrolyzed shale using X-Ray microcomputed tomography. They showed a porosity increase of 20–25% as a result of heating to a temperature of 500 °C. Kobchenko et al. demonstrated the first micro-fractures nucleation at a temperature of 350 °C using advanced real-time 3D X-Ray tomography [13]. Also, in the latter study [14], they stated that the reason for this fracturing is the expansion of organic matter (OM). Using a similar approach of 3D X-Ray tomography, Saif et al. noticed that a significant increase of porosity occurs at a temperature of 390° C (up to 20–25%); further heating mainly causes the growth of the pore connectivity [15]. Different essential factors in rock pyrolysis, such as confinement, are considered in the papers by [17,18,19]. Birdwell et al. and Lewan et al. reported intensive fracture evolution in Woodford Shale samples detected with X-ray tomography during hydrous pyrolysis with uniaxial confinement and absence of fractures without external forces [17]. The authors confirmed their conclusions in [18] and demonstrated minor lateral extension and absence of vertical fractures under uniaxial confining stress during the heating. Washburn et al. and Birdwell et al. showed an increase of liquid components with increasing thermal stress using NMR in [19]. To assess the changes in shale pore structure, a number of advanced laboratory techniques can be applied. For instance, Liu et al. presented the results on the evolution of oil shale pore structure from 23 to 650 °C by simulating in-situ pyrolysis using a TGA, MIP, and LPNA [20]. To estimate the organic matter (OM) transformation, pyrolytic chromatography of rock samples by the Rock-Eval method is required before and after the combustion. The parameters may serve as engineering guidelines for in-situ combustion or other HPHT processes [21].
To get a full picture of the changes before and after the thermal exposure during the combustion test, it is necessary to provide a detailed laboratory analysis of the core samples [9,22]. In the physical modeling of the combustion process, the tube is typically filled with unconsolidated core or core chips. However, the use of the crushed core pack is beside the purpose as the shale is characterized by low porosity and permeability. It is complicated to evaluate the saturation of the rock and kerogen conversion in the crushed samples caused by physical and chemical changes. First, one of the tasks of the current study was to investigate and analyze the petrophysical and geochemical rock properties caused by front propagation and oil displacement in organic-rich consolidated core samples (standard cylinders). The second was to select and check the viability of advanced laboratory techniques to control and to evaluate these changes.
One of the conventional methods for determining reservoir properties is standard pressure pulse-decay permeametry [23]. The investigation of reservoir properties of shale samples requires new or modified methodologies in comparison with ones adopted for the study of conventional reservoir rocks [24,25]. The reason is the low porosity and permeability values, the high content of organic matter (mainly solid) insoluble in organic solvents phase (kerogen), and the presence of high-carbon bitumen. Among the recent technologies used in studies of unconventional reservoirs, attention is paid to the identification of the fluids based on NMR relaxometry [26]. Low-field NMR relaxometry is often used as a non-destructive tool for determining the saturation and pore space structure of the low-porosity organic-rich rock [26,27,28]. Therefore, the main potential of kerogen-containing rocks is associated with the volume of hydrocarbons that can be generated from a unit volume of rock. In addition to the reservoir properties and liquid saturation, it is important to characterize the OM properties by Rock-Eval pyrolysis.
There are several ways to investigate the micromorphology of the samples [29,30]. Atomic force microscopy (AFM) allows for a detailed investigation of the sample surface with the calculation of morphological parameters [30]. Scanning electron microscopy (SEM) is widely used for the evaluation of rock texture and microstructure with secondary electron and backscattered electron detection in shales [29]. SEM was chosen as the method for studying the pores of nanometer size. The integration of the set of experimental techniques (gas permeametry, NMR, Rock-Eval pyrolysis, and SEM) allowed us to investigate the dynamics of changes in the physicochemical state of rock samples before and after exposure
In our previous papers, we presented the results of thermal exposure to source rock and the results of experimental and numerical simulation of thermal EOR on an example of the local shale Bazhenov Formation (BF) [31,32,33].
The Bazhenov Formation is one of the most prominent shale formations in the world, and it is characterized by a complex lithological structure, a high quantity of viscous components, and heterogeneity of the rock [34]. That is why thermal enhanced oil recovery techniques should be developed to unlock the oil shale potential [35]. The results of laboratory modeling of various thermal recovery methods for the Bazhenov Formation are presented in many publications [31,36,37]. In this study, we analyze the influence of thermal and oxidation exposure on petrophysical (porosity, permeability, saturation) and geochemical properties (OM quality) on the case of Bazhenov Formation rock samples. All the studies are conducted on standard-sized core plugs located inside the combustion tube.

2. Materials and Methods

2.1. Materials

The Bazhenov Formation (BF) is located in the Russian Federation with an overall area >106 km2 [2]. Stratigraphically BF is Upper Jurassic–Lower Cretaceous rock represented by organic-rich mixed carbonate-clay-siliceous rocks. The BF is located over most of the West Siberian Petroleum Basin with a variable thickness of 15–80 m and with an average of 25–30 m (Figure 1) [38]. Bazhenov oil shales were deposited in the deep marine environment characterized by anoxia. According to the Lazar classification [39], the Bazhenov rock samples are composed of different types of siliceous, argillaceous-siliceous and carbonate-argillaceous-siliceous rocks, which are enriched with OM. The organic matter (OM) contains the total organic carbon (TOC) in a range of 2 to 18 wt.% [40,41] and consists of kerogen, insoluble solid organic matter, and generating hydrocarbons, the quantity of which depends on the stage of maturity. The average mineral composition of the Bazhenov Formation is listed in Table 1.

2.2. Combustion Tube

This research was designed to investigate the change in reservoir rock properties and kerogen conversion induced by the temperature they were exposed to in the combustion tube experiment, the results of which are detailed in separate work [36]. We attached a short summary of the combustion tube test in Appendix A.
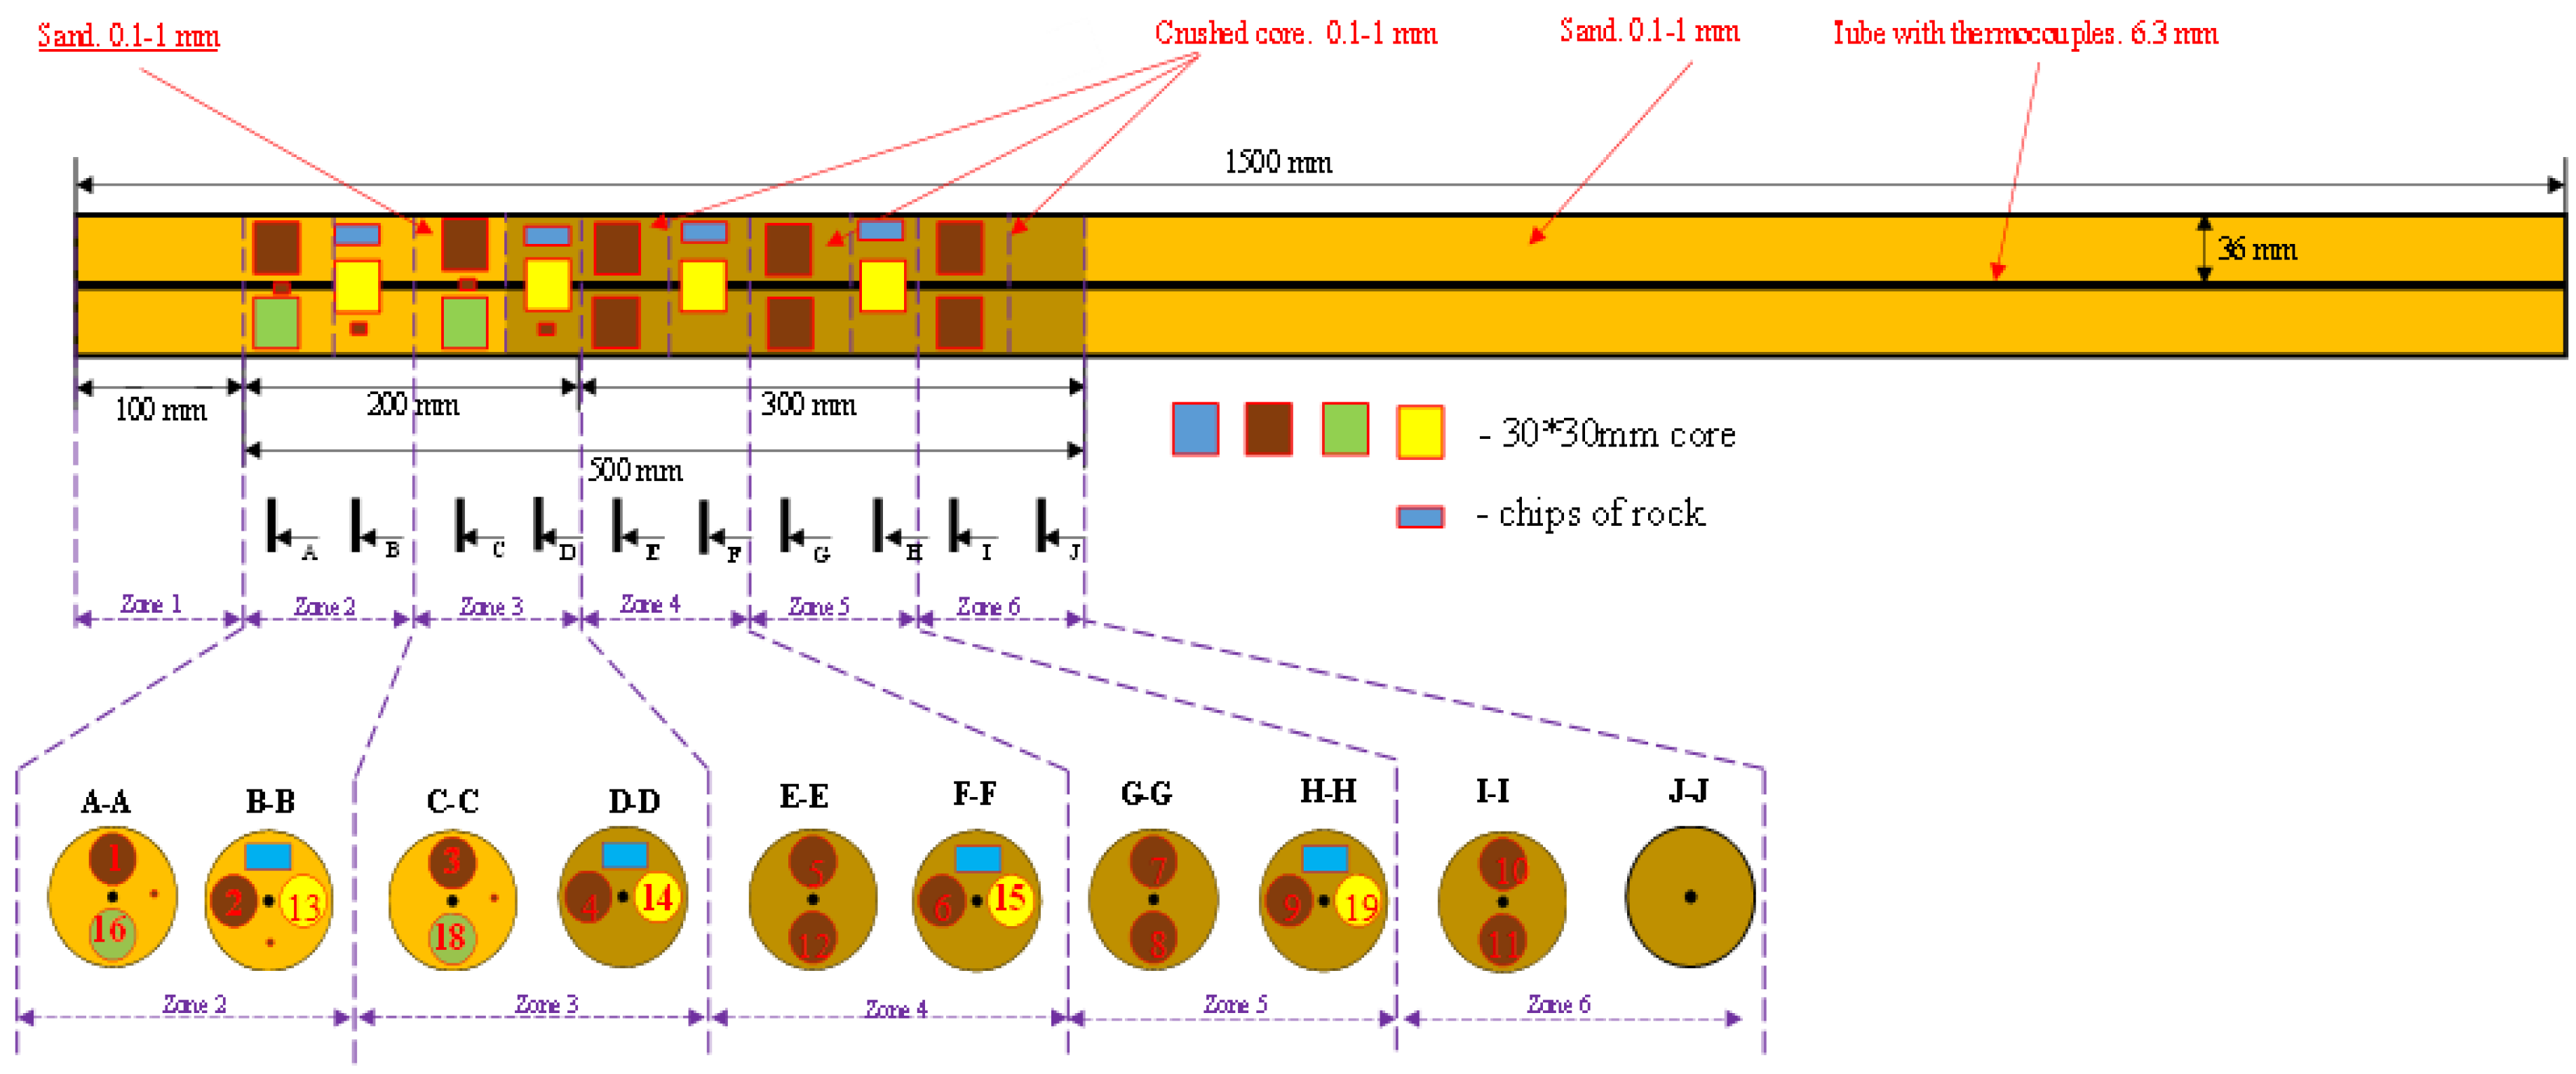
The core pack consists of oil-saturated rock samples from several fields of the Bazhenov Formation. As a result of the exothermic combustion, the maximum temperature achieved was 463 °C, and the pressure reached 27 MPa. The results demonstrated the high potential of a high-pressure air injection-based method for the development of BF deposits [31,36]. HPAI was physically simulated on BF core samples—from Oil field 1, Oil field 2, and Oil field 3 (Figure A1). Core plugs were evenly distributed along the combustion tube along with the sand and crushed core pack. The entire tube can be divided into 6 zones exposed to different maximum temperatures.

2.3. Methods

Diversity in sample origin (different oil fields) and their properties led to the difference in their after-combustion state. To test the effectiveness of HPAI in consolidated samples, we analyzed rock properties before and after the combustion. In the current study, this was performed by the NMR, Rock-Eval pyrolysis, SEM, and gas permeametry (Figure A2 in Appendix B).
The main requirement was a non-disruptive character of testing on consolidated core samples. The set of core plugs was analyzed in their initial state of saturation or as-received state (before combustion) and after the exposure. Air injection was stopped after the temperature of the fourth zone reached its peak temperature. The last two zones, packed with core chips, were exposed only to moderate temperatures; the combustion front did not pass through these zones (CT section).
The test goal (Table 2) was to reveal differences in the rock properties in the zones behind and in front of the combustion front; for this purpose, we analyzed the core from each temperature zone.
In this study, Bazhenov Formation cylindrical (30 × 30 mm) rock samples and accompanying rock chips from target four oil fields were selected for the investigation. Table 3 contains information about the samples selected for investigation.

2.3.1. Rock Characterization

Porosity and permeability were determined for the rock samples prior to the combustion test and right after. Measurements were carried out at the automated porosimeter Geologika PIK-PP unit (Figure A2), which employs the pulse-decay method [42]. The measurements were taken at a confining pressure of 3.4 MPa; nitrogen was selected as an injection gas. The porosity and permeability of 18 cylindrical rock samples were measured. Due to the low porosity of the samples and the high quantity of viscous components, the test was repeated at least three times, and the average value was reported. Mineralogy analysis on core powder (whole rock fraction < 2 mm) was performed using the benchtop Rigaku Smartlab X-Ray diffractometer unit.

2.3.2. NMR Relaxometry

All core plugs were analyzed using a 1H low-field (2 MHz) NMR unit—Geospec 2–53 (Oxford Instruments Inc., Abinden, UK). The parameters obtained included the T2 relaxation spectrum, saturation profile, and T1–T2 fluid identification maps. The core samples of BF were dried until the sample weight stabilized, saturated with decane, and additionally resaturated with a model of formation brine with consecutive NMR studies of the core sample at each stage of the experiment. The NMR results are interpreted out in accordance with existing methods of fluid identification [26,43,44,45]. Those methods were adapted for tight oil rock samples for the estimation of immobile and mobile fluid interpretation by separating residual water, oil, and effective oil saturation. In this work, a decane was utilized as a hydrocarbon liquid, and a brine model was prepared with deionized water and sodium chloride at a concentration of 20 g/L. The processing of data was accomplished by the commercial software package by Green Imaging Technologies Inc. (GIT, Fredericton, NB, Canada) Advanced v.7.5.1 [46].

2.3.3. Rock-Eval Pyrolysis

A study of the rock pyrolytic characteristics as the amount of hydrocarbons, total organic content and degree of maturity was performed using the Rock-Eval pyrolysis method [47,48]. We employed two types of sample preparation for pyrolysis (Figure A3). The core plugs were split into two halves, and one of them was divided into segments according to the scheme. For most of the samples, the probe preparation consisted of drilling a hole in the center of the plug (Figure A3a). In other cases, the depth of each hole was fixed at 5 mm, and the core was divided into zones taking into assumption the cylindrical geometry (Figure A3b,c). The choice of the drilling scheme depended on the core fragility and its size.
Each segment was analyzed for the OM content and quality (TOC content, S1, S2, S3, and other parameters) to characterize the transformation of OM in the rock by general and 2D pyrolysis technique.

2.3.4. Scanning Electron Microscopy

SEM was used for high-resolution 2D imaging and rock structure characterization. By means of the Thermo Fisher Scientific Quattro S electron microscope, we analyzed small rock probes (3–5 mm in size) split from main samples. The microscope allowed us to work with an electron beam current range from 1 pA to 200 nA with accelerating voltage 200 V to 30 kV. The highest spatial resolution was 5 nm (30 kV). Scanning included using secondary electrons (SE) and backscattered electrons (BSE), magnification range ×500–35,000 k, acceleration voltage 10–15 kV, working distance 9–11 mm with approximately 5–6 nm maximum pixel size [49]. The dimensions of the resulting images are 1536 × 1094 px.

3. Results

3.1. Gas Porosity and Permeability after Thermal Exposure

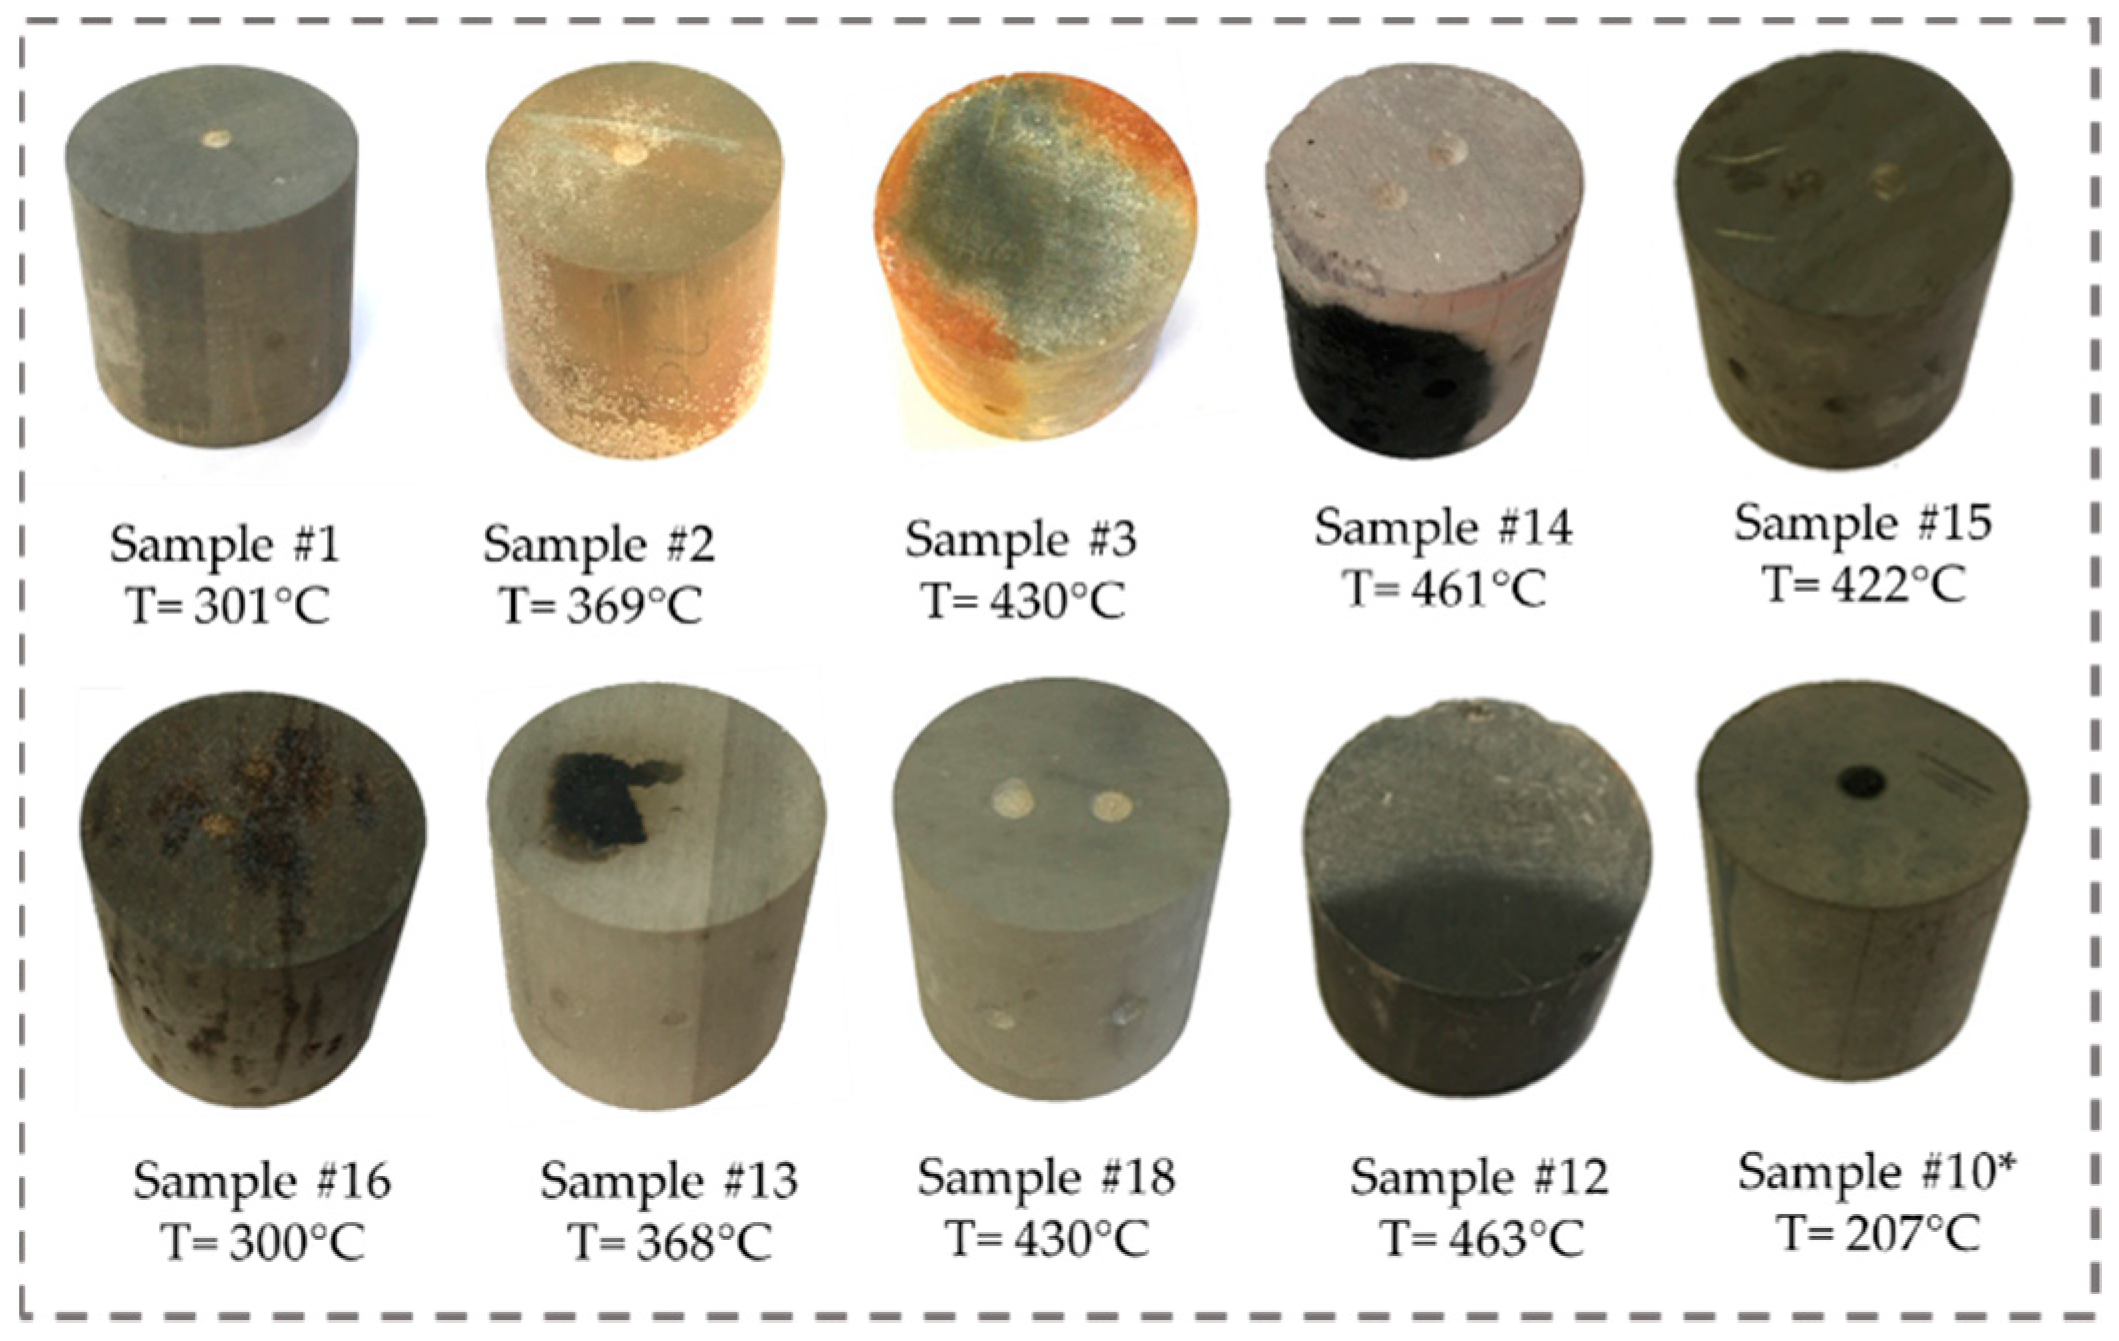
Before and after the combustion tube test, the entire set of core samples underwent testing on a standard gas permeameter used for determining the reservoir properties such as porosity and permeability. In addition, all core plugs were photographed after the combustion in order to record the visual changes (Figure 2).
The photographs of samples subject to thermal exposure illustrate the visible changes in the rock matrix. The images show how rock samples have changed color: two samples (#2 and #3) of Oil field 1 changed color to coral-red, which may be caused by the increased pyrite content in the samples and its oxidation. In samples #16 and #18 of Oil field 3, drops of bitumen are observed. In sample #14 of Oil field 2, we can notice a newly formed fracture.
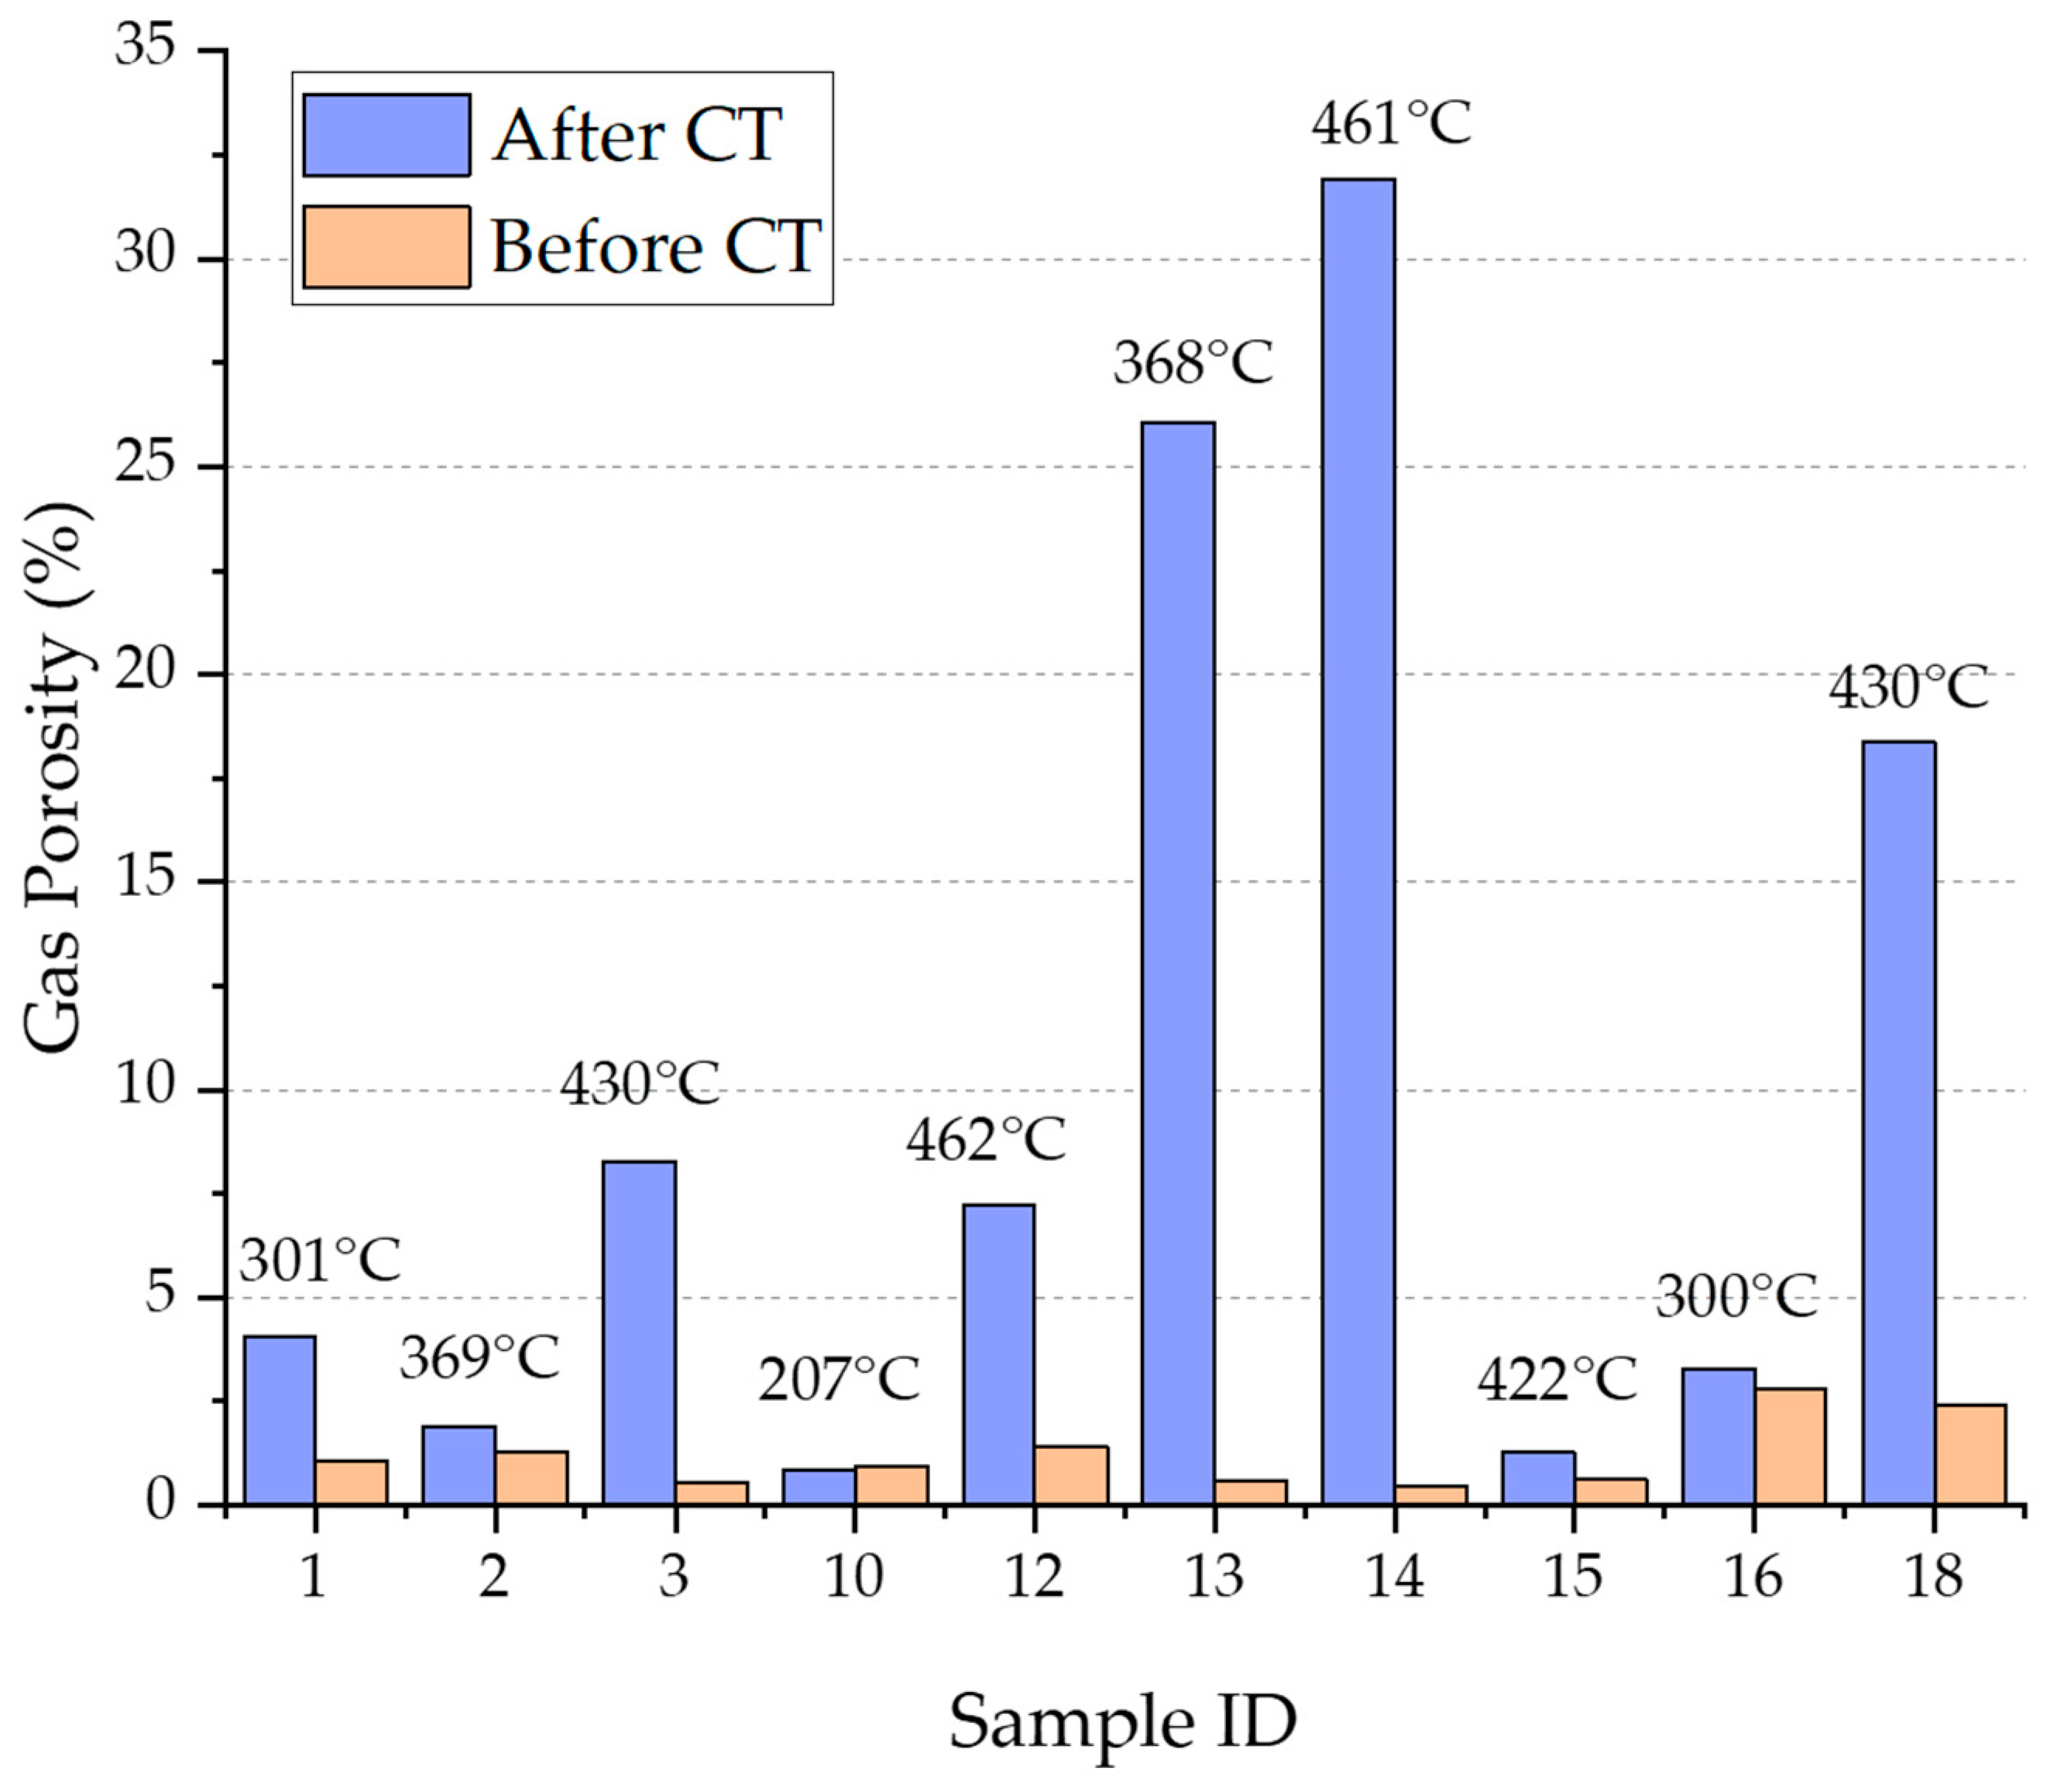
The first non-contact characterization method was porosity determination by nitrogen flow and pressure decay. We obtained total porosity and permeability for 10 samples before and after combustion (Figure 3). We observe the significant increase in porosity values defined by nitrogen injection due to increased void space in the core cylinders. It may be caused by emptied void space and the occurrence of artificial fractures.
The full data of porosity and permeability is summarized in Table 4. We can note the tendency of a significant increase in both parameters at high exposure temperatures. This confirms the front propagation and reflects the importance of reached temperature on porosity and pore connectivity evolution.

3.2. Investigation of the Porous Structure by SEM

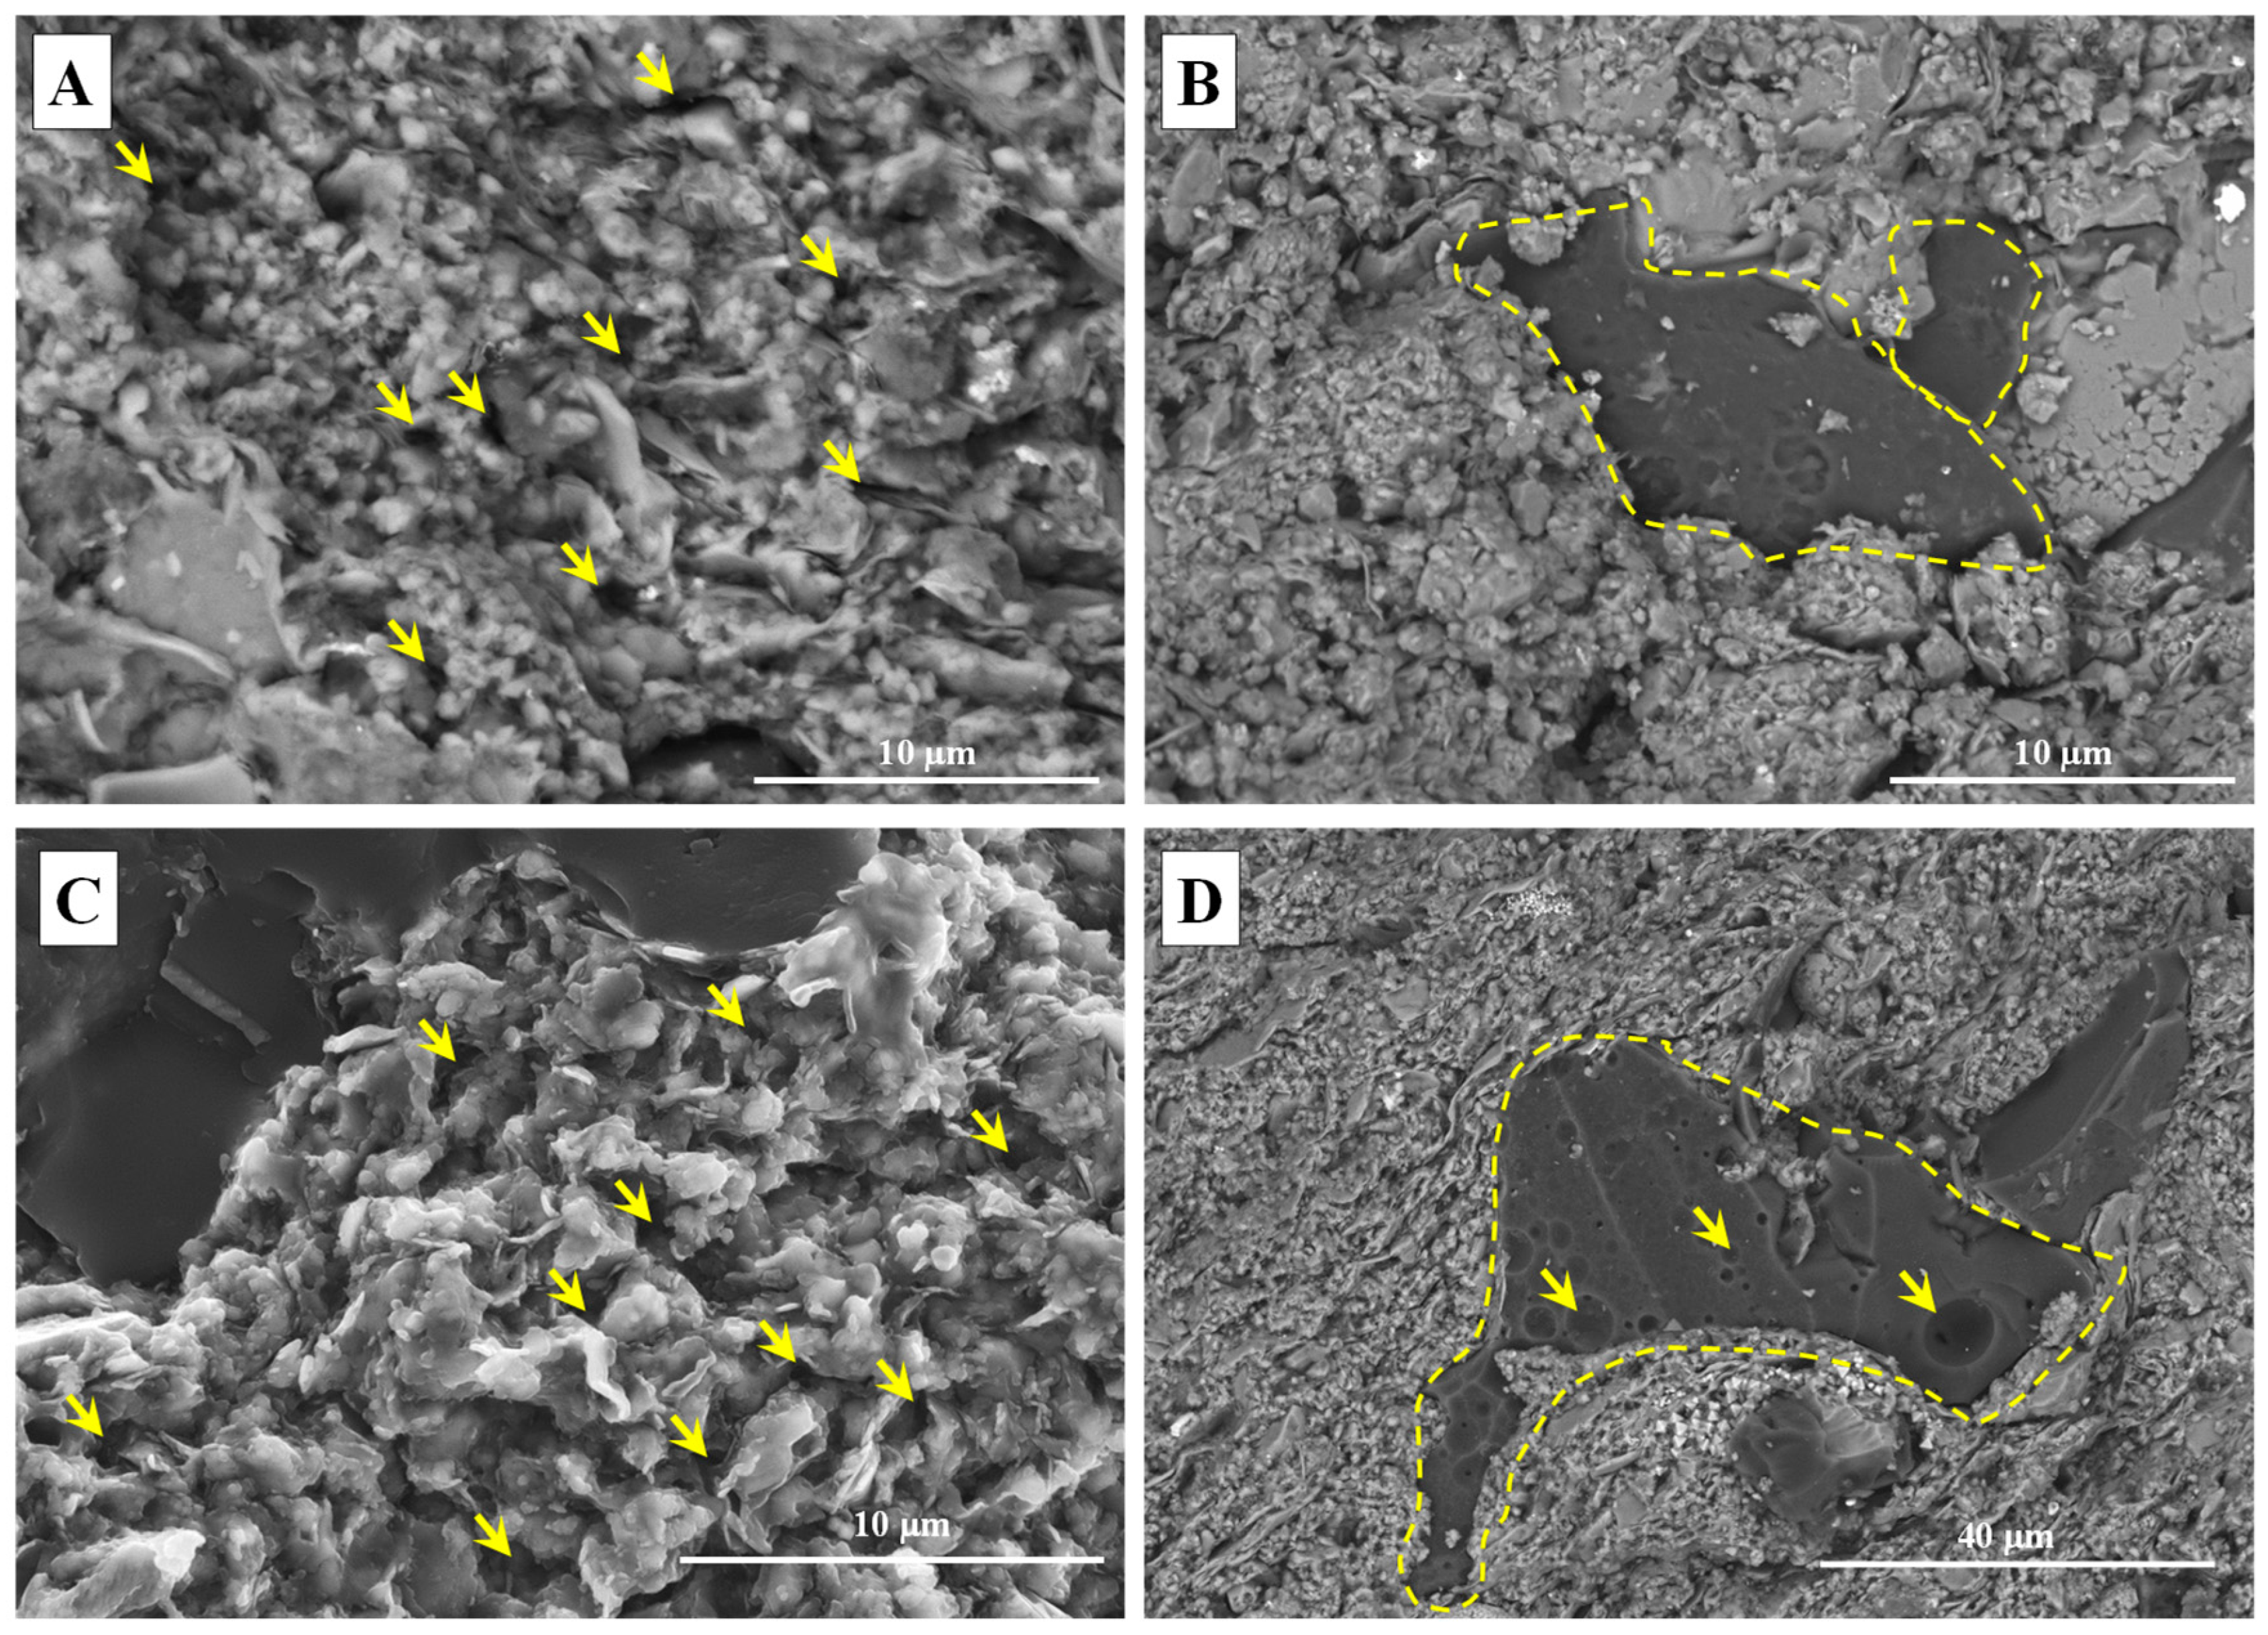
SEM studies showed that samples in an as-received state (before the experiment) initially had a small pore size (up to 2–4 µm in size). Neither fractures nor disintegrations were observed. Sample #12 was characterized by unevenly distributed voids (less than 2 µm) associated with the crystal structure (Figure 4). The organic matter in the sample was not porous; the size of OM particles varied between 0.5–20 µm (Figure 5). Slightly larger and homogenous pores were identified in sample #16 (up to 4 µm). OM inclusions were significantly bigger in size (up to 55 µm) and characterized by internal voids, which were in the 0.4–10 µm range.
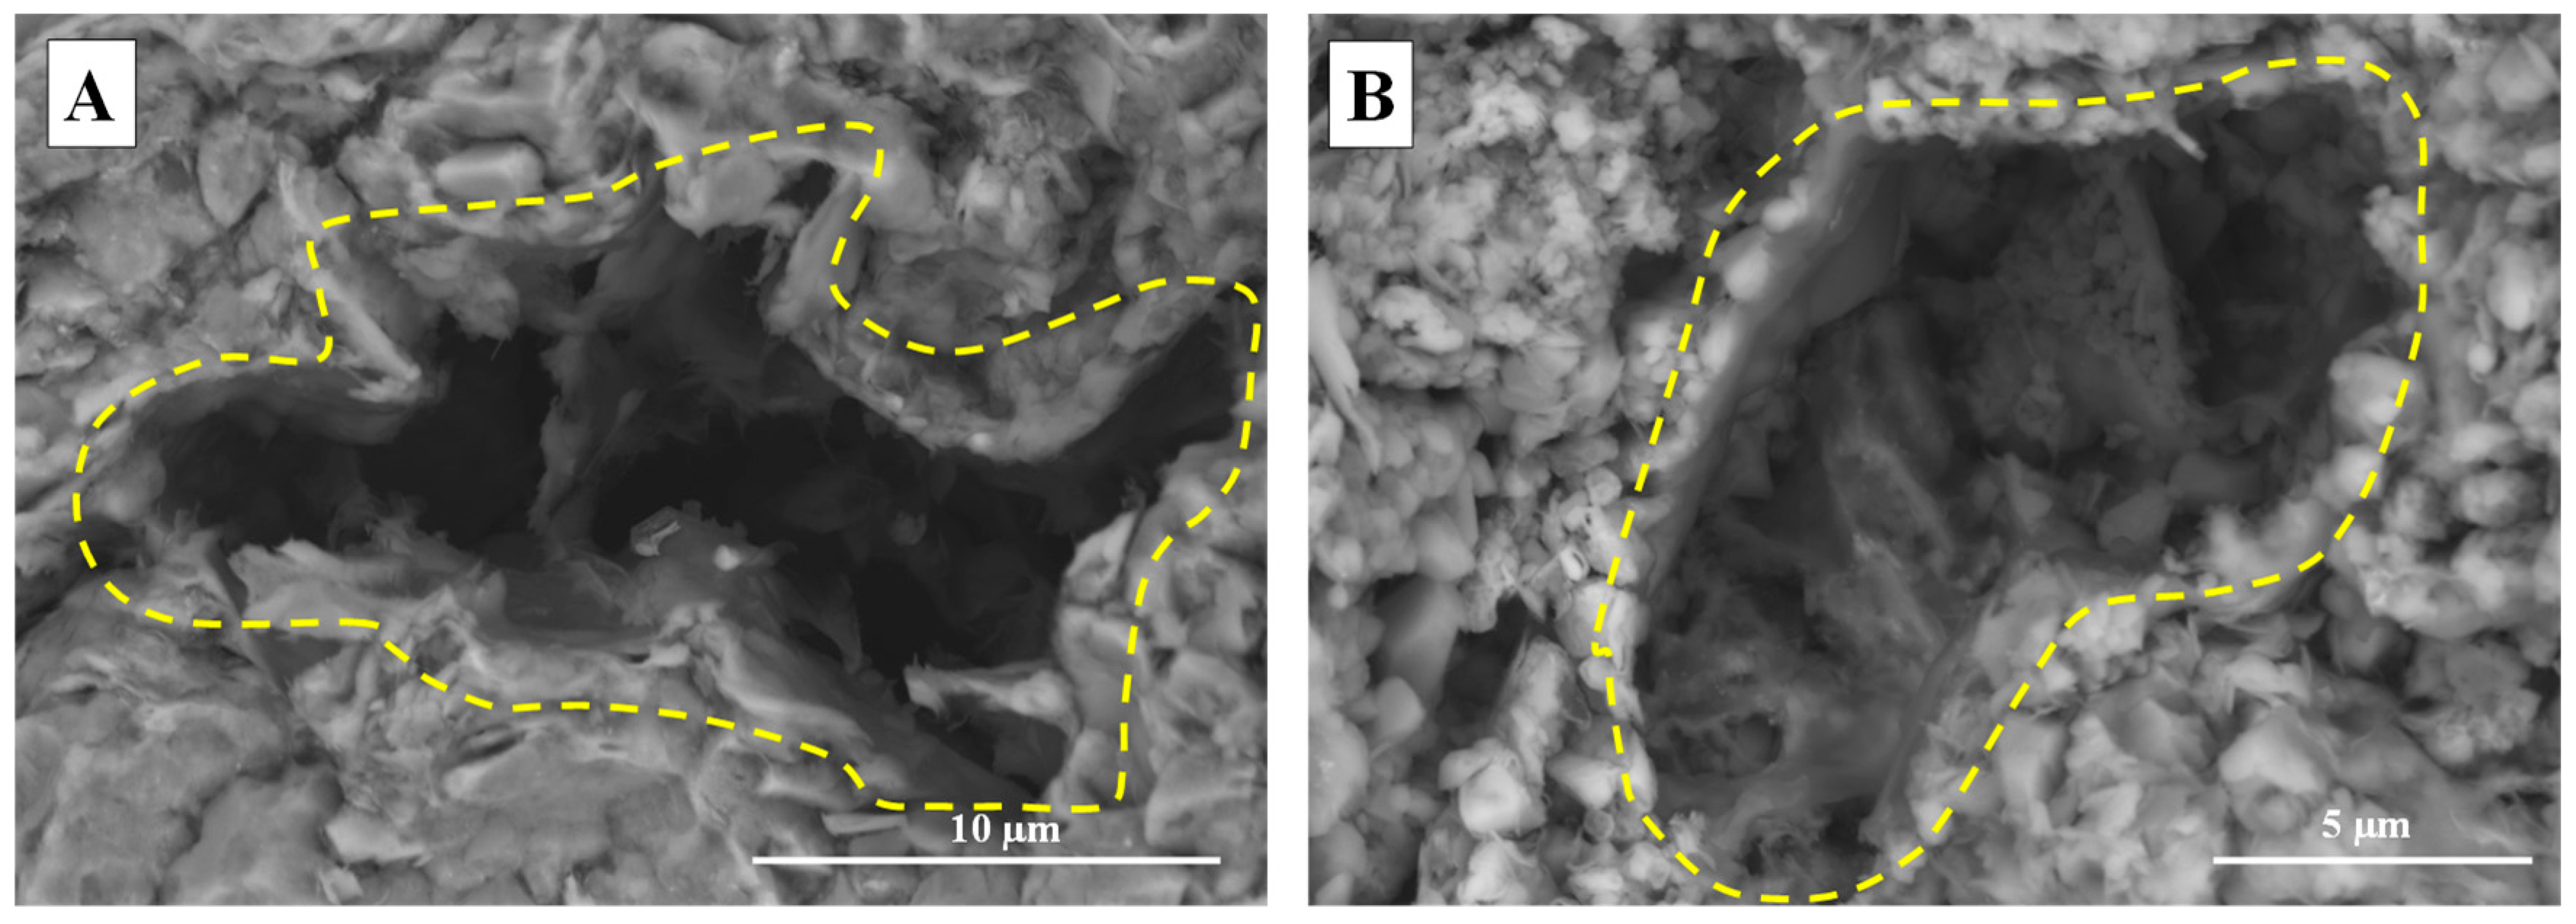
After the combustion experiment, both samples showed new voids appearing in the porous volume, initially filled by organic matter (Figure 5). Some OM inclusions looked to be shrunk after the heating and did not occupy all available space around them; this effect was observed mainly for sample #16 (Figure 6). The most common and evident change is new fractures, which formed along with the lamination in µm–nm scales (Figure 7). Some fractures intersected each other and formed a connected channel (Figure 7a). The fractures at a smaller scale (50 µm and less) were mainly closed and very thin (up to 1–2 μm); thus, they did not contribute to the increase of porosity and permeability after the combustion. Finally, we observed a noticeable increase in pore size and homogeneity of its distribution in sample #16 (Figure 8).

3.3. Development of the T1–T2 Interpretation Scheme

In the framework of rock analysis before and after the thermal exposure, we did not have an opportunity to employ the multistage NMR analysis of the rock at different states of saturation. For this reason, we conducted a detailed NMR analysis of 5 core plugs (n1–n5) in order to develop the T1–T2 interpretation scheme for target collection prior to the main experimental section. The selected shale samples had similar petrophysical, geochemical properties, and lithotype.
The core plugs underwent a 4-step routine core analysis, including drying, a saturation of the rock with water and decane. For each of the samples studied, an individual interpretation of T1–T2 maps was carried out, and the values of water and oil saturation were calculated. An example of the T1–T2 maps for representative sample n5 is illustrated in Figure 9. We observed the change of fluid signal of the rock at different stages of saturation. This enabled fluid separation in the sample based on the information obtained.
An increase in the fluid viscosity is accompanied not only by changes in the T1 and T2 relaxation times but also, most importantly, by the ratio of longitudinal relaxation time to transverse relaxation time T1/T2. As an empirical basis for the interpretation of the two-dimensional distributions of T1–T2 for shale, first, the statements of Fleury et al. [28] obtained for gas- and oil-bearing shales, as well as the two-dimensional distributions of Washburn et al. [50] are widely used. The algorithm for investigating oil shale using NMR with an operating frequency of 2-MHz is discussed in the works of Rylander et al. [51]. A qualitative interpretation of 2D T1–T2 distributions is proposed in accordance with the conditional algorithm presented in the paper of Kausik et al. [52]. The separation of water-oil-type fluids, as well as the pore space geometry, is based on the apparent contrast of the T1/T2 ratio for the various pore populations. Recently, many scholars have presented their own interpretation schemes of T1–T2 maps for shale rock [20,53,54,55,56]. The most detailed identification is yielded at higher frequency (~20-MHz) NMR units, whereas the 2-MHz units are limited to the resolution in the field of low T2 relaxation times. Therefore, for the identification of the signal, we mainly referred to the simplified scheme by Li et al. [57].
In the as-received or primary saturation state, there is an insignificant signal region of reduced T1/T2 (2–10 ms/ms) and low T2 (less than 1 ms) area, which is responsible for water bound by clay minerals (Figure 9a)—drying the sample results in a significant change in the NMR signal in the clay and bound water region of the porous medium (Figure 9b). T1–T2 maps (Figure 9a–d) show that decane resaturation is predominantly indicated by an increase in NMR signal due to the T1–T2 distribution region with low T1/T2 ~ 1 and long T2 (40–300 ms), which indicates the filling of large pores of the inorganic matrix (IP—inorganic porosity). This proportion in the structure of the void space of the sample is dominant. With a small number of large pores, the NMR signal in the region of long T2 is usually leveled. The volume of pore space in the region of large pores is equal to more than 60% of the total volume of pore space recorded after the sample is saturated with the decane.
Based on the results for other samples (n1–n4) and published interpretation schemes, we analyzed and proposed the T1–T2 map fluid interpretation scheme for target rock samples by highlighting the main fluid populations. The presented collection of samples of the Bazhenov formation demonstrated different reservoir properties (porosity and pore size), which is caused by a high degree of heterogeneity in composition, structured pore space, and surface properties. Therefore, we simplified the T1–T2 scheme focusing on hydrogen populations corresponding to bitumen and adsorbed oil, structural and adsorbed water, and mobile oil in IP. The development of this interpretation scheme enabled the ready framework to be set for further analyses of the core saturation and oil displacement for T1–T2 maps of rock before and after the air injection in CT.

3.4. NMR Analysis

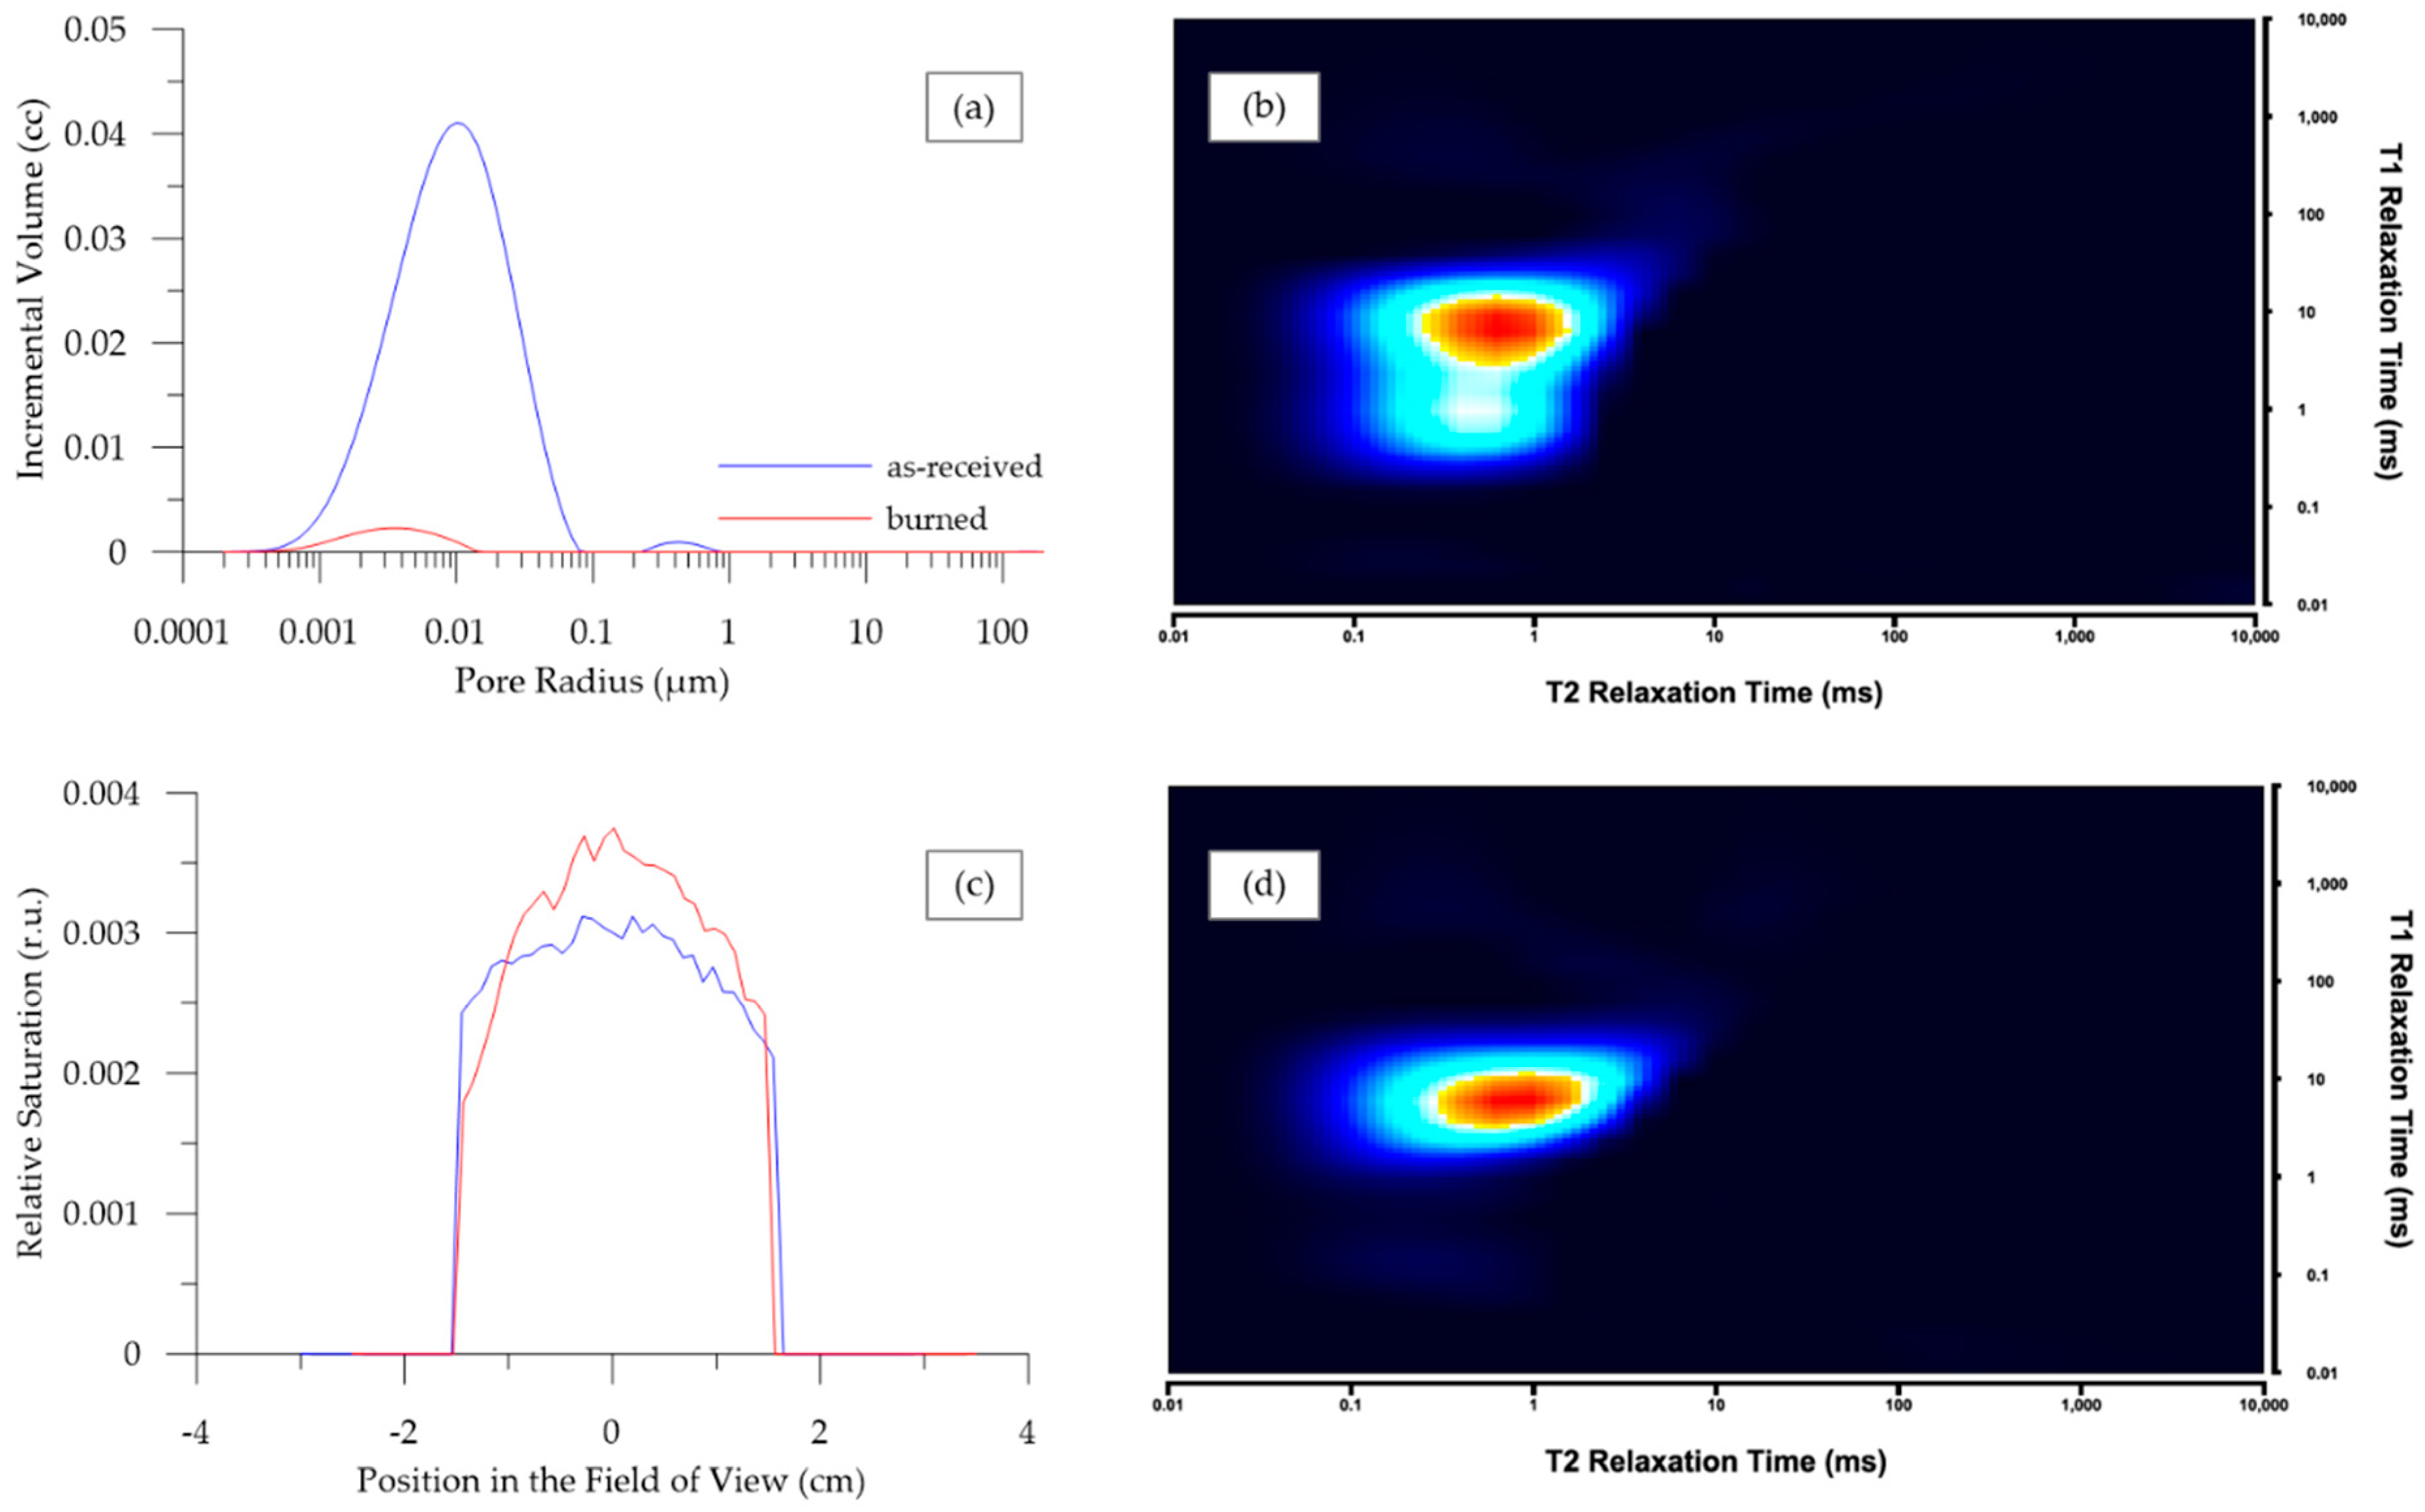
NMR enables tracking of the change in porous space occupied by fluids and provides this value both in volume (cc) and in porosity (%) units. We utilized the NMR for registering the fluid saturation by a number of selected tests: CPMG T2 relaxation, 1D saturation profile, and T1–T2 map for fluid separation. Samples before and after the combustion tube were analyzed according to the proposed methodology; at each stage, the series of above-mentioned test types were repeated with the same parameters (Figure 10).
After the combustion, there was a near-zero volume of fluids left in the samples (Figure 11). At first approximation, the residual fluid saturation for target rocks depends on their initial saturation, the temperature of the zone, and the combustion tube section. We clearly observed an apparent decrease in total fluid volume for samples that were exposed to 300–369 °C, whereas in sections with higher temperatures, the fluid was almost completely removed. Exceptions can be explained by the example of sample #15, where a certain amount of fluid remained after exposure to 422 °C. This sample was located in CT section, which is near the end of the propagation front. We explain remaining fluid by the generated oil. Thus, the results of measurement mainly indicate the displacement and burning of hydrocarbons from cylindrical samples along the combustion front, but this difference is controlled by several factors. These factors primarily include the petrophysical background of the rock samples (rock lithology, OM properties) and experiment conditions (temperature in the CT zone, location in CT, and duration of exposure).

3.5. OM Characterization by Rock-Eval Pyrolysis

The OM properties of the target samples (rock specimen taken from the same depth within a well section) are characterized by the Rock-Eval technique (Table 5). According to S2 values, samples 1/2 and 13/15 show extremely high generation potential. TOC content varies in the range of 5.39–16.98 wt.%. According to the pyrolytic parameters, the maturity of Oil field 1 and Oil field 2 is at the beginning of the oil window. Oil field 3 parameters correspond to the peak of oil generation. All specimens of the initial samples were prepared using a single-point drilling scheme. The same applied to most samples after combustion resulted in core fragility.
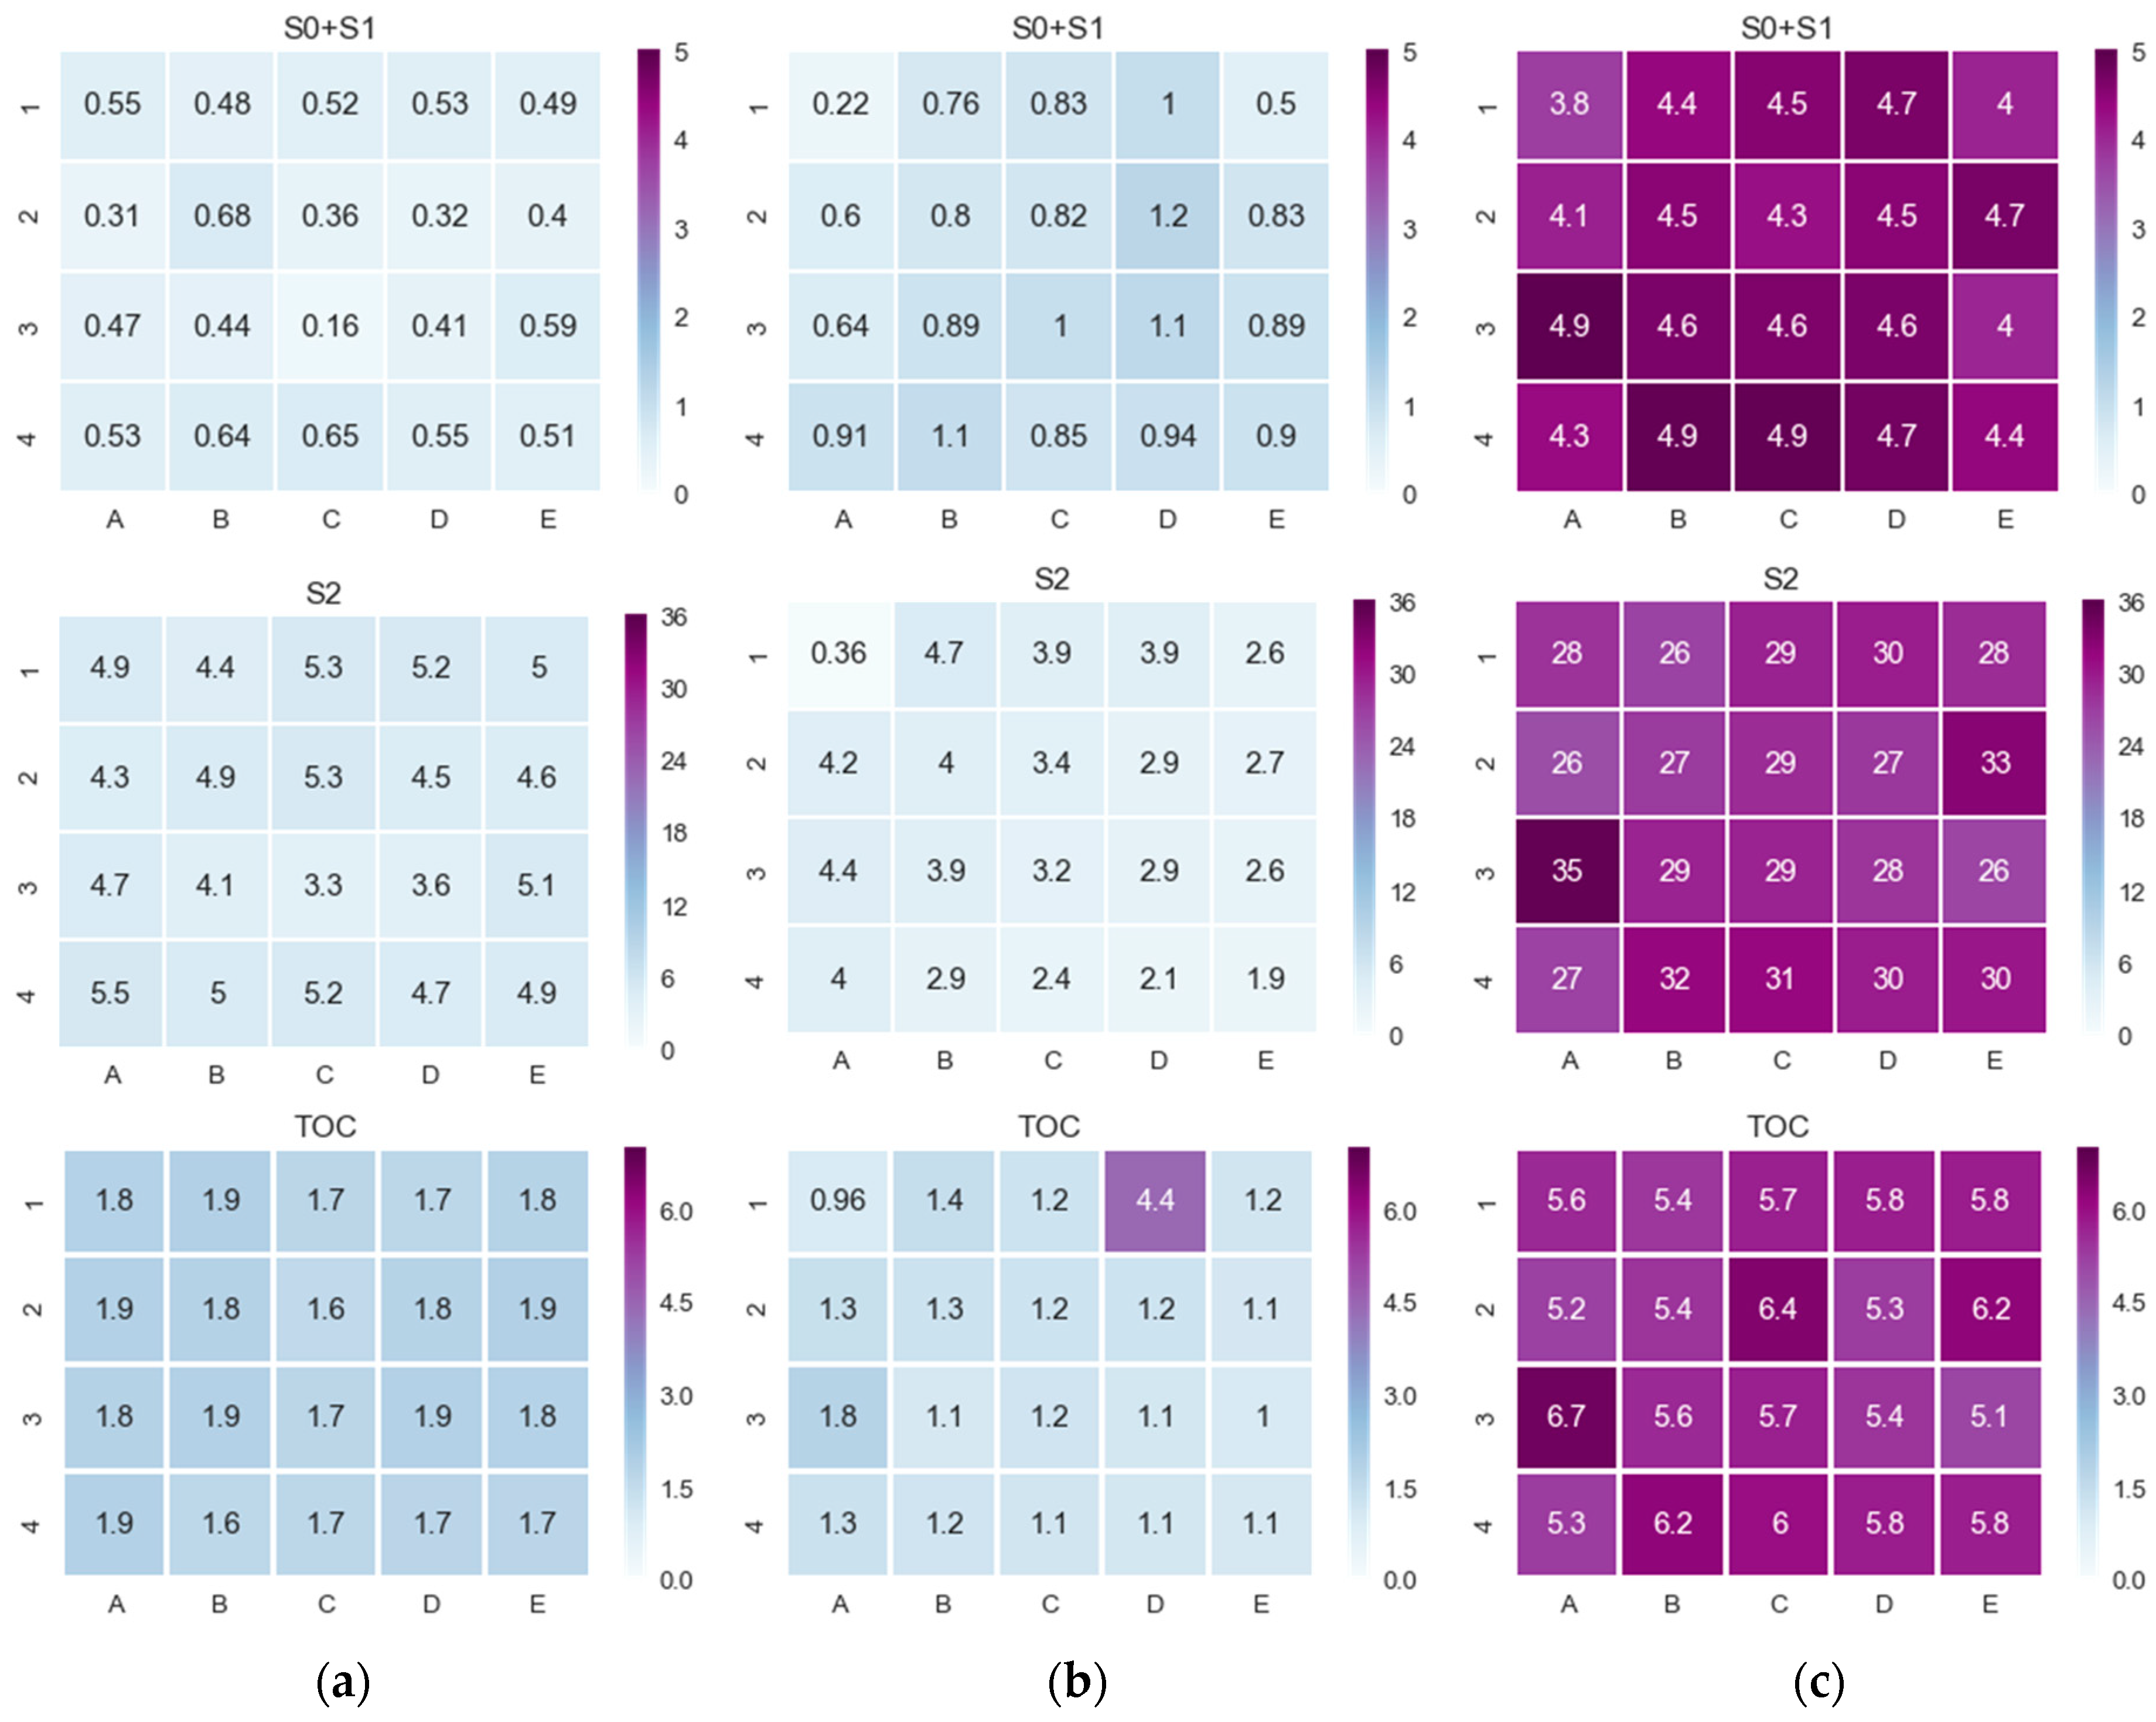
To better understand the effect of the combustion front on a larger scale (than that used for sand or core pack), we decided to perform 2D pyrolysis on three samples after the CT experiment. The core plugs were selected from different sections of the tube: #12 (Figure 12b) and #15 (Figure 12c) from the highest temperature zone 4, #10 (Figure 12a)—from the lowest temperature zone 6. Heat maps, showing distributions of free hydrocarbons, as the sum of peaks S0 and S1 in classic pyrolysis, kerogen (S2 in classic pyrolysis), and TOC values for three samples are shown in Figure 12, correspondingly.
Samples #10 and #12 were initially characterized by similar values of non-transformed kerogen according to the S2 parameter (Table 5). Figure 12a shows that sample #10 from the low-temperature zone (6.1, 207 °C) has a relatively uniform transformation of organic matter in its volume. The opposite type of distribution of non-transformed kerogen (S2) is observed in sample #12 from high-temperature zone 4.1, 463 °C (Figure 12b). The zones A1, C4, D4, E:1–4 of sample #12 (S2) exhibit a higher transformation degree than in other analyzed points, which can be explained by an initial uneven distribution of OM or the impact of void structure (for example, fractures occurred) on the OM transformation process during combustion. Overall, sample #12 (Figure 12b) shows the full conversion of kerogen, which is confirmed by the low content of free hydrocarbons. It proves that a temperature of 463 °C is sufficient for the near-complete conversion of the organic matter in the consolidated core samples. This confirms that the combustion front has passed through the entire rock sample. From the distributions of free hydrocarbons (S0 + S1), also more uniform distribution is shown in the volume of sample #10 comparing with sample #12. Therefore, sample #15 was exposed to a lower temperature (422 °C) than that for sample #12, and might store a liquid oil phase that was not removed from the combustion tube. Sample #15 (Figure 12c) also comes from the high-temperature CT section, but it shows significant residual saturation. First of all, a certain amount of kerogen remains in the sample. A second, relatively high value for S0 + S1 and TOC indicates the presence of liquid free oil. It can be explained by the location of the sample at the border of zones 4 and 5 (end of combustion propagation), and therefore the remaining amount of generated oil in the rock.
The Rock-Eval study of fragile core samples #1–3, 13, 15, 18 from other temperature zones was carried according to the scheme in Figure A3a, where the pyrolysis probe was drilled out in the central part of the plugs. The values obtained are listed in Table 6.

4. Discussion

Each section in the combustion tube contained up to four core plugs. At least one representative sample from each CT section was selected for the analysis, including NMR, Rock-Eval pyrolysis, and gas porosimetry. We attempted to obtain the maximum knowledge on the reservoir and geochemical properties of the rock. Gas porosimetry was used to evaluate the porosity and permeability evolution of the rock. NMR relaxometry examined the saturation and porous space changes induced by combustion; pyrolysis analyzed the kerogen conversion in exposed rock species.
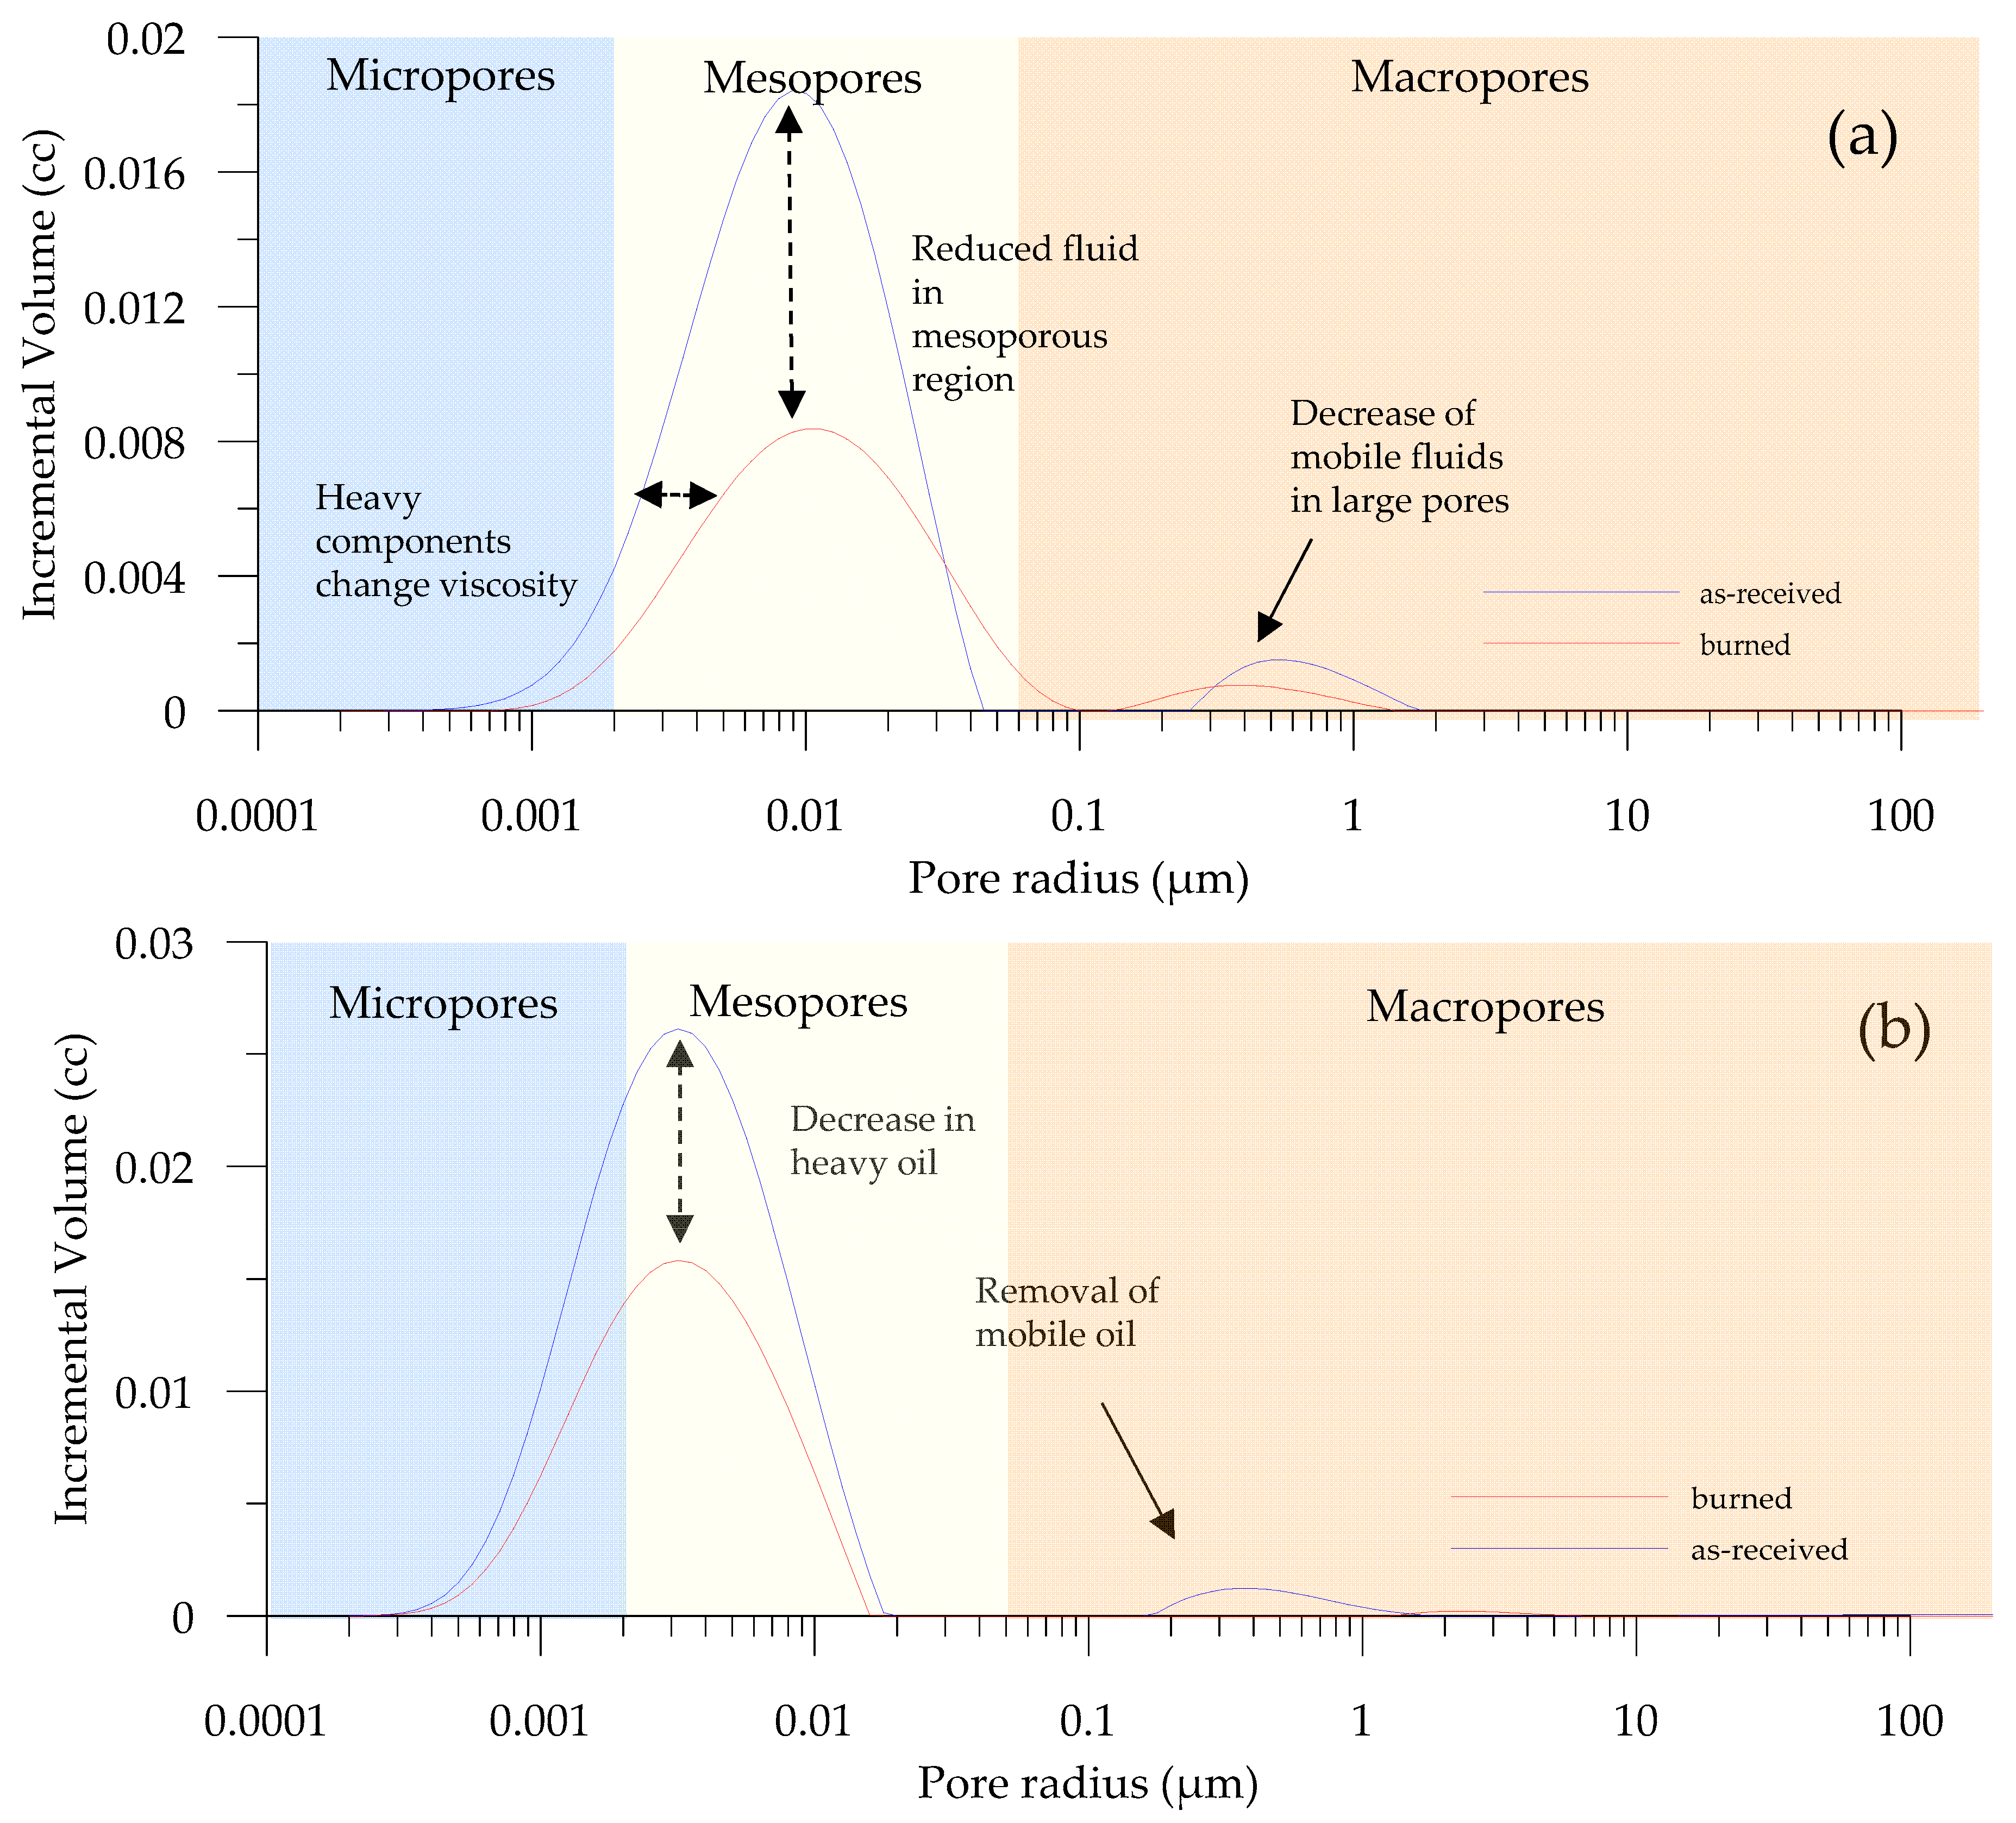
NMR measured the change in total fluid volume of the sample and the spatial saturation using 1D NMR profiling. We used T2 relaxation curves for illustrating the distribution of fluid-occupied pores inside the rock (Figure 13a,b). Images illustrate how the liquid phase was redistributed in the samples exposed at different temperatures. Sample #2 (located in Section 2.2) shows a decrease in the number of pores filled with the heavy components, and residual fluid relocation to larger pores, after the combustion. In the case of sample #12 (CT section—where the temperature reaches the maximum value), we observe the entire removal of mobile fluids and a small number of heavy components in the microporous region.
Additionally, we utilized the developed NMR T1–T2 interpretation scheme for registering the change in saturation and residual fluid types in the rock samples. In general, the total fluid volume is applicable for estimating the common saturation level change in rock and evaluate the influence of thermal exposure in the tube. Therefore, the disintegration of HC populations (fluid types) might be useful for modeling the thermal EOR processes and validation with experimental data. As explained earlier, in the Results section, we developed a simplified T1–T2 interpretation map by reducing the number of fluid categories to bitumen and adsorbed oil, structural and adsorbed water, and mobile oil in IP. The summary of the samples investigated before and after CT is provided in Table 7.
We applied the Rock-Eval technique in two different modes: standard analysis of the single probe per sample and so-called 2D pyrolysis technique, where the entire plug was investigated using multiple drilled holes. Three samples were chosen for 2D pyrolysis: sample #10 (197 °C) and samples #12 (463 °C) and #15 (422 °C). Results demonstrated that the temperature of 463 °C is sufficient for the near-complete conversion of the organic matter in the consolidated core samples. Results of 2D pyrolysis showed an uneven distribution of organic matter by area in a cylindrical core sample #10. It is noted that the most intensive organic matter transformation was in the middle of the sample. NMR analysis also confirmed the absence of a liquid phase in sample #12 and confirmed its presence in samples #1, 2, 10, and 15.
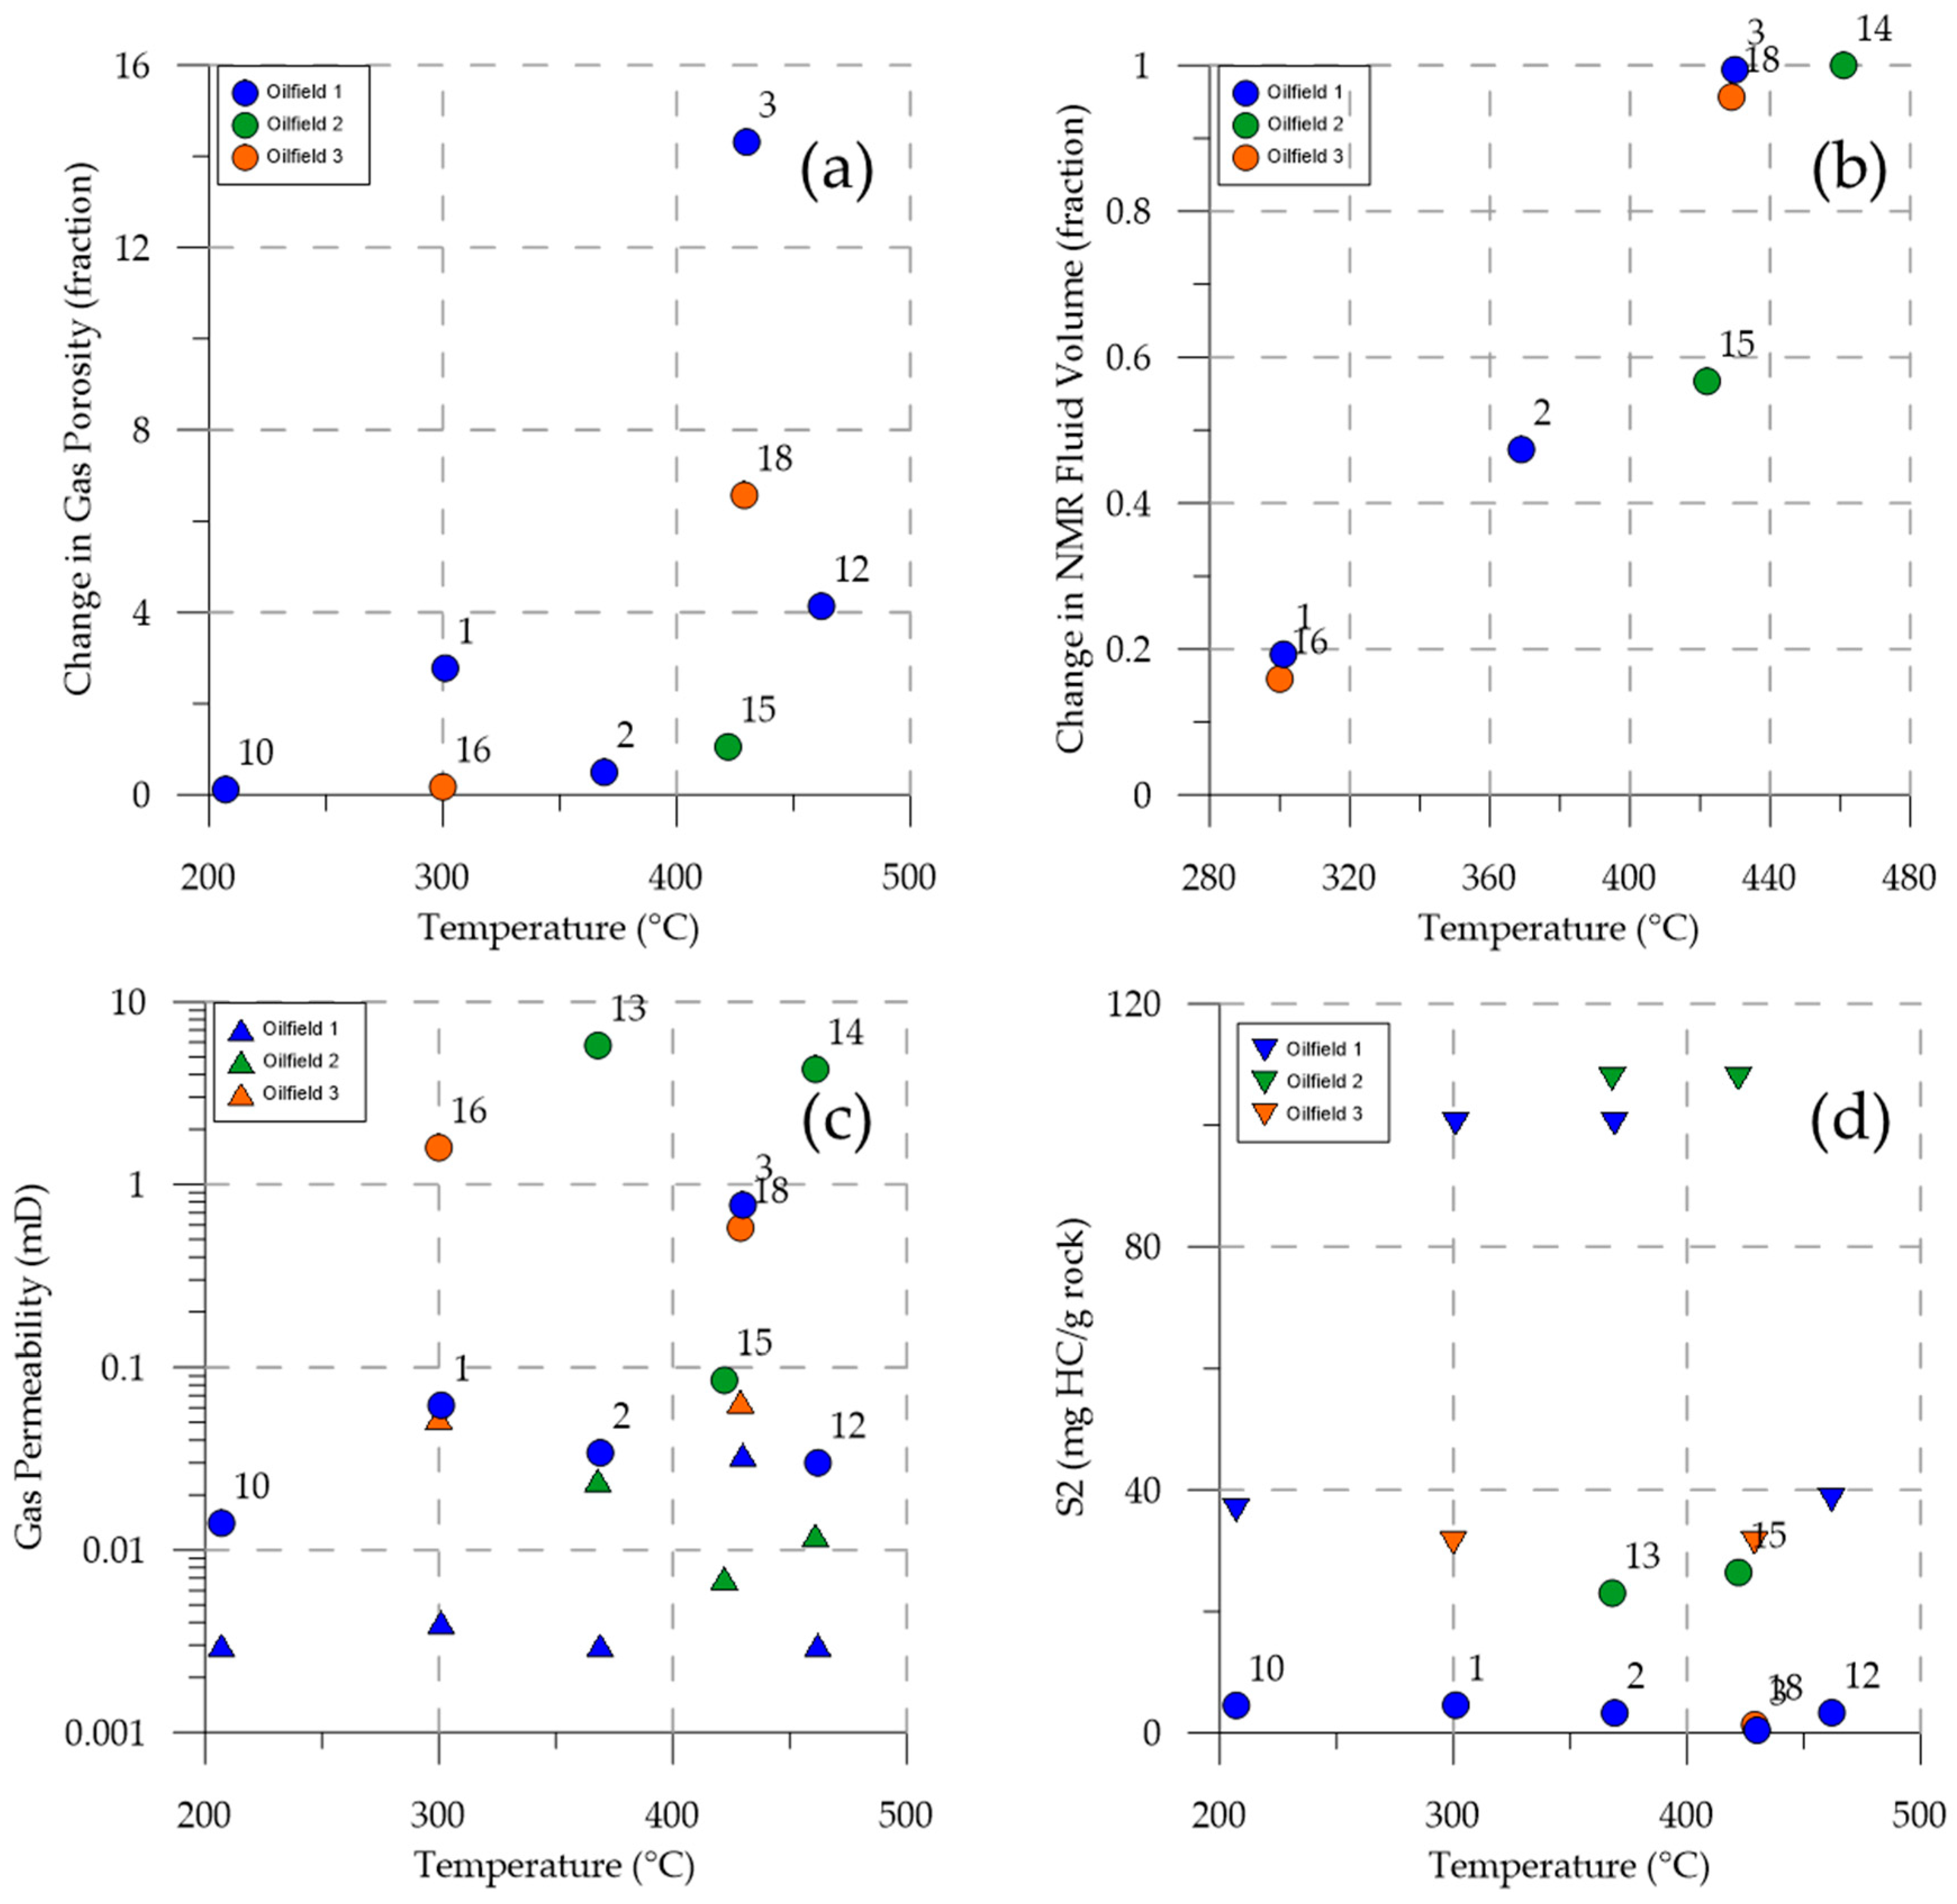
In this work, we attempted to define the correlations between parameters obtained, such as gas porosity and permeability, residual saturation by NMR, S2 value, and exposed temperature (Figure 14). Notably, for all samples, we observed an increase in porosity and permeability. A crossplot for gas porosity relative change (Figure 14a) shows that there is a good correlation between porosity and the section temperature. In the case of NMR saturation of the rock (Figure 14b), we observed a direct relation of change in NMR fluid volume and CT zone temperature. At higher temperatures in CT, more HC fluid in the rock is displaced, resulting in lower residual saturation by NMR. When plotted for gas permeability (Figure 14c), it is less pronounced and can be applied for mainly 3–4 samples (in the 400–470 °C range). This also applies to the S2 value change (Figure 14d), which directly indicates the kerogen transformation in rock. Decreased S2 values prove the generation of synthetic oil during the combustion process. In turn, NMR and Rock-Eval results demonstrate the presence of liquid oil, which remains in rock samples and therefore, is not collected at the tube fluid samplers. For this reason, the TOC content should not be considered as an OM indicator within the combustion experiment.
However, samples exposed to the same temperature demonstrate different behavior. This confirms the presence of multiple factors influencing the change in rock properties. Besides the CT section temperature, other important factors include the rock lithology, OM content, and maturity. Thus, the exposure temperature, location in the combustion tube (section), and initial properties of the rock might significantly affect the combustion results. In our case, we investigated samples from three oil fields with different rock lithology and OM maturation (Table 3). Oil fields 1 and 3 are of similar rock lithology—siliceous organic-rich shales. Oil field 2 is represented by mixed argillaceous-siliceous rocks. In turn, all oil fields have various OM maturity—oil fields 1 and 2 are at the beginning of the oil window but with higher generation potential for oil field 2. Rocks from Oil field 3 have OM at the peak of oil generation, and, therefore, they demonstrate distinct behavior (samples #16 and #18—Figure 14a,c,d). At the same time, samples #12 and #14 were exposed to the same temperature (463 °C and 461 °C, accordingly) and had a relatively same order of porosity and permeability before the experiment. However, their final values of porosity and permeability are drastically different (Table 4, Figure 14). Samples #13 and #14 from oil field 2 show very high gas porosity (26% and 32%) and permeability (5.7 mD and 4.2 mD). It can be explained by specifics of mineral composition (as for argillaceous-siliceous mudstone), higher OM maturity (than that for oil field 1), a higher amount of transformed kerogen (proved by S2 values), or other technical reasons such as the occurrence of large fractures and voids. In other words, it is crucial to account for the rock heterogeneity in original reservoir properties and technical specifics of the experiment when modeling the HPAI for target oil fields.
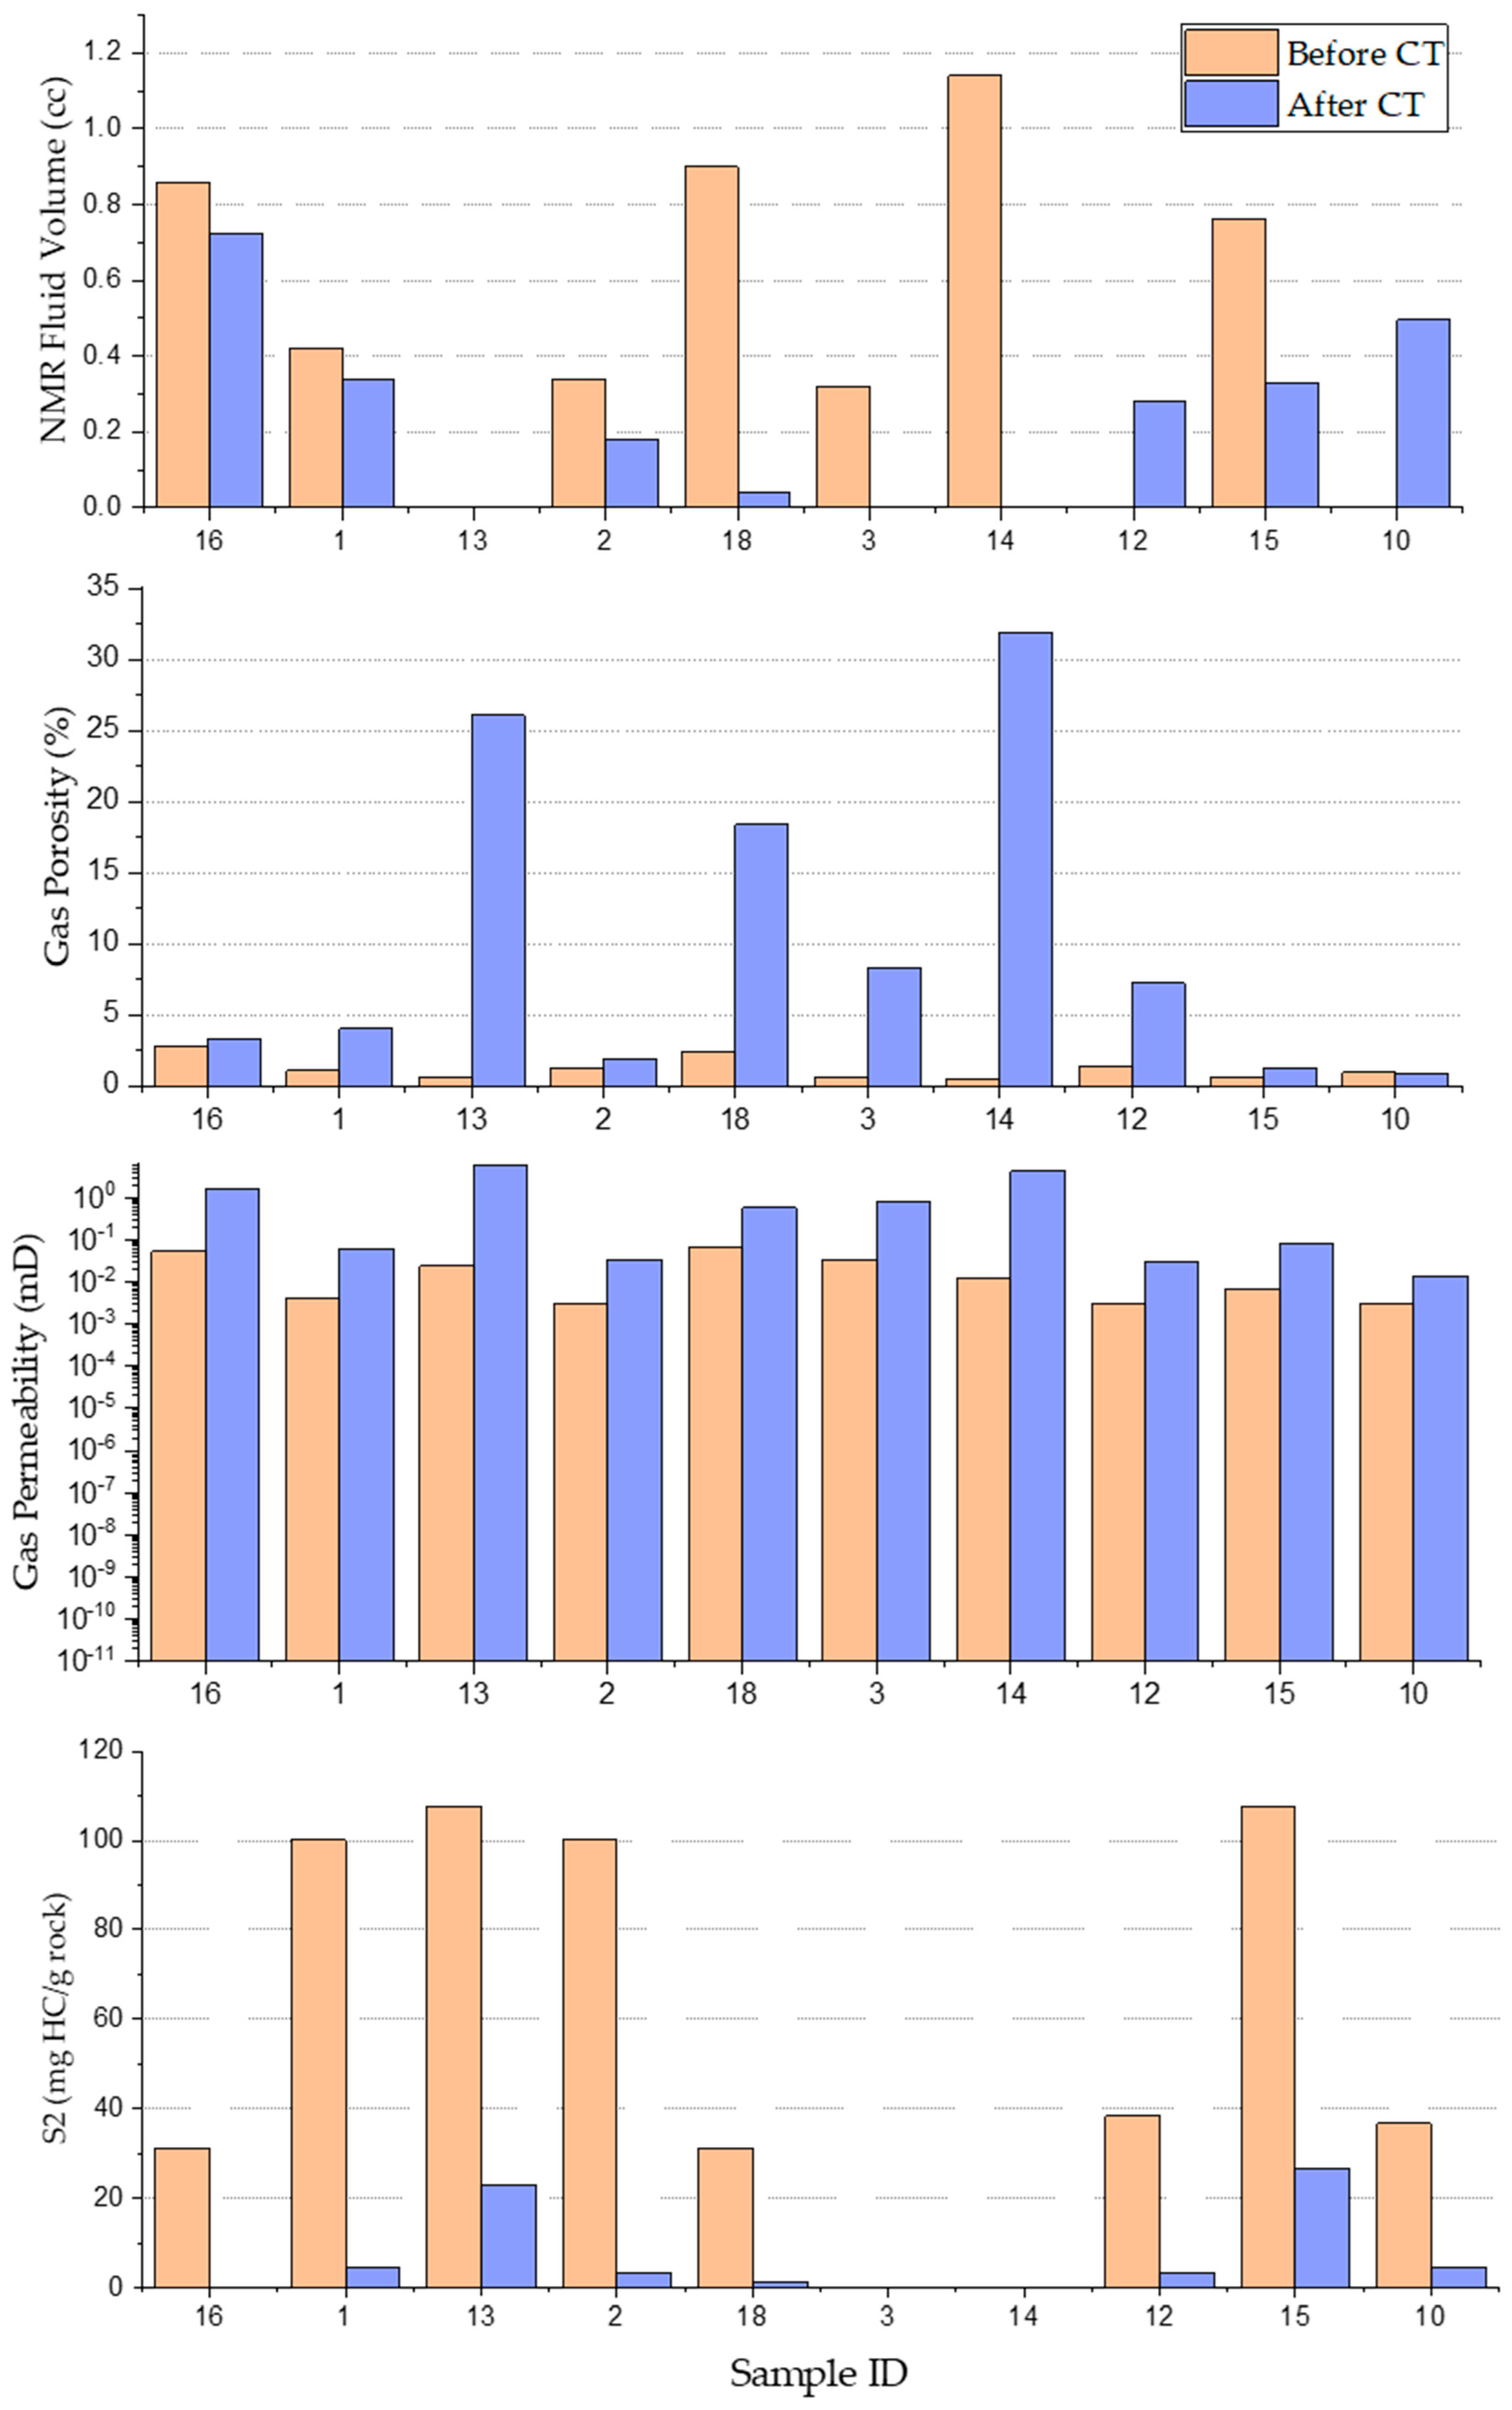
The standard practice of laboratory HPAI experimental data interpretation includes recording the change in temperature profiles during the test. The reservoir and geochemical properties of rock before and after the thermal exposure can be applied to the combustion tube characterization (Figure A4). In other words, data by gas porosimetry, NMR, and Rock-Eval pyrolysis can become an excellent addition to conventional probe sampling (fluid probing and crushed core investigation) due to exclusive information on shale fluid saturation and OM conversion. Hence, it is recommended to enhance the standard laboratory HPAI combustion tube protocol and to include a comprehensive analysis of core plugs using available non-invasive techniques. Known parameters of the tube (section length) and size for each particular sample makes it possible to correlate the saturation level and other parameters with the location of the test cylinder. Thus, complementary analysis of standard rock samples enables the maximum knowledge to be obtained on the physical and chemical processes within the laboratory thermal EOR tests.
As with the majority of studies, the design of the current study is subject to technical and experimental limitations that could be addressed in future research. First, limited core material and core fragility caused difficulties when planning the integrated analysis of rock using available methods. For instance, different probe preparation requirements preclude the conduct of multiple tests on a single core. Second, for the same reason, we attempted to analyze the changes in rock properties using a reduced number of recognized experimental techniques. Third, the initial heterogeneity in petrophysical parameters complicated the analysis of factors influencing the change of reservoir properties and saturation for target rock samples.
In summary, we demonstrated that a detailed and integrated study of rock samples in laboratory modeling of the thermal EOR method (HPAI or ISC) significantly advances the research results. The further steps of our research involve increasing the number of rock samples investigated and experimental techniques used by adding more novel techniques such as X-Ray microcomputed tomography and low-temperature nitrogen adsorption for investigation of the nano- and micro-sized porous structure of the rock.

5. Conclusions

Rock samples from the Bazhenov Formation were subject to the combustion tube experiment and analyzed by the suite of both conventional laboratory (pressure-decay porosimetry and permeametry) and novel non-destructive techniques such as NMR relaxometry. To supplement the NMR results, we utilized 2D pyrolysis to study the distribution of OM after combustion and SEM to characterize the changes in the rock porous structure. In summary, the following points can be highlighted:
  • The gas pressure-decay technique revealed a significant increase of porosity (on average, for 9 abs. % of porosity) and permeability (on average, for 1 mD) of core samples after the CT experiment. Samples located in high-temperature zones showed a direct correlation between the measured parameter and the combustion temperature. However, the changes were also conditioned by the initial properties of the core plugs, such as rock lithology and OM properties.
  • The NMR T1–T2 fluid identification scheme was proposed by the results of preliminary research conducted on five core samples with a similar lithological type and reservoir properties. We applied the proposed scheme in the analysis of the T1–T2 maps obtained for samples before and after combustion. Interpretation of the maps allowed us to categorize the total fluid saturation into several fluid types (bitumen and adsorbed oil, structural and adsorbed water, and mobile oil in inorganic porosity) and estimate the changes induced by thermal exposure.
  • Rock-Eval pyrolysis was performed in 1D and 2D testing modes, which elicited detailed knowledge on combustion front propagation inside the core plugs from different combustion tube zones. 2D pyrolysis technique demonstrated the relatively uniform distribution of OM inside the core plugs after CT. In addition, values of S0 and S1 indicated a certain amount of oil remaining in rock samples. We explain it as newly generated synthetic oil, which was trapped in the pores due to hindered migration in low-permeability rock. It can lead to the inaccurate interpretation of laboratory-scale combustion experiments involving crushed rock samples since a significant amount of generated oil remains in the core material and is not accounted for in the final material balance.
  • SEM of rock samples revealed that heating of the organic-rich shales leads to at least two processes: the transformation of OM during the heating with the formation of new voids and the formation of micro and nanofractures in the mineral matrix. All these alterations increase the porosity and homogeneity of pores distribution in the rock.
  • NMR T2 results included the determination of fluid saturation of the sample, as well as the pore size distribution before and after the combustion experiment. For low-permeability samples, NMR and Rock-Eval pyrolysis proved to be useful and reliable tools in determining the saturation of fragile core plugs and types of hydrocarbons in the rock, which can be applied in the assessment of the amount of displaced oil. In turn, conventional porosimetry also demonstrated satisfactory results in the estimation of open porosity and permeability of the rock.
In summary, the results of this preliminary research can prove a solid base for the new protocol of laboratory thermal air injection modeling, including non-disruptive testing of consolidated core samples.

Author Contributions

Conceptualization, A.M., A.C.; methodology, A.M., P.M., E.K., A.B.; experimental investigation, A.M., P.M., E.K. and T.K.; project supervision, A.C.; workflow control, A.M., T.K.; analysis, A.M., P.M., T.K.; resources, A.C.; data curation, A.M., E.K., T.K., A.C.; writing and editing, A.M., P.M., T.K., A.C. All authors have read and agreed to the published version of the manuscript.

Funding

The research work was done with the financial support of the Russian Ministry of Higher Education and Science within the framework of the development program (Rational Development of the Planet’s Liquid Hydrocarbon Reserves, 2020) for a world-class research center under agreement No. 075-15-2020-119.

Acknowledgments

The authors thank the Center for Hydrocarbon Recovery Laboratory engineering and technical staff for help in conducting the experiments, to Evgeny Popov and to the former team member, Tatiana Bondarenko, for their contribution to the project. Finally, the authors owe to anonymous peer reviewers for their time and effort to make this paper better.

Conflicts of Interest

The authors declare no conflict of interest.

Appendix A. Combustion Tube Test Details
A combustion tube experiment was performed in order to assess the potential of the HPAI method for rocks of the Bazhenov Formation [36,37,56]. The combustion tube consisted of 14 sections, equipped with individual external heaters, continuous temperature control on the section wall, and in the central part. The temperature control was carried out using built-in thermocouples. To reduce the outflow of heat into the environment, each sector on top of the heater was covered with thermal insulation. The parameters obtained in the experiment (combustion front’s speed, maximum reaction temperatures, and composition of the gases) were used in the numerical simulation of the HPAI process. We used a bulk model consisting of rock samples from target oil fields as a porous media in the tube. The reservoir temperature was equal to 100 °C, and the reservoir pressure was 27 MPa. The bulk model was saturated with a probe of degassed oil.
The combustion tube was filled with crushed rock with a fraction of 0.1–1 mm and consolidated samples of various shapes. The first two sections were filled with sand and rock samples of the Bazhenov Formation, the next four—only with the Bazhenov Formation’s rock samples, the remaining eight—with sand. The layout of the samples is shown in Figure A1.
Figure A1. Location of the analyzed samples in the combustion tube (Modified after [37]). Zone numeration corresponds to the CT section numbers.
Applsci 10 09065 g0a1
The prepared bulk model of the combustion tube was pressurized with dry air, and then the model’s gas permeability (to air) at ambient temperature (22 °C) was measured. It was equal to 2.8 μm2. Then, 5 L of oil was injected through the tube from bottom to top. The combustion tube’s pore volume and the initial oil saturation were determined based on volumes of injected and released oil. The pore volume and porosity were 2138.4 cm3 and 29.8%, respectively, and the initial oil saturation was 100%. In addition, the bulk model’s initial permeability for oil at ambient temperature (22 °C) was determined (3.3 μm2). Based on the results of the high-pressure differential scanning calorimetry (DSC) performed at a pressure of 8 MPa and a heating rate of 1 °C/min, it was decided to heat the first two sections to a temperature of 200 °C to accelerate the initiation of combustion. In all other sections, a reservoir temperature of 100 °C was maintained. The experiment was carried out in the following order.
  • Nitrogen was injected through the vertical combustion tube at a pressure of 8 MPa with a volumetric flow rate of 2.4 L/min, while the tube was heated by zones until it reached the specified temperature regime.
  • After the combustion tube reached the specified temperature regime, the air injection began with a volumetric flow rate of 2.4 L/min.
  • With a predetermined frequency, samples of the displaced fluid and gas samples were probed at the outlet of the combustion tube in order to determine the content of carbon dioxide, carbon monoxide, nitrogen, hydrogen sulfide, and hydrocarbon gases. According to the temperature logs, the propagation of the combustion front along the tube was recorded.
  • At the final stage of the experiment, the external heating was turned off in order to stop the generation of hydrogen sulfide inside the tube.
  • Rock samples were extracted from each section of the tube for further research. The air supply was stopped when the oil combustion front reached Section 5. Thus, the samples in CT section were not exposed to high temperatures.
At each stage of the experiment, the gas and oil sample composition was analyzed to assess the intensity of the oxidation reactions. Rock-Eval pyrolysis of the crushed core before and after the chemical and thermal exposure was conducted. The total residual oil saturation in the core pack was 2%. Minimal residual oil saturation was observed in zones that the combustion front has passed through, whereas the maximum oil saturation corresponds to the areas in front of the combustion front. Conversion of kerogen was observed ahead of the combustion front. The maximum temperature that was achieved as a result of the exothermic combustion reactions was 463 °C.

Appendix B

Figure A2. Photographs of the experimental units.
Applsci 10 09065 g0a2
Figure A3. Core drilling schemes (a) single-point in the middle of the sample; (b) 5 × 4; (c) drilling illustration.
Applsci 10 09065 g0a3
Figure A4. Gas porosity and permeability, NMR fluid volume, and TOC content before and after the combustion. Samples are located along the tube length, and sections counted from left to right, similar to the combustion front propagation.
Applsci 10 09065 g0a4

References

  1. Ahmed, U.; Nathan, M. Unconventional Oil and Gas Resources; CRC Press: Boca Raton, FL, USA, 2016; Volume 894. [Google Scholar]
  2. Lopatin, N.V.; Zubairaev, S.L.; Kos, I.M.; Emets, T.P.; Romanov, E.A.; Malchikhina, O.V. Unconventional Oil Accumulations in the Upper Jurassic Bazhenov Black Shale Formation, West Siberian Basin: A Self-Sourced Reservoir System. J. Petrol. Geol. 2003, 26, 225–244. [Google Scholar] [CrossRef]
  3. Kusskra, V.; Stevens, S.H.; Moodhe, K.D. Technically Recoverable Shale Oil and Shale Gas Resources: An Assessment of 137 Shale Formations in 41 Countries Outside the United States. Available online: https://www.eia.gov/analysis/studies/worldshalegas/pdf/overview.pdf?zscb=79906188 (accessed on 15 October 2020).
  4. Alvarado, V.; Manrique, E. Enhanced Oil Recovery: An Update Review. Energies 2010, 3. [Google Scholar] [CrossRef]
  5. Sheng, J.J. Critical Review of Field EOR Projects in Shale and Tight Reservoirs. J. Petrol. Sci. Eng. 2017, 159, 654–665. [Google Scholar] [CrossRef]
  6. Moore, R.G.; Mehta, S.A.; Ursenbach, M.G. A Guide to High Pressure Air Injection (HPAI) Based Oil Recovery. In Proceedings of the SPE/DOE Improved Oil Recovery Symposium, Tulsa, OK, USA, 13–17 April 2002; p. 7. [Google Scholar]
  7. Sarathi, P.S. In-situ Combustion Handbook-Prinicples and Practices; National Petroleum Technology Office. U.S. Department of Energy: Tulsa, OK, USA, 1999. [Google Scholar]
  8. Gutierrez, D.; Moore, R.G.; Ursenbach, M.G.; Mehta, S.A. The ABCs of In-Situ-Combustion Simulations: From Laboratory Experiments to Field Scale. J. Can. Petrol. Technol. 2012, 51, 256–267. [Google Scholar] [CrossRef]
  9. Kibodeaux, K.R. Evolution of Porosity, Permeability, and Fluid Saturations During Thermal Conversion of Oil Shale. In Proceedings of the SPE Annual Technical Conference and Exhibition, Amsterdam, The Netherlands, 27–29 October 2014; p. 22. [Google Scholar]
  10. Bai, F.; Sun, Y.; Liu, Y.; Guo, M. Evaluation of the Porous Structure of Huadian Oil Shale During Pyrolysis Using Multiple Approaches. Fuel 2017, 187, 1–8. [Google Scholar] [CrossRef]
  11. Sun, L.; Tuo, J.; Zhang, M.; Wu, C.; Wang, Z.; Zheng, Y. Formation and Development of the Pore Structure in Chang 7 Member Oil-shale from Ordos Basin during Organic Matter Evolution Induced by Hydrous Pyrolysis. Fuel 2015, 158, 549–557. [Google Scholar] [CrossRef]
  12. Geng, Y.; Liang, W.; Liu, J.; Cao, M.; Kang, Z. Evolution of Pore and Fracture Structure of Oil Shale under High Temperature and High Pressure. Energy Fuels 2017, 31, 10404–10413. [Google Scholar] [CrossRef]
  13. Kobchenko, M.; Panahi, H.; Renard, F.; Dysthe, D.K.; Malthe-Sørenssen, A.; Mazzini, A.; Scheibert, J.; Jamtveit, B.; Meakin, P. 4D Imaging of Fracturing in Organic-Rich Shales during Heating. J. Geophys. Res. Solid Earth 2011, 116. [Google Scholar] [CrossRef]
  14. Panahi, H.; Kobchenko, M.; Renard, F.; Mazzini, A.; Scheibert, J.; Dysthe, D.; Jamtveit, B.; Malthe-Sørenssen, A.; Meakin, P. A 4D Synchrotron X-Ray-Tomography Study of the Formation of Hydrocarbon-Migration Pathways in Heated Organic-Rich Shale. SPE J. 2013, 18, 366–377. [Google Scholar] [CrossRef]
  15. Saif, T.; Lin, Q.; Singh, K.; Bijeljic, B.; Blunt, M.J. Dynamic Imaging of Oil Shale Pyrolysis using Synchrotron X-ray Microtomography. Geophys. Res. Lett. 2016, 43, 6799–6807. [Google Scholar] [CrossRef] [Green Version]
  16. Tiwari, P.; Deo, M.; Lin, C.L.; Miller, J.D. Characterization of Oil Shale Pore Structure Before and After Pyrolysis by Using X-ray Micro CT. Fuel 2013, 107, 547–554. [Google Scholar] [CrossRef]
  17. Birdwell, J.E.; Lewan, M.D.; Miller, M. Geochemical Changes and Fracture Development in Woodford Shale Cores Following Hydrous Pyrolysis under Uniaxial Confinement. In Proceedings of the SPE/AAPG/SEG Unconventional Resources Technology Conference, Denver, CO, USA, 12–14 August 2013; p. 8. [Google Scholar]
  18. Lewan, M.D.; Birdwell, J.E. Application of Uniaxial Confining-core Clamp with Hydrous Pyrolysis in Petrophysical and Geochemical Studies of Source Rocks at Various Thermal Maturities. In Proceedings of the SPE/AAPG/SEG Unconventional Resources Technology Conference, Denver, CO, USA, 12–14 August 2013; p. 8. [Google Scholar]
  19. Washburn, K.E.; Birdwell, J.E.; Lewan, M.D.; Miller, M. Changes in Porosity and Organic Matter Phase Distribution Monitored by NMR Relaxometry Following Hydrous Pyrolysis Under Uniaxial Confinement. In Proceedings of the SPE/AAPG/SEG Unconventional Resources Technology Conference, Denver, CO, USA, 12–14 August 2013; p. 7. [Google Scholar]
  20. Liu, Z.; Yang, D.; Hu, Y.; Zhang, J.; Shao, J.; Song, S.; Kang, Z. Influence of In Situ Pyrolysis on the Evolution of Pore Structure of Oil Shale. Energies 2018, 11, 755. [Google Scholar] [CrossRef] [Green Version]
  21. Tisot, P.R. Alterations in Structure and Physical Properties of Green River Oil Shale by Thermal Treatment. J. Chem. Eng. Data 1967, 12, 405–411. [Google Scholar] [CrossRef]
  22. Deng, S.; Wang, Z.; Gu, Q.; Meng, F.; Li, J.; Wang, H. Extracting Hydrocarbons from Huadian Oil Shale by Sub-critical Water. Fuel Proc. Technol. 2011, 92, 1062–1067. [Google Scholar] [CrossRef]
  23. Sander, R.; Pan, Z.; Connell, L.D. Laboratory Measurement of Low Permeability Unconventional Gas Reservoir Rocks: A Review of Experimental Methods. J. Natural Gas Sci. Eng. 2017, 37, 248–279. [Google Scholar] [CrossRef]
  24. Simpson, G.A.; Fishman, N.S. Unconventional Tight Oil Reservoirs: A Call For New Standardized Core Analysis Workflows And Research. In Proceedings of the International Symposium of the Society of Core Analysts, St. John’s, NL, Canada, 16–21 August 2015. [Google Scholar]
  25. Guidry, K.; Luffel, D.; Curtis, J. Development of Laboratory and Petrophysical Techniques for Evaluating Shale Reservoirs; Gas Technology Institite: Des Plaines, IL, USA, 1996; p. 304. [Google Scholar]
  26. Straley, C.; Rossini, D.; Vinegar, H.J.; Tutunjan, P.; Morriss, C.E. Core Analysis by Low-Field NMR. Log Anal. 1997, 38, 84–94. [Google Scholar]
  27. Liu, Z.; Liu, D.; Cai, Y.; Yao, Y.; Pan, Z.; Zhou, Y. Application of Nuclear Magnetic Resonance (NMR) in Coalbed Methane and Shale Reservoirs: A review. Int. J. Coal Geol. 2020, 218, 103261. [Google Scholar] [CrossRef]
  28. Fleury, M.; Romero-Sarmiento, M.-F. Characterization of Shales Using T1–T2 NMR Maps. J. Petrol. Sci. Eng. 2015, 137. [Google Scholar] [CrossRef] [Green Version]
  29. Camp, W.K. Electron Microscopy of Shale Hydrocarbon Reservoirs. In AAPG Memoir 102; American Association of Petroleum Geologists: Tulsa, OK, USA, 2013. [Google Scholar]
  30. Ţălu, Ş. Micro and Nanoscale Characterization of Three Dimensional Surfaces: Basics and Applications; Napoca Star: Cluj, Romania, 2015. [Google Scholar]
  31. Popov, E.; Bondarenko, T.; Dobrovolskaya, S.; Kalmykov, A.; Morozov, N.; Erofeev, A. The Potential of Tertiary Methods Application for Unconventional Hydrocarbon Systems Exposure on the Example of Bazhenov Formation. OIl Ind. 2017, 54–57. [Google Scholar] [CrossRef]
  32. Khakimova, L.; Bondarenko, T.; Cheremisin, A.; Myasnikov, A.; Varfolomeev, M. High Pressure Air Injection Kinetic Model for Bazhenov Shale Formation Based on a set of oxidation studies. J. Petrol. Sci. Eng. 2019, 172, 1120–1132. [Google Scholar] [CrossRef]
  33. Popov, E.; Kalmykov, A.; Cheremisin, A.; Bychkov, A.; Bondarenko, T.; Morozov, N.; Karpov, I. Laboratory Investigations of Hydrous Pyrolysis as Ternary Enhanced Oil Recovery Method for Bazhenov Formation. J. Petrol. Sci. Eng. 2017, 156, 852–857. [Google Scholar] [CrossRef]
  34. Prishchepa, O.M.; Averianova, O.Y.; Ilyinskiy, A.A.; Morariu, D. Tight Oil and Gas Formations-Russia’s Hydrocarbons Future Resources; VNIGRI: Saint-Petersburg, Russia, 2014. [Google Scholar]
  35. Zhirong Zhang, J.K.V.; Paul, F.G.; Wenxuan, H.; Jianzhong, Q.; Tenger, B.; Changbo, Z.; Weixin, L. Flash Pyrolysis of Kerogens from Algal Rich Oil Shales from the Eocene Huadian Formation, NE China. Organ. Geochem. 2014, 76, 167–172. [Google Scholar] [CrossRef]
  36. Bondarenko, T.; Popov, E.; Cheremisin, A.; Kozlova, E.; Karpov, I.; Morozov, N. Laboratory Modeling of High-Pressure Air injection in Oil Fields of Bazhenov formation. OIl Ind. 2017, 3, 34–39. [Google Scholar] [CrossRef]
  37. Bondarenko, T. Evaluation of High-Pressure Air Injection Potential for In-Situ Synthetic Oil Generation from Oil Shale: Bazhenov Formation; Skolkovo Institute of Science and Technology: Moscow, Russia, 2018. [Google Scholar]
  38. Kontorovich, A.E.; Moskvin, V.I.; Bostrikov, O.I.; Danilova, V.P.; Fomin, A.N.; Fomichev, A.S.; Kostyreva, E.A.; Melenevsky, V.N. Main Oil Source Formations of the West Siberian Basin. Petrol. Geosci. 1997, 3, 343–358. [Google Scholar] [CrossRef]
  39. Lazar, O.R.; Bohacs, K.M.; Schieber, J.; Macquaker, J.H.; Demko, T.M. Mudstone Primer: Lithofacies Variations, Diagnostic Criteria, and Sedimentologic-Stratigraphic Implications at Lamina to Bedset Scales; SEPM (Society for Sedimentary Geology): Tulsa, OK, USA, 2015. [Google Scholar]
  40. Balushkina, N.S.; Kalmykov, G.A.; Belokhin, V.S.; Khamidullin, R.A.; Korost, D.V. Siliceous Reservoirs of the Bazhenov Formation, the Sredny Nazym Oil Field, and the Structure of Their Pore Space. Moscow Univ. Geol. Bull. 2014, 69, 91–100. [Google Scholar] [CrossRef]
  41. Khamidullin, R.R.; Kalmykov, G.A.; Korost, D.V.; Balushkina, N.S.; Bakay, A.I. Reservoir Properties of the Bazhenov Formation. In Proceedings of the SPE Russian Oil and Gas Exploration and Production Technical Conference and Exhibition, Moscow, Russia, 16–18 October 2012; p. 11. [Google Scholar]
  42. Geologika. PIK-PP Automated Unit for Measurung Porosity and Permeability of Rock Samples: User Manual; Geologika Internal Publishing: Novosibirsk, Russia, 2016. [Google Scholar]
  43. Abragam, A. The Principles of Nuclear Magnetism; Clarendon Press: Oxford, UK, 1961; 599p. [Google Scholar]
  44. Callaghan, P. Principles of Nuclear Magnetic Resonance Microscopy; Clarendon Press: Oxford, UK, 1991. [Google Scholar]
  45. Bloembergen, N.; Purcell, E.M.; Pound, R.V. Relaxation Effects in Nuclear Magnetic Resonance Absorption. Phys. Rev. 1948, 73, 679–712. [Google Scholar] [CrossRef]
  46. Green Imaging Technologies. GIT Systems and Lithometrix R7.0: User Manual; Green Imaging Technologies Internal Publishing: Fredericton, NB, Canada, 2014. [Google Scholar]
  47. Peters, K.E. Guidelines for Evaluating Petroleum Source Rock using Programmed Pyrolysis. Am. Assoc. Petrol. Geol. Bull. 1986, 70, 318–329. [Google Scholar]
  48. Espitalie, J.; Bordenave, M. Rock-Eval Pyrolysis; Editions Technip: Paris, France, 1993; pp. 237–261. [Google Scholar]
  49. Erdman, N.; Drenzek, N. Integrated Preparation and Imaging Techniques for the Microstructural and Geochemical Characterization of Shale by Scanning Electron Microscopy. In AAPG Memoir. Electron Microscopy of Shale Hydrocarbon Reservoirs; AAPG: Tulsa, OK, USA, 2013; Volume 102, pp. 7–14. [Google Scholar]
  50. Washburn, K.E.; Birdwell, J.E. Updated Methodology for Nuclear Magnetic Resonance Characterization of Shales. J. Magnet. Reson. 2013, 233, 17–28. [Google Scholar] [CrossRef]
  51. Rylander, E. NMR 2D Distributions in the Eagle Ford Shale: Reflections on Pore Size. In Proceedings of the SPE Unconventional Resources Conference-USA. Society of Petroleum Engineers, The Woodlands, TX, USA, 10–12 April 2013. [Google Scholar]
  52. Kausik, R.E.A. NMR Relaxometry in Shale and Implications for Logging. In Proceedings of the SPWLA 56th Annual Logging Symposium, Long Beach, CA, USA, 18–22 July 2015. [Google Scholar]
  53. Khatibi, S.; Ostadhassan, M.; Xie, H.; Gentzis, T.; Bubach, B.; Gan, Z.; Carvajal-Ortiz, H. NMR Relaxometry a New Approach to Detect Geochemical Properties of Organic Matter in Tight Shales. Fuel 2018, 235. [Google Scholar] [CrossRef]
  54. Zhang, P.; Lu, S.; Li, J.; Chang, X. 1D and 2D Nuclear Magnetic Resonance (NMR) Relaxation Behaviors of Protons in Clay, Kerogen and Oil-bearing Shale Rocks. Mar. Petrol. Geol. 2020, 114, 104210. [Google Scholar] [CrossRef]
  55. Li, J.; Huang, W.; Lu, S.; Wang, M.; Chen, G.; Tian, W.; Guo, Z. Nuclear Magnetic Resonance T1–T2 Map Division Method for Hydrogen-Bearing Components in Continental Shale. Energy Fuels 2018, 32. [Google Scholar] [CrossRef]
  56. Li, J.; Jiang, C.; Wang, M.; Lu, S.; Chen, Z.; Chen, G.; Jijun, L.; Li, Z.; Lu, S. Adsorbed and Free Hydrocarbons in Unconventional Shale Reservoir: A New Insight From NMR T1–T2 Maps. Mar. Petrol. Geol. 2020, 116, 104311. [Google Scholar] [CrossRef]
  57. Bondarenko, T.; Mukhametdinova, A.; Popov, E.; Cheremisin, A.; Kalmykov, A.; Karpov, I. Analysis of Changes in Bazhenov Formation Rock Properties as a Result of High-Pressure Air Injection Based on Laboratory Modelling Data. OIl Ind. 2017, 3, 40–44. [Google Scholar] [CrossRef]
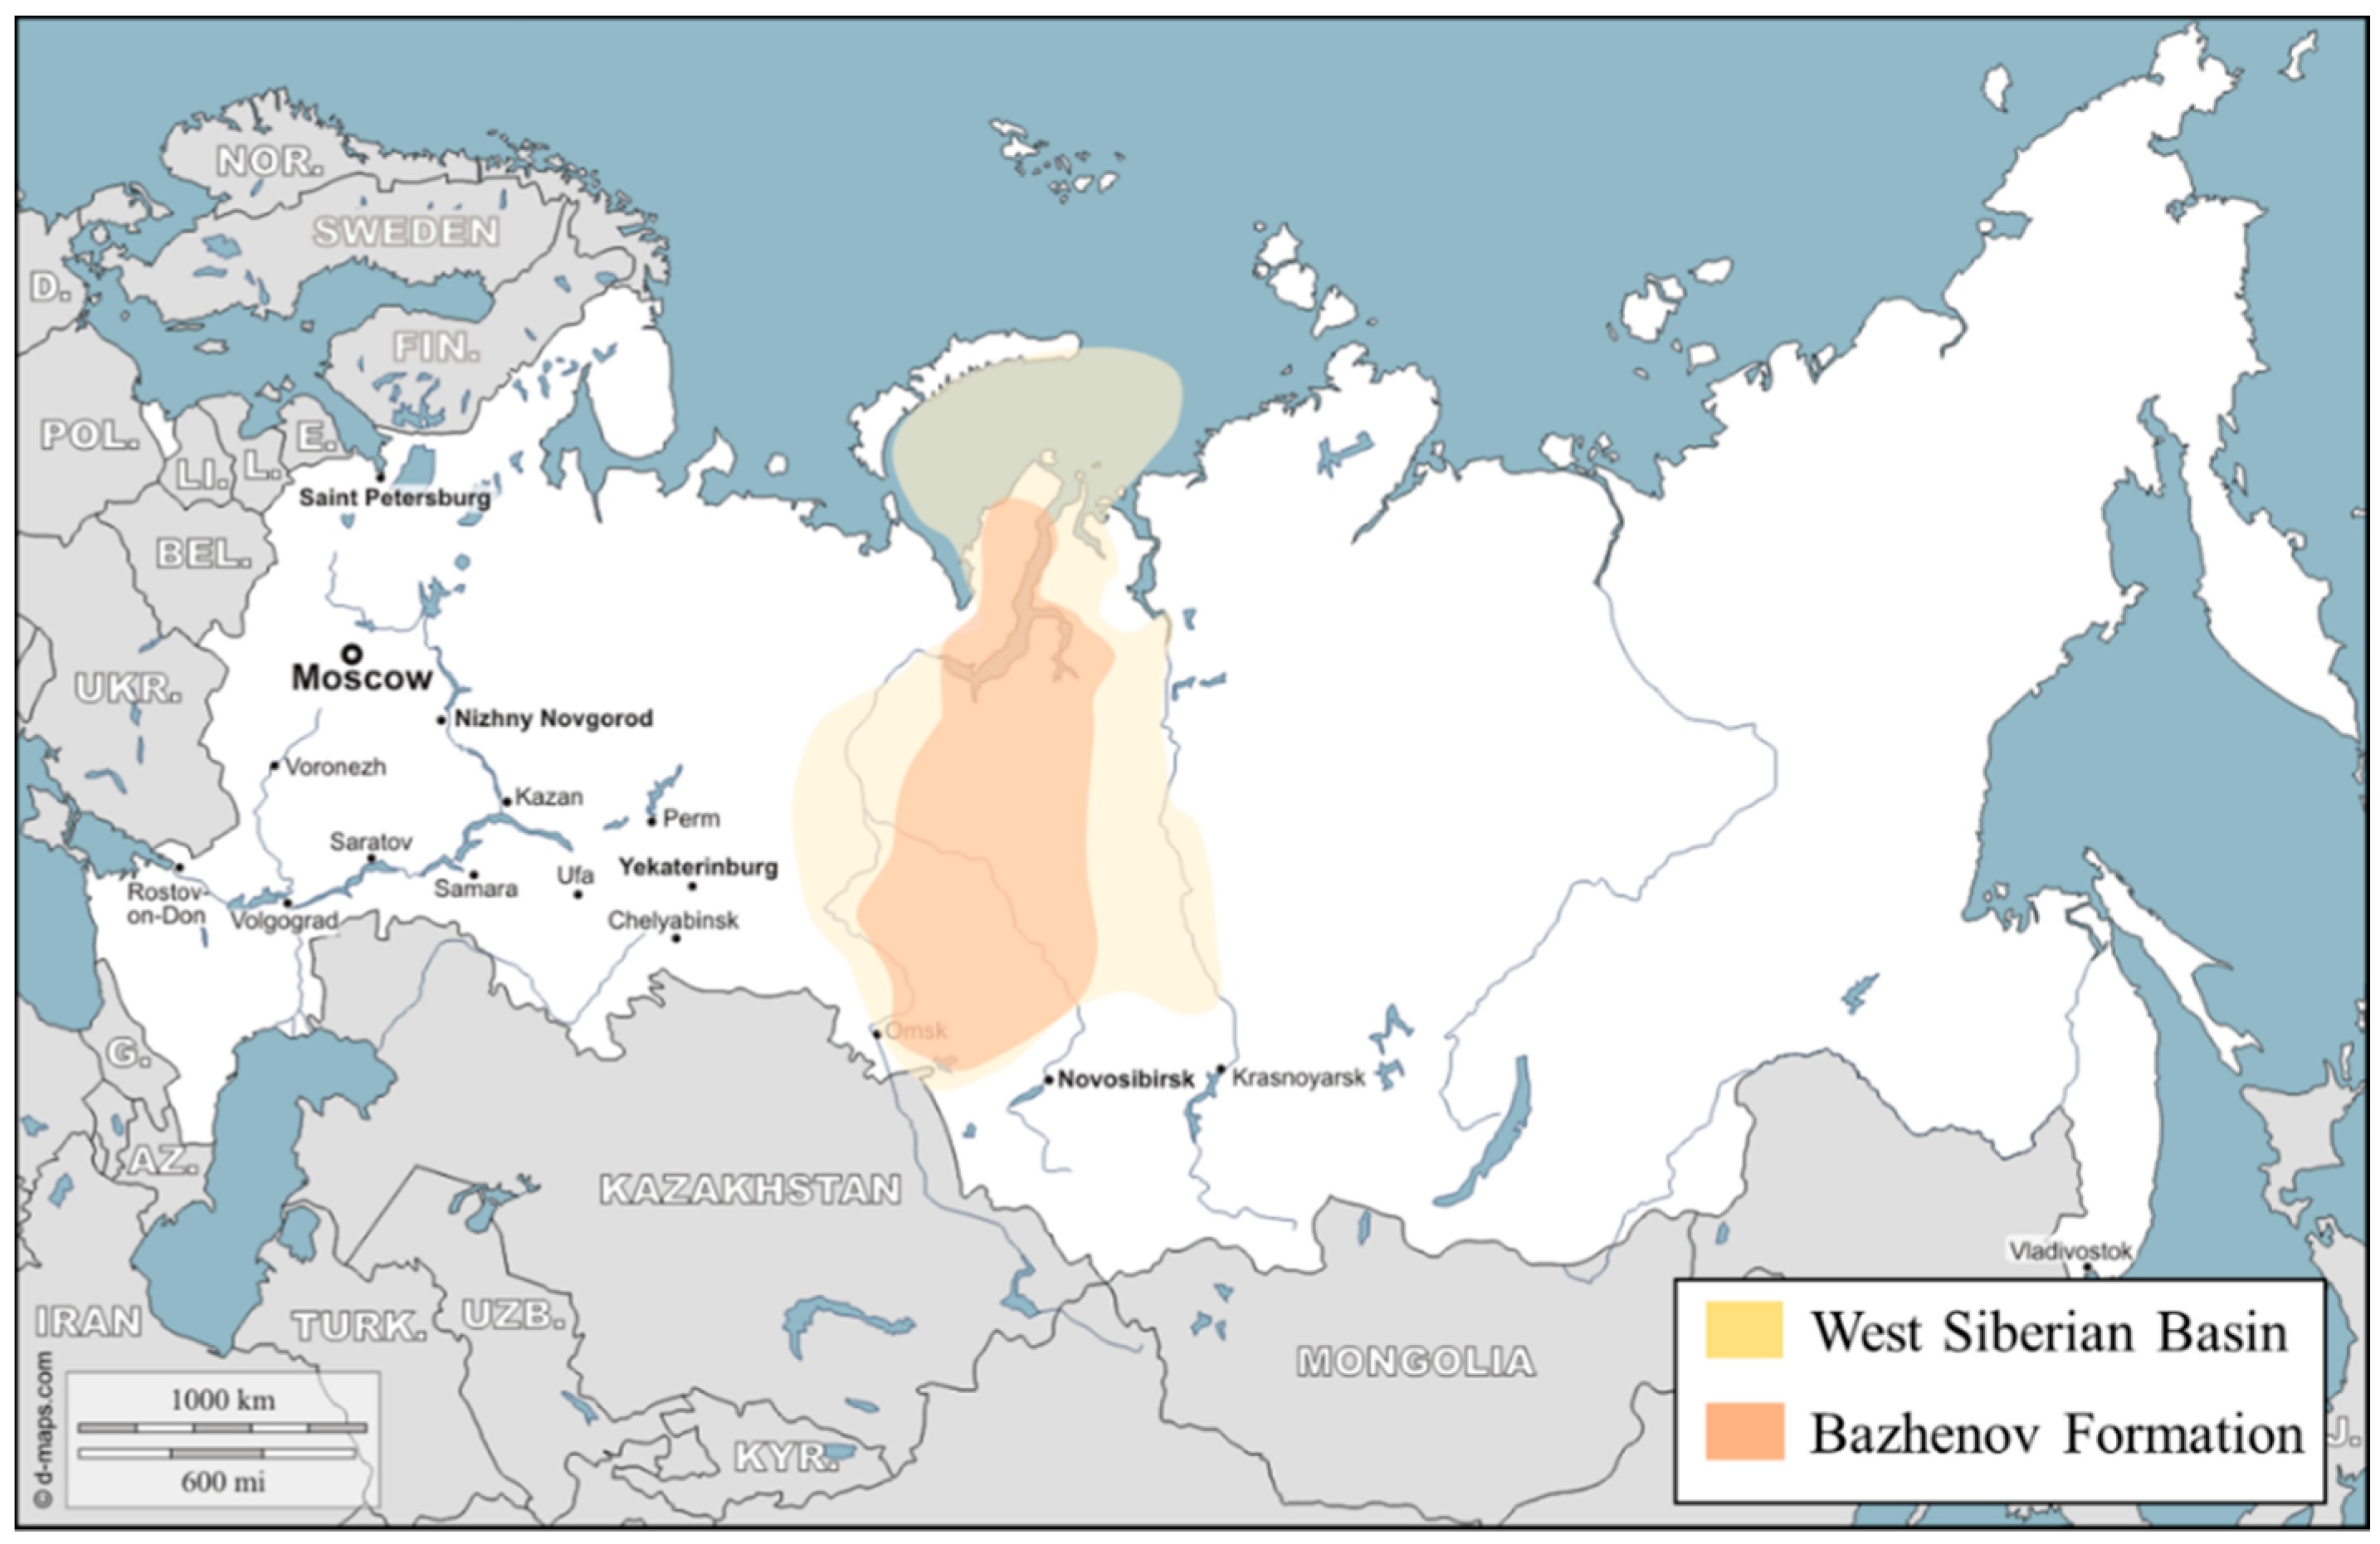
Figure 1. The geographical location of the Bazhenov Formation.
Applsci 10 09065 g001
Figure 2. Photographs of cylindrical samples after the combustion tube experiment (modified after [37]).
Applsci 10 09065 g002
Figure 3. Change in gas porosity before and after the combustion.
Applsci 10 09065 g003
Figure 4. SEM images of the samples before the experiment: (A) voids in the sample #12, (B) organic matter in sample #12; (C) voids in the sample #16/18, (D) porous organic matter in the sample #16/18.
Applsci 10 09065 g004
Figure 5. Voids initially filled with OM. SEM images of the samples after the experiment (A) sample 12, (B) sample #16.
Applsci 10 09065 g005
Figure 6. Shrinkage of OM, arrows indicate vacated space around an inclusion. SEM images of the sample #16 after the experiment.
Applsci 10 09065 g006
Figure 7. Newly formed fractures after the experiment on different scales, (A) sample #16, (B,C) sample #12.
Applsci 10 09065 g007
Figure 8. Pores in the sample #16 after the experiment.
Applsci 10 09065 g008
Figure 9. T1–T2 maps of BF sample—Sample n5—in (a) as-received state; (b) dried state; (c) decane-saturated state; (d) brine-resaturated state.
Applsci 10 09065 g009
Figure 10. NMR analysis of sample #16: (a) T2 relaxation before (blue) and after CT (red); (b) T1–T2 map for as-received sample; (c) saturation profiles before (blue) and after CT (red); (d) T1–T2 map for the burnt sample.
Applsci 10 09065 g010
Figure 11. Change in the fluid saturation by NMR after the combustion.
Applsci 10 09065 g011
Figure 12. Distributions of S0+S1 (evaporated hydrocarbons content, mg HC/g rock), S2 (HC products of kerogen decomposition content, mg HC/g rock), and TOC (%wt.) after thermal exposure in samples (a) #10; (b) #12. (c) #15.
Applsci 10 09065 g012
Figure 13. Pore size distribution for target samples (a) #2, CT section; (b) #12, CT section
Applsci 10 09065 g013
Figure 14. Cross plot of (a) porosity by gas; (b) permeability; (c) residual saturation by NMR; (d) residual TOC vs. temperature. Change of porosity and NMR fluid volume is calculated as follows: Change (fraction) = (parameter before CT − parameter after CT/parameter before CT). Triangle-shaped symbols indicate the measured parameter before CT. Samples #13 and #14 are not demonstrated at (a) due to high values of gas porosity (see Table 4).
Applsci 10 09065 g014
Table 1. Rock-forming minerals of the target formation.
Mineral Composition (%)
QuartzClay MineralsK FeldsparNa FeldsparPyriteDolomite
61.227.70.08.90.61.6
Table 2. Test design strategy.
ExperimentSampleObjective
Porosity and permeability by gasCylinders, 30 × 30 mmChange in porosity and permeability under different temperature exposure
NMR relaxometryCylinders, 30 × 30 mmEvaluation of the change in saturation by NMR
Rock-Eval pyrolysis
SEM
Core powder, 30 mg
Core chip, 3 × 3 mm
Study of the OM transformation
Table 3. List of the investigated samples.
Sample ID.Oil FieldLithologyCT ZoneExposed Temperature (°C)
1Oil Field 1Siliceous rocks2.1301
2 2.2369
3 3.1430
10 6.1207
12 4.1463
13Oil Field 2Mixed argillaceous-siliceous rocks2.2368
14 3.4461
15 4.2422
16Oil Field 3Siliceous rocks2.1300
18 3.1430
n1, n2, n3, n4, n5Oil Field 4Mixed argillaceous-siliceous rocksn/an/a
Table 4. Gas porosity and permeability before and after the combustion.
Sample IDSectionTemperature (°C)Porosity before CT (%)Permeability before CT (mD)Porosity after CT (%)Permeability after CT (mD)
12.13001.070.0044.040.062
22.23681.280.0031.910.034
33.14300.540.0338.270.769
106.12070.950.0030.840.014
124.14621.410.0037.240.030
132.23680.580.02426.075.770
143.44610.470.01231.924.277
154.24220.620.0071.270.085
162.12992.810.0533.301.591
183.14292.430.06518.390.577
Avg. 1.220.02110.331.321
SD 0.810.0211.182.04
Table 5. Pyrolytic properties of samples before CT.
Sample IDOil FieldS1S2S3TOCTmax
mg HC/g Rockmg HC/g Rockmg CO2/g Rockwt.%°C
1/213.96100.20.3414.01424
1011.4136.650.396.01429
1210.6338.360.245.39428
13/1526.30107.60.216.98433
16/1836.9531.260.317.98446
Avg. 3.8562.810.2910.07n/a
SD 2.8337.690.085.15n/a
Table 6. Pyrolytic properties of samples after CT.
Sample IDOil FieldS0S1S2S3TOCTmax
mg HC/g Rocksmg HC/g Rocksmg HC/g Rocksmg CO2/g Rockswt.%°C
110.050.134.560.701.55425
210.300.553.250.491.43430
310.040.10.440.381.41457
1324.2017.1422.990.1710.88439
1522.202.6926.420.245.30434
1830.190.691.330.164.86586
Avg. 1.163.559.830.364.24n/a
SD 1.706.7311.660.213.71n/a
Table 7. Results of NMR T1–T2 interpretation for target samples before and after CT.
Sample IDBefore CTAfter CT
Total Fluid Volume (cc)Bitumen & Adsorbed Oil (%)Structural & Adsorbed Water (%)Mobile Oil in IP (%)Total Fluid Volume (cc)Bitumen & Adsorbed Oil (%)Structural & Adsorbed Water (%)Mobile Oil in IP (%)
10.4284.228.405.340.3386.458.135.96
20.3486.296.456.720.1768.8626.755.26
30.3282.147.658.160.00231.7213.1018.62
10----0.4928.7864.397.19
12----0.2844.7441.6710.53
141.1493.832.532.028·10−8 *n/an/an/a
150.7677.6816.1911.230.3281.202.8714.36
160.8659.9842.184.540.0385.847.775.18
180.9059.2541.095.120.72020.830
Avg.0.6877.6317.786.160.2953.4523.198.39
SD0.3213.2316.802.930.2431.9820.835.89
* the total fluid volume of the sample is too small for component separation.
Publisher’s Note: MDPI stays neutral with regard to jurisdictional claims in published maps and institutional affiliations.