Article

The Effect of Carbonyl and Hydroxyl Compounds Addition on CO2 Injection through Hydrocarbon Extraction Processes

by
Asep Kurnia Permadi
1,*,
Egi Adrian Pratama
1,
Andri Luthfi Lukman Hakim
1,2,
Alfanda Kurnia Widi
1 and
Doddy Abdassah
1
1
Department of Petroleum Engineering, Faculty of Mining and Petroleum Engineering, Institut Teknologi Bandung, Bandung 40132, Indonesia
2
KSO Bass Oil-Sukananti Ltd., Jakarta 12950, Indonesia
*
Author to whom correspondence should be addressed.
Appl. Sci. 2021, 11(1), 159; https://doi.org/10.3390/app11010159
Submission received: 17 November 2020 / Revised: 17 December 2020 / Accepted: 22 December 2020 / Published: 26 December 2020
(This article belongs to the Special Issue Advanced Oil Recovery Technologies)

Abstract

:
CO2 miscible flooding occurs when injection pressure is higher than the minimum miscibility pressure (MMP) which can exceed the fracture pressure. Co-solvents are expected to reduce the MMP by interacting with various hydrocarbons that depend on the polarity and intermolecular forces of solvent and oil. However, there are limited studies that have investigated co-solvent performance in CO2 injection through an extraction process based on oil compositional analysis. This paper is aimed at studying the effects of carbonyl and hydroxyl compounds on oil extraction and also the mutual interactions of CO2-oil-carbonyl and -hydroxyl. The experiment is conducted by using VIPS (viscosity, interfacial tension, pressure-volume, and swelling) and gas chromatography (GC) apparatuses. The compositional results from GC are utilized to analyze the performance of co-solvents, which are further classified based on the carbon number and molecular structure of oil. Acetone is a non-associated polar compound which reacts easily with and assists CO2 to extract polar-aromatic heavy and slightly polar components such as alkenes and straight-chain alkanes, due to high polarizability and low cohesive forces. Ethanol is a self-associated polar compound which has the capability of extracting high-boiling fractions and slightly polar-aromatic components. Moreover, both co-solvents also assist CO2 to extract non-polar components because they have non-polar end in the alkyl group.

1. Introduction

Oil field development is carried out in three stages, namely, primary, secondary, and tertiary recovery. The third stage is also known as enhanced oil recovery (EOR). CO2 injection/flood is one of the EOR methods. For years, it has been well known that the optimum CO2 flood depends on the miscibility condition.
The miscibility condition between CO2 and reservoir crude oil determines how much oil is recovered. Identification of a miscibility condition between injected gas and crude oil is important for oil recovery in EOR. The miscibility is described as the ability of two or more substances to form a single homogeneous phase when mixed in all proportions [1]. The miscibility is also defined as a physical condition between two or more liquids that can be mixed in all proportions in the absence of an interface contact. If two liquid phases are formed after the addition of the amount of one liquid, then the liquids are considered to be immiscible [2]. Higher oil recovery from reservoir can be achieved by CO2 displacement if the injection pressure is greater than a certain minimum pressure. This minimum pressure is hereafter defined as the CO2 minimum miscibility pressure, abbreviated as MMP [3]. Other authors have defined the MMP as the lowest pressure at which the CO2 injection fluid can develop miscibility with reservoir crude oil at reservoir temperature [4]. The common range of reservoir temperature, especially in Air Benakat formation where the sample was taken, is between 104 °F to 158 °F. The MMP determines whether the CO2 gas injection is a miscible or otherwise an immiscible process.
Many efforts have been tried to decrease MMP, one of them is by using co-solvent. Co-solvent is a substance that helps solvent mix with targeted substances. In CO2 EOR, co-solvent helps CO2 extract crude oil. Co-solvents, especially polar ones such as water, methanol, acetone, ethyl acetate, toluene, petroleum ether, and ethanol, are used as a modifier in CO2 extraction performance [5,6,7,8]. A co-solvent interacts either with the solute, solvent, or both [5]. Pressure and temperature factors affect interaction and chemical equilibria.
Polarity happens when there are electronegativity differences in molecule. According to polarity, there are two types of molecules, i.e., polar and non-polar molecules. A polar molecule has net dipole, and therefore its bonds are asymmetrically arranged. Meanwhile, a non-polar molecule has zero dipole, and thus its bonds are symmetrically arranged [9]. Polarity of a molecule has an effect on its physical properties such as solubility, boiling point, and intermolecular forces [10]. Intermolecular forces, which mean attractive forces between molecules, are divided into six types which are in order from the strongest, hydrogen bond, dipole-dipole, ion-induced dipole, induced-dipole, and London dispersion [10].
Furthermore, volatility of compound and physical properties (molecular weight, boiling point, and molecular shape) are other factors that affect the solubility of CO2 in crude oil [5]. From research done by Rudyk et al. [5], Day et al. [7], and Fletcher and Heller [11], their results indicated that the solubility of CO2 in acetone was larger than that in ethanol [7]. The addition of a carbonyl-group component, such as acetone, enables greater extraction of heavier compounds and higher-boiling fractions than that being extracted with the presence of a hydroxyl-group component such as ethanol [5]. This occurs because ethanol behaves as a polar and self-associated substance. Therefore, with the hydrogen bond owned by ethanol, the cohesion forces of the molecule are very strong. They also tend to interact with polar fractions and higher-boiling fractions that possibly form hydrogen bonds instead of CO2. In contrast, acetone is a non-associated-polar substance because acetone does not have hydrogen bond. As a result, acetone has lower cohesion forces and is more interactive with CO2 than ethanol [7].
Several studies have performed CO2 injection with co-solvent assistance for oil extraction, as previously explained. In this study, we explain the effects of carbonyl and hydroxyl compounds on oil extraction and also the mutual interactions among CO2-oil-carbonyl and -hydroxyl compounds. The experiment was conducted by using VIPS (viscosity, interfacial tension, pressure-volume, and swelling) apparatus to obtain swelling factor, viscosity, and interfacial tension (IFT) simultaneously. Gas chromatography (GC) results were utilized to analyze the performance of co-solvents in terms of compositional analysis, which are further classified based on carbon number and molecular structure of oil. Aromatic crude oils from Indonesia were used for the experiments.

2. Materials and Methods

2.1. Materials

The crude oil sample was collected from a stock tank at the M Field located in Jambi, Indonesia. The reservoir is originated at 1370 psig and 153 °F. At reservoir condition, the properties and compositions of the crude oil sample are shown in Table 1 and Table 2. The solvents used in this experiment are acetone and ethanol as a representative of carbonyl and hydroxyl compounds, respectively. The densities of acetone and ethanol at 68 °F are 45.5 and 49.2 lb/ft3, respectively.

2.2. Procedures

The CO2 injection experiment which contained the swelling and vanishing interfacial tension (VIT) test was conducted at 131 °F and 158 °F working temperature and up to 2000 psia of working pressure. The parameters that resulted from the experiment were collected as pressure increased during injection. The compositional analysis obtained from the GC experiment of the original sample and remaining oil resulted from CO2-ethanol mixture injection at 131 °F and CO2-acetone mixture injection at 158 °F.
The experiment used a combination of VIPS and GC apparatuses and consisted of two steps, i.e., the CO2 injection experiment and the GC analysis. The former apparatus was invented by Hakim [12]. The VIPS apparatus was designed to be a multifunctional solution for several measurement methods such as PVT cell/synthetic live oil generation, swelling apparatus/viewing cell, high pressure and temperature viscosity measurement, and VIT/pendant drop, which can be used to measure several parameters simultaneously to determine the MMP. This apparatus can operate up to 5000 psi and 212 °F. The novel apparatus diagram is shown in Figure 1.
The swelling cell consisted of a set of see-through windowed high-pressurized cells built using a tubing-formed sapphire glass and thick stainless steel around the glass. This cell had an inner diameter of 0.82″ and height of 8.27″. Some part of the steel had holey windows to give a space for visual observation. For the cleaning step, the swelling cell and the lines flowed by oil were initially flushed using toluene to ensure that no residue was left inside. Before commencing the experiment, a heater was turned on for several hours to ensure all material had similar temperatures to air bath. First, the swelling cell was loaded with an amount of oil sample, and then the solvents were introduced for the solvent additive case. The solvent addition was set to be 10% of the oil weight. To complete the loading step, then, the cell was injected with a certain amount of CO2 using a syringe pump (260D, Teledyne ISCO Inc., Lincoln, NE, USA), until a minimum desired pressure. The pressurizing process was conducted by either injecting CO2 into the piston tube or introducing CO2 into the swelling cell.
After a certain pressure and temperature, the sample was circulated through Valve 8 to Valve 5 (refers to Figure 1) and flowed back into the swelling cell until an equilibrium condition was reached. The circulation was accomplished by two cycles of oil volume to meet stabilized pressure. The swelling factor and the viscosity were measured directly after equilibrium by using a height scale and viscosity probe, respectively. The viscosity was measured by using a vibrating-type viscometer at resonance frequency (MIVI 7000, Sofraser, Villemandeur, France). The active part of the sensor is a vibrating rod which holds in oscillation at its resonance frequency by a constant electrical power.
Then, the sample inside the swelling cell was pumped to the pendant viewing cell using an HPLC pump (Waters 501, Waters Corp., Milford, MA, USA). A macro camera (Basler AG, Ahrensburg, Germany) was connected to a personal computer for measuring the IFT through a digital image of the dynamic pendant oil drop captured by the camera. The IFT was measured from the captured image using DROPimage software (ramé-hart Instrument Co., Succasunna, NJ, USA). The drop shape was determined by a contour fitting algorithm and results in linear polynomials. The final calculation was accomplished using the theoritical profiles produced by a numerical integration of the Young–Laplace equation.
After the CO2 injection experiment was performed, the remaining sample from that experiment was taken to analyze the CO2 extraction performance using a complete set of commercial GC apparatus (Agilent 7820A, Agilent Technologies Inc., Santa Clara, CA, USA). The GC operations were recorded by OpenLAB CDS software resulting in retention time. Then, the GC analysis results were converted from retention time against current to chemical compound names against mole percent. The data interpretation was done similar to the study by Rezk and Foroozesh [13].

3. Results and Discussion

3.1. Experimental Results

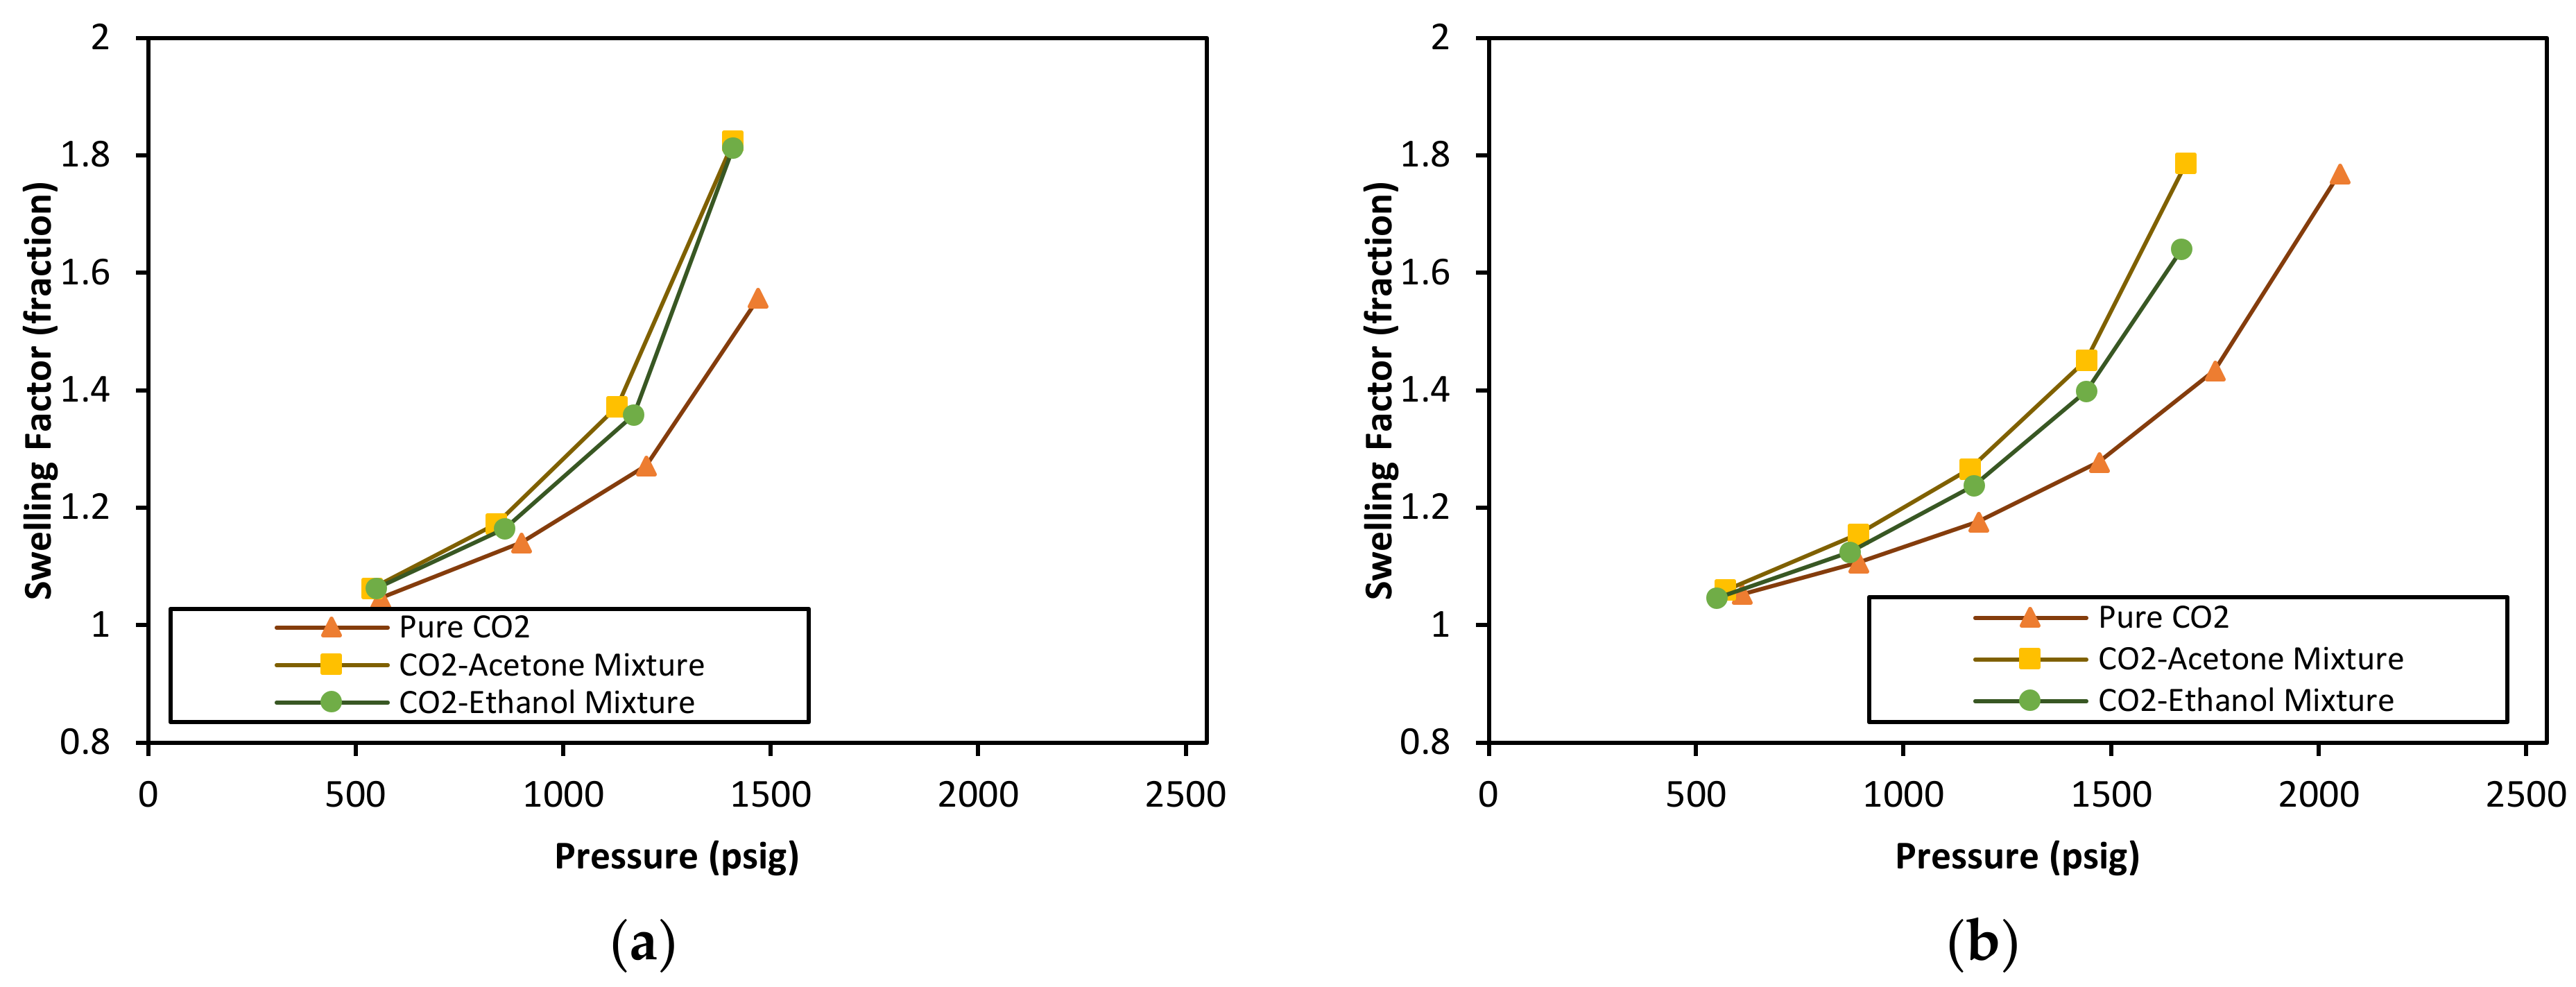
A swelling test was conducted to obtain swelling factors at various pressures. Through the swelling test, the MMP could be estimated by understanding three distinct stages during the CO2-oil mixing processes, i.e., condensation, condensation-extraction, and extraction. The MMP can be determined when there is an intersection between condensation-extraction and extraction straight-line curves [14]. Not shown in Figure 2a, the CO2-ethanol mixture injection at 131 °F is the only case that shows decreasing swelling factor after the condensation stage occurs. However, a different phenomenon is shown by other cases with an increasing trend of swelling factor continuously until they reach maximum pressure, and then form miscible condition. Furthermore, it is believed that the CO2-ethanol mixed injection at 131 °F should have been miscible, as the experiment at 158 °F shows miscible condition at the same working pressure. Although no apparatus problem was verified and no experimental anomaly was proven, further evaluation should be conducted to answer that behavior [12]. Shadow from vibration rod may cause this strange phenomenon. The CO2-solvent mixture injection, for both acetone and ethanol, increases crude oil swelling factor values higher than pure CO2 injection. Specifically, the CO2-acetone mixture swelling factor trend-line is slightly higher than the CO2-ethanol mixture for the two working temperatures. This means that acetone works better than ethanol in terms of swelling factor parameter.
The VIT technique was applied to obtain the IFT values by which MMP of CO2-crude oil could be determined. The concept is that the IFT value of CO2-crude oil approaches zero when they become miscible, as no interface formed between these fluids afterward. Therefore, the MMP can be determined by linearly extrapolating the IFT values to the point of zero [15,16]. On the basis of the interpretation of Figure 3, it can be stated that co-solvents assist CO2 to decrease the IFT between CO2-crude oil by which the IFT curves of co-solvent mixture cases drop faster than that of pure CO2 injection. CO2-acetone mixture is the case that results in the lowest value of MMP. The MMP values of pure CO2, CO2-ethanol, and CO2-acetone mixture injection at 131 °F are, respectively, 1667.36, 1552.86, and 1529.58 psia. Meanwhile at 158 °F, the values are 2049.95, 1812.86, and 1741.33 psia, respectively. From those MMP values, it supports the statement that acetone is the most effective co-solvent for assisting CO2 to decrease the IFT between CO2-crude oil, and also the MMP as a consequence. Other research has shown that the influence of acetone is more significant on MMP reduction than other alcohol substances [17].
After the CO2 injection experiments were performed, the remaining oil from VIPS apparatus was utilized for compositional analysis. The GC experiment was applied for compositional analysis of the original oil and the remaining oil after pure CO2 and CO2-solvent mixture injection. The CO2-ethanol mixture injection is analyzed by GC at 131 °F of working temperature, while the CO2-acetone mixture injection is analyzed at 158 °F of working temperature. The working temperatures were chosen according to Rudyk et al. [5,18] and Hussain [19]. To clarify the cases, Table 3 displays the case’s names with their description based on GC results.
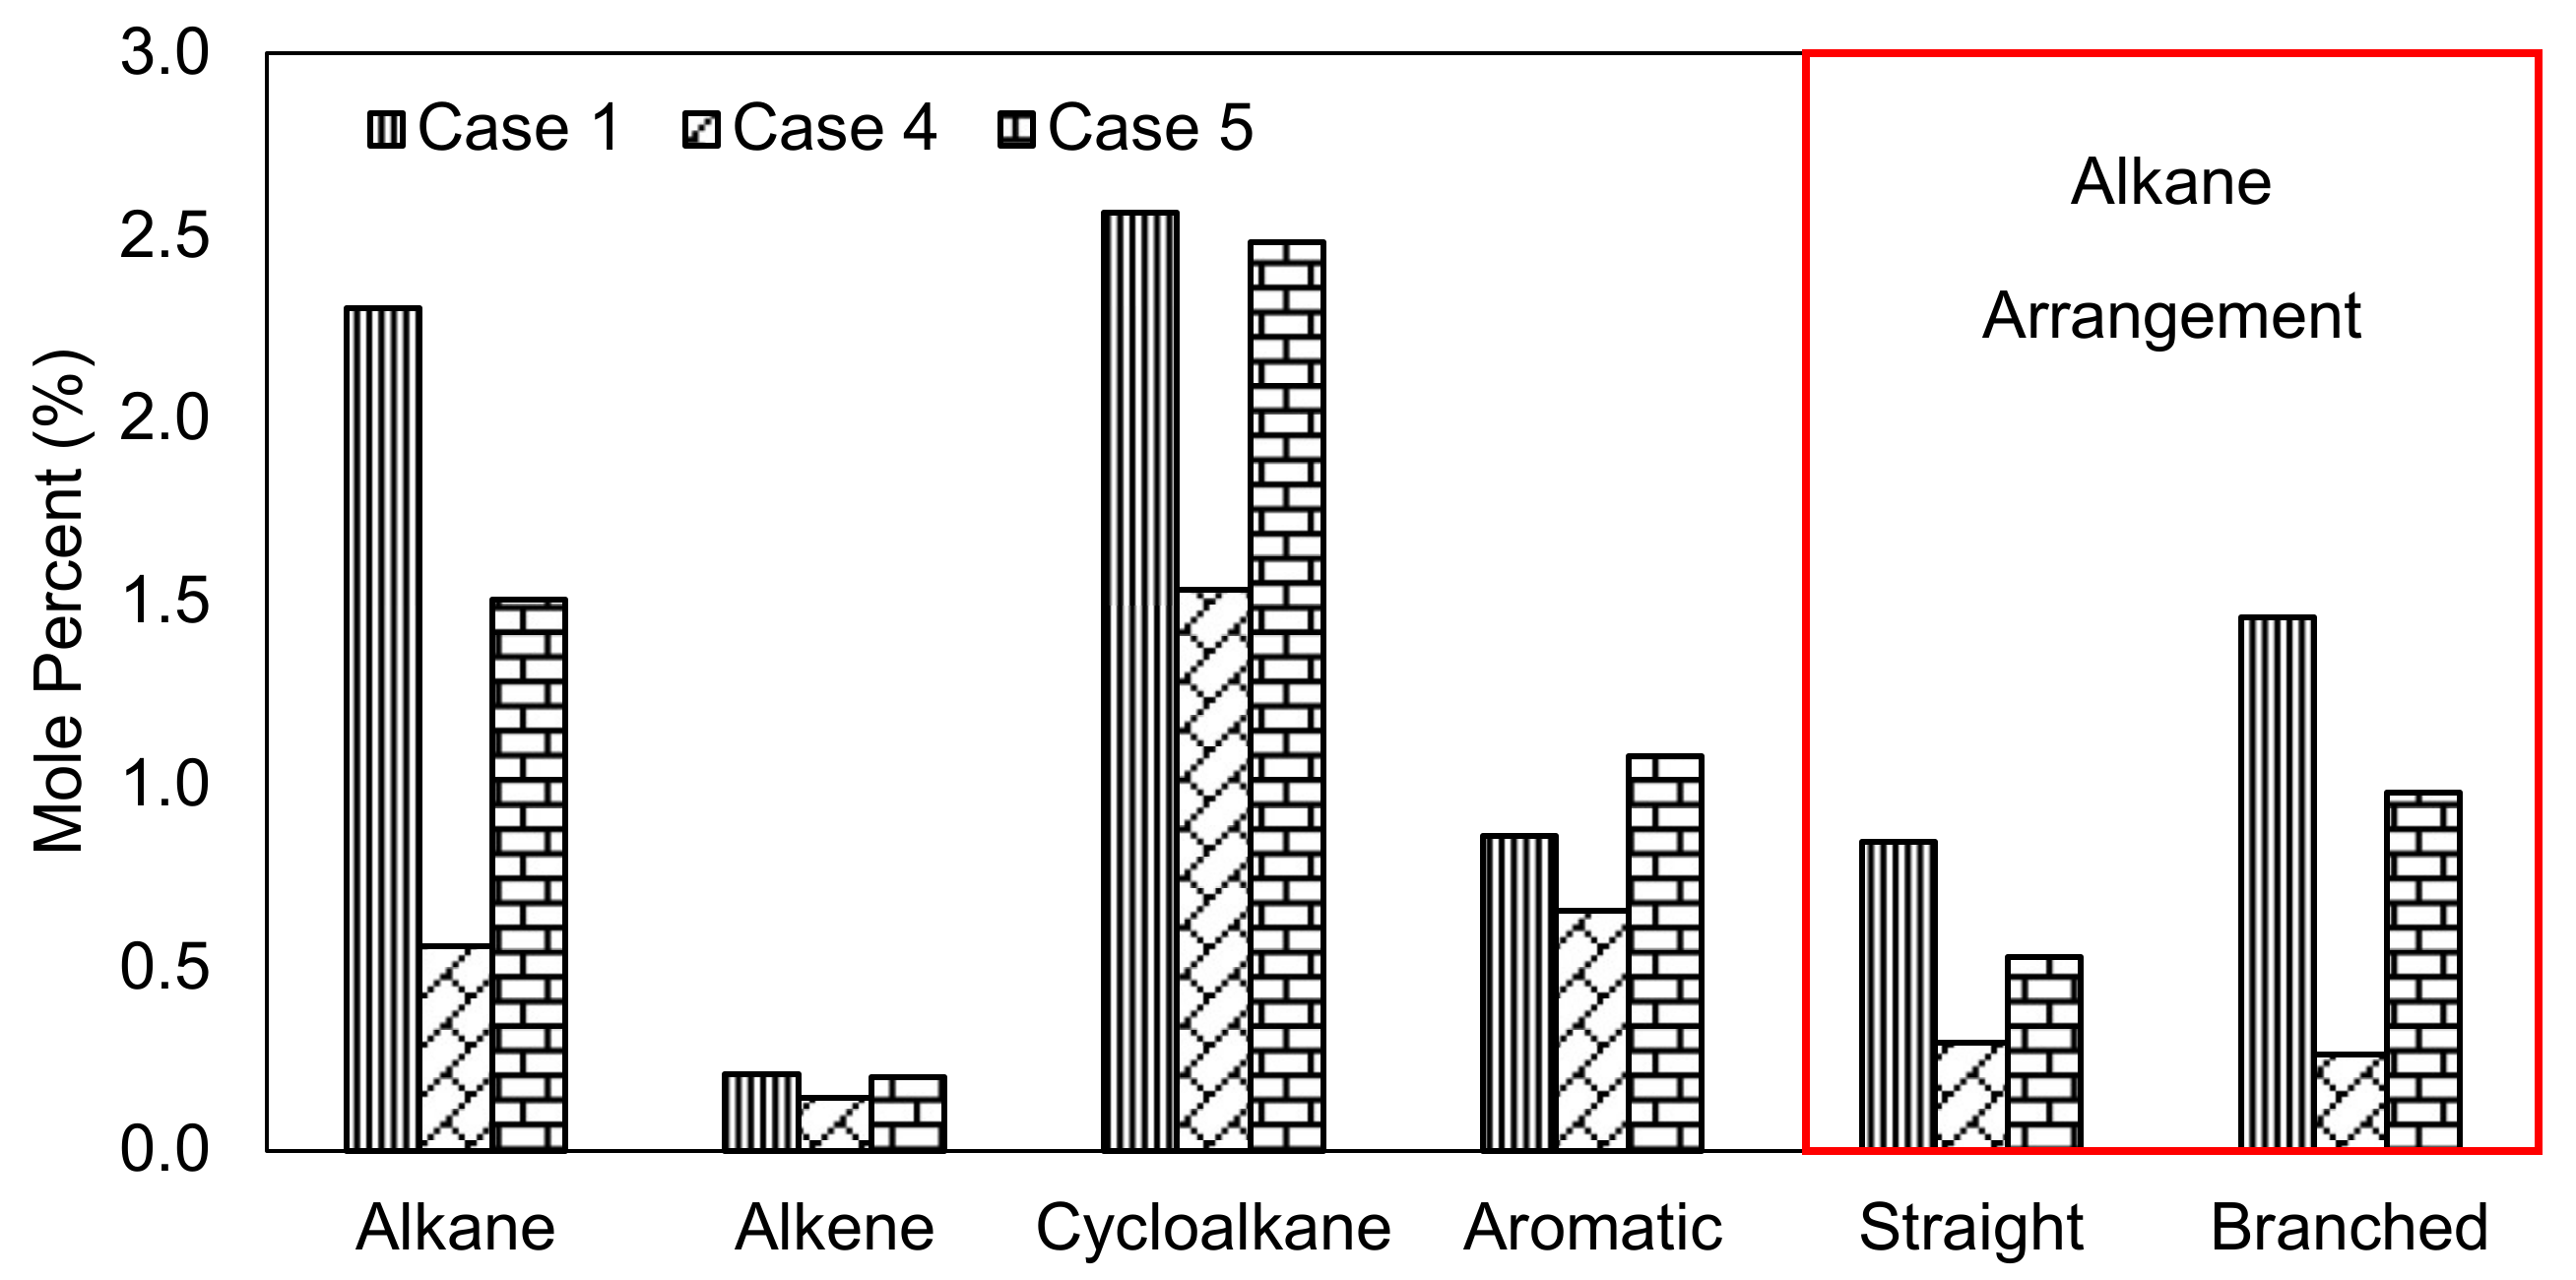
The performance of ethanol as a co-solvent is identified through a comparison among Cases 1, 2, and 3; a comparative analysis of Cases 1, 4, and 5 is done for acetone. The GC results were converted to the chemical compound name against mole percent, as shown in Figure 4. The high carbon number also had already been lumped to C7+. Although the detailed composition of C7+ was not known, a previous analysis by the operating company that has oil fingerprint showed that the oil was dominated by aromatic components, as shown in Table 2.

3.2. Extraction Phenomena Due to Co-Solvent

According to the GC results in Figure 4a, it is obvious that the intermediate and heavy components of oil are removed effectively by the CO2-ethanol mixture injection at 131 °F. Meanwhile, based on Figure 4b, the CO2-acetone mixture focuses on extracting more heavy components of crude oil at 158 °F. From these phenomena, co-solvents obviously assist CO2 to extract intermediate and heavy components during injection. However, if pure CO2 injection at 131 °F and 158 °F are compared, heavy components are extracted more effectively at a low temperature than at a high temperature. This happens because CO2 solubility decreases as temperature increases [13]. Moreover, a certain amount of acetone and ethanol are left within the remaining oil instead of being vaporized with CO2 in all proportion during the experiment.
As discussed earlier, the physical properties, such as molecular weight that is represented by carbon number and molecular structure of crude oil, affect oil extractability [5,10]. In accordance with the available data, carbon number could be classified into low- (C1-C2), intermediate- (C3-C6), and high- (C7+) carbon number components. On the basis of molecular structure, hydrocarbons are split into two main classes, which are aliphatic and aromatic. Aliphatic hydrocarbons are further divided into alkane, alkene, alkyne, and their cyclic analogs (cyclo-aliphatic) families [20]. In this work, the structures that were analyzed are alkane, alkene, cyclo-aliphatic (especially cycloalkane), and aromatic. In addition, branched-chain alkanes do not exhibit the same physical properties as the straight-chain alkanes. The different physical properties are caused by the difference in intermolecular forces that is directly affected by hydrocarbon chain arrangement [20]. Therefore, alkanes are further classified, based on the arrangement of hydrocarbon chain, into straight-chain alkanes and branched-chain alkanes. In this case, C7+ components were excluded from analysis based on chemical structures, due to less detailed information of C7+ composition.
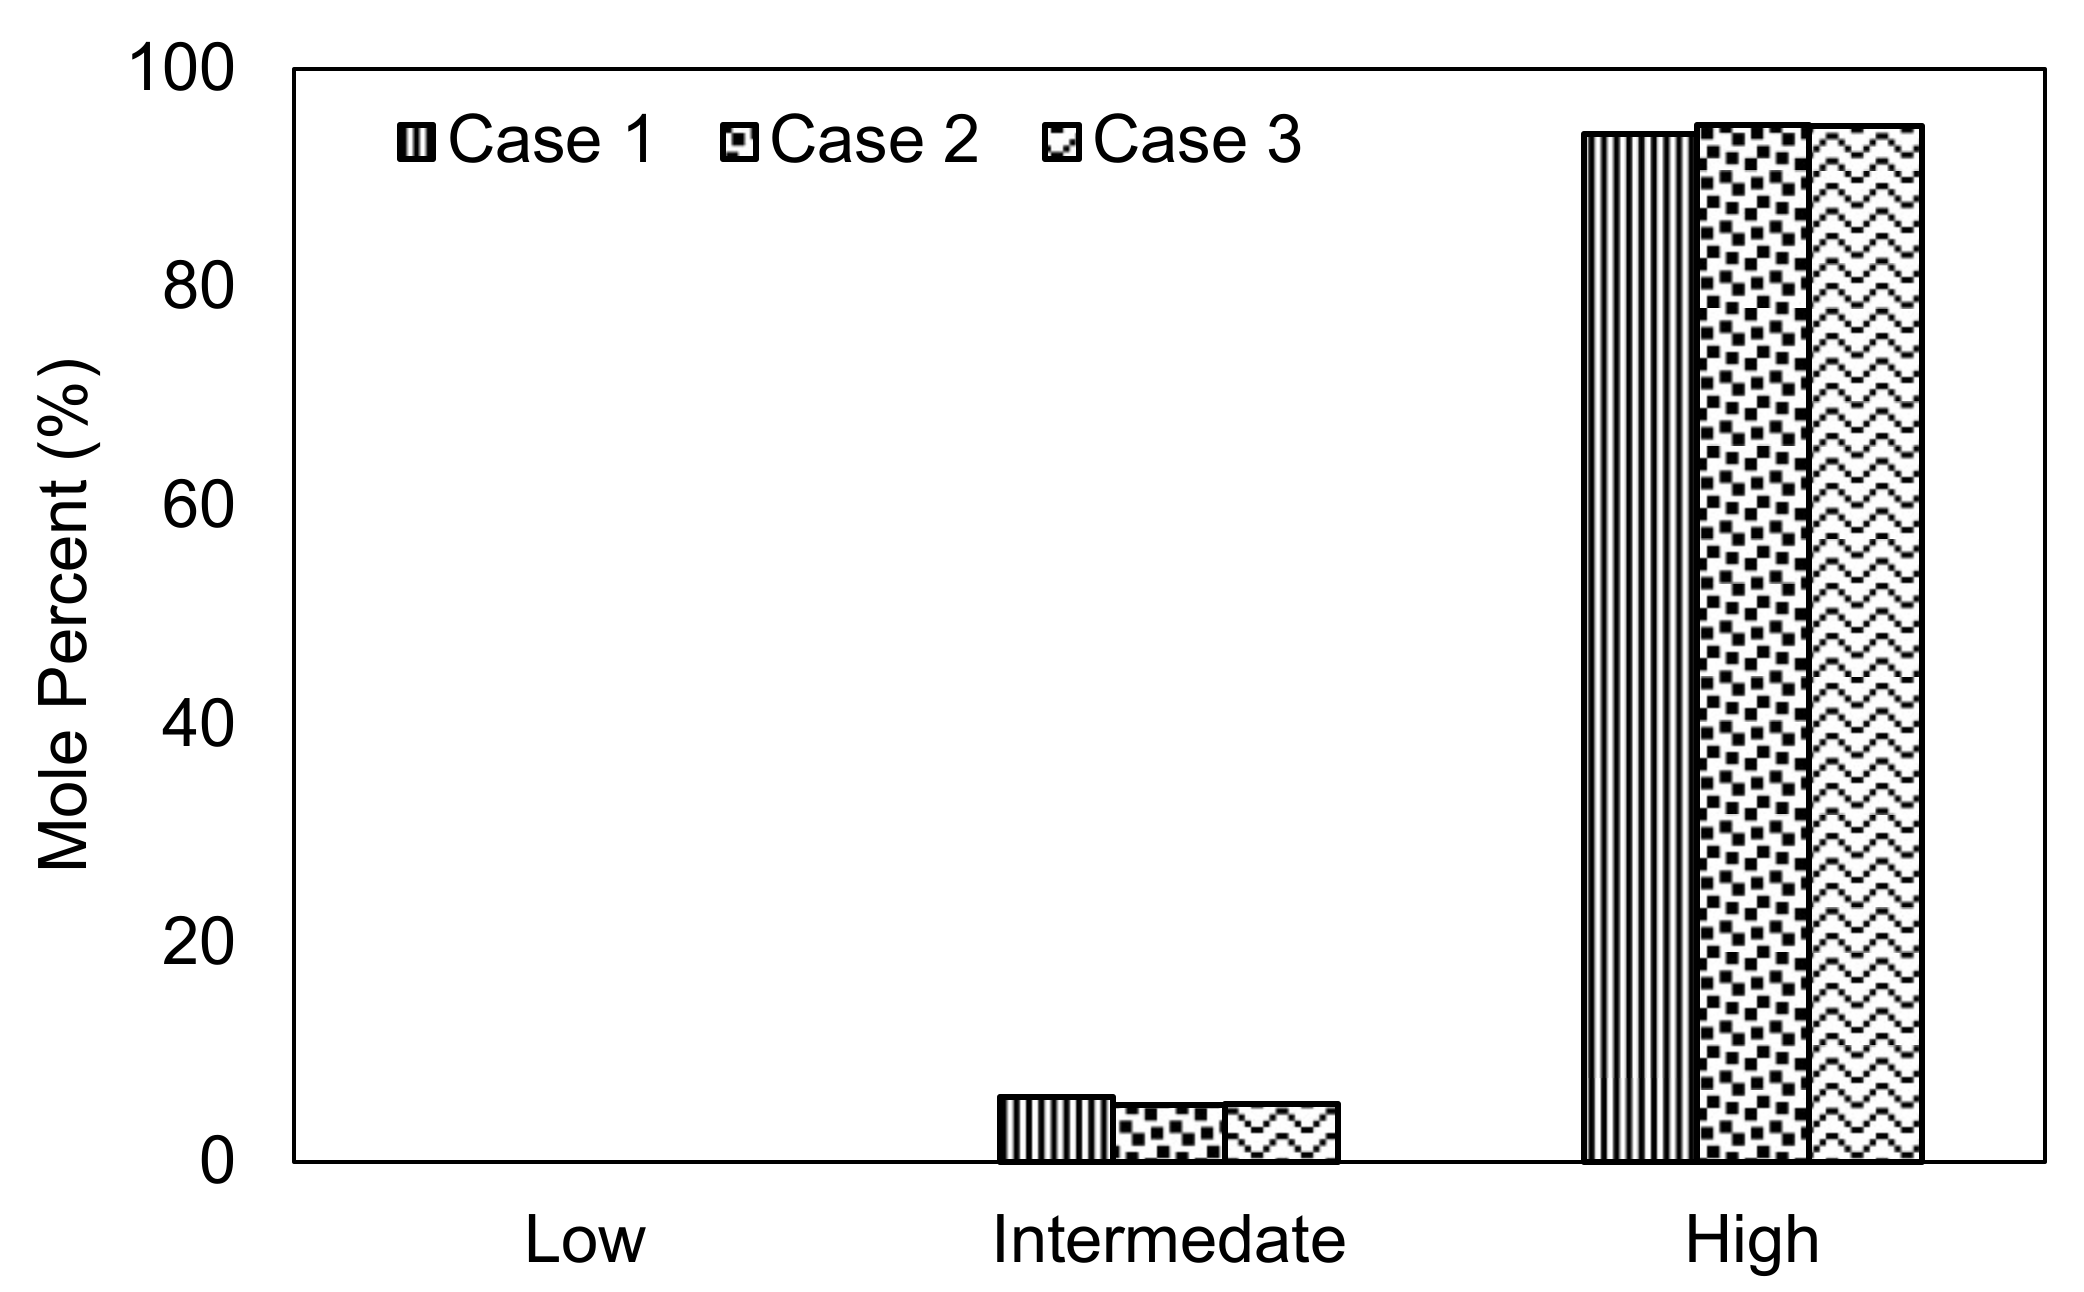
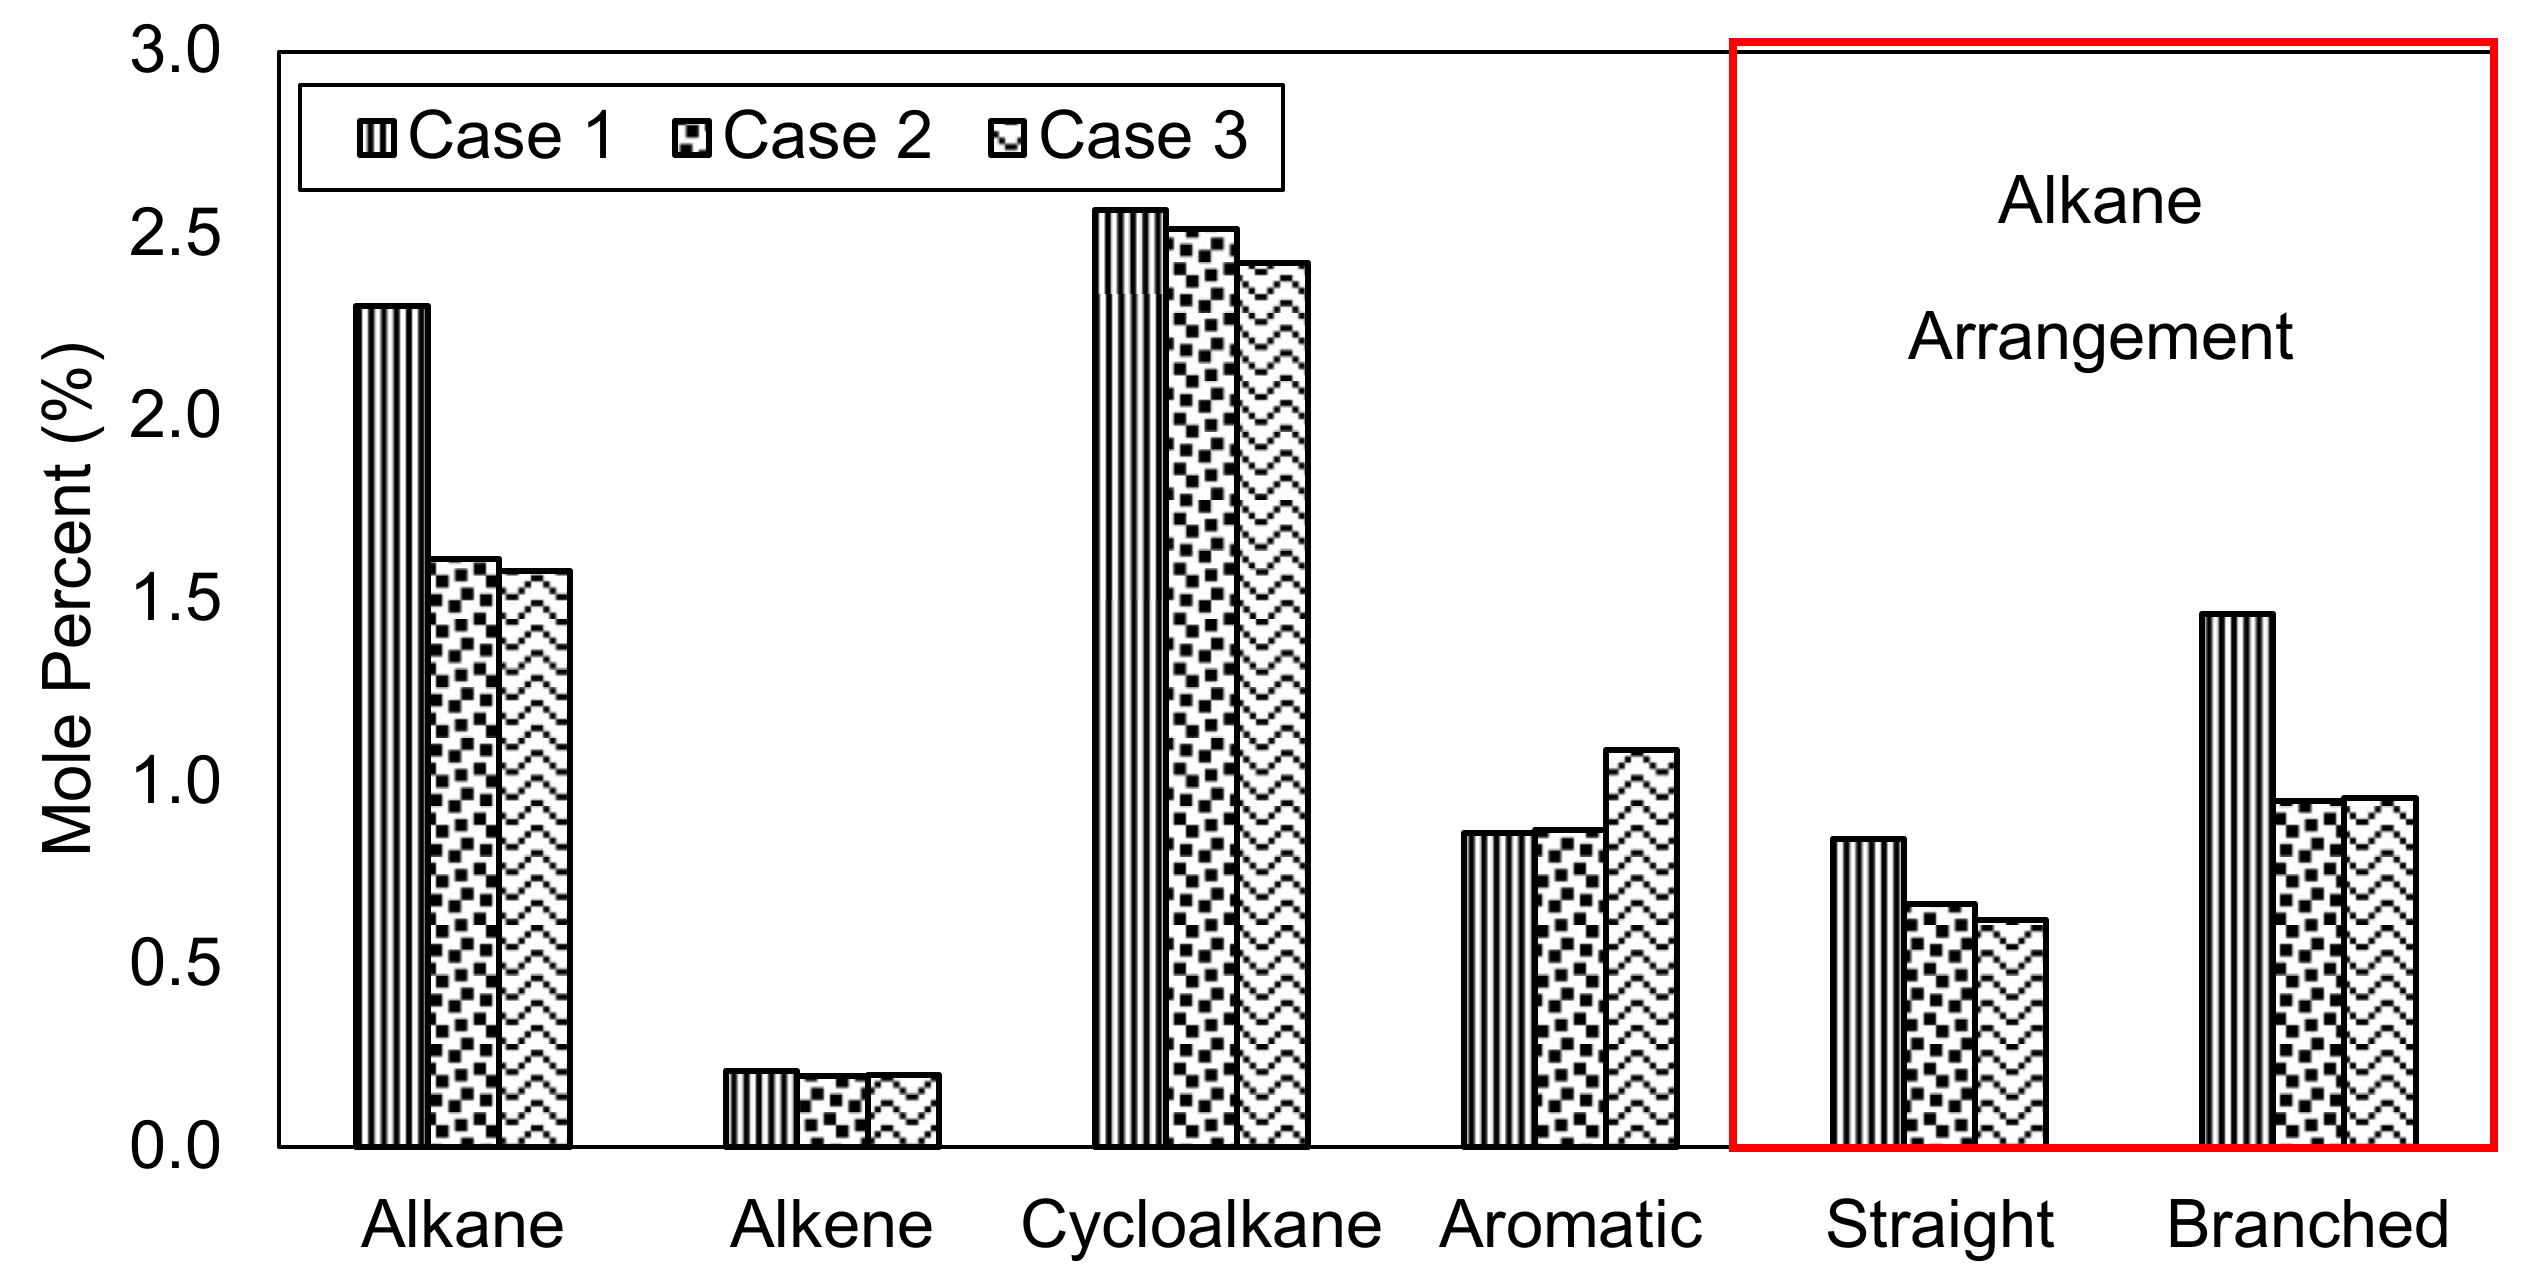
As shown in Figure 5, Case 3 (CO2-ethanol mixture injection) removes high carbon numbers even slightly better than Case 2 (pure CO2 injection at 131 °F). Meanwhile, Case 2 focuses on extracting intermediate-carbon number components. Low carbon number components such as methane and ethane do not appear on the remaining oil. The higher mole percent of high carbon number of Case 2 and Case 3 than that of Case 1 represents better extraction on intermediate component than heavy component by pure CO2 and CO2-ethanol mixture injection. Because the data is provided in percent, deduction of intermediate composition will increase the mole percent of high carbon number components. According to Figure 6, ethanol assists to extract non-polar structures such as alkanes and cycloalkanes. In addition, ethanol slightly extracts molecules of alkene. Nevertheless, CO2 is able to work on extraction of all these structures.
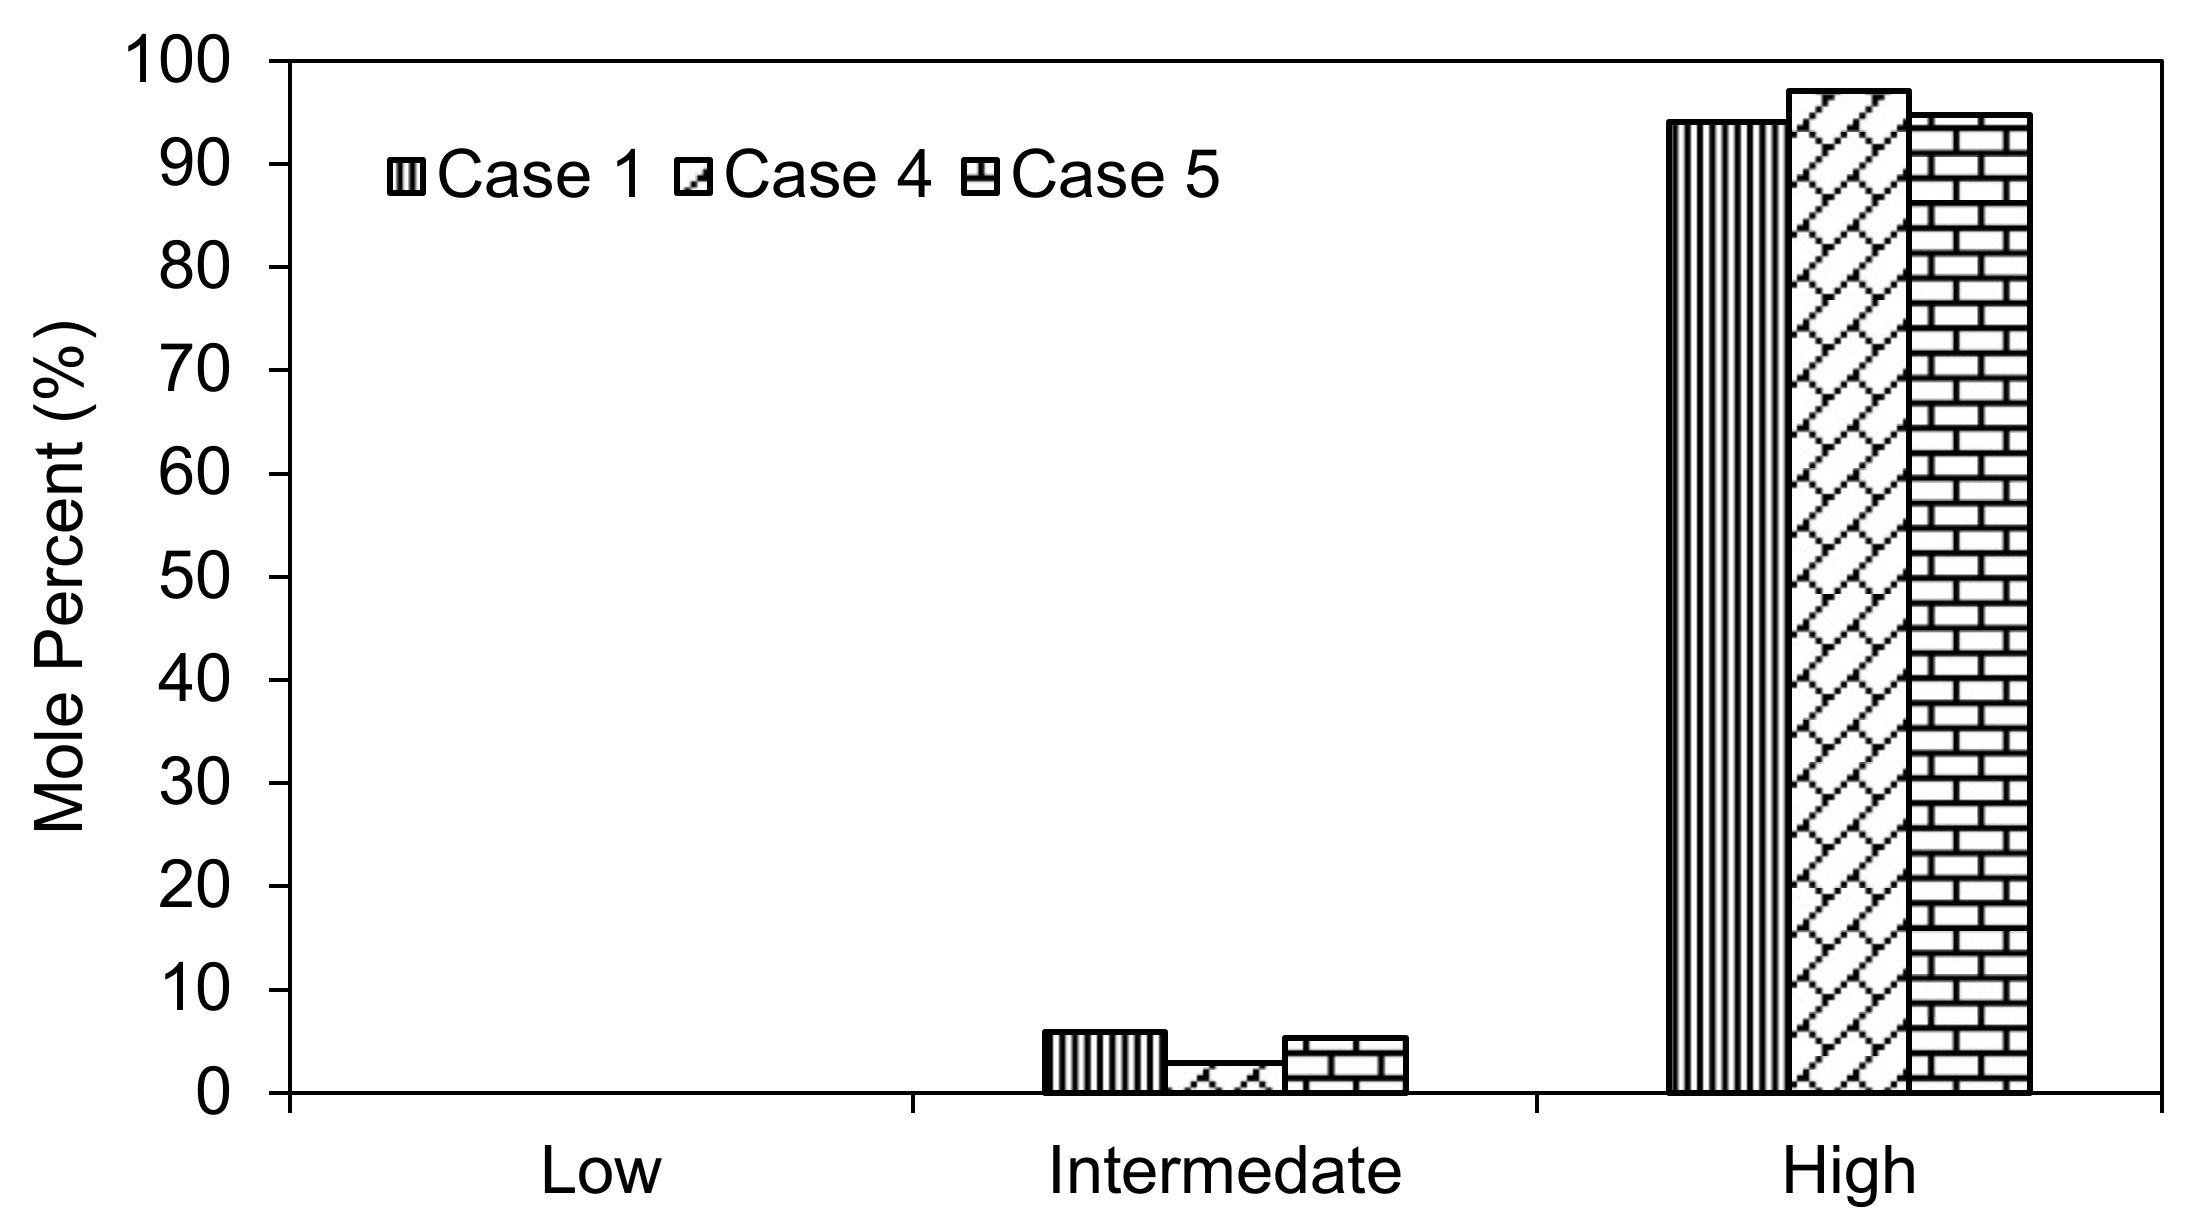
Case 5 (CO2-acetone mixture injection) extracts high carbon number components (C7+), even better than Case 4 (pure CO2 injection at 158 °F), as shown in Figure 7. In contrast, Case 4 extracts intermediate carbon number components better than Case 5. Low carbon number components do not remain because of easy to vaporize. Figure 8 shows that certain molecular structures such as alkenes, branched- and straight-chain alkanes are extracted owing to acetone appearance, even though it is not as effective as pure CO2. Similarly, as previously stated, CO2 contributes to the extraction of all of the molecular structures. The lower value of Case 4 mole percent, for almost all structures than Case 5 in Figure 8, is caused by the effectiveness of pure CO2 for extracting intermediate component instead of high carbon number that is properly extracted by the CO2-acetone mixture. Thus, this lower mole percent value does not mean that acetone prevents extraction of intermediate hydrocarbon.

3.3. Co-Solvent Performance Analysis on Assisting CO2 Extraction

Extraction solvent selection is based on the “like dissolves like” principle, which means that the solvent has good dissolving efficiency when its polarity is similar to that of crude oil. Thus, the polarity of a solvent mixture is significant to the extraction efficiency in crude oil extraction [21]. CO2 is a non-polar solvent providing fast and efficient extraction of non-polar compounds such as alkanes. However, its large quadruple moment leads to an affinity for polar solutes such as polyaromatic hydrocarbons, aldehydes, esters, and alcohols [5]. Therefore, CO2 helps to remove polar intermediate components. These reasons explain the phenomena in Figure 6 and Figure 8, in which aromatic-intermediate components are extracted well by pure CO2 injection. Crude oil is composed of not only non-polar component but also polar component. Co-solvent is selected and expected to assist CO2 to extract polar component in crude oil that is unable to be extracted by CO2, especially for heavy polar component.
Co-solvent is responsible for increasing the CO2 solubility in oil by enhancing the physical interactions such as dipole-dipole, dipole-induced dipole, and induced dipole-induced dipole. The effect of co-solvents on crude oil extraction is due to their participation in interactions with both solutes and solvents. Mechanisms to reach that interaction are by their capability to form hydrogen bonding [19] and their ability to interact with polar components. Table 4 displays the parameters of hydrogen bonding and polarity for ethanol and acetone. The notations of β, α, and π* represent the tendency of solvent to be hydrogen acceptor, hydrogen donor, and polarizability of solvent, respectively [19]. According to the parameters, ethanol is a better hydrogen bond acceptor (HBA) and hydrogen bond donor (HBD) as compared with acetone. Thus, ethanol has a tendency to extract heavy components [18] through HBA, also higher-boiling fractions [5], and associated n-mers [11] influenced by ethanol polarity. Ethanol also slightly extracts aromatic components because they can form a fairly weak hydrogen bond. The strength is reduced as temperature increases due to breakage of the hydrogen bond [22]. For these reasons, ethanol is capable of assisting CO2 to extract intermediate and heavy components, as shown in Figure 5. Acetone has less capability to form hydrogen bond as the value of β and α are lower than those of ethanol. Meanwhile, acetone has high polarizability by which it is able to interact with polar and higher molecular weight hydrocarbons [19]. Thus, acetone is also effective in assisting CO2 to extract polar-aromatic, aromatic [21], and asphaltene [5]. These reasons explain the phenomena in Figure 4b and Figure 8, which show the capability of acetone to extract polar and aromatic-heavy components.
Polarity relates directly to the molecular structures. If the molecular structures are ordered from the strongest, the order is normally aromatic, alkene, cycloalkane, and alkane. However, several phenomena affect this normal order. The appearance of branched-chain hydrocarbons reduces the polarity of crude oil. Straight-chain hydrocarbons have higher polarity due to more surface area for London dispersion interaction [10]. Cyclohexane, the least reactive cycloalkane, also affects polarity because of its property that has stable bond angles of 109.5°. However, both acetone and ethanol effectively extract these non-polar components, except cycloalkane type, as presented in Figure 6 and Figure 8. Benzene, which represents an aromatic component, has a stable ring because of the benzene bond (hybrid bond or one and one-half bond) which also reduces the solute’s polarity. It causes low extraction performed by the CO2-solvent mixture injection cases. Otherwise, polarity increases if there are double or more bonds. These bonds do not satisfy the normal tetrahedron-bonding angles of 109.5°, which indicates that they are less stable and more reactive [20]. However, both solvents just slightly extract alkene component.
According to the results of the previous analyses, it can be stated that acetone assists CO2 to extract heavy components. It is identified initially from the swelling factor and the IFT experimental results. The CO2-acetone mixture injection shows higher swelling factor and results in lower MMP than those by other cases. The analysis of the GC results supports this phenomenon through previous explanation. Ethanol is classified as a self-associated polar compound and acetone as a non-associated polar compound, because acetone is less likely to form hydrogen bonds than ethanol. Acetone has low cohesion forces because of the difficulty forming hydrogen bonds. Therefore, on the one hand, acetone and CO2 have high affinity molecular structures that can mix with each other. This may be another reason why acetone works well assisting CO2 to extract hydrocarbons. On the other hand, the CO2-ethanol mixture cannot completely mix together and tends to work by themselves individually [17], which makes ethanol seems worse and works ineffectively.
Although acetone and ethanol are polar co-solvents and extract polar hydrocarbon components based on the “like dissolves like” principle, they have non-polar end in the alkyl group. Thus, they also slightly interact with non-polar components and this explains why non-polar components are still removed by CO2-solvent injection. From this work, co-solvent obviously assists CO2 extracting crude oil through both their capability to form hydrogen bond with hydrocarbon and CO2 and their parallel behavior as polar component that is also able to extract polar and non-polar components.

4. Conclusions

  • Acetone, from the carbonyl group, is classified as a non-associated polar compound with high polarizability and slight possibility to form hydrogen bonds. It assists CO2 to vaporize polar components such as those of polar-aromatic which are dominant in the high carbon numbers of Sample A1. Alkenes and straight-chain alkanes are also slightly removed by CO2-acetone mixture injection. These phenomena are also supported by the properties of acetone which have low cohesion forces and high affinity to interact with other molecules.
  • Ethanol, from the hydroxyl group, is classified as a self-associated polar compound. It has roles as both a hydrogen bond acceptor (HBA) and a hydrogen bond donor (HBD) and can assist CO2 to extract the higher-boiling fractions of heavy components, branched-chain alkanes, and slightly polar-aromatic in heavy components, although CO2 and ethanol cannot completely mix together.
  • Both acetone and ethanol that have non-polar end in the alkyl group make these co-solvents able to interact with non-polar components and also assist with the CO2 extraction process.

Author Contributions

A.K.P. and A.L.L.H. developed the concept of the research and designed the experimental work; E.A.P. and A.L.L.H. conducted the experiment and acquired all necessary data; A.K.P., E.A.P., and A.K.W. wrote the paper; D.A. did proof-reading and proof-concept. All authors have read and agreed to the published version of the manuscript.

Funding

This research was funded by Lembaga Penelitian dan Pengabdian Masyarakat (LPPM) Institut Teknologi Bandung under grant no. 265.B/I1.C04/KU/2020.

Institutional Review Board Statement

Not applicable.

Informed Consent Statement

Not applicable.

Data Availability Statement

The data presented in this study are available on request from the corresponding author. The data are not publicly available due to privacy.

Acknowledgments

The authors wish to express their appreciation for the Program Penelitian, Pengabdian Kepada Masyarakat, dan Inovasi (P3MI) Institut Teknologi Bandung funding provided by Lembaga Penelitian dan Pengabdian Kepada Masyarakat (LPPM) ITB (265.B/I1.C04/KU/2020) and supporting facilities provided by Bass Oil Limited.

Conflicts of Interest

The authors declare no conflict of interest.

References

  1. Green, D.W.; Willhite, G.P. Enhanced Oil Recovery; SPE Textbook Series; Society of Petroleum Engineers: Richardson, TX, USA, 1998; Volume 6, p. 1. [Google Scholar]
  2. Holm, L.W. Miscibility and miscible displacement. J. Pet. Technol. 1986, 38, 817–818. [Google Scholar] [CrossRef]
  3. Stalkup, F.I. Carbon dioxide miscible flooding: Past, present and outlook for the future. J. Pet. Technol. 1978, 30, 102–106. [Google Scholar] [CrossRef]
  4. Mungan, N. Carbon dioxide flooding-fundamental. J. Can. Pet. Technol. 1981, 20, 87–92. [Google Scholar] [CrossRef]
  5. Rudyk, S.; Spirov, P.; Hussain, S. Effect of co-solvents on SC-CO2 extraction of crude oil by consistency test. J. Supercrit. Fluids 2014, 91, 15–23. [Google Scholar] [CrossRef]
  6. Jӧdecke, M.; Kamps, P.S.; Maurer, G. Experimental investigation of the solubility of CO2 in (acetone + water). J. Chem. Eng. Data 2007, 52, 1003–1009. [Google Scholar] [CrossRef]
  7. Day, C.Y.; Chang, C.J.; Chen, C.Y. Phase equilibrium of CO2 + ethanol and acetone + CO2 at elevated pressures. J. Chem. Eng. Data 1996, 41, 839–843. [Google Scholar] [CrossRef]
  8. Liu, J.; Sun, L.; Li, Z.; Wu, Z. Experimental study on reducing CO2-oil minimum miscibility pressure with hydrocarbon agents. Energies 2019, 12, 1975. [Google Scholar] [CrossRef] [Green Version]
  9. Molecular Polarity. Available online: http://chemistry.elmhurst.edu/vchembook/210polarity.html (accessed on 1 April 2020).
  10. Handout: Effect of Intermolecular Forces on Boiling Point and Solubility. Available online: https://laney.edu/huisunkim/wp-content/uploads/sites/407/2016/01/Intermolecular-Forces.pdf (accessed on 16 April 2020).
  11. Fletcher, A.N.; Heller, C.A. Self-association of alcohols in nonpolar solvents. J. Phys. Chem. 1967, 71, 3742–3756. [Google Scholar] [CrossRef]
  12. Hakim, A.L. Minimum Miscibility Pressure Reduction in CO2 Gas Mixture Injection. Ph.D. Thesis, Institut Teknologi Bandung, Bandung, Indonesia, 13 March 2020. [Google Scholar]
  13. Rezk, M.G.; Foroozesh, J. Phase behavior and fluid interactions of a CO2-light oil system at high pressures and temperatures. Heliyon 2019, 5, e02057. [Google Scholar] [CrossRef] [PubMed] [Green Version]
  14. Abdurrahman, M.; Permadi, A.K.; Bae, W.S. An improved method for estimating minimum miscibility pressure through condensation-extraction process under swelling tests. J. Pet. Sci. Eng. 2015, 131, 165–171. [Google Scholar] [CrossRef]
  15. Rao, D.N. A new technique of vanishing interfacial tension for miscibility determination. Fluid Phase Equilibria 1997, 139, 311–324. [Google Scholar] [CrossRef]
  16. Abedini, A.; Mosavat, N.; Torabi, F. Determination of minimum miscibility pressure of crude oil-CO2 system by oil swelling/extraction test. Energy Technol. 2014, 2, 431–439. [Google Scholar] [CrossRef]
  17. Novriansyah, A.; Bae, W.; Park, C.; Permadi, A.K.; Riswati, S.S. Ketone solvent to reduce the minimum miscibility pressure for CO2 flooding at the south Sumatra basin, Indonesia. Processes 2020, 8, 360. [Google Scholar] [CrossRef] [Green Version]
  18. Rudyk, S.; Hussain, S.; Spirov, P. Supercritical extraction of crude oil by methanol- and ethanol-modified carbon dioxide. J. Supercrit. Fluids 2013, 78, 63–69. [Google Scholar] [CrossRef]
  19. Hussain, S. Enhanced oil recovery using supercritical carbon dioxide with and without co-solvents. Int. J. Pet. Gas Eng. 2014, 2, 1–12. [Google Scholar]
  20. McCain, W.D. Petroleum Fluids, 2nd ed.; Pennwell Books: Tulsa, OK, USA, 1990; pp. 1–42. [Google Scholar]
  21. Li, X.; Du, Y.; Wu, G.; Li, Z.; Li, H.; Sui, H. Solvent extraction for heavy crude oil removal for contaminated soils. Chemosphere 2012, 88, 245–249. [Google Scholar] [CrossRef] [PubMed]
  22. Brinkley, R.L.; Gupta, R.B. Hydrogen Bonding with Aromatic Rings. AIChE J. 2001, 47, 948–953. [Google Scholar] [CrossRef]
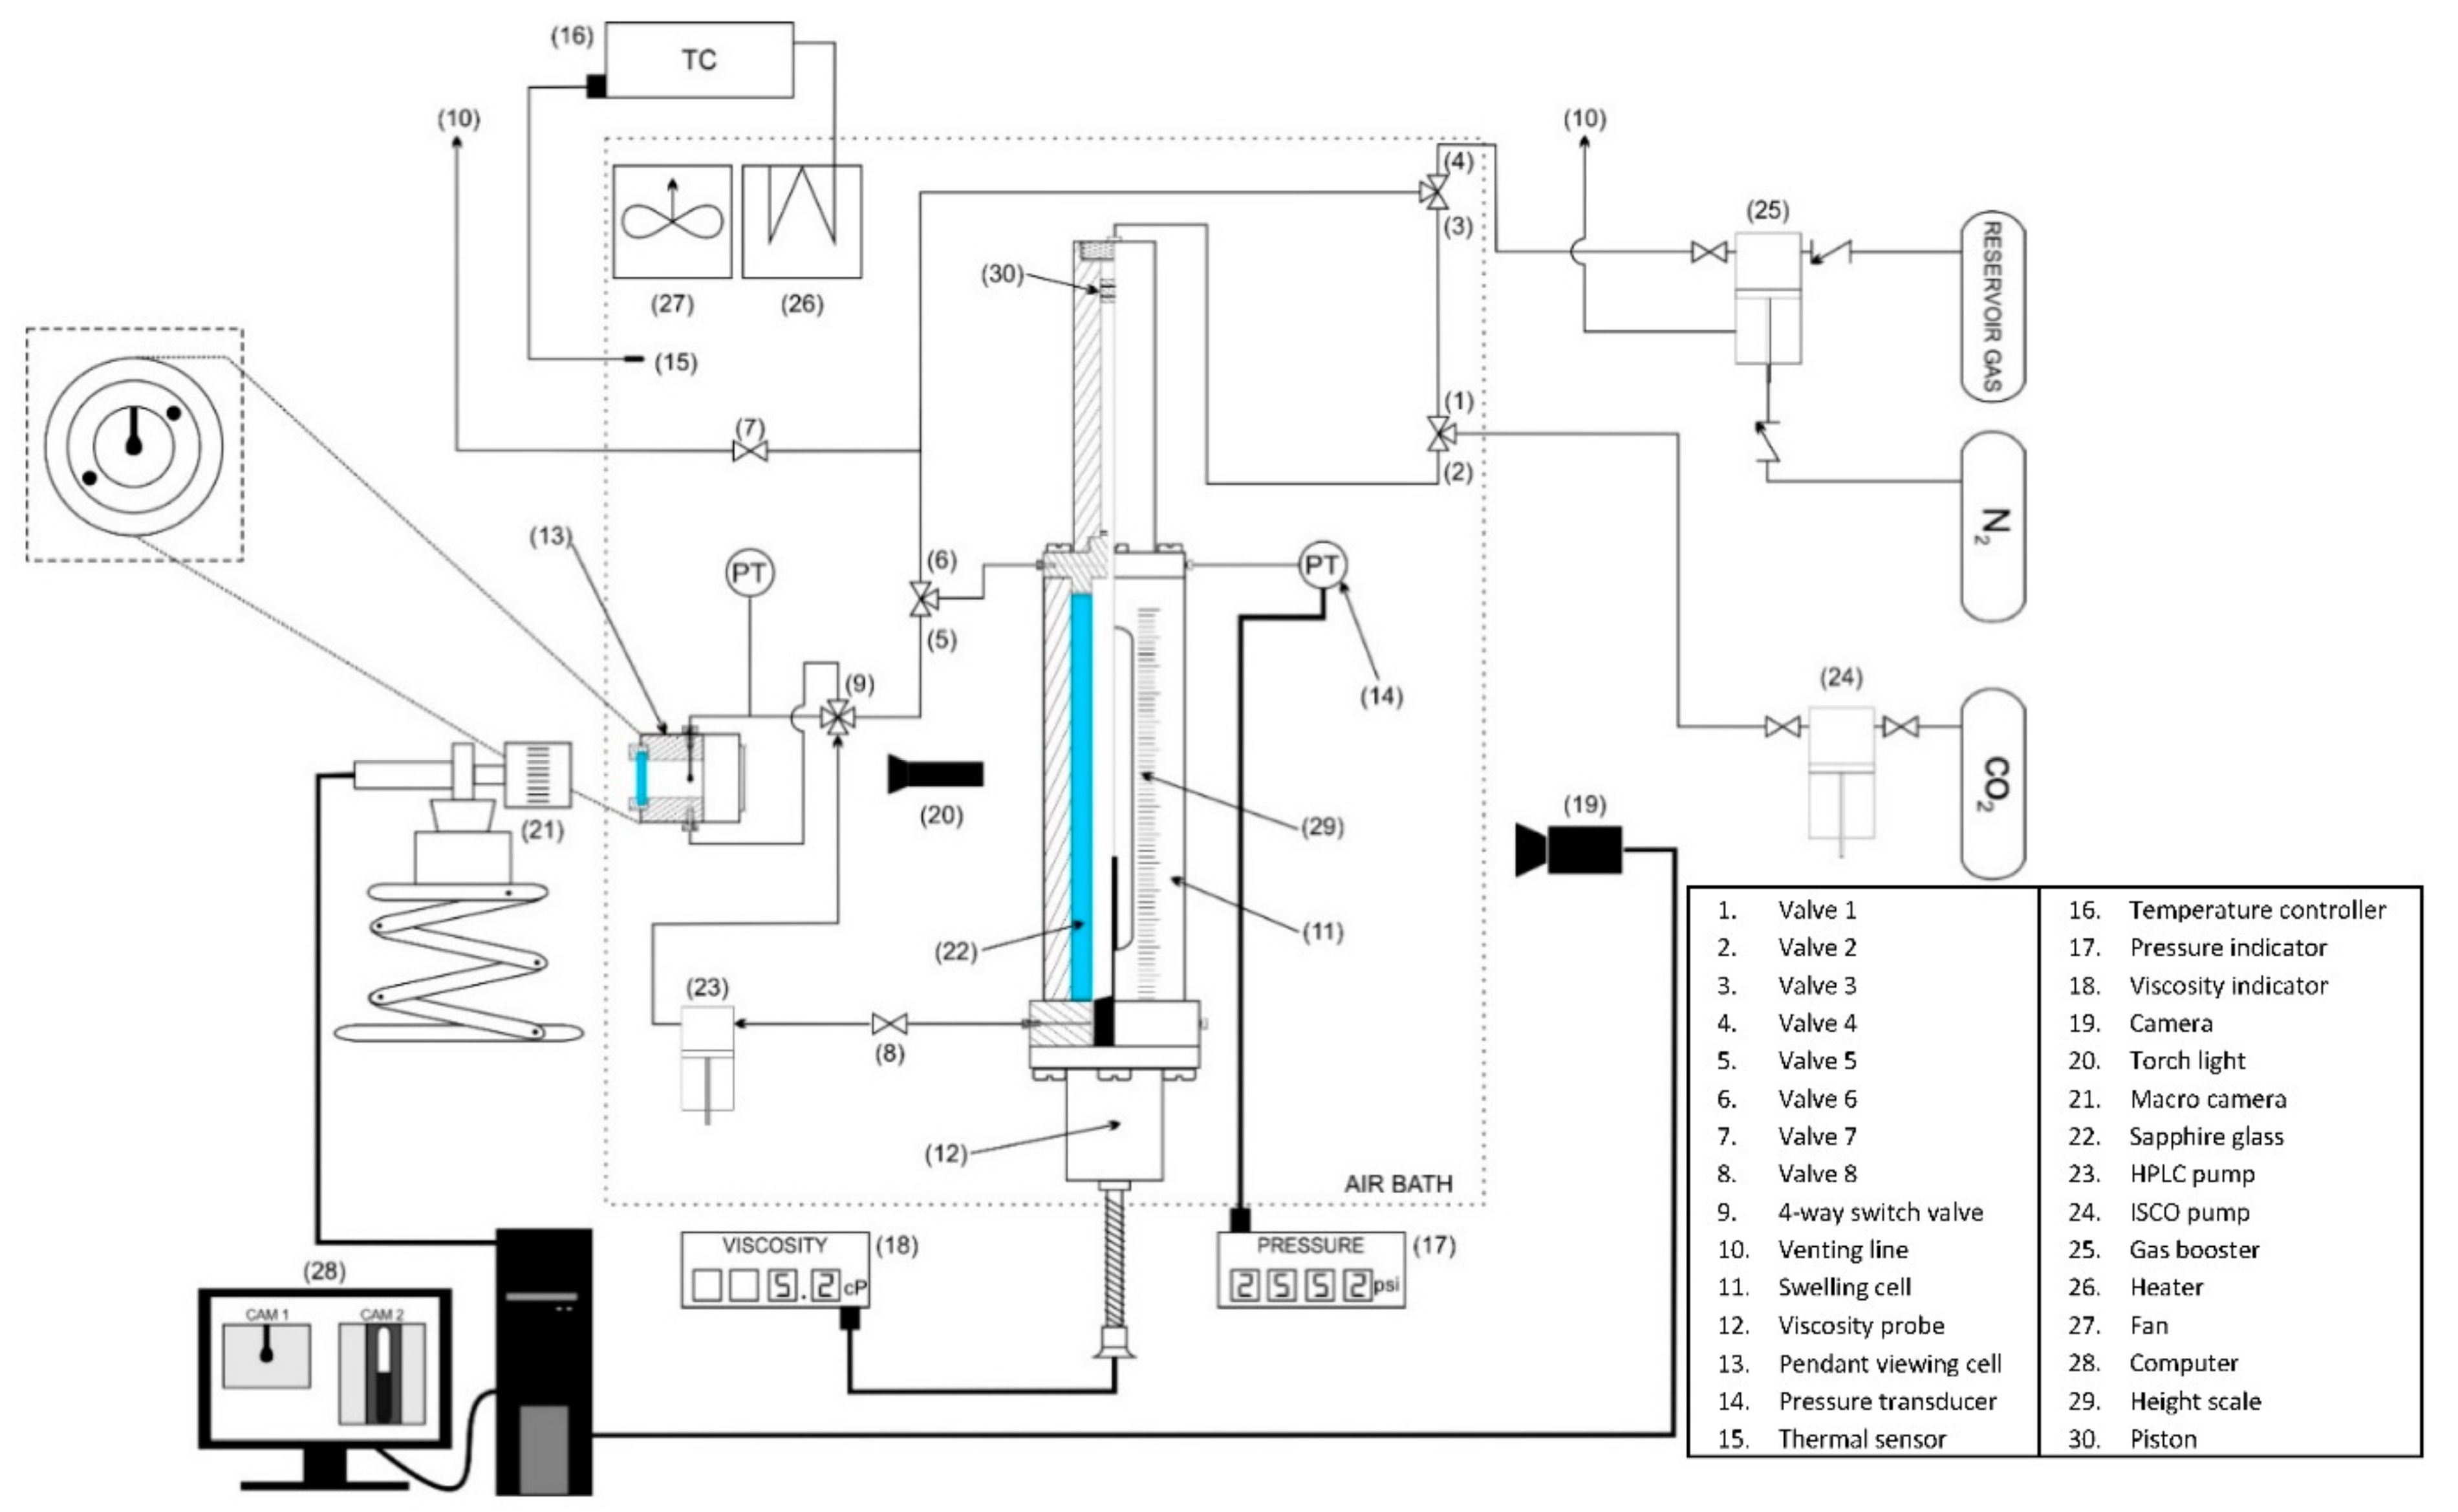
Figure 1. Schematic diagram of the experimental apparatus used for measuring swelling factor, viscosity, and interfacial tension between an oil sample and CO2.
Applsci 11 00159 g001
Figure 2. Swelling test results at (a) 131 °F and (b) 158 °F [12].
Applsci 11 00159 g002
Figure 3. Interfacial tension (IFT) data results at (a) 131 °F and (b) 158 °F [12].
Applsci 11 00159 g003
Figure 4. Gas chromatography (GC) results at (a) 131 °F and (b) 158 °F.
Applsci 11 00159 g004
Figure 5. Remaining oil composition of CO2-ethanol mixture injection based on carbon number classification.
Applsci 11 00159 g005
Figure 6. Remaining oil composition of CO2-ethanol mixture injection based on molecular structure classification.
Applsci 11 00159 g006
Figure 7. Remaining oil composition of CO2-acetone mixture injection based on carbon number classification.
Applsci 11 00159 g007
Figure 8. Remaining oil composition of CO2-acetone mixture injection based on molecular structure classification.
Applsci 11 00159 g008
Table 1. Crude oil sample properties.
PropertiesA1
API gravity42.2
MW C7+135.85
Table 2. Crude oil sample composition at reservoir condition and generalized characteristics.
ComponentMole%
Sample A1
Hydrogen sulfideH2S0
Carbon dioxideCO20.06
NitrogenN20.39
MethaneC113.88
EthaneC21.75
PropaneC34.05
IsobutaneiC41.65
n-ButanenC43.06
IsopentaneiC51.67
n-PentanenC51.57
HexaneC62.7
Heptane plusC7+69.22
Total 100
Parameter Content (%wt)
Asphaltenes-
Aromatic21.14
Table 3. Case studies and their explanations.
CaseExplanation
Case 1Original oil (without CO2 injection)
Case 2Pure CO2 injection at 131 °F
Case 3CO2-ethanol mixture injection at 131 °F
Case 4Pure CO2 injection at 158 °F
Case 5CO2-acetone mixture injection at 158 °F
Table 4. Co-solvent solvatochromic parameters [19].
Co-Solventπ*αβ
Ethanol0.540.830.77
Acetone0.710.060.48
Publisher’s Note: MDPI stays neutral with regard to jurisdictional claims in published maps and institutional affiliations.