Temporal Saliency-Based Suspicious Behavior Pattern Detection


Department of Computer Science, Chungbuk National University, Chungdae-ro 1, Seowon-gu, Cheongju-si, Chungbuk 28644, Korea
Appl. Sci. 2020, 10(3), 1020; https://doi.org/10.3390/app10031020
Submission received: 5 December 2019
/
Revised: 27 January 2020
/
Accepted: 29 January 2020
/
Published: 4 February 2020
(This article belongs to the Special Issue Advances in Image Processing, Analysis and Recognition Technology)
Abstract
:The topic of suspicious behavior detection has been one of the most emergent research themes in computer vision, video analysis, and monitoring. Due to the huge number of CCTV (closed-circuit television) systems, it is not easy for people to manually identify CCTV for suspicious motion monitoring. This paper is concerned with an automatic suspicious behavior detection method using a CCTV video stream. Observers generally focus their attention on behaviors that vary in terms of magnitude or gradient of motion and behave differently in rules of motion with other objects. Based on these facts, the proposed method detected suspicious behavior with a temporal saliency map by combining the moving reactivity features of motion magnitude and gradient extracted by optical flow. It has been tested on various video clips that contain suspicious behavior. The experimental results show that the performance of the proposed method is good at detecting the six designated types of suspicious behavior examined: sudden running, colliding, falling, jumping, fighting, and slipping. The proposed method achieved an average accuracy of 93.89%, a precision of 96.21% and a recall of 94.90%.
1. Introduction
The vast majority of animals, including humans, get the most information from vision among various sensory organs and with this vision, they recognize and judge the situation [1]. As such, visual information is important to judge not only general circumstances but also special situations [2,3]. Although the technology of image processing and the performance of the computer have dramatically improved, analyzing and judging the situation comprehensively as a human does is still difficult [3]. Today, as various technologies using image processing continue being developed, the scope of intelligent image security technology in the video security market is rapidly expanding; the market share is rapidly expanding from hardware to software, such as intelligent image analysis [4]. The technology used for image security requires suspicious behavior detection technology to prevent public security issues, incidents, and accidents. Attempting to enter a personal property, entering a subway station without paying a ticket, kidnapping a child, beating a person, or an act of sudden collapse of a person who is walking along the road may be examples.
This kind of image analysis technology can cope with security threats to individuals and society at large from terrorism, crime, and disasters. In the wake of recent terrorist accidents in many countries, each country has been actively investing in expanding the video security market and securing security systems for the safety of people all over the world [5,6]. In recent years, the number of CCTV installations in the public sector, such as transportation and crime prevention CCTV, has increased to cope with various accidents, such as safety accidents and violent accidents [7]. While the number of areas being surveilled has increased due to the spread of CCTV, the extent of smart technology application remains insufficient. CCTV is already installed in many areas and records automatically, but the reading and checking of the video still must be done manually by a person. Human evaluation of CCTV is not ideal, because it is a task that requires high levels of concentration over long periods. Therefore, an automated monitoring system should be implemented that can automatically recognize crime such as robbery and violence, as well as other situations that require urgent responses, and then notify the proper parties. To date, in the field of intelligent CCTV research [4,5,6,7], relatively few studies on behavior recognition or suspicious behavior detection have been carried out in comparison to the number of studies on the active classification and segmentation of objects. In most cases, CCTV is used for security reasons. In particular, when constructing a public place such as an airport, a train station, or a park, ensuring the safety and security of the people using that place is mandatory. If CCTV can automatically detect people who are acting abnormally rather than simply recording them, it will greatly aid accident prevention and response.
There are various patterns of suspicious behavior that we want to detect through CCTV, but the common factor is that the size of the movement is large and the direction is irregular [8,9,10]. For example, while violence is being committed, the speed of movement generally increases sharply, and the direction of movement becomes very irregular. When a person bumps something or falls on something, the movement at this moment has a different direction of movement than that of a normal moving person, and the magnitude of motion at that moment becomes irregularly large. Beyond these cases, running or jumping behaviors that occur indoors, such as in a classroom, can be considered to be suspicious behaviors, and they have characteristics similar to those described above.
Suspicious behavior detection is one of the most actively studied areas of computer vision, such as video analysis and surveillance [8,9,10,11,12,13,14,15,16,17,18,19,20,21,22,23,24,25,26,27]. Ordinary behavior refers to actions that do not attract people’s attention when people perceive some sort of movement [8]. Therefore, surveillance systems detect suspicious behavior using characteristic patterns for various behaviors, which are generally opposed to ordinary behaviors. There have been many studies on abnormal behavior detection using different approaches such as spatio–temporal features [8,9,10,11,12,13,14,15,16] and machine learning techniques [17,18,19,20,21,22,23,24,25].
As a high-dimensional feature is essential to better represent the suspicious behavior pattern, many methods based on spatio–temporal information such as optical flow [8], spatio–temporal gradient [9], the social force model [10], chaotic invariant [11], and sparse representation [12] have been studied. It does not require any training learning process, so it has less computation, which can be used in real-time detection [8]. The method described in [9] extracts moving objects from video sequence first and then tracks moving objects to detect their overlapping. Once an overlapping area is detected, the clutter model is built up based on the changes of spatio–temporal features to detect abnormal behavior. An abnormal pattern detecting method based on spatiotemporal volume has been presented in [13]. It calculated the likelihood by analyzing the area occupying a relatively large part of the periphery and transformed it into the form of a codebook, thereby reducing the time required for the calculation. This method is competitive with other methods because it does not require background/foreground segmentation and tracking calculations. However, it is difficult to use this method in an image in which various kinds of abnormal conditions may exist, because the threshold value necessary for detecting abnormal patterns has to be individually calculated and applied experimentally for each image. The method described in [14] detects abnormal crowd behavior based on a combined approach of energy model and threshold. It used the optical flow method to estimate displacement vectors of moving crowd and the computation of crowd motion energy. The crowd motion energy was further modified by crowd motion intensity. The method described in [15] also extracts the motion vector using the optical flow from the segmented image with foreground and background; then, the motion vector with a large change was detected and learned by principal component analysis (PCA). However, data loss can occur due to noise in the process of separating the foreground and background from actual images. Abnormal behavior detection using an interest point by simply monitoring the change of topological structure has been presented in [16]. Two new methods for the analysis of boundary point structure and the extraction of a critical point from the partial motion fields were introduced and both methods were used to build the global topological structure of the crowd motion.
Machine learning techniques for detecting unusual events have been presented in [17,18,19,20,21,22,23,24,25,26]. These methods also employ the feature extraction process but use trained data that came out of the learning process. The method described in [17] detects multiple anomalous activities with key features such as speed, direction, centroid, and dimensions, and these help to track an object in video frames. It also employed problem domain knowledge rules in order to distinguish activities and the dominant behavior of activities. In [18], a video frame is divided into several segments of equal size, and the features that were extracted from each segment were clustered using unsupervised learning. Then, the clusters smaller than this were classified as abnormal behavior. In this method, unusual phenomena that do not follow the general statistics are judged as abnormal behavior. However, when there is only abnormal behavior, not ordinary behavior, it is highly unlikely that abnormal behavior can be detected. In order to solve the above-mentioned problems appearing in the method presented in [18,19], Hamid et al. analyzed the whole structure information using statistical information of behavior class and then defined and detected abnormal behavior based on the subclass. However, there was a scalability problem in applying it to various images because of the discontinuous sequence and the fact that the spatiotemporal patch must be stored in the same form every moment. In addition, since data is processed in a batch process, it cannot cope with real-time environmental change. A method that uses violent flows (ViF) feature points for real-time processing has been presented in [20]. After extracting motion vector, motion vectors whose magnitude value exceeds the threshold value are studied and learned by support vector machine (SVM) [8]. However, this method is not applicable to surveillance cameras used in real life because it deals only with images taken from a distance. Convolutional neural network (CNN)-based algorithms have been presented in [21]. Using fully convolutional neural networks (FCNs) and temporal data, a pre-trained supervised FCN is transferred into an unsupervised FCN ensuring the detection of anomalies in scenes. The method described in [22] considered successive chunks that could be observed in segments made from a database that contained no suspicious behavior to be ordinary behavior. Then, by using these successive chunks for learning, the parts for which the magnitude of the feature is small or those who are not included in the learning are detected as suspicious behavior. However, these methods that use the learning process show weakness in versatility because they cannot detect behaviors that are not used in learning. In [23], a unified framework for anomaly detection in video based on the restricted Boltzmann machine (RBM), a recent powerful method for unsupervised learning and representation learning, has been introduced. Unsupervised learning techniques also employed in the method described in [24], and the Bayesian model is employed in the method described in [25]. More significant related work to abnormal behavior detection is described in the review paper [27].
Such methods of manually applying a threshold value or using a background removal with or without data loss are not versatile. In addition, methods using the learning process are dependent on the training data and also require lots of computation, so it is hard to be used as a real-time surveillance system. In this paper, a new suspicious behavior detection method that can be used in real life by supplementing these matters is presented. The proposed method can infer suspicious behavior patterns by solely using simple motion features for real-time anomaly detection. Generally, as humans, we focus our attention on behaviors that vary in the magnitude or direction of motion and behave differently in terms of the rules of motion compared to other objects. In this paper, this information was used in the proposed method. The developed system with the proposed method attempts to detect significantly different behaviors among other behaviors in order to search for suspicious behaviors. To this end, motion features are extracted using optical flow, and these features are then integrated to create temporal saliency. Finally, abnormal behavior can be detected based on temporal saliency.
This paper is organized as follows. In Section 2, the proposed method is presented. A temporal saliency is made by extracting and combining motion features using optical flow and detects suspicious behavior based on this. Test datasets used in the proposed method are also described here. In Section 3, experimental results and discussions were described so as to evaluate the performance of the method. Finally, in Section 4, conclusions were drawn with some general observations and recommendations for ongoing work.
2. Materials and Methods
2.1. Data Aquisition
Various kinds of suspicious behavior video sequences are used as a dataset in the proposed method. The UMN (University of Minnesota) crowd dataset and Avenue dataset, which are used in various behavior recognition and detection papers [8,10,11,12,25,28,29] were collected. The video sequences in the UMN dataset were each filmed from three different backgrounds—lawn, indoor, and plaza—featuring scenes where multiple people ran away simultaneously when they heard explosions. The video sequences in the Avenue dataset were filmed from in front of a building, and in that video, a few people are running or jumping, while most people are walking. The Walk dataset, which does not include any suspicious behavior, was also used. The Walk dataset does not contain any suspicious behaviors and features videos that were just filmed of people walking along the street without any special features. This video sequence was selected to check for false detection of the proposed method. As shown in No. 6 to No. 10 in Table 1, various types of YouTube video sequences on the Internet that contain various kinds of suspicious behaviors that could lead to a real accident were also collected.
Table 1 describes what kind of suspicious behavior has been collected as datasets. Actual suspicious behaviors such as violence, tumbling, falling, jumping, and suddenly running behaviors that can be detected in CCTVs installed on the street have been designated as ground truth. All of these behaviors are characterized by large changes in motion or irregular directions of motion.
2.2. Description of Proposed Method
The proposed method has been developed to detect suspicious behavior in real-time using CCTV. This system is designed to detect instantaneous big changes in the size and direction of motion, such as collisions, sudden running, falling, and assault, which can all occur frequently in real life.
Figure 1 shows the overall process of the proposed method. After performing preprocessing such as grayscale image transformation and median filtering, the two kinds of motion vectors, magnitude (size of motion) and gradient (direction of motion), are extracted by optical flow calculation. Then, the two kinds of extracted motion vectors are converted into the polar coordinate system, and the magnitude feature map for the magnitude of the motion vector (Fmag) and the gradient feature map for the gradient of the motion vector (Fgrad) are generated. Then, two reactivity maps (Rmag, Rgrad) are generated using the mean and variance of each feature map and combined into one temporal saliency map (TS). The temporal saliency map shows the area finally detected as suspicious behavior. This described in detail below.
2.2.1. Preprocessing for Denoising
Various preprocessing methods have been used to enhance the performance or efficiency of the experiment in most technical research and process fields as well as image processing fields. In our system, the input image data is converted into a grayscale image, and a median filter is applied to remove noise.
Since only motion information is needed from the input image, color information is not required. Therefore, the input color image is converted into a grayscale image to reduce the dimension of the data. Then, the transformed grayscale image is filtered by a median filter to remove noise. Median filters are often used to remove signal noise. Unlike other smoothing filters, it also preserves the boundary values well in the noise removal process. In the case of the CCTV image, there is much noise due to sunlight or other illumination. Besides, there are many cases where the image quality is low, so it is necessary to enhance the edge. Using the median filter, we can remove noise and enhance the edge.
2.2.2. Feature Map Generation
(1) Motion Vector Extraction with Optical Flow
Optical flow is used to extract the motion of a moving object. Optical flow is an object movement pattern between two consecutive frames caused by the movement of an object or a camera [30]. So, with optical flow, we can obtain important information about how objects are viewed locally and how they move. In other words, optical flow can be said to be a distribution indicating how the brightness pattern has moved. Therefore, optical flow is a good method for detecting the motion of objects moving locally in the continuous frame image [31,32,33].
Farnebäck [34] proposed a dense optical flow. Unlike sparse optical flow [27], dense optical flow can get a more accurate motion vector because it calculates from all pixels of the image. Since sparse optical flow only calculates some pixels of the image locally, only the partial motion feature of the object is extracted. Therefore, it is less accurate than dense optical flow. For example, suppose that two people are walking. In general, when people walk, they move their arms, legs, head, etc. If their motion information is only calculated from some pixels, it can be misunderstood that one person is moving but the other is moving. In other words, the motion information is not continuous because they are extracted from some pixels, and can be misunderstood as movements from different objects. To get more accurate behavior pattern information, dense optical flow is used in the proposed method.
Figure 2 shows a visualization of the optical flow calculation results. Figure 2 is a scene in which people are walking in different directions. The magnitude and the gradient of the object’s motion can be acquired through the optical flow calculation results [30]. Points on the image represent feature points, and lines represent motion vectors. The magnitude of the motion vector is the length of the line, and the gradient of the vector in the direction of the line. In this way, the size and direction of the vector of the object moving through the optical flow can be calculated.
(2) Feature Map Generation: Fmag, Fgrad
Since the information extracted by the optical flow in the preprocessed image is expressed by the magnitude of the movement in the x and y-axes, the extracted information is converted into two feature maps: magnitude and gradient feature maps. The magnitude and the gradient of the motion vector can be calculated through the motion vector obtained using the actual optical flow. The motion vector calculated by the optical flow must be converted into a polar coordinate system to form two feature maps. The polar coordinate system is a coordinate system in which the position of a point is defined as a distance (r) and a direction (θ) from a vertex. In the Cartesian coordinate system, the relationship of the vertices, which are represented in a complicated manner by trigonometric functions, can be easily expressed in the polar coordinate system.
The two-dimensional vector (x, y) calculated as an optical flow is transformed into a value in the polar coordinate system as follows.
where Fmag is a feature map of the magnitude of the motion vector converted to the polar coordinate system, and Fgrad is a feature map of the direction of the motion vector.
Figure 3 shows the visualization image of Fmag (Figure 3b) and Fgrad (Figure 3c) for the input video (Figure 2). Figure 3b is a visualization image of the magnitude feature of the motion of moving people, and Figure 3c is a visualization image of the numerical value of the directional feature using the HSV (Hue-Saturation-Value) color model. Since the direction ranges from 0° to 360°, the size of the H channel of the HSV color model was used to express the angle in the form of a color. In Figure 3c, people walking from the front of the building to the right were represented in red, while people moving to the left were represented in blue.
2.2.3. Reactivity Map Generation
(1) The distinction between ordinary and suspicious behavior
The statistical value of the magnitude of the motion vector is used to distinguish ordinary motion from suspicious motion in the feature map represented by the polar coordinate system. The statistical value in the region where suspicious behavior occurs is different from the statistical value in the region where ordinary behavior occurs. To determine the statistical value, experiments were performed. Four video sequences were selected among No. 4, No. 5, No. 7, and No. 9 data, which were mentioned in Section 2.1 and were edited to include actual suspicious behaviors such as falling, jumping, violence, and suddenly running behaviors in the 40th frame of each video. Selected video sequences all contain suspicious behaviors. However, for testing purposes, these suspicious behaviors have been edited to appear in the 40th frame. Edited videos are 15 s long, and there are about 15 people in the first video, eight people in the second video, three people in the third video, and about 13 people in the fourth video. After that, motion vectors were calculated, and the results were analyzed.
Figure 4 shows the graphs that show the statistical values of motion vectors of the four kinds of videos after editing the image frame to contain suspicious behavior in the 40th frame. A legend ‘value’ shown in Figure 4a means the minimum, maximum, and average value of the motion vector, and Figure 4b means the standard deviation value of the motion vector. After the motion vector was extracted from these edited videos, the statistical information of the motion vector was analyzed. As we can see in Figure 4a, the motion vector value was maximized near 40 frames of each video. This was because each video contained suspicious behavior (crashes, drowsiness, falls, etc.) near the 40th frame. Since the sizes of objects showing suspicious behavior are slightly different for each dataset image, there could be a slight difference in the average value. Figure 4b also shows that there is a large increase in the standard deviation near 40 frames. As a result of extracting and experimenting motion vectors for several videos, the average value is different according to the size of the moving region included in the video, while the value of the standard deviation changes a lot when suspicious behavior appears. Through these experiments, the standard deviation is selected as the criterion value for judging the abnormal behavior, and value 1.2 was selected.
(2) Magnitude Reactivity Map Generation: Rmag
The frame was considered that it contains suspicious behavior when a frame with a standard deviation of the motion vector at the time (t) is greater than 1.2, which was calculated experimentally. The region where the magnitude of the vector is calculated by optical flow at the point (x, y) is larger than the summation of the average, and the variance of the whole image was considered to be the suspicious behavior region. Since the movement is slightly different for each person even when performing the same ordinary behavior, the region was detected based on the summation of the average and the variation. Based on these facts, the magnitude reactivity map (Rmag) is calculated as follows.
Figure 5 shows the magnitude reactivity map generated by the proposed method. Figure 5a shows the video of people gathered at the center of the park moving in various directions simultaneously with any signal. In this video, the suspicious behavior is the sudden movement of people. Figure 5b shows the magnitude feature map in polar coordinates, and with this feature map, we can see the moving area of people. Figure 5c shows the generated final magnitude reactivity map. We can see that the area in which people are running away has been properly detected. Figure 5d shows the detection of anomalous regions based on the magnitude reactivity map. In the scene where several people are running away, we can see that the motion vector is greatly increased, and all of the suspicious behavior is detected.
(3) Gradient Reactivity Map Generation: Rgrad
Unlike a group of people who are regularly moving in the same direction, if there is an object moving in the opposite direction, this can be considered suspicious behavior. To detect this behavior, a reactivity map for the gradient feature of the motion vector was generated. First, the motion vector calculated for each pixel is divided into object units to prevent the movement direction of the object and the part included in the object from being different directions. For example, when a man moves to the left with his arms and legs shaking up and down, the main movement direction may be misjudged because of the movement direction of the arms and legs, although the main direction of the man’s movement is left direction. Based on these, the gradient reactivity map (Rgrad) is calculated as follows.
The region of the object that moves differently from the average direction of movement becomes a component of the gradient reactivity map.
Figure 6 shows the gradient reactivity map generated by the proposed method. Figure 6a shows the original video of the people walking around the park, and Figure 6b shows the gradient feature map of the motion vector. The circle in the middle represents the average of the angles in the entire image and is displayed on the screen to show the angle of 181°. The rectangle drawn on the right is the area detected by applying Equation (3). Figure 6c is the final generated gradient reactivity map. In the reactivity map, we can see that when the average direction of the people is to the left, weights are added to the object moving in the opposite direction, and the system has responded to it very strongly.
The two reactivity maps described above are incorporated into the temporal saliency map through weighted combinations. Among the feature values constituting the temporal saliency map, a region having a high value is a region that includes noticeable suspicious behavior. Therefore, the presence or absence of suspicious behavior can be determined through the temporal saliency map. The two reactivity maps are combined as follows.
The weight value α is applied proportionally to the maximum value of the magnitude. In general, the anomalous behaviors to detect are always increased in the magnitude of the motion, but the moving direction is partially applied, so the weight value is calculated proportionally to the magnitude value. In the final generated temporal saliency map, neighboring pixels are clustered, and the area of 30 pixels or more is displayed as the final detection area.
Figure 7 shows the final detected suspicious behavior region using the temporal saliency map. Figure 7a shows the experimental result on a video in which a man is walking to the right and a child is jumping to the left. Figure 7c,d show the reactivity map for the magnitude and gradient of the motion vector, respectively, and Figure 7e shows the temporal saliency map finally generated through weighted combination. At the moment the child jumps, the motion increases greatly, and the reactivity to the magnitude of the motion increases significantly. Additionally, the reactivity to the direction also increased because everyone else moves to the right while the child jumps to the left. Figure 7b shows the final result of the proposed method. Two reactivity maps were combined and finally, a temporal saliency map was generated to detect the suspicious behavior regions.
3. Results and Discussion
In order to verify that the proposed method detects suspicious behavior region correctly, the experiments were conducted on 10 different types of video sequences mentioned in Section 2.1. In addition, to carry out a quantitative evaluation, the proposed method was compared with the state-of-art methods with the experiments, which were conducted on two different publicly available datasets, namely UMN and Avenue. Although some of the compared methods perform evaluations on videos that are gathered from the Internet, these videos are not available online for comparison. Therefore, comparison evaluations were conducted on the UMN and Avenue datasets, which are publicly available.
3.1. Comparison Results from Experiments with UMN Dataset and Avenue Dataset
For the UMN dataset, the method based on optical flow-based features [8], Bayesian model [25], chaotic invariants [11], the social force model [10], and sparse reconstruction cost [12] were compared with the proposed method. The UMN dataset contains three crowd escaping scenes in both indoor and outdoor environments. The normal events depict people wandering in groups, while abnormal events depict a crowd escaping quickly. The dataset contains 11 video sequences that are captured in three different backgrounds. Scene 1 and Scene 3 are outdoor scenes (lawn, plaza) and Scene 2 is an indoor scene. The accuracy was defined to be the percentage of correctly identified frames that are calculated by comparing with ground truth.
Table 2 demonstrates the accuracy comparison of six methods for three different scenes of the UMN dataset in identifying escape events.
The methods in [8,25] were previously tested on the whole UMN dataset, and the provided results were used to compute the corresponding accuracy. As an evaluation setting, the same evaluation settings as described in [25] were used. Overall, the proposed method achieves the best accuracy with an average of 96.50%, which is higher than that of the other methods. Even though the proposed method did not employ any learning process, the proposed method outperforms the comparison methods. Such methods using the learning process are dependent on the training dataset and also require lots of computation, so it is hard to be used as a real-time surveillance system. The proposed method can be used in real life by supplementing these matters.
Figure 8, Figure 9 and Figure 10 demonstrate the examples of detection results for abnormality from the UMN dataset (No. 1 to No. 3) in the proposed method. In these videos, the suspicious behavior is the sudden movement of people. When people run away in multiple directions at the same time, the direction of movement appears very irregular and the size of the movement is also dramatically increased. The proposed method responded appropriately to this kind of motion. The area in which people are running away has been properly detected. In the scene where several people are running away, we can see that the motion vector is greatly increased, and all of the suspicious behavior is detected. The proposed method generated reactivity images using feature information extracted from optical flow in the video and detected anomalous regions based on temporal saliency obtained through a weighted combination of them. Feature information using the magnitude and gradient of movement, which is the most important factor that constitutes a behavior, is extracted, and a strongly reactive region is detected through a weighting condition formula. The result demonstrates that the suspicious behavior was reasonably detected.
For the Avenue dataset, the methods described in [21,26,29] were compared with the proposed method. The Avenue dataset contatins 16 training videos and 21 testing videos. The only normal behavior in the dataset is people walking in front of the camera, and the abnormal behaviors are unusual actions such as running and jumping, and walking in the wrong direction. Table 3 demonstrates the AUC (area under the curve) values of both the proposed method and the state-of-the-art comparison methods [21,26,29] for the Avenue dataset. The method in [26] was previously tested on the whole Avenue dataset, and the provided results were used in the comparison. The comparison results of Table 4 shows that the performance of the proposed method outperforms the comparison methods.
Due to the unpredictability of abnormal events, most previous approaches employ a learning process, and most of them only learn normal event models in an unsupervised or semi-supervised manner, and abnormal events are considered to be patterns that significantly deviate from the created normal event models [29]. The method used in [21] uses spatio–temporal convolutional neural networks to extract and learn various features, and the method in [29] employs the online dictionary learning and sparse reconstruction framework. The method in [26] used both training data and testing data to make a global grid motion template (GGMT). As mentioned before, even though the proposed method did not employ any learning process and uses simple motion features, the proposed method outperforms the comparison methods.
Figure 11 demonstrates the examples of detection results for abnormality from No. 4, which were chosen from the Avenue dataset in the proposed method. In this video sequence, most people in front of the building are walking to the right, while a child jumps to the left. The proposed method properly detected the area where the child jumps. We can see that the percentage of the child occupying the image has increased, because the distance between the child and the camera is much closer than that of the other people. Due to this, the average direction was calculated as the left direction, from the moment the child jumps. Since the child is moving to the left during the jump, the whole direction was calculated correctly. It is seen that different types of abnormality such as running and jumping can be accurately detected and localized.
3.2. Analysis of Examples of Detection Results for Abnormalities with 10 Different Types of Video Sequences
Figure 8, Figure 9, Figure 10, Figure 11, Figure 12, Figure 13, Figure 14, Figure 15, Figure 16 and Figure 17 shows the examples of detection results for abnormalities from 10 different types of video sequences. The results for the No. 1 to No. 4 data are shown in Figure 8, Figure 9, Figure 10 and Figure 11 and are explained in detail in Section 3.1.
Figure 12 shows the examples of detection results for abnormality from the No. 5 data. As mentioned before, this video sequence is a video recording of people in which there are no anomalous behaviors and all people are moving normally. This experiment is performed to see if the proposed method responds to ordinary behavior. As a result, it was found it did not react at all to the usual walking behavior (reaction rate 0%).
Figure 13 shows the examples of detection results for abnormality from No. 6 data in which a man is walking while looking at his cell phone and after a while, he falls over an obstacle. This video includes every scene from his usual walking to the falling down. Through the result, we can see that the system does not react at all to the ordinary walking, but it reacts strongly from the moment when the man falls over the obstacle.
The video shown in Figure 14 is similar to the video shown in Figure 13. As two men walk together, the man on the left falls on an obstacle. As a result of the experiment, we can see that the area of the man on the left is correctly detected from the moment he falls. The man on the right was similar in size to the fallen man but was not detected.
Figure 15 shows the examples of detection results for abnormality from the No. 8 data, in which a man is falling into the water. The man falling into the water was correctly detected, but another man’s foot moving on the left side was erroneously detected. This is because as the distance from the camera is close to the scene, the magnitude of the motion vector is greatly affected.
Figure 16 shows the examples of detection results for abnormality from the No. 9 data, in which a man is falling down a stairway. Similarly, as the response to the magnitude and direction of the action grows, the behavior that a man is falling is detected.
Figure 17 shows the examples of detection results from the No. 10 data. This is a violent robbery video that happened in South Kensington, which was reported in US news. This video sequence contains a scene in which two men assault one man. Even though the fact that the video is very low in intensity and contains lots of noise due to illumination, the proposed system both detects the scene where one man is running as well as the scene where two men joined together and committed violence on another man.
3.3. Overall Performance Evaluation Results of 10 Different Types of Video Sequences
The actual results of the proposed method are compared with those of the actual suspicious behavior region, which is regarded as a ground truth. Frames that successfully detected a region containing suspicious behaviors are used as a component of a true positive (tp), and frames that detected a suspicious behavior region even if there were not any suspicious behaviors in the frame were used as a component of a false positive (fp). Frames that did not detect any regions, even if there were suspicious behavior in the frame, were used as a component of false negative (fn). The proposed method achieved a 100% true negative (tn) rate, because nothing was detected as a suspicious behavior region in experiments with No. 5 data where no suspicious behavior is included. The accuracy, precision, recall, and FNR (False Negative Rate) is calculated as follows.
Table 4 summarizes the overall performance evaluation result of the proposed method.
The reason for the low performance of the No. 9 data was analyzed as follows. In the No. 9 data, all the motion vectors were not detected and only a part of them was detected because the position of the walking man is too close to the photographing camera. It was a difficult environment to measure the motion vector properly. For this reason, false positives have been increased, resulting in lower performance compared with that of the other data.
As a summary, the proposed system detects various suspicious behaviors captured in various environments with high performance, and it is also robust to differences in brightness depending on the weather and time. However, given the results of the No. 9 data, it is necessary to secure a suitable shooting distance to accurately run the proposed method.
4. Conclusions
In this paper, a new surveillance system for detecting suspicious behavior regions that can be used in real-time was proposed. The proposed method generated reactivity images using feature information extracted from optical flow in CCTV video and detected anomalous regions based on temporal saliency obtained through a weighted combination of them. Feature information using the magnitude and gradient of movement, which is the most important factor that constitutes a behavior, is extracted, and a strongly reactive region is detected through a weighting condition formula.
Extensive experiments on different challenging public datasets as well as on eight various types of video sequences collected online were conducted to demonstrate the effectiveness of the proposed method. Quantitative and qualitative analyses of the experimental results showed that the proposed method outperformed the traditional method in suspicious behavior detection and was comparable to the state-of-the-art methods without using complicated training approaches. In addition, experimental results showed that the proposed system is suitable for detecting suspicious behaviors such as violent actions, fallings, jumping, sudden running, and bumps. The proposed method can detect instantaneous events and accidents.
In the proposed method, two reactivity maps of motion magnitude and motion gradient were generated, and these two maps were weighted and combined to make a temporal saliency map. However, to detect more complex behaviors, it is not enough to combine just the two features used in the proposed method. It is necessary to grasp the relation of existing objects in the video and to grasp the situation before and after based on the time when the event occurred. However, an essential motion pattern is indispensable for detecting such a complicated behavioral relationship. The proposed method is structurally easy to combine with other features. Just adding a new algorithm that extracts other features to the proposed method is not difficult, and with this extension, it can be used not only in the field of detecting more various abnormal behavior but also in various other fields.
Funding
This research received no external funding.
Conflicts of Interest
The author declares no conflict of interest.
References
- Why Vision Is the Most Important Sense Organ. Available online: https://medium.com/@SmartVisionLabs/why-vision-is-the-most-important-sense-organ-60a2cec1c164 (accessed on 30 October 2019).
- Beckermann, A. Visual Information Processing and Phenomenal Consciousness. In Conscious Experience; Schöningh: Paderborn, Germany, 1995; pp. 409–424. [Google Scholar]
- Szeliski, R. Computer Vision: Algorithms and Applications; Springer-Verlag: London, UK, 2011. [Google Scholar]
- Sage, K.; Young, S. Computer vision for security applications. In Proceedings of the IEEE 32nd Annual 1998 International Carnahan Conference on Security Technology, Alexandria, VA, USA, 12–14 October 1998; pp. 210–215. [Google Scholar]
- Stubbington, B.; Keenan, P. Intelligent scene monitoring; technical aspects and practical experience. In Proceedings of the 29th Annual 1995 International Carnahan Conference on Security Technology, Sanderstead, Surrey, UK, 18–20 October 1995; pp. 364–375. [Google Scholar]
- Davies, A.; Velastin, S. A Progress Review of Intelligent CCTV Surveillance Systems. In Proceedings of the IDAACS’05 Workshop, Sofia, Bulgaria, 5–7 September 2005; pp. 417–423. [Google Scholar]
- Sanderson, C.; Bigdeli, A.; Shan, T.; Chen, S.; Berglund, E.; Lovel, B.C. Intelligent CCTV for Mass Transport Security: Challenges and Opportunities for Video and Face Processing. In Progress in Computer Vision and Image Analysis; Bunke, H., Villanueva, J.J., Sanchez, G., Eds.; World Scientific: Singapore, 2010; Volume 73, pp. 557–573. [Google Scholar]
- Direkoglu, C.; Sah, M.; O’Connor, N.E. Abnormal crowd behavior detection using novel optical flow-based features. In Proceedings of the 2017 14th IEEE International Conference on Advanced Video and Signal Based Surveillance, Lecce, Italy, 29 August–1 September 2017; pp. 1–6. [Google Scholar]
- Xiang, J.; Fan, H.; Xu, J. Abnormal behavior detection based on spatial-temporal features. In Proceedings of the International Conference on Machine Learning and Cybernetics, Tianjin, China, 14–17 July 2013; pp. 871–876. [Google Scholar]
- Mehran, R.; Oyama, A.; Shah, M. Abnormal crowd behavior detection using social force model. In Proceedings of the 2009 IEEE Conference on Computer Vision and Pattern Recognition, Miami, FL, USA, 20–25 June 2009; pp. 935–942. [Google Scholar]
- Wu, S.; Moore, B.E.; Shah, M. Chaotic invariants of Lagrangian particle trajectories for anomaly detection in crowded scenes. In Proceedings of the 2010 IEEE Computer Society Conference on Computer Vision and Pattern Recognition, San Francisco, CA, USA, 13–18 June 2010; pp. 2054–2060. [Google Scholar]
- Cong, Y.; Yuan, J.; Liu, J. Abnormal event detection in crowded scenes using sparse representation. Pattern Recognit. 2013, 46, 1851–1864. [Google Scholar] [CrossRef]
- Roshtkhari, M.J.; Levine, M.D. Online Dominant and Anomalous Behavior Detection in Videos. In Proceedings of the 2013 International Conference on Computer Vision and Pattern Recognition, Portland, OR, USA, 23–28 June 2013; pp. 2611–2618. [Google Scholar]
- Halbe, M.; Vyas, V.; Vaidya, Y. Abnormal Crowd Behavior Detection Based on Combined Approach of Energy Model and Threshold. In Proceedings of the 7th International Conference on Pattern Recognition and Machine Intelligence, Kolkata, India, 5–8 December 2017; pp. 187–195. [Google Scholar]
- Yu, T.H.; Moon, Y. Unsupervised Abnormal Behavior Detection for Real-time Surveillance Using Observed History. In Proceedings of the 2009 IAPR Conference on Machine Vision Applications, Yokohama, Japan, 20–22 May 2009; pp. 166–169. [Google Scholar]
- Li, N.; Zhang, Z. Abnormal Crowd Behavior Detection using Topological Method. In Proceedings of the 12th ACIS International Conference on Software Engineering, Networking and Parallel/Distributed Computing, Sydney, NSW, Australia, 6–8 July 2011; pp. 13–18. [Google Scholar]
- Chaudharya, S.; Khana, M.A.; Bhatnagara, C. Multiple Anomalous Activity Detection in Videos. In Proceedings of the 6th International Conference on Smart Computing and Communications, Kurukshetra, India, 7–8 December 2017; pp. 336–345. [Google Scholar]
- Zhong, H.; Shi, J.; Visontai, M. Detecting unusual activity in video. In Proceedings of the 2004 IEEE Computer Society Conference on Computer Vision and Pattern Recognition, Washington, DC, USA, 27 June–2 July 2004; pp. 819–826. [Google Scholar]
- Hamid, R.; Johnson, A.; Batta, S.; Bobick, A.; Isbell, C.; Coleman, G. Detection and explanation of anomalous activities: Representing activities as bags of event n-grams. In Proceedings of the 2005 IEEE Computer Society Conference on Computer Vision and Pattern Recognition, San Diego, CA, USA, 20–25 June 2005; pp. 1031–1038. [Google Scholar]
- Hassner, T.; Itcher, Y.; Kliper-Gross, O. Violent flows: Real-time detection of violent crowd behavior. In Proceedings of the 2012 IEEE Computer Society Conference on Computer Vision and Pattern Recognition Workshops, Providence, RI, USA, 16–21 June 2012; pp. 1–6. [Google Scholar]
- Zhou, S.; Shen, W.; Zeng, D.; Fang, M.; Wei, Y.; Zhang, Z. Spatial-temporal convolutional neural networks for anomaly detection and localization in crowded scenes. Signal Process. Image Commun. 2016, 47, 358–368. [Google Scholar] [CrossRef]
- Boiman, O.; Irani, M. Detecting Irregularities in Images and in Video. Int. J. Comput. Vis. 2007, 74, 11–31. [Google Scholar] [CrossRef] [Green Version]
- Vu, H.; Nguyen, T.D.; Travers, A.; Venkatesh, S.; Phung, D. Energy-Based Localized Anomaly Detection in Video Surveillance. In Proceedings of the 21st Pacific-Asia Conference on Knowledge Discovery and Data Mining, Jeju, South Korea, 23–26 May 2017; pp. 641–653. [Google Scholar]
- Giorno, D.A.; Bagnell, J.; Hebert, M. A Discriminative Framework for Anomaly Detection in Large Videos. In Proceedings of the 2016 European Conference on Computer Vision, Amsterdam, The Netherlands, 11–14 October 2016; pp. 334–349. [Google Scholar]
- Wu, S.; Wong, H.; Yu, Z. A Bayesian Model for Crowd Escape Behavior Detection. IEEE Trans. Circuits Syst. Video Technol. 2014, 24, 85–98. [Google Scholar] [CrossRef]
- Li, S.; Yang, Y.; Liu, C. Anomaly detection based on two global grid motion templates. Signal Process. Image Commun. 2018, 60, 6–12. [Google Scholar] [CrossRef]
- Al-Dhamari, A.; Sudirman, R.; Mahmood, N.H. Abnormal behavior detection in automated surveillance videos: A review. J. Theor. Appl. Inf. Technol. 2017, 95, 5245–5263. [Google Scholar]
- Cong, Y.; Yuan, J.; Liu, J. Sparse reconstruction cost for abnormal event detection. In Proceedings of the 2011 IEEE Conference on Computer Vision and Pattern Recognition, Providence, RI, USA, 20–25 June 2011; pp. 3449–3456. [Google Scholar]
- Hu, X.; Huang, Y.; Duan, Q.; Ci, W.; Dai, J.; Yang, H. Abnormal event detection in crowded scenes using histogram of oriented contextual gradient descriptor. EURASIP J. Adv. Signal Process. 2018, 54. [Google Scholar] [CrossRef]
- Using Optical Flow to Find Direction of Motion. Available online: http://www.cs.utah.edu/~ssingla/CV/Project/OpticalFlow.html (accessed on 12 November 2019).
- Lucas, B.D.; Kanade, T. An Iterative Image Registration Technique with an Application to Stereo Vision. In Proceedings of the 1981 DARPA Image Understanding Workshop, 23 April 1981; pp. 121–130. [Google Scholar]
- Adelson, E.H.; Anderson, C.H.; Bergen, J.R.; Burt, P.J.; Ogden, J.M. Pyramid methods in image processing. RCA Eng. 1984, 29, 33–41. [Google Scholar]
- Adelson, E.H.; Bergen, J.R. Spatiotemporal energy models for the perception of motion. J. Opt. Soc. Am. A 1985, 2, 284–299. [Google Scholar] [CrossRef] [PubMed] [Green Version]
- Farnebäck, G. Two-Frame Motion Estimation Based on Polynomial Expansion. In Proceedings of the 2003 Scandinavian Conference on Image Analysis, Halmstad, Sweden, 29 June–2 July 2003; pp. 363–370. [Google Scholar]
Figure 1.
The overall process of the proposed method.

Figure 2.
Motion detection through optical flow.

Figure 3.
Magnitude and gradient feature map. (a) original frame; (b) Fmag; (c) Fgrad.

Figure 4.
Statistical value of the motion vector. (a) Maximum, minimum, average; (b) standard deviation.
Figure 4.
Statistical value of the motion vector. (a) Maximum, minimum, average; (b) standard deviation.

Figure 5.
Example result of calculating Rmag. (a) original frame; (b) Fmag; (c) Rmag; (d) result of the system.
Figure 5.
Example result of calculating Rmag. (a) original frame; (b) Fmag; (c) Rmag; (d) result of the system.

Figure 6.
Example result of calculating Rgrad. (a) original frame; (b) Fgrad; (c) Rgrad.

Figure 7.
Example result of calculating temporal saliency map. (a) original frame; (b) result of the system; (c) Rmag; (d) Rgrad; (e) temporal saliency map (TS).
Figure 7.
Example result of calculating temporal saliency map. (a) original frame; (b) result of the system; (c) Rmag; (d) Rgrad; (e) temporal saliency map (TS).
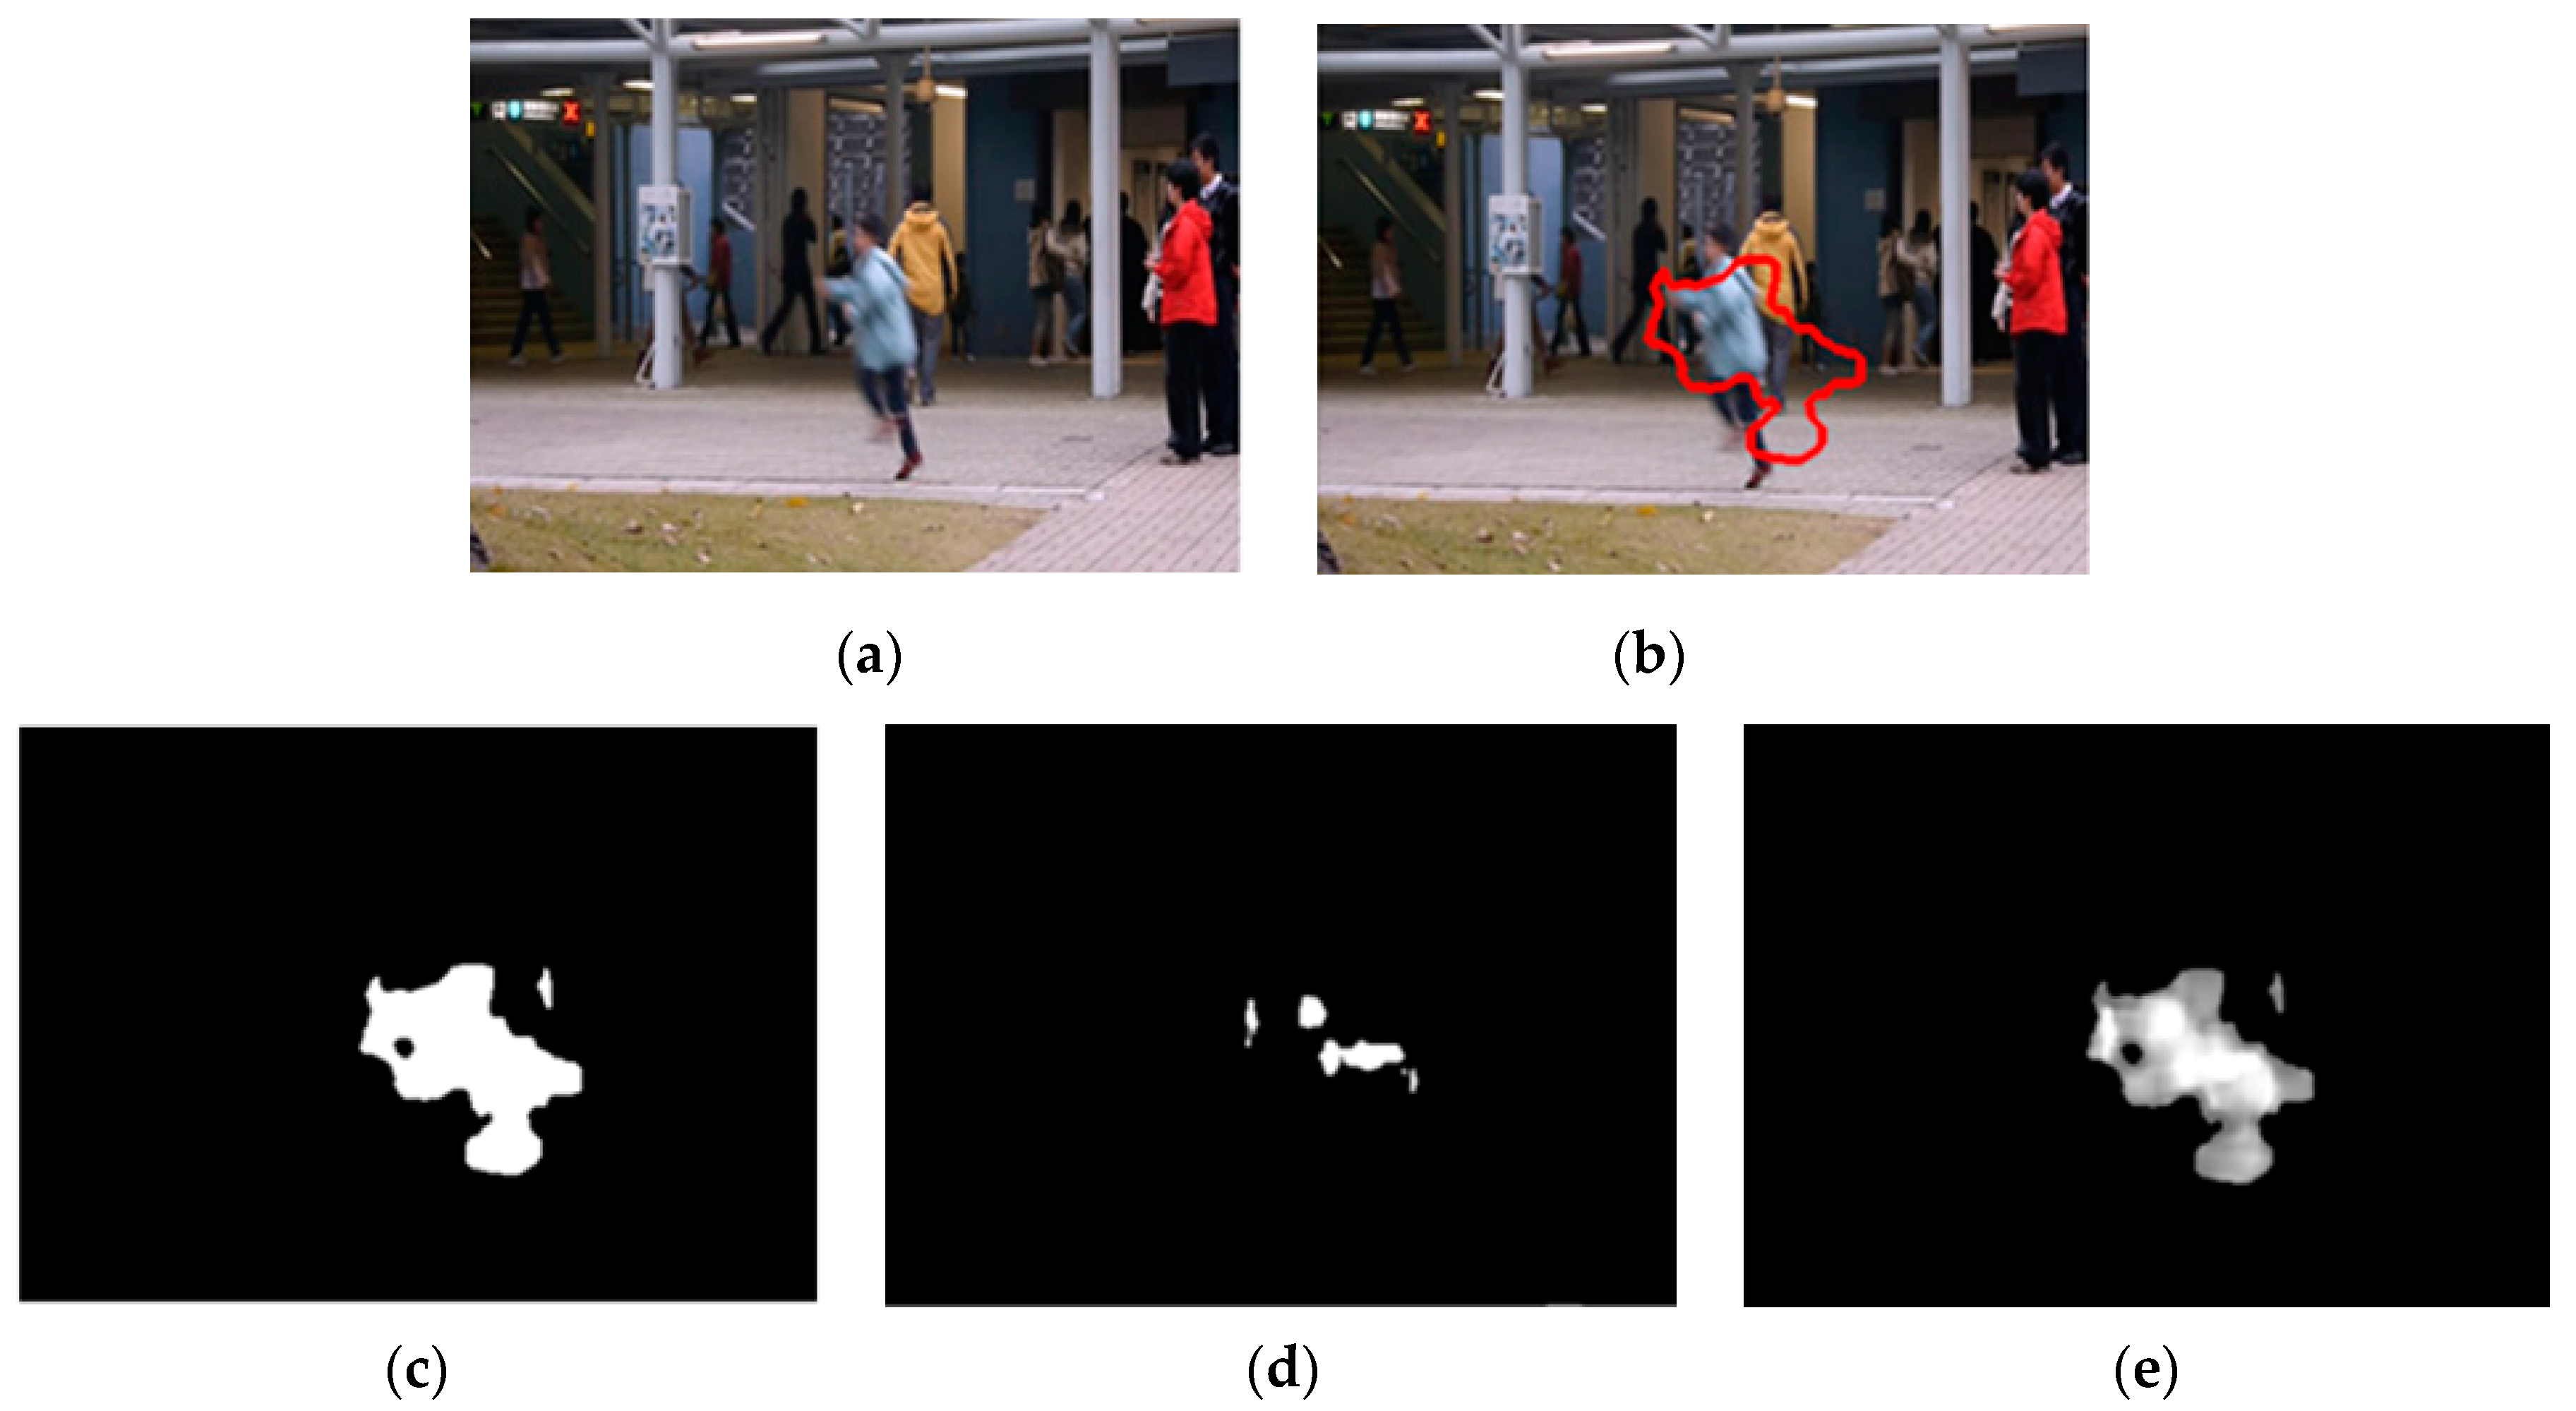
Figure 8.
Examples of detection results for abnormality from No. 1 data (UMN Scene 1: Lawn).

Figure 9.
Examples of detection results for abnormality from No. 2 data (UMN Scene 2: Indoor).

Figure 10.
Examples of detection results for abnormality from No. 3 data (UMN Scene 3: Plaza).

Figure 11.
Examples of detection results for abnormality from the No. 4 data (Avenue).

Figure 12.
Examples of detection results for abnormality from the No. 5 data.

Figure 13.
Examples of detection results for abnormality from the No. 6 data.

Figure 14.
Examples of detection results for abnormality from the No. 7 data.

Figure 15.
Examples of detection results for abnormality from the No. 8 data.

Figure 16.
Examples of detection results for abnormality from the No. 9 data.

Figure 17.
Examples of detection results for abnormality from the No. 10 data.


Table 1.
Dataset and types of suspicious behaviors used in the proposed method.
| No | Dataset | Suspicious Behaviors Description |
|---|---|---|
| 1 | UMN dataset: Lawn | Multiple people are running away in multiple directions simultaneously with an explosion sound. |
| 2 | UMN dataset: Indoor | |
| 3 | UMN dataset: Plaza | |
| 4 | Avenue dataset | A few people are jumping and running in front of the building while others are walking. |
| 5 | Walk dataset | People are walking normally. There are not any abnormal behaviors. |
| 6 | Bump data | A man is smashed against an obstacle. |
| 7 | Fall down data | A man is falling over an obstacle. |
| 8 | Water data | A man is walking on the road falls into the water. |
| 9 | Stairs fall down data | The man who came down the stairs is falling down. |
| 10 | CCTV violent robbery data in South Kensington | Two men are assaulting one man. |
Table 2.
Accuracy comparison with state-of-the art methods on the UMN dataset.
| UMN Dataset | Proposed Method | [8] | [25] | [11] | [10] | [12] |
|---|---|---|---|---|---|---|
| Scene 1: Lawn | 99.20% | 99.10% | 99.03% | 90.62% | 84.41% | 90.52% |
| Scene 2: Indoor | 97.10% | 94.85% | 95.36% | 85.06% | 82.35% | 78.48% |
| Scene 3: Plaza | 93.20% | 97.76% | 96.63% | 91.58% | 90.83% | 92.70% |
| average | 96.50% | 96.46% | 96.40% | 87.91% | 85.09% | 84.70% |
Table 3.
AUC (area under the curve) comparison with state-of-the art methods on the Avenue dataset.
| Proposed Method | [26] | [29] | [21] | |
|---|---|---|---|---|
| Avenue dataset | 90.18% | 87.70% | 87.19% | 80.30% |
Table 4.
The overall performance evaluation result of the proposed method.
| No. | Dataset | Accuracy | Precision | Recall |
|---|---|---|---|---|
| 1 | UMN dataset: Lawn | 99.2% | 99.8% | 91.1% |
| 2 | UMN dataset: Lobby | 97.1% | 99.5% | 93.7% |
| 3 | UMN dataset: Park | 93.2% | 98.9% | 92.5% |
| 4 | Avenue dataset | 90.1% | 93.2% | 94.5% |
| 5 | Walk dataset | 100% | 100% | 100% |
| 6 | Bump data | 95.8% | 100% | 94.4% |
| 7 | Fall down data | 95% | 91.6% | 100% |
| 8 | Water data | 82.7% | 79.1% | 100% |
| 9 | Stairs fall down data | 94.4% | 100% | 84.6% |
| 10 | CCTV violent robbery data in South Kensington | 91.4% | 100% | 90.6% |
| average | 93.89% | 96.21% | 94.9% |
© 2020 by the author. Licensee MDPI, Basel, Switzerland. This article is an open access article distributed under the terms and conditions of the Creative Commons Attribution (CC BY) license (http://creativecommons.org/licenses/by/4.0/).
Share and Cite
MDPI and ACS Style
Cheoi, K.J. Temporal Saliency-Based Suspicious Behavior Pattern Detection. Appl. Sci. 2020, 10, 1020. https://doi.org/10.3390/app10031020
AMA Style
Cheoi KJ. Temporal Saliency-Based Suspicious Behavior Pattern Detection. Applied Sciences. 2020; 10(3):1020. https://doi.org/10.3390/app10031020
Chicago/Turabian StyleCheoi, Kyung Joo. 2020. "Temporal Saliency-Based Suspicious Behavior Pattern Detection" Applied Sciences 10, no. 3: 1020. https://doi.org/10.3390/app10031020
Note that from the first issue of 2016, this journal uses article numbers instead of page numbers. See further details here.