Abstract
Denoising and compression of 2D and 3D images are important problems in modern medical imaging systems. Discrete wavelet transform (DWT) is used to solve them in practice. We analyze the quantization noise effect in coefficients of DWT filters for 3D medical imaging in this paper. The method for wavelet filters coefficients quantizing is proposed, which allows minimizing resources in hardware implementation by simplifying rounding operations. We develop the method for estimating the maximum error of 3D grayscale and color images DWT with various bits per color (BPC). The dependence of the peak signal-to-noise ratio (PSNR) of the images processing result on wavelet used, the effective bit-width of filters coefficients and BPC is revealed. We derive formulas for determining the minimum bit-width of wavelet filters coefficients that provide a high (PSNR ≥ 40 dB for images with 8 BPC, for example) and maximum (PSNR = ∞ dB) quality of 3D medical imaging by DWT depending on wavelet used. The experiments of 3D tomographic images processing confirmed the accuracy of theoretical analysis. All data are presented in the fixed-point format in the proposed method of 3D medical images DWT. It is making possible efficient, from the point of view of hardware and time resources, the implementation for image denoising and compression on modern devices such as field-programmable gate arrays and application-specific integrated circuits.
1. Introduction
Medical imaging uses many different methods such as magnetic resonance (MR) imaging [1,2,3,4,5,6,7,8], radiography [4,9,10,11], radionuclide [8,12], optical [11,13,14], ultrasound [1,15] and medical robotics [16,17]. The typical medical imaging system consists of three components (Figure 1): data acquisition, data consolidation and data processing. The data acquisition card, which filters incoming data, is the most cost-sensitive system card. Usually, a diagnostic imaging system will consist of multiple data acquisition cards. Once the data is compensated and filtered in scanners, it is sent to the data consolidation card for buffering and data alignment. Once the data has been collected, it is sent to the image processing cards [18]. These cards perform heavy-duty filtering and the most algorithm-intensive image reconstruction. Modern field-programmable gate array (FPGA) devices are widely used in data consolidation, and image processing for sophisticated application algorithms implementation including pattern recognition, image enhancement and data compression [19,20].
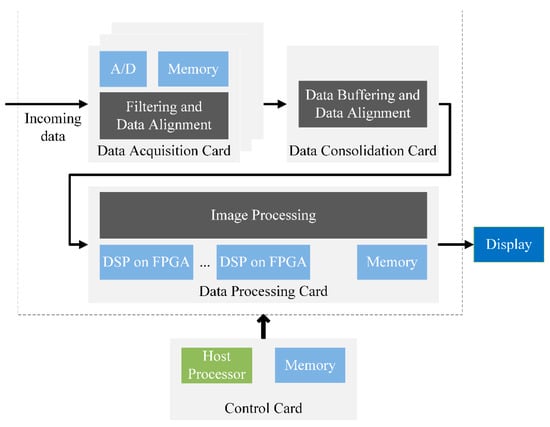
Figure 1.
The typical medical imaging system.
Denoising of 2D and 3D medical images is an important problem in modern medical imaging systems. The noisy pattern is not always bad in medical images, but in most cases is a problem. MR images are inherently noisy and thus filtering methods are required to improve the data quality [5]. Rheological methods of increasing MR elastography resolution determine viscoelastic properties through wave inversion, which is highly ill posed and sensitive to noise [1]. In radiology using computed tomography (CT) or related morphological imaging modalities, noise affects the analysis of anatomical structures and thus impedes diagnostic applications [11]. Low dose radiation exposure for patient safety leads to noisy and low-contrast fluoroscopic sequences [11]. The reconstruction process of the positron emission tomography images includes inherent multiplicative noise, which prevents the analysis of visual data [12]. In optical CT for retinal imaging as another example use case, noise limits the measurement of structural features in the human eye, e.g., retinal layer properties [11]. Denoising facilitates visual data interpretation from echocardiography [15].
Medical imaging systems produce increasingly accurate images with improved quality using higher spatial resolutions and bit-depths with advances in scanning technology and digital devices. Such improvements increase the amount of information that needs to be processed, transmitted and stored. This is especially true when using 3D scanning technology [4]. For example, four sets of positron emission tomography medical images of one patient may require more than 4 GB of storage space [21]. Video recording of a relatively short retinal peeling procedure may require over 40 GB of memory storage [14]. The capacity of hard drives is on average 1–2 TB with the current level of storage technology development. Thus, the compression of 3D medical images is also an important problem in modern medical imaging systems.
Various transforms are used to solve problems of 2D and 3D medical images denoising and compression in practice. The most common of them are discrete Fourier transform (DFT) [3,7,14,22] and discrete wavelet transform (DWT) [1,9,11,14]. DFT is widely used in the frequency domain but the domain characteristics disappeared after it. We cannot determine the time position and the degree of intensity after signal DFT. It is not possible to describe the local properties of the time domain of the image. DWT solves these problems because it allows obtaining both frequency and time information about a signal [23,24]. 2D and 3D images DWT is performed by convolution with a pair of lowpass and highpass wavelet filters of filter bank that highlight main and detailed information respectively. Denoising and compression of images are performed by detailed information manipulating in modern algorithms such as set partitioning in hierarchical trees (SPIHTs) [25] and embedded zerotrees of wavelet transforms (EZWs) [26]. The convolution operation has high computational complexity. Hardware implementation on modern microelectronic devices such as field-programmable gate arrays (FPGAs) and application-specific integrated circuits (ASICs) working with fixed-point numbers is one of the ways to improve its characteristics [27,28,29]. Quantization noise occurs when converting wavelet filters coefficients into this format, due to which convolution is performed with an error. The question arises about the accuracy of wavelet filters coefficients representation in the device’s memory, which is efficient in terms of resources and enough to achieve the required quality of image processing. A novel area-efficient high-throughput 3D DWT architecture for real-time medical imaging based on distributed arithmetic is proposed by the authors [30]. The design and implementation of 3D Haar wavelet transform with transpose based computation and dynamic partial reconfiguration for 3D medical image compression are presented in [31]. The implementation of positron emission tomography using DWT on FPGA is proposed by authors [32]. In paper [33] described the architecture based on the use of DWT for biomedical signals compression. The design and implementation of context-based adaptive variable length coding and comparative analysis of trade-off offered by DWT for 3D medical image compression systems are described by authors [34]. In [35] presented the design and implementation of 3D DWT with a transpose-based method for medical image compression on FPGA. Experimental results from [36] showed that the system constructed a 1D DWT system based on FPGA can filter the noise and extract the electroencephalogram (EEG) signal well. The design and implementation on FPGA of 3D DWT using Daubechies wavelets with a transpose-based method for medical image compression are presented in [37]. The design and implementation of distributed arithmetic architectures of 3D DWT with a hybrid method for medical image compression are presented in [38]. Authors [39] presented the FPGA-based embedded system design using DWT and its evaluation for a pre-processing stage of EEG signal analysis. A detailed review of FPGA and ASIC architectures for DWT implementation in biomedical and intelligent applications, which can be designed either for higher-accuracy or for low-power consumption is provided by the authors [29]. In [40], the authors showed that DWT along with Gaussian filtering shows better results in removing the noise and smoothes the electrocardiogram signals. Authors [41] described the design and implement a complete hardware model based on DWT for EEG data compression and reconstruction on FPGA. A framework is offered in [42] based on DWT using linear and non-linear classifiers for detecting an epileptic seizure from EEG data recorded from normal subjects and an epileptic patient. There are no references to selected bit-width of wavelet filters coefficients in the materials studied about the hardware implementation of medical images DWT on FPGA and ASIC [29,30,31,32,34,35,36,37,38,39,40,41,42]. Authors [33] quantized wavelet filters coefficients by 16 bits, but there is no rationale for this choice. The problem of analyzing the quantization noise effect in wavelet filters coefficients for 2D grayscale and color images DWT with 8 bits per color (BPC) was solved in [43].
Analysis of 3D medical images DWT result quality dependence on noise arising from filters coefficients quantizing of wavelet with compact support is the purpose of this work. Particular attention is paid to determining the minimum bit-width of wavelet filters coefficients, at which this noise does not have a significant impact on the 3D medical images DWT result dB for images with 8 BPC, for example, or does not affect it at all . The values dB describes the difference between the two images with 8 BPC almost imperceptible for human eyes [44,45]. The value for identical images.
2. Materials and Methods
DWT is a signal transform using a filter bank, which is a convolution of the input data with wavelet filters that translate them from a time representation into a time-frequency domain. Wavelet filters of filter bank consist of coefficients , where and is the number of coefficients. Coefficients of lowpass and highpass wavelet filters of decomposition and reconstruction are related by equation [27]
We shall consider only wavelets with compact support [46]. Daubechies wavelets (where with is Haar wavelet), symlets and coiflets are the most common ones.
Consider a 3D digital medical image of rows, columns and frames as a function , where , and are the spatial coordinates of . Thus, voxel values (analogues of 2D pixels for 3D space) are represented as for grayscale images and as for color images, where is the color number (for example, —red, green and blue colors respectively for RGB images). We assumed that all image voxels are isotropic [47], hereinafter.
Convolution of a 3D image with wavelet filters is performed by formulas
where , and is the convolution results by strings, columns and frames respectively. 3D image DWT is performed by sequential convolution with wavelet filters (Figure 2) in the steps below.
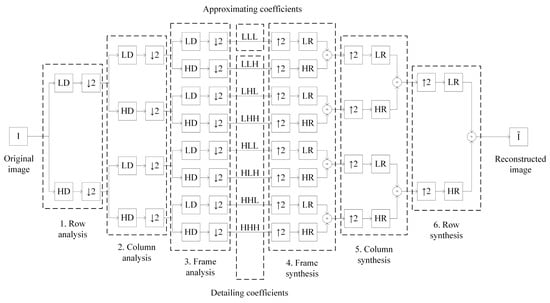
Figure 2.
The scheme of 3D image discrete wavelet transform (DWT).
- Row analysis is performed by decomposing the original image by rows with lowpass and highpass wavelet filters and downsampling, indicated by the symbol (for example, the array is transformed into an array after the operation ).
- Column analysis is performed by columns similar to the row analysis for coefficients obtained at stage 1.
- Frame analysis is performed by frames similar to the row analysis for coefficients obtained at stage 2.
We get 8 sets of coefficients, and , of image decomposition as a result of original image analysis. These sets can be divided into approximating and detailing and Approximating coefficients correspond to the lowpass part of the signal and contain main information about the image . Detailing coefficients to correspond to the highpass part of the signal and contain detailed information about the image . 3D image denoising and compression are carried out by manipulating detailing coefficients and of image decomposition.
- 4.
- Frame synthesis is performed by upsampling, indicated by the symbol (for example, the array is transformed into an array after the operation ), of image decomposition coefficients by frames, reconstructing with lowpass and highpass wavelet filters and summation of the corresponding results.
- 5.
- Column synthesis is performed by columns similar to the frame synthesis for coefficients obtained at Stage 4.
- 6.
- Row synthesis is performed by rows similar to the frame synthesis for coefficients obtained at Stage 5.
We get the reconstructed image as a result of image decomposition coefficients synthesis. Theoretically, the original image should be fully reconstructed since the scheme in Figure 2 has the perfect reconstruction property [48]. However, quantization noise occurs due to the digital format of wavelet filters coefficients representation in practice. Quantization noise distorts all image decomposition coefficients and as well as reconstructed image . The images DWT result may have a quality unacceptable for the task depending on the magnitude of quantization noise.
The question arises about the minimum bit-width of wavelet filters coefficients , necessary for efficient software and hardware implementation of 3D images DWT on modern devices and enough for high-quality images processing. The speed of operations with a fixed-point number is higher than with a floating-point number on modern devices. This can be used to develop 3D medical imaging devices. Therefore, wavelet filters coefficients are quantized and converted into a fixed-point format in the proposed method by scaling by and rounding up
Bit-width of quantized wavelet filters coefficients can be determined by the formula in this case. The digital image processed according to the scheme in Figure 2 using quantized wavelet filters coefficients . Voxel values of an image should be normalized by scaling by ( for each convolution, according to the scheme from Figure 2) and rounding down
We get only integers as a result of images DWT with unquantized coefficients. The quantization error of the wavelet filters coefficients rounded up is strictly redundant. Rounding down of the DWT results minimizes this error and cannot cause an error by itself. Rounding up and down operations are performed by discarding the fractional part of the number with the addition of one in the case of rounding up an integer. The rounding errors will have different signs and partially compensate each other for rounding in different directions. Rounding operations in this order require fewer resources for hardware implementation than rounding operations to the nearest integer. This is due to the fact wavelet filter coefficients are known a priori and their quantization with rounding up can be made in advance. Thus, wavelet filters coefficients will be used in the form of constants in the software and hardware part. The convolution is performed using arithmetic logic devices, and its result is rounded down by simply discarding the fractional part and does not require additional hardware and time costs.
We used the peak signal-to-noise ratio between two images (original image and processed image ) to quantify the image processing quality. The logarithmic nature makes it possible to clearly interpret results that differ slightly from each other. Other metrics usually only show a big difference. This characteristic is measured in decibels (dB) and is calculated by the following formula [49]
where: is the image BPC; is the maximum brightness of the image voxels (for example, and for 8-bit grayscale image and 24-bit RGB image); is the mean square error of brightness, which is calculated for grayscale [50] and color [51] 3D images by formulas
The value for identical images. The image processing quality is considered high if , where describes the difference between the two images almost imperceptible for human eyes. dB for images with 8 BPC [44,45]. We propose to generalize to the case of images with 12 and 16 BPC using formula
Thus, is equal 40 dB, 60 dB and 80 dB for images with 8, 12 and 16 BPC respectively.
3. Results
3.1. Theoretical Analysis of the Maximum Error of the 3D Medical Images DWT
The error of 3D medical images DWT occurs as a result of wavelet filters coefficients conversion (quantization noise) by Formula (2). Convolutions, upsampling and the summing of convolution results cause an increase in this error. Rounding down normalized voxel values of the restored image also has an effect. Note the important facts.
- The analyzing and synthesizing wavelet filters consist of the same coefficients, according to Formula (1), hence, the limited absolute errors of computations will also be equal. Therefore, within the framework of theoretical calculations, wavelet filters are classified only into lowpass and highpass ones.
- The sums of the lowpass and highpass wavelet filter coefficients are equal and , respectively [27].
We introduce the following notation.
- —limited absolute error (LAE) of calculating the value of the coefficient at the -th stage, resulting from convolution with a sequence of wavelet filters .
- —the exact value of the sum of the coefficients of the wavelet filter .
- —the exact value of the calculations in the -th stage, after convolution with a sequence of wavelet filters .
The errors of all image decomposition coefficients and are separated into two groups as a result of upsampling . Figure 3 shows an example of the errors separation at the upsampling by frames and columns, where and . This situation is similar for upsampling by strings. Upsampling is applied three times during image restoration. We got eight groups of errors as a result. Thus, we would add an additional index to the introduced notations, which denotes calculations by the spatial characteristics of wavelet filters coefficients.
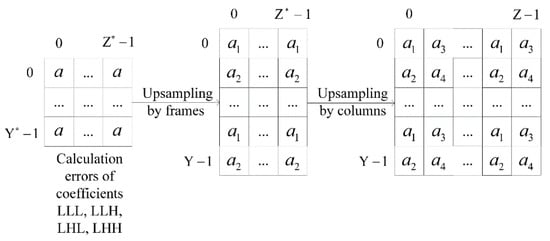
Figure 3.
The scheme of the errors separation with upsampling by frames and columns.
Next, we carried out analysis calculations for an estimation of the maximum error of the 3D medical images DWT.
Stage 1. Wavelet filters coefficients quantization. Let us calculate the exact values of the coefficients sums , and errors , of rounding up filters and scaled coefficients.
Stage 2. Row decomposition. Let us calculate the exact values and errors of row decomposition with filters and .
All convolution results with filter are zero since for all voxels are equal and [27].
Stage 3. Column decomposition. Let us calculate the exact values and errors of column decomposition with filters and .
Stage 4. Frame decomposition. Let us calculate the exact values and errors of frame decomposition with filters and .
Stage 5. Frame reconstruction. Let us calculate the exact values and errors of frame reconstruction with filters and , .
Stage 6. Frame summation. Let us calculate the errors of sums , .
Stage 7. Column reconstruction. Let us calculate the errors and errors of column reconstruction with filters and .
Stage 8. Column summation. Let us calculate the errors of sums , .
Stage 9. Row reconstruction. Let us calculate the errors and errors of column reconstruction with filters and .
Stage 10. Row summation. Let us calculate the errors of sums ,
Stage 11. Normalizing. Let us calculate the errors of rounding downscaled by .
The obtained values represent the resulting error of the method and allow for the calculation of the PSNR
where .
Formula (5) allows determining the minimum quality of a 3D image , obtained as a result of DWT of the original image , depending on the maximum brightness and selected bit-width of wavelet filters coefficients .
Calculations results (, dB) obtained by using our method of wavelet filters coefficients quantizing and final Formula (5) for 3D medical grayscale and color images DWT with various BPC, various bit-width and numbers of wavelets filters coefficients are presented in Table 1, Table 2 and Table 3. The cells in bold correspond to the minimum bit-widths of the filter coefficients, at which the processing quality achieves a high level according to the formula (4).

Table 1.
Calculation results (, dB) of 3D medical images (with 8 BPC) DWT by using bit-width of Daubechies wavelets filters coefficients.
Table 2.
Calculation results (, dB) of 3D medical images (with 12 BPC) DWT by using bit-width of Daubechies wavelets filters coefficients.
Table 3.
Calculation results (, dB) of 3D medical images (with 16 BPC) DWT by using bit-width of Daubechies wavelets filters coefficients.
Calculations results (, dB) obtained by using our method of wavelet filters coefficients quantizing and final Formula (5) for 3D medical grayscale and color images DWT with various BPC, various bit-width and numbers of wavelets filters coefficients are presented in Table 4, Table 5 and Table 6.
Table 4.
Calculation results (, dB) of 3D medical images (with 8 BPC) DWT by using bit-width of symlets filters coefficients.
Table 5.
Calculation results (, dB) of 3D medical images (with 12 BPC) DWT by using bit-width of symlets filters coefficients.
Table 6.
Calculation results (, dB) of 3D medical images (with 16 BPC) DWT by using bit-width of symlets filters coefficients.
Calculations results (, dB) obtained by using our method of wavelet filters coefficients quantizing and final Formula (5) for 3D medical grayscale and color images DWT with various BPC, various bit-width and numbers of wavelets filters coefficients are presented in Table 7, Table 8 and Table 9.
Table 7.
Calculation results (, dB) of 3D medical images (with 8 BPC) DWT by using bit-width of coiflets filters coefficients.
Table 8.
Calculation results (, dB) of 3D medical images (with 12 BPC) DWT by using bit-width of coiflets filters coefficients.
Table 9.
Calculation results (, dB) of 3D medical images (with 16 BPC) DWT by using bit-width of coiflets filters coefficients.
Let us compile Table 10, Table 11 and Table 12 based on Table 1, Table 2, Table 3, Table 4, Table 5, Table 6, Table 7, Table 8 and Table 9 with the minimum values of , at which the result of 3D medical images DWT with Daubechies wavelets, symlets and coiflets reach a high and maximum quality. For example, the result of 3D medical images (with 8 BPC) DWT with Daubechies wavelet reaches high quality at dB and maximum quality at according to Table 1. The remaining cells are filled in the same way.
Table 10.
Minimum values of , at which the result of 3D medical images DWT with Daubechies wavelets reaches high and maximum quality.
Table 11.
Minimum values of , at which the result of 3D medical images DWT with symlets reaches high and maximum quality.
Table 12.
Minimum values of , at which the result of 3D medical images DWT with coiflets reaches high and maximum quality.
We could make the following conclusions based on calculation results presented in the Table 10, Table 11 and Table 12.
- Minimum bit-width of wavelet filters coefficients at which the result of 3D medical images with 8 BPC DWT does not contain visible distortions dB can be determined by a formulawhere is the number of wavelet filters coefficients.
- Minimum bit-width of wavelet filters coefficients at which the result of 3D medical images with 12 BPC DWT does not contain visible distortions dB can be determined by a formula
- Minimum bit-width of wavelet filters coefficients at which the result of 3D medical images with 16 BPC DWT does not contain visible distortions dB can be determined by a formula
- Minimum bit-width of wavelet filters coefficients at which the result of 3D medical images DWT does not contain distortions can be determined by a formulawhere is the image BPC.
Formulas (6)–(9) are an approximate since the values obtained at their use are sometimes redundant, that is, exceed values presented in Table 10, Table 11 and Table 12. However, they allow one to accurately calculate the non-redundant bit-width of the quantized wavelet filters coefficients in most cases. These formulas are applicable to both grayscale and color images.
3.2. Experiments of the 3D Medical Tomographic Images DWT
The experiments were conducted using MatLab software version R2018b for the three 3D medical tomographic grayscale images: “wmri” is the 8-bit image of size ; “Trufi_COR” is the 12-bit image of size and “Body_1.0” is the 16-bit image of size . These images have the following histograms (Figure 4). The larger the image bitness, the lower its ratio of the average voxel brightness to the maximum allowed. We show the influence of this factor on the image processing quality further.
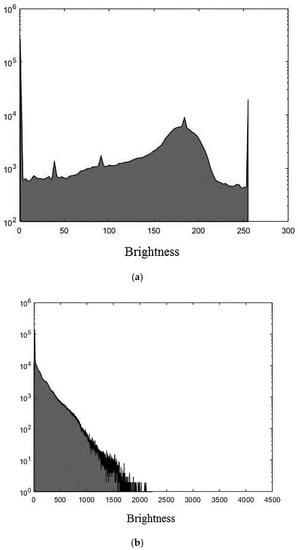
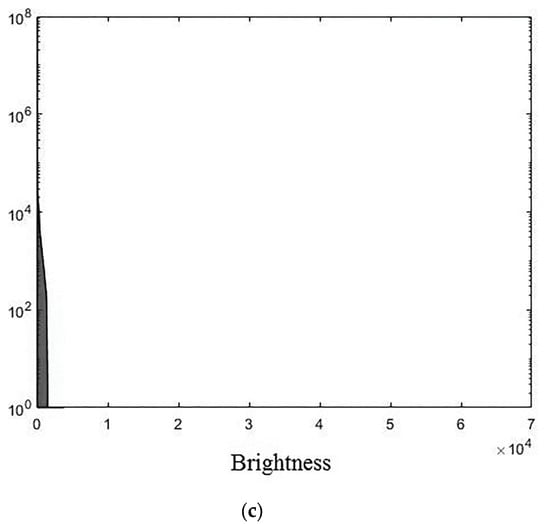
Figure 4.
Histograms of used images: (a) “wmri”, average brightness ; (b) “Trufi_COR”, average brightness and (c) “Body_1.0”, average brightness .
Images DWT performed as follows: filters coefficients of the Daubechies wavelets , symlets and coiflets were obtained, quantized by multiplying by and rounding up according to Formula (2) and converted to fixed-point format; DWT of 3D images implemented; the voxels brightness values of the restored images were scaled by dividing by and rounding down according to Formula (3) and converted to fixed-point format.
An example of 3D tomographic images “wmri”, “Trufi_COR” and “Body_1.0” DWT with wavelet is shown in Figure 5, Figure 6 and Figure 7 respectively. Frames in Figure 6 and Figure 7 are selected to illustrate the error effect on the image processing result. Figures show a gradual improvement in the quality of processing with an increase the bit-width : in Figure 5b, Figure 6b and Figure 7b visible distortion (Figure 5b is darkened in places, and Figure 6b and Figure 7b are lighted); in Figure 5c, Figure 6c and Figure 7c processed images are indistinguishable by eye from the original images; in Figure 5d, Figure 6d and Figure 7d processed images are identical to the corresponding originals. Experimental results are of higher quality compared with the calculation results. The values dB and at and respectively (Figure 5) obtained after 8-bit image “wmri” DWT with wavelet exceed the corresponding calculated values dB and at and respectively (Table 1). The values dB and at and respectively (Figure 6) obtained after 12-bit image “Trufi_COR” DWT with wavelet exceed the corresponding calculated values dB, dB at and respectively (Table 2). Similarly, for “Body_1.0”.
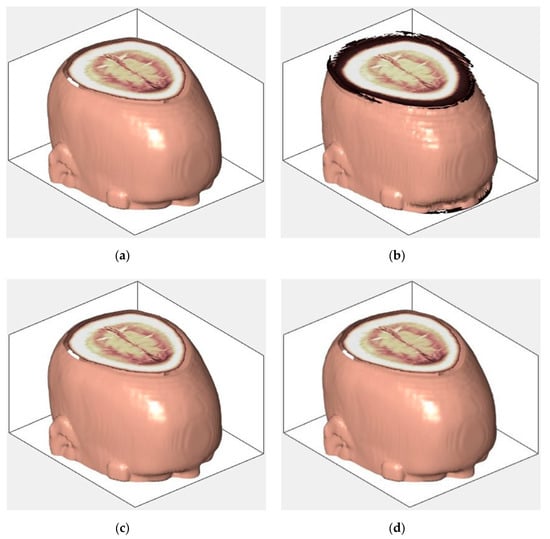
Figure 5.
Example of 3D tomographic 8-bit image “wmri” DWT by wavelet: (a) original image; processed image: (b) , dB; (c) , dB and (d) , .
Figure 6.
Example of 3D tomographic 12-bit image “Trufi_COR” (15-th frame) DWT by wavelet: (a) original image; processed image: (b) , dB; (c) , dB and (d) , .
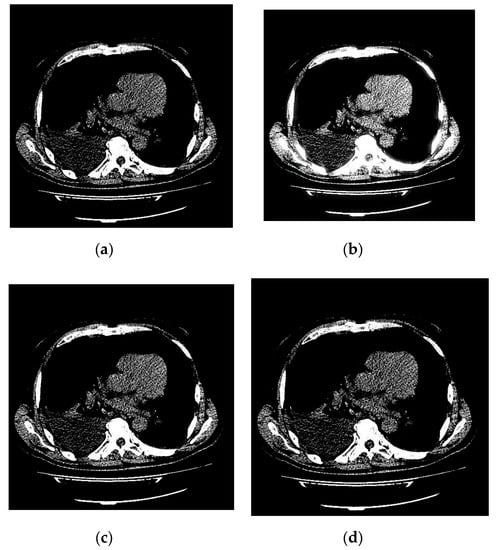
Figure 7.
Example of 3D tomographic 16-bit image “Body_1.0” (1-st frame) DWT by wavelet: (a) original image; processed image: (b) , dB; (c) , dB and (d) , .
The image processing results were analyzed using and structure similarity ) [52], calculating by formula
where: is the average of ; is the average of ; is the variance of ; is the variance of ; ; and is the maximum brightness of the image voxels. Experimental results (, dB; ) of DWT of 3D tomographic grayscale images “wmri” (8-bit), “Trufi_COR” (12-bit) and “Body_1.0” (16-bit) for various bit-width and numbers of wavelets filters coefficients are presented in Table 13, Table 14, Table 15, Table 16, Table 17 and Table 18. The cells in bold correspond to the minimum bit-widths of the filter coefficients, at which the processing quality achieves a high level according to the formula (4).
Table 13.
Experimental results (, dB) of 3D tomographic 8-bit image “wmri” DWT by using bit-width of Daubechies wavelets filters coefficients.
Table 14.
Experimental results () of 3D tomographic 8-bit image “wmri” DWT by using bit-width of Daubechies wavelets filters coefficients.
Table 15.
Experimental results (, dB) of 3D tomographic 12-bit image “Trufi_COR” DWT by using bit-width of Daubechies wavelets filters coefficients.
Table 16.
Experimental results () of 3D tomographic 12-bit image “Trufi_COR” DWT by using bit-width of Daubechies wavelets filters coefficients.
Table 17.
Experimental results (, dB) of 3D tomographic 16-bit image “Body_1.0” DWT by using bit-width of Daubechies wavelets filters coefficients.
Table 18.
Experimental results () of 3D tomographic 16-bit image “Body_1.0” DWT by using bit-width of Daubechies wavelets filters coefficients.
Experimental results (, dB; ) of DWT of 3D tomographic grayscale images “wmri” (8-bit), “Trufi_COR” (12-bit) and “Body_1.0” (16-bit) for various bit-width and numbers of wavelets filters coefficients are presented in Table 19, Table 20, Table 21, Table 22, Table 23 and Table 24.
Table 19.
Experimental results (, dB) of 3D tomographic 8-bit image “wmri” DWT by using bit-width of symlets filters coefficients.
Table 20.
Experimental results () of 3D tomographic 8-bit image “wmri” DWT by using bit-width of symlets filters coefficients.
Table 21.
Experimental results (, dB) of 3D tomographic 12-bit image “Trufi_COR” DWT by using bit-width of symlets filters coefficients.
Table 22.
Experimental results () of 3D tomographic 12-bit image “Trufi_COR” DWT by using bit-width of symlets filters coefficients.
Table 23.
Experimental results (, dB) of 3D tomographic 16-bit image “Body_1.0” DWT by using bit-width of symlets filters coefficients.
Table 24.
Experimental results () of 3D tomographic 16-bit image “Body_1.0” DWT by using bit-width of symlets filters coefficients.
Experimental results (, dB; ) of DWT of 3D tomographic grayscale images “wmri” (8-bit), “Trufi_COR” (12-bit) and “Body_1.0” (16-bit) for various bit-width and numbers of wavelets filters coefficients are presented in Table 25, Table 26, Table 27, Table 28, Table 29 and Table 30.
Table 25.
Experimental results (, dB) of 3D tomographic 8-bit image “wmri” DWT by using bit-width of coiflets filters coefficients.
Table 26.
Experimental results () of 3D tomographic 8-bit image “wmri” DWT by using bit-width of coiflets filters coefficients.
Table 27.
Experimental results (, dB) of 3D tomographic 12-bit image “Trufi_COR” DWT by using bit-width of coiflets filters coefficients.
Table 28.
Experimental results () of 3D tomographic 12-bit image “Trufi_COR” DWT by using bit-width of coiflets filters coefficients.
Table 29.
Experimental results (, dB) of 3D tomographic 16-bit image “Body_1.0” DWT by using bit-width of coiflets filters coefficients.
Table 30.
Experimental results () of 3D tomographic 16-bit image “Body_1.0” DWT by using bit-width of coiflets filters coefficients.
Calculation results from Table 10, Table 11 and Table 12 supplemented by experimental results from Table 13, Table 14, Table 15, Table 16, Table 17, Table 18, Table 19, Table 20, Table 21, Table 22, Table 23, Table 24, Table 25, Table 26, Table 27, Table 28, Table 29 and Table 30 and the difference between them is presented in Table 31, Table 32 and Table 33.
Table 31.
Minimum values of , at which the result of 3D tomographic images DWT by Daubechies wavelets reaches high and maximum quality.
Table 32.
Minimum values of , at which the result of 3D tomographic images DWT by symlets reaches high and maximum quality.
Table 33.
Minimum values of , at which the result of 3D tomographic images DWT by coiflets reaches high and maximum quality.
Experimental results (, dB) of various 3D tomographic 12-bit grayscale images DWT by wavelet with bit-width of filters coefficients are presented in Table 34 and in Figure 8.
Table 34.
Experimental results (, dB) of 3D tomographic images DWT by wavelet with bit-width of filters coefficients.
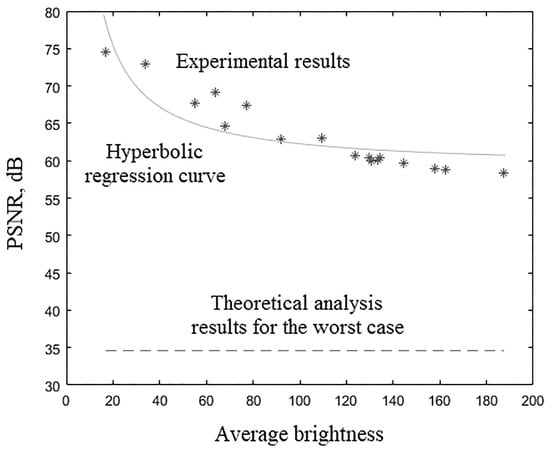
Figure 8.
Experimental results of 3D tomographic 12-bit images DWT by wavelet with bit-width of filters coefficients.
The nonlinear hyperbolic regression [53] curve for the data from Table 34 was plotted in Figure 8 and has the equation , where is the average brightness of the image voxels. The -test value [54] for constructed nonlinear hyperbolic regression curve is actually observed. The -test critical value [55] for false-rejection probability with degrees of freedom and is , where is the regression equation estimated parameters number and is the images number from Table 34. Since resulting regression equation is significant at false-rejection probability . Equation asymptote exceeds the corresponding theoretical calculations values.
4. Discussion
Experimental results, the main of which are presented in Table 31, Table 32 and Table 33, show that all values obtained as calculation results were not bigger than the values obtained as experimental results. This confirms the accuracy of theoretical analysis. Thus, the derived Formulas (6)–(9) could be used for determining the minimum bit-width of wavelet filters coefficients, at which the result of 3D medical tomographic images DWT reaches high ( dB for images with 8 BPC, dB for images with 12 BPC and dB for images with 16 BPC according to Formula (4) and maximum quality respectively. Table 13, Table 14, Table 15, Table 16, Table 17, Table 18, Table 19, Table 20, Table 21, Table 22, Table 23, Table 24, Table 25, Table 26, Table 27, Table 28, Table 29 and Table 30 show that values obtained as a calculation result were set to one when using 4 decimal places in simulating 8-, 12- and 16-bit images when the was approximately 45, 65 and 80 dB, respectively. Thus, both and metrics used confirm high-quality image processing. The experiment of 3D 8-bit medical tomographic image DWT required 1–2 bits less for wavelet filters coefficients than the calculations require for high-quality processing since the worst case was predicted in theoretical analysis. An even greater decrease in the bit-width of wavelet filter coefficients led to even greater savings in hardware resources. The difference between the obtained theoretical and experimental values increased significantly in the case of 12-bit and 16-bit images. The 12-bit tomographic image required 4–5 bits and 1–2 bits less for wavelet filters coefficients to achieve high and maximum processing quality respectively. This difference increased to 9–10 and 5–6 bits respectively in the case of a 16-bit image. This is because the range of voxel brightness values significantly increased in 12- and 16-bit images. The average brightness of the image voxels varied insignificantly at this time (was within the 8-bit range) since the high-order bits were rarely used. Thus, the ratio of the average voxel brightness to the maximum allowable value of decreased with increasing BPC of images, which were demonstrated by histograms in Figure 4. This led to much faster achievement of high and maximum quality compared with the theoretical analysis results.
The darkening and lighting in Figure 5, Figure 6 and Figure 7 were due to the low accuracy of wavelet filters coefficients quantization used for image processing. The excessive character of quantization error led to an increase in the voxels brightness values of the processed images. Figure 6b and Figure 7b turned out to be lighted since 12- and 16-bit images had a brightness margin, which is shown by the histograms in Figure 4b,c. However, the range of brightness values of the 8-bit image was fully utilized (Figure 4a) and the quantization error led to the computational range overflow. The voxels brightness values that exceeded the range went to zero as a result of this.
Table 34 and Figure 8 show the dependence of the 12-bit medical tomographic images processing quality of their average voxels brightness. This dependence had a nonlinear hyperbolic regression form. Equation asymptote exceeded the corresponding theoretical calculation values. The processing quality by metric (from 74.57 to 58.39) decreased with an increase in the average voxels brightness (from 16.89 to 187.42). The difference in the image processing quality with the minimum and maximum values of the average brightness according to Table 34 was more than 15 dB. It was commensurate with the difference in the processing quality of the same image by the same wavelet with filter coefficients bit-width that differ by two, according to Table 15, Table 21 and Table 27. That is, we would need 2 bits less for wavelet filter coefficients for high-quality processing of a 12-bit image with an average brightness of 16.89 than for processing a 12-bit image with an average brightness of 187.42. The average voxels brightness of the medical image can vary in different ranges depending on many factors: from the medical image modalities; from the analyzing device type; from specific device settings; from the analyzed organ or group of organs; etc. Thus, the requirements for the digit capacity of wavelet filter coefficients can be relaxed, depending on the ability to take into account many factors related to the nature of the images obtained as a result of medical tests. Summarizing, the quality of 3D medical tomographic images DWT primarily depends on their bits per color, on average voxels brightness, on the number of wavelet filters coefficients and to a lesser extent on the type of wavelet.
Minimum bit-width of wavelet filters coefficients for 3D medical tomographic images DWT is defined as follows: determine BPC of images (for example, 8, 12 or 16 BPC); select a quality threshold of image processing (for example, dB, dB, dB or ); choose the wavelet with the number of coefficients ; calculate bit-width of wavelet filters coefficients by Formulas (5)–(9) depending on the quality threshold of image processing selected.
5. Conclusions
The problem of analyzing the quantization noise effect in coefficients of DWT filters for 3D medical imaging was solved. The method was proposed for wavelet filters coefficients quantizing, which allows minimizing resources in hardware implementation. The method was developed for estimating the maximum error of 3D grayscale and color images DWT with various BPC. The derived Formula (5) allows determining the minimum quality of 3D medical images DWT depending on the wavelet used, bit-width of wavelet filters coefficients and BPC. We proved that Formulas (6)–(9) can be used to determine the minimum bit-width of wavelet filters coefficients for which the result of 3D images DWT reaches high ( dB for images with 8 BPC, dB for images with 12 BPC and dB for images with 16 BPC) and maximum quality respectively depending on the wavelet used. The experiments of the 3D tomographic images DWT showed that the bit-width of wavelet filters coefficients could be significantly reduced for high-quality medical imaging compared to theoretical analysis results. All data were presented in a fixed-point format and rounding operations were simplified in the proposed method of 3D images DWT.
The proposed DWT method could be used in a wide range of applications for denoising and compression of 3D medical images. Given the need to improve the efficiency of medical visual data processing methods, further research can be expected in this direction.
Author Contributions
Conceptualization, P.L.; Data curation, P.L.; Formal analysis, N.C.; Investigation, N.N. and P.L.; Methodology, N.C.; Project administration, N.C.; Resources, N.C.; Software, N.N.; Supervision, N.C.; Validation, N.C.; Visualization, N.N.; Writing—original draft, N.N. and P.L.; Writing, review & editing, N.N., P.L. and N.C. All authors have read and agreed to the published version of the manuscript.
Funding
This research was funded by the Russian Foundation for Basic Research (RFBR), grants numbers 19-07-00130 A and 18-37-20059 mol-a-ved, and the Council on grants of the President of the Russian Federation, grant number SP-2245.2018.5.
Acknowledgments
We are thankful to the Stavropol Regional Clinical Advisory and Diagnostic Center for providing tomographic images.
Conflicts of Interest
The authors declare no conflict of interest.
References
- Barnhill, E.; Hollis, L.; Sack, I.; Braun, J.; Hoskins, P.R.; Pankaj, P.; Brown, C.; van Beek, E.J.R.; Roberts, N. Nonlinear multiscale regularisation in MR elastography: Towards fine feature mapping. Med. Image Anal. 2017, 35, 133–145. [Google Scholar] [CrossRef]
- Benou, A.; Veksler, R.; Friedman, A.; Riklin Raviv, T. Ensemble of expert deep neural networks for spatio-temporal denoising of contrast-enhanced MRI sequences. Med. Image Anal. 2017, 42, 145–159. [Google Scholar] [CrossRef]
- Lai, Z.; Qu, X.; Liu, Y.; Guo, D.; Ye, J.; Zhan, Z.; Chen, Z. Image reconstruction of compressed sensing MRI using graph-based redundant wavelet transform. Med. Image Anal. 2016, 27, 93–104. [Google Scholar] [CrossRef]
- Lucas, L.F.R.; Rodrigues, N.M.M.; Da Silva Cruz, L.A.; De Faria, S.M.M. Lossless Compression of Medical Images Using 3-D Predictors. IEEE Trans. Med. Imaging 2017, 36, 2250–2260. [Google Scholar] [CrossRef]
- Manjón, J.V.; Coupé, P.; Buades, A. MRI noise estimation and denoising using non-local PCA. Med. Image Anal. 2015, 22, 35–47. [Google Scholar] [CrossRef]
- St-Jean, S.; Coupé, P.; Descoteaux, M. Non Local Spatial and Angular Matching: Enabling higher spatial resolution diffusion MRI datasets through adaptive denoising. Med. Image Anal. 2016, 32, 115–130. [Google Scholar] [CrossRef]
- Tashan, T.; Al-Azawi, M. Multilevel magnetic resonance imaging compression using compressive sensing. IET Image Process. 2018, 12, 2186–2191. [Google Scholar] [CrossRef]
- Thung, K.H.; Yap, P.T.; Adeli, E.; Lee, S.W.; Shen, D. Conversion and time-to-conversion predictions of mild cognitive impairment using low-rank affinity pursuit denoising and matrix completion. Med. Image Anal. 2018, 45, 68–82. [Google Scholar] [CrossRef]
- Chung, M.K.; Qiu, A.; Seo, S.; Vorperian, H.K. Unified heat kernel regression for diffusion, kernel smoothing and wavelets on manifolds and its application to mandible growth modeling in CT images. Med. Image Anal. 2015, 22, 63–76. [Google Scholar] [CrossRef]
- Irrera, P.; Bloch, I.; Delplanque, M. A flexible patch based approach for combined denoising and contrast enhancement of digital X-ray images. Med. Image Anal. 2016, 28, 33–45. [Google Scholar] [CrossRef]
- Schirrmacher, F.; Köhler, T.; Endres, J.; Lindenberger, T.; Husvogt, L.; Fujimoto, J.G.; Hornegger, J.; Dörfler, A.; Hoelter, P.; Maier, A.K. Temporal and volumetric denoising via quantile sparse image prior. Med. Image Anal. 2018, 48, 131–146. [Google Scholar] [CrossRef]
- Xu, Z.; Gao, M.; Papadakis, G.Z.; Luna, B.; Jain, S.; Mollura, D.J.; Bagci, U. Joint solution for PET image segmentation, denoising, and partial volume correction. Med. Image Anal. 2018, 46, 229–243. [Google Scholar] [CrossRef]
- Chen, Z.; Pazdernik, M.; Zhang, H.; Wahle, A.; Guo, Z.; Bedanova, H.; Kautzner, J.; Melenovsky, V.; Kovarnik, T.; Sonka, M. Quantitative 3D Analysis of Coronary Wall Morphology in Heart Transplant Patients: OCT-Assessed Cardiac Allograft Vasculopathy Progression. Med. Image Anal. 2018, 50, 95–105. [Google Scholar] [CrossRef]
- Fang, L.; Li, S.; Kang, X.; Izatt, J.A.; Farsiu, S. 3-D adaptive sparsity based image compression with applications to optical coherence tomography. IEEE Trans. Med. Imaging 2015, 34, 1306–1320. [Google Scholar] [CrossRef]
- Wu, H.; Huynh, T.T.; Souvenir, R. Echocardiogram enhancement using supervised manifold denoising. Med. Image Anal. 2015, 24, 41–51. [Google Scholar] [CrossRef]
- Su, H.; Qi, W.; Yang, C.; Aliverti, A.; Ferrigno, G.; De Momi, E. Deep neural network approach in human-like redundancy optimization for anthropomorphic manipulators. IEEE Access 2019, 7, 124207–124216. [Google Scholar] [CrossRef]
- Su, H.; Yang, C.; Mdeihly, H.; Rizzo, A.; Ferrigno, G.; De Momi, E. Neural network enhanced robot tool identification and calibration for bilateral teleoperation. IEEE Access 2019, 7, 122041–122051. [Google Scholar] [CrossRef]
- Zhang, C.; Liang, T.; Mok, P.K.T.; Yu, W. FPGA Implementation of the Coupled Filtering Method and the Affine Warping Method. IEEE Trans. Nanobioscience 2017, 16, 314–325. [Google Scholar] [CrossRef]
- Diagnostic Imaging FPGA Applications-Intel® FPGA. Available online: https://www.intel.com/content/www/us/en/healthcare-it/products/programmable/applications/diagnostic-imaging.html (accessed on 12 January 2020).
- Medical Imaging with CT, MRI and PET. Available online: https://www.xilinx.com/applications/medical/medical-imaging-ct-mri-pet.html#overview (accessed on 12 January 2020).
- Parikh, S.S.; Ruiz, D.; Kalva, H.; Fernandez-Escribano, G.; Adzic, V. High Bit-Depth Medical Image Compression with HEVC. IEEE J. Biomed. Health Inform. 2018, 22, 552–560. [Google Scholar] [CrossRef]
- Pichat, J.; Iglesias, J.E.; Yousry, T.; Ourselin, S.; Modat, M. A Survey of Methods for 3D Histology Reconstruction. Med. Image Anal. 2018, 46, 73–105. [Google Scholar] [CrossRef]
- Lahmiri, S. Comparative study of ECG signal denoising by wavelet thresholding in empirical and variational mode decomposition domains. Healthc. Technol. Lett. 2014, 1, 104–109. [Google Scholar] [CrossRef]
- Upadhyay, J.; Mishra, B.; Patel, P. Video Denoising and Quality Improvement Using New Thresholding Based Dwt & Dammw Algorithm. In Proceedings of the 2018 IEEE International Students’ Conference on Electrical, Electronics and Computer Science (SCEECS), Bhopal, India, 24–25 February 2018. [Google Scholar]
- Song, X.; Huang, Q.; Chang, S.; He, J.; Wang, H. Three-dimensional separate descendant-based SPIHT algorithm for fast compression of high-resolution medical image sequences. IET Image Process. 2016, 11, 80–87. [Google Scholar] [CrossRef]
- Naveen, C.; Gupta, T.V.S.; Satpute, V.R.; Gandhi, A.S. A simple and efficient approach for medical image security using chaos on EZW. In Proceedings of the 2015 Eighth International Conference on Advances in Pattern Recognition (ICAPR), Kolkata, India, 4–7 January 2015; pp. 1–6. [Google Scholar]
- Bailey, D.G. Design for Embedded Image Processing on FPGAs; John Wiley & Sons (Asia) Pte Ltd.: Singapore, 2011; ISBN 9780470828519. [Google Scholar]
- Meyer-Baese, U. Digital Signal Processing with Field Programmable Gate Arrays. In Signals and Communication Technology; Springer: Berlin/Heidelberg, Germany, 2007; ISBN 3-540-413413-3. [Google Scholar]
- Madanayake, A.; Cintra, R.J.; Dimitrov, V.; Bayer, F.M.; Wahid, K.A.; Kulasekera, S.; Edirisuriya, A.; Potluri, U.S.; Madishetty, S.K.; Rajapaksha, N. Low-power VLSI architectures for DCT/DWT: Precision vs approximation for HD video, biomedical, and smart antenna applications. IEEE Circuits Syst. Mag. 2015, 15, 25–47. [Google Scholar] [CrossRef]
- Jiang, R.M.; Crookes, D. FPGA Implementation of 3D Discrete Wavelet Transform for Real-Time Medical Imaging. In Proceedings of the 2007 18th European Conference on Circuit Theory and Design, Seville, Spain, 27–30 August 2007; pp. 519–522. [Google Scholar]
- Ahmad, A.; Krill, B.; Amira, A.; Rabah, H. 3D Haar wavelet transform with dynamic partial reconfiguration for 3D medical image compression. In Proceedings of the 2009 IEEE Biomedical Circuits and Systems Conference, Beijing, China, 26–28 November 2009; pp. 137–140. [Google Scholar]
- Arafa, A.A.; Saleh, H.I.; Ashour, M.; Salem, A. FFT- and DWT-Based FPGA realization of pulse shape discrimination in PET system. In Proceedings of the 2009 4th IEEE International Conference on Design and Technology of Integrated Systems in Nanoscale Era, Cairo, Egypt, 6–9 April 2009; pp. 299–302. [Google Scholar]
- Ballesteros Larrotta, D.M.; Moreno Enciso, D.M.; Gaona Barrera, A.E. Compression of biomedical Signals on FPGA by DWT and run-length. In Proceedings of the 2010 IEEE ANDESCON, Bogota, Colombia, 15–17 September 2010; pp. 1–5. [Google Scholar]
- Ahmad, A.; Amira, A.; Guarisco, M.; Rabah, H.; Berviller, Y. Efficient implementation of a 3-D medical imaging compression system using CAVLC. In Proceedings of the 2010 IEEE International Conference on Image Processing, Hong Kong, China, 26–29 September 2010; pp. 3773–3776. [Google Scholar]
- Ja’Afar, N.H.; Ahmad, A.; Amira, A. Rapid prototyping of three-dimensional transform for medical image compression. In Proceedings of the 2012 11th International Conference on Information Science, Signal Processing and their Applications (ISSPA), Montreal, QC, Canada, 2–5 July 2012; pp. 842–847. [Google Scholar]
- Li, N.Q.; Nie, Y.J.; Zhu, W. The application of FPGA-based discrete wavelet transform system in EEG analysis. In Proceedings of the 2012 International Conference on Intelligent Systems Design and Engineering Applications (ISDEA), Sanya, China, 6–7 January 2012; pp. 1306–1309. [Google Scholar]
- Ahmad, A.; Ja’afar, N.H.; Amira, A. FPGA-based implementation of 3-D Daubechies for medical image compression. In Proceedings of the 2012 IEEE-EMBS Conference on Biomedical Engineering and Sciences, Langkawi, Malaysia, 17–19 December 2012; pp. 683–688. [Google Scholar]
- Ja’Afar, N.H.; Ahmad, A.; Amira, A. Distributed arithmetic architecture of Discrete Wavelet Transform (DWT) with hybrid method. In Proceedings of the IEEE International Conference on Electronics, Circuits, and Systems, Abu Dhabi, United Arab Emirates, 8–11 December 2013; pp. 501–507. [Google Scholar]
- El Hassan, E.M.; Karim, M. An FPGA-based implementation of a pre-processing stage for ECG signal analysis using DWT. In Proceedings of the 2014 Second World Conference on Complex Systems (WCCS), Agadir, Morocco, 10–12 November 2014; pp. 649–654. [Google Scholar]
- Vijendra, V.; Kulkarni, M. ECG signal filtering using DWT haar wavelets coefficient techniques. In Proceedings of the 2016 International Conference on Emerging Trends in Engineering, Technology and Science (ICETETS), Pudukkottai, India, 24–26 February 2016; pp. 1–6. [Google Scholar]
- Elsayed, M.; Badawy, A.; Mahmuddin, M.; Elfouly, T.; Mohamed, A.; Abualsaud, K. FPGA implementation of DWT EEG data compression for wireless body sensor networks. In Proceedings of the 2016 IEEE Conference on Wireless Sensors (ICWiSE), Langkawi, Malaysia, 10–12 October 2016; pp. 21–25. [Google Scholar]
- Sharmila, A.; Geethanjali, P. DWT Based Detection of Epileptic Seizure From EEG Signals Using Naive Bayes and k-NN Classifiers. IEEE Access 2016, 4, 7716–7727. [Google Scholar] [CrossRef]
- Chervyakov, N.; Lyakhov, P.; Kaplun, D.; Butusov, D.; Nagornov, N. Analysis of the quantization noise in discrete wavelet transform filters for image processing. Electronics 2018, 7, 135. [Google Scholar] [CrossRef]
- Kim, J.; Lee, J.; Lee, S.; Lee, M. Development of 3-D stereo endoscopic PACS viewer. In Proceedings of the ISIE 2001. 2001 IEEE International Symposium on Industrial Electronics Proceedings (Cat. No.01TH8570), Pusan, Korea, 12–16 June 2001; Volume 1, pp. 278–280. [Google Scholar]
- Lalithakumari, S.; Pandian, R.; Rani, J.; Vinothkumar, D.; Sneha, A.; Joe, B. Selection of optimum compression algorithms based on the characterization on feasibility for medical image. Biomed. Res. 2017, 28, 5633–5637. [Google Scholar]
- Daubechies, I. Ten Lectures on Wavelets; Society for Industrial and Applied Mathematics: Philadelphia, PA, USA, 1992; ISBN 978-0-89871-274-2. [Google Scholar]
- Bustin, A.; Voilliot, D.; Menini, A.; Felblinger, J.; de Chillou, C.; Burschka, D.; Bonnemains, L.; Odille, F. Isotropic Reconstruction of MR Images Using 3D Patch-Based Self-Similarity Learning. IEEE Trans. Med. Imaging 2018, 37, 1932–1942. [Google Scholar] [CrossRef]
- Vaidyanathan, P.P. Multirate Systems and Filter Banks; Prentice Hall: Upper Saddle River, NJ, USA, 1993; ISBN 0136057187. [Google Scholar]
- Rao, K.R.; Yip, P.C. The Transform and Data Compression Handbook; CRC Press: Boca Raton, FL, USA, 2001; ISBN 9780849336928. [Google Scholar]
- Ravichandran, D.; Ahamad, M.G.; Dhivakar, M.R.A. Performance analysis of three-dimensional medical image compression based on discrete wavelet transform. In Proceedings of the 2016 22nd International Conference on Virtual System & Multimedia (VSMM), Kuala Lumpur, Malaysia, 17–21 October 2016; pp. 1–8. [Google Scholar]
- Basso, A.; Cavagnino, D.; Pomponiu, V.; Vernone, A. Blind Watermarking of Color Images Using Karhunen-Loeve Transform Keying. Comput. J. 2011, 54, 1076–1090. [Google Scholar] [CrossRef]
- Wang, Z.; Bovik, A.C.; Sheikh, H.R.; Simoncelli, E.P. Image quality assessment: From error visibility to structural similarity. IEEE Trans. Image Process. 2004, 13, 600–612. [Google Scholar] [CrossRef]
- Seber, G.A.F.; Wild, C.J. Nonlinear Regression. In Wiley Series in Probability and Statistics; John Wiley & Sons, Inc.: Hoboken, NJ, USA, 1989; ISBN 9780471725312. [Google Scholar]
- Maddala, G.S.; Lahiri, K. Introduction to Econometrics; Wiley: Hoboken, NJ, USA, 2009; ISBN 0470015128. [Google Scholar]
- F-Distribution Tables. Available online: http://socr.ucla.edu/Applets.dir/F_Table.html#FTable0.001 (accessed on 12 January 2020).


© 2020 by the authors. Licensee MDPI, Basel, Switzerland. This article is an open access article distributed under the terms and conditions of the Creative Commons Attribution (CC BY) license (http://creativecommons.org/licenses/by/4.0/).