Article

An Evaluation of the Zeeman Shift of the 87Sr Optical Lattice Clock at the National Time Service Center

1
Key Laboratory of Time and Frequency Primary Standards, National Time Service Center, Chinese Academy of Sciences, Xi’an 710600, China
2
School of Astronomy and Space Science, University of Chinese Academy of Sciences, Beijing 100049, China
*
Author to whom correspondence should be addressed.
Appl. Sci. 2020, 10(4), 1440; https://doi.org/10.3390/app10041440
Submission received: 16 January 2020 / Revised: 14 February 2020 / Accepted: 16 February 2020 / Published: 20 February 2020
(This article belongs to the Special Issue Optical Trapping)

Abstract

:
The Zeeman shift plays an important role in the evaluation of optical lattice clocks since a strong bias magnetic field is applied for departing Zeeman sublevels and defining a quantization axis. We demonstrated the frequency correction and uncertainty evaluation due to Zeeman shift in the 87Sr optical lattice clock at the National Time Service Center. The first-order Zeeman shift was almost completely removed by stabilizing the clock laser to the average frequency of the two Zeeman components of mF = ±9/2. The residual first-order Zeeman shift arose from the magnetic field drift between measurements of the two stretched-state center frequencies; the upper bound was inferred as 4(5) × 10−18. The quadratic Zeeman shift coefficient was experimentally determined as –23.0(4) MHz/T2 and the final Zeeman shift was evaluated as 9.20(7) × 10−17. The evaluation of the Zeeman shift is a foundation for overall evaluation of the uncertainty of an optical lattice clock. This measurement can provide more references for the determination of the quadratic coefficient of 87Sr.

1. Introduction

As requirements for high accuracy and stability frequency standards increase, optical lattice clocks based on neutral atoms with clock transition frequencies in the optical domain have been proposed [1]. After decades of hard work, these kinds of clocks have exhibited excellent performance in terms of stability and certainty [2,3] and can be applied to not only quantum frequency standards [4,5], but also many cutting-edge sciences [6,7,8,9].
The absolute frequency of clock transition is susceptible to the ambient environment around atoms. In addition to the Doppler effect and the vibration of experimental setups, the disturbing factors mainly come from three aspects: the electromagnetic field, such as the Stark frequency shift [10,11,12] and the Zeeman shift [13]; collisions, such as the frequency shift caused by collision between cold atoms [14] or collision between cold atoms and background gas [15]; and the influence of the gravitational field, such as gravitational frequency shift [16]. In terms of a one-dimensional optical lattice clock, the Zeeman shift is generally much smaller than the Stark frequency shift and the gravitational frequency shift, and is on the same order of the collision frequency shift. We need to carefully measure and correct these frequency shifts before we use a clock to generate the time standard signal.
For the 87Sr optical lattice clock, the Zeeman shift is rooted in the interaction between the hyperfine energy levels, which results in a difference of the Landé g-factors [13] between the ground state 1S0 and the excited state 3P0. This brings an inconsistent Zeeman shift between the ground and excited state in the same magnetic field, which finally causes the clock transition frequency to be different compared with the case of no magnetic field. The first-order Zeeman shift, which is proportional to the magnetic field intensity, could almost be cancelled by the stabilizing the clock laser to the average frequency [17] of mF = +9/2 → mF =+ 9/2 and mF = −9/2→mF = −9/2. A residual first-order Zeeman shift could occur if the background magnetic field has a net drift while determining the center frequency of the two stretched states [18]. By contrast, the quadratic Zeeman shift is proportional to the square of the magnetic field, and there is no effective method to eliminate it. The quadratic Zeeman shift is also related to the type of atoms and the energy level of the clock transition. Relevant calculations show that under the same magnetic field, the quadratic Zeeman shift of an 87Sr optical lattice clock is 108 times smaller than that of a cesium clock [19], and is more than one order of magnitude smaller than Hg+ [20], Sr+ [21], and Yb+ [22] optical clocks. Three groups have experimentally measured the quadratic Zeeman shift coefficient: JILA (Joint Laboratory for Astrophysics) [23,24,25], LNE-SYRTE (Observatoire de Paris) [26], and PTB (Physikalisch-Technische Bundesanstalt) [27]. However, repeated measurement of the quadratic Zeeman shift coefficient of 87Sr atoms is critical for precisely determining its value and depressing its statistical uncertainty.
In this study, the quadratic Zeeman shift coefficient of the 87Sr optical lattice clock was measured experimentally, and the frequency correction and uncertainty caused by the Zeeman shift of the optical lattice clock were evaluated.

2. Preparation for the 87Sr Optical Lattice Clock

2.1. Experimental Setup

The experimental setup for the preparation of cold atoms and detecting the clock transition of the 87Sr optical lattice clock is shown in Figure 1. For cooling atoms to several microkelvin, two-stages of cooling were conducted. In the first stage of cooling, the blue magnetic optical trap (MOT) formed by three pairs of counterpropagating laser beams at λ = 461 nm was used to obtain about 107 atoms with a temperature of 5 mK. In the second cooling stage, the red MOT at λ = 689 nm was carried and about 106 atoms with a temperature of 3.9 μK were then trapped [28]. The lattice laser operated at the wavelength of 813.42 nm, the “magic wavelength”, and the one-way optical power was 280 mW. The incident lattice laser beam, along the horizontal direction, was focused on the center of the MOT by a convex lens (CL) with a focus of 300 mm and a Glan–Taylor polarizer (GP) was used to make its polarization linear. The retroreflected beam superposed with the incident beam to form a one-dimensional lattice by using a concave mirror (CM) with a radius of 250 mm. The beam waist of the lattice laser was 100 μm and the lifetime of the trapped atoms was more than 7 s. The clock laser, corresponding to the transition of 5s2 1S0→5s5p 3P0 at λ = 698 nm, was generated by an extended-cavity diode laser. To suppress frequency noise, the clock laser was locked to an ultralow expansion (ULE) cavity with a finesse of 200,000 using the technology of PDH (Pound–Drever–Hall) stabilization; eventually, the linewidth of the clock laser was about 1 Hz [29]. The clock laser was collimated by CL and CM with a beam waist of 2 mm at the center of the MOT and overlapped with the lattice laser beam. The polarization of the clock laser was also linear and parallel to the lattice laser.

2.2. The Clock Transition Spectra of 87Sr

To obtain the clock transition spectra, the clock laser frequency was changed stepwise by an acousto-optic modulator (AOM) to interrogate the resonant frequency of the clock transition. In order to obtain the resolved sideband spectrum as shown in Figure 2a, the power of the clock laser was about 1 mW and the frequency of the clock laser was scanned around the center frequency of the carrier transition in a range of −70 to +70 kHz with steps of 0.5 kHz. The frequency gap between the carrier and red sideband (the blue sideband) could be approximately viewed as the longitudinal trapping frequency of the lattice. It could be calculated from Figure 2a that the longitudinal trapping frequency was 65 kHz, and the corresponding potential depth was about 87 ER calculated by longitudinal trapping frequency. Therein, ER = (h/λL)2/2m is the recoil energy, h is the Planck constant, λL is the wavelength of lattice laser, and m is the atomic mass of 87Sr. With the method in reference [30], the longitudinal and radical temperatures of trapped atoms were 2.9 μK and 3.4 μK respectively.
In order to pump all atoms to Zeeman sublevels of mF = +9/2 or mF = −9/2, a polarizing laser with a linewidth of 300 Hz was employed. Its frequency was resonant with the 1S0 (F = 9/2)→3P1 (F = 9/2) transition at λ = 689 nm. During the process of pumping atoms to mF = ±9/2, a group of three-dimensional compensating coils were turned on to remove the horizontal magnetic field and simultaneously supply a weak bias magnetic field of about 50 mG in the direction of gravity. Meanwhile, the polarizing laser was turned on along the direction of gravity. A liquid crystal waveplate was applied to control the polarization of the polarizing laser, so that its polarization was σ+ as driving atoms to the stretched-state mF = +9/2 and σ- as driving atoms to mF = −9/2. The power and pulse duration of the polarizing laser were 200 μW and 15 ms respectively, and about 95% atoms were driven to the stretched-state, completing spin polarization. During the process of detecting spin-polarized spectra, the horizontal magnetic field was maintained at zero and the magnetic field in the direction of gravity was about 400 mG to separate different Zeeman sublevels. The typical spin-polarized spectrum is shown in Figure 2b with a clock laser duration of 150 ms and power of 200 nW, and the full width at half maximum (FWHM) of the two Zeeman sublevels transition were 6.8 Hz (mF = −9/2) and 6.2 Hz (mF = +9/2) by Lorentz fitting.

3. The Second-Order Zeeman Coefficient Measurement and Zeeman Shift Evaluation

3.1. The Experimental Scheme for Measuring the Quadratic Zeeman Coefficient

While measuring the quadratic Zeeman shift due to modulating the magnetic field, the lock-in data must be free of the first-order Zeeman shift. This was realized by using four servos, as shown in Figure 3. The red solid curve represents the spin-polarized spectra shown in Figure 2b when the bias magnetic field strength was strong (denoted by BH) and the blue solid curve with narrower frequency gap corresponds to the case that the bias magnetic field strength was low (denoted by BL).
The duration of each clock feedback cycle, which included equal eight clock cycles, was 8 s. We controlled the bias magnetic field at low strength (BL) during clock cycles 1–4, and at stronger intensity (BH) during clock cycles 5–8. The FWHM of the left spin-polarized peak (mF = –9/2) was 2δ1, and the right (mF = +9/2) was 2δ2. In clock cycles 1 and 2, the clock laser frequencies were vL1-δ1 and vL1+δ1 respectively. After clock transition detection, the corresponding excitations were e1 and e2 respectively and the error signal err1 = e1-e2 could be calculated. The feedback signal was Δf1 = err1 × servo1 and the new frequency v’L1 was obtained by directly adding the Δf1 to the input frequency vL1. In principle, v’L1 was closer to the clock transition than v L1 and so v’L1 replaced vL1 in the next clock feedback cycle. In clock cycles 3 and 4, the frequencies of the clock laser were vR1δ2 and vR1+δ2, and the new frequency v’R1 = Δf2+vR1 was obtained after the clock transition detection and feedback computation by the servo2 system. The locking processes of clock cycles 5–6 and 7–8 were similar to the 1–2 and 3–4 clock cycles, respectively, while the bias magnetic field was BH. We were able to calculate the average frequency vL0 = (v’L1 + v’R1)/2 and vH0 = (v’L2 + v’R2)/2 after every eight clock cycles, and their difference ΔvB = vL0vH0 was the quadratic Zeeman shift. In order to ensure measurement accuracy, the lock-in data were increased until their Allan deviation was below 1 × 10⁻¹⁶.
In this measurement, the value of BL was fixed at 0.1 G and we changed the BH in the range from 0.1 G to 1.55 G. We defined the effective magnetic field intensity Beff =   B H 2 B L 2 which indicated that the value of quadratic Zeeman shift was zero when Beff = 0. Thus, according to the relationship between Beff and the quadratic Zeeman shift, the quadratic Zeeman shift coefficient could be extracted by parabola fitting.
Although the clock laser frequency was stabilized to a ULE cavity by the PDH stabilization, the effective cavity length changed slowly as the cavity aged and the temperature drifted, resulting in frequency drift of the clock laser [31]. This drift would introduce unwanted measurement error in the quadratic Zeeman shift measurement, so it was necessary to compensate for the frequency drift of the clock laser. According to reference [32], a servo feedback system was built which calculated the slope of the drift every 80 s using the feedback signal of Δf1, and then a direct digital synthesizer (DDS) was used to scan the clock laser frequency at the reversed slope. If the direction was different between the clock laser polarization and bias field, lattice tensor shift would occur, deteriorating our measurements [26]. As σ transition would appear as the clock laser polarization misaligned with the bias field direction, we were able to adjust the direction of the bias magnetic field to be parallel to the polarization direction of the lattice laser before starting the experiment.

3.2. The Experimental Results and Zeeman Shift Evaluation

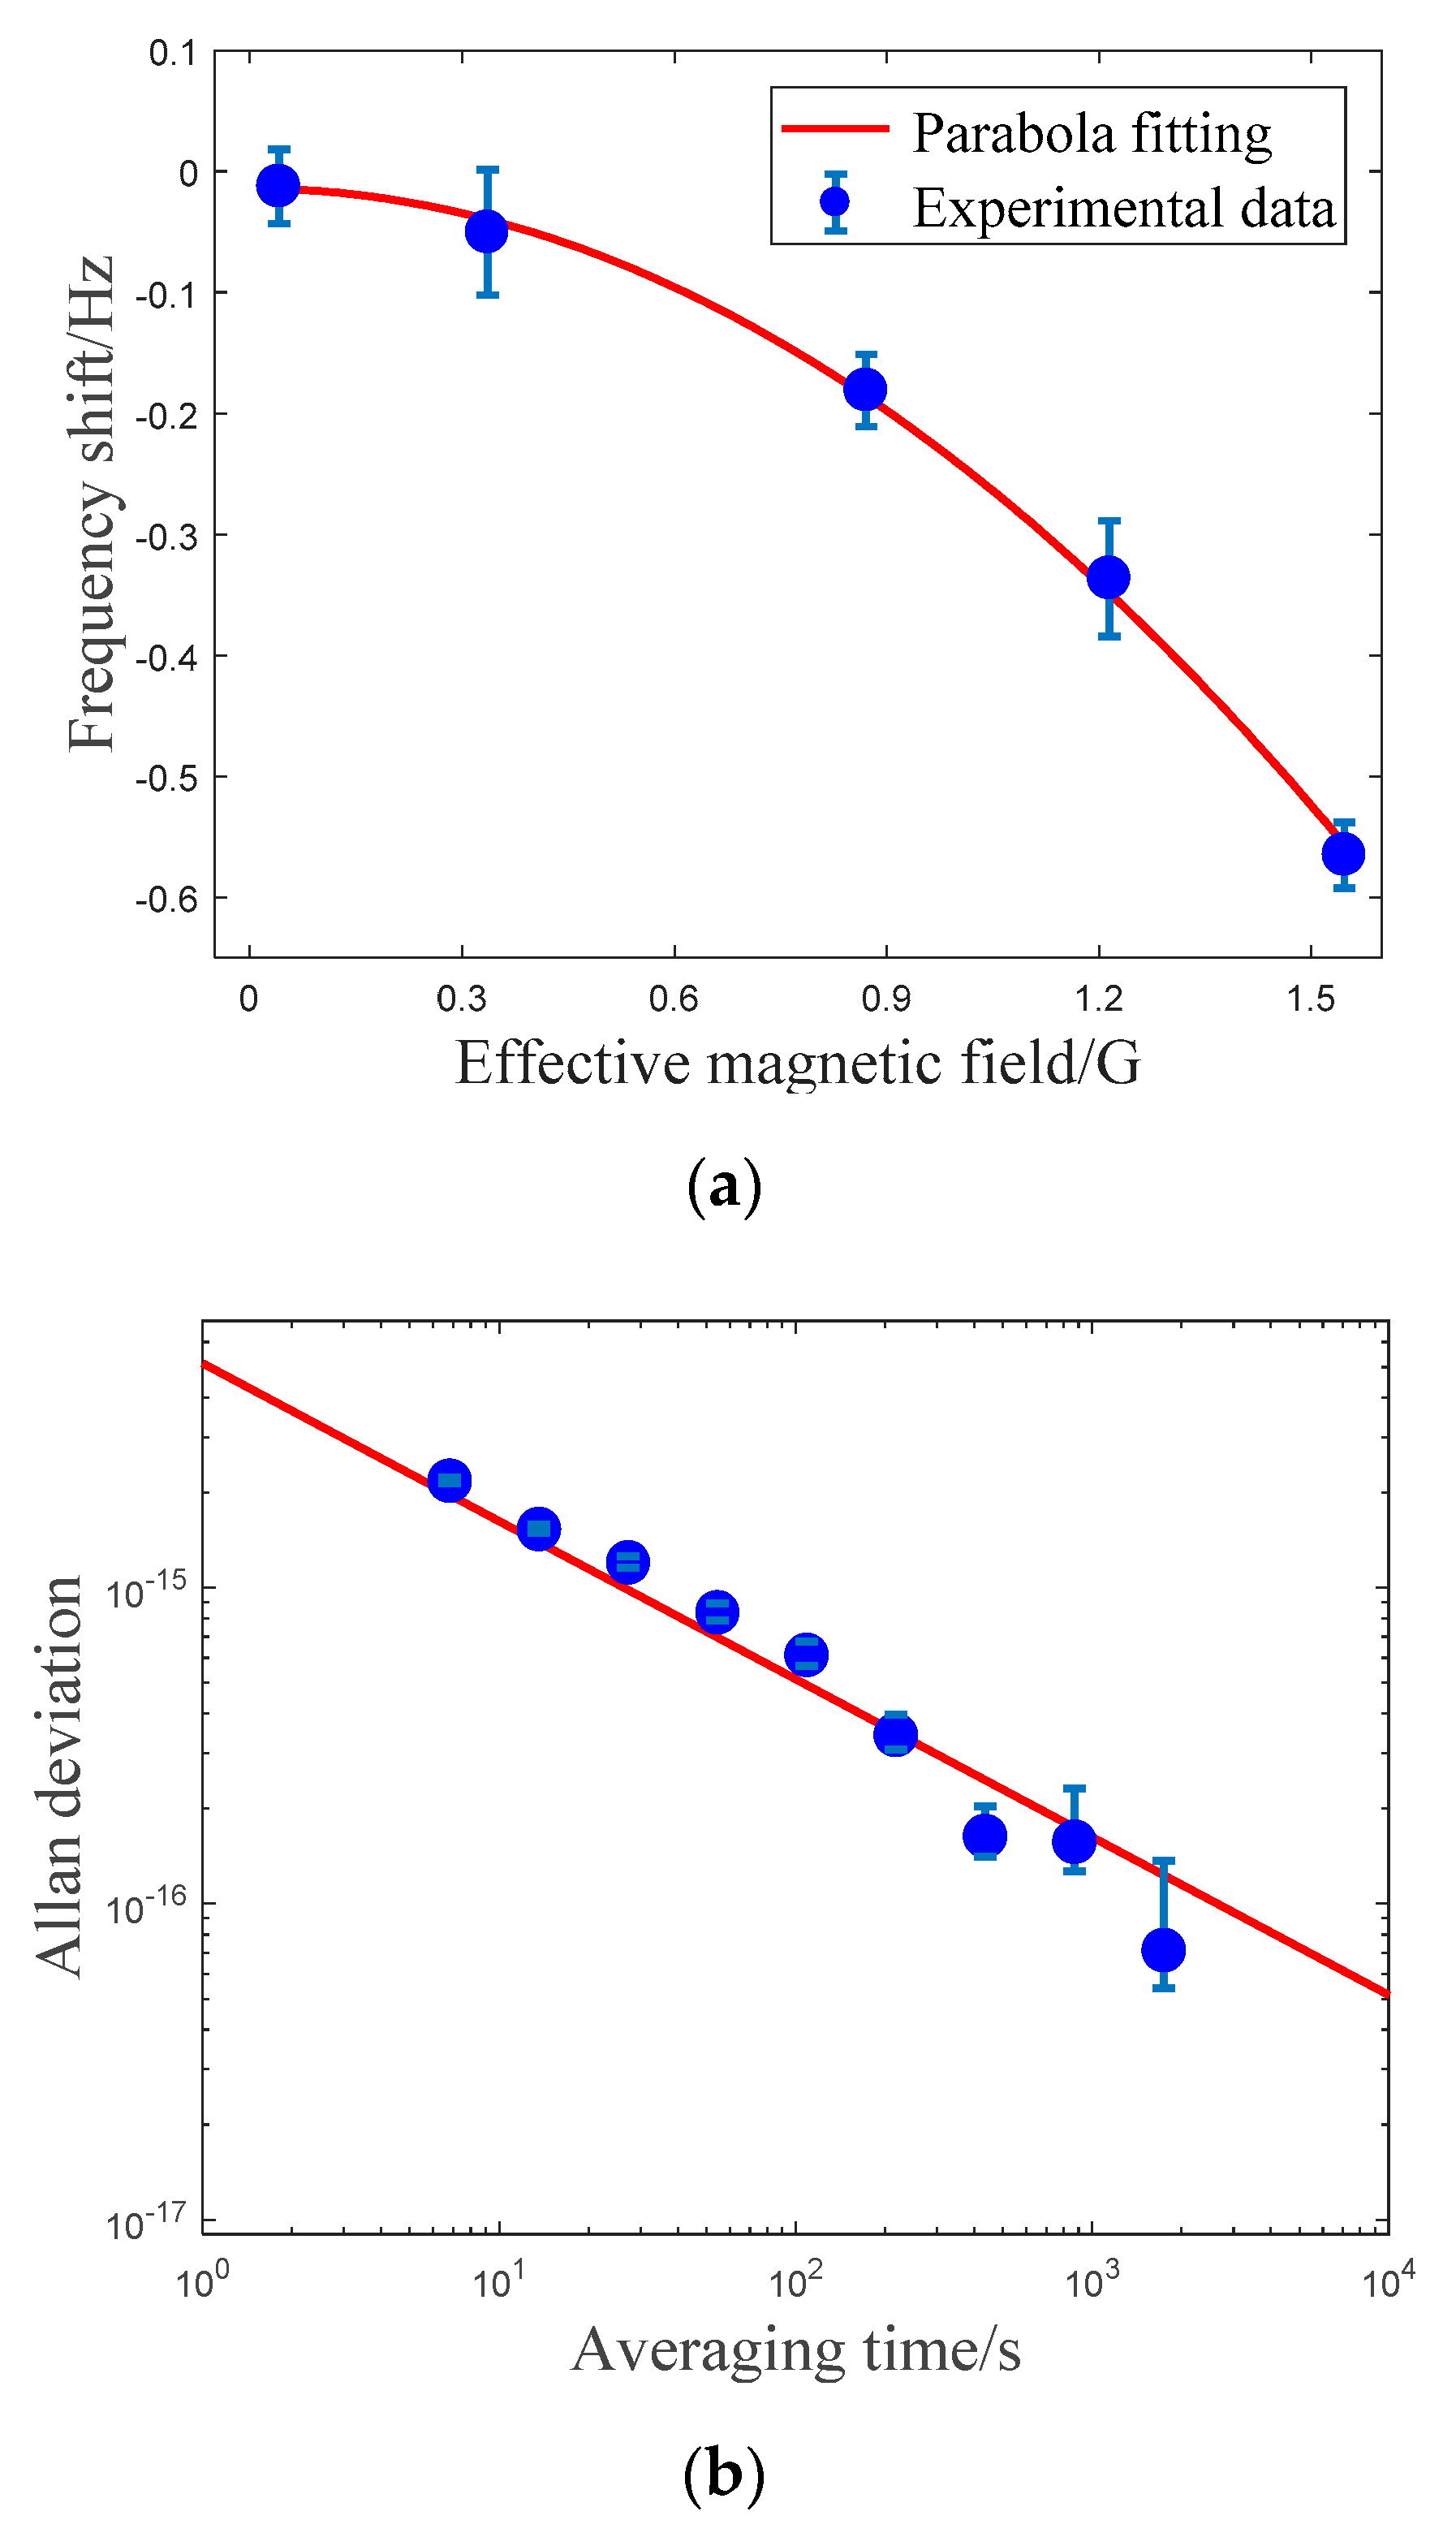
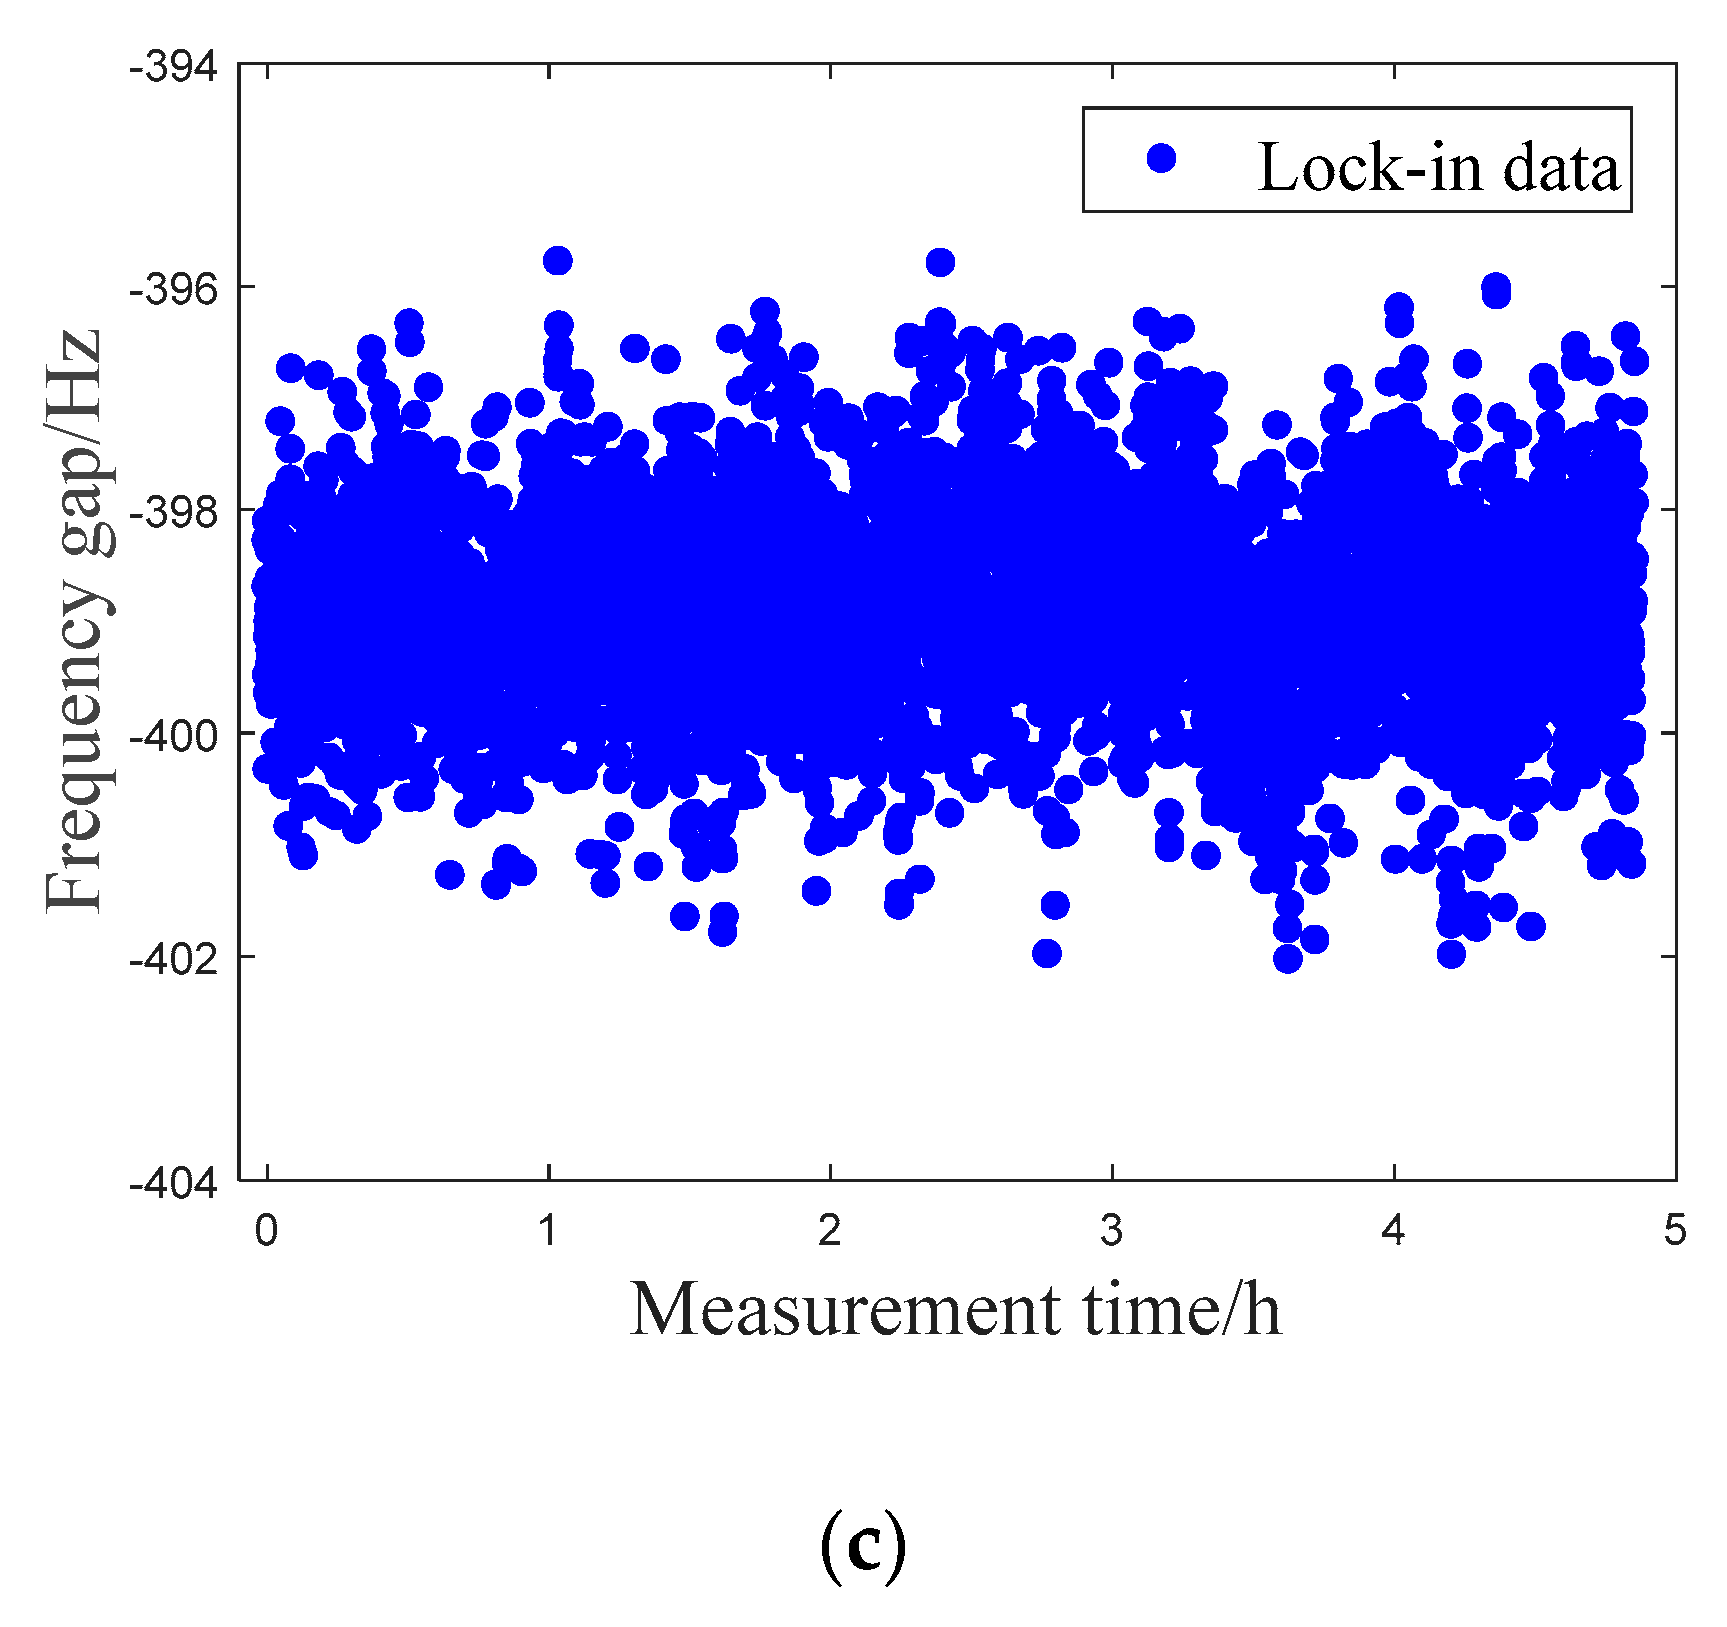
The quadratic Zeeman shift was measured at different Beff and the result is shown in Figure 4a. The blue dots are the experimental data, where the errors indicate purely statistical 1σ deviation of each datum, and the red solid line is the parabola fitting with the fitting function of ax2+b. The quadratic Zeeman shift coefficient (corresponding to the parameter a) was –23.0(4) MHz/T2, consistent with other groups [23,24,25,26,27]. A typical Allan deviation calculated by the data of ΔvB is shown in Figure 4b. The Allan deviation reached 7 × 10⁻¹⁷ after 1800 s averaging time. While routinely operating the 87Sr optical lattice clock, the frequency gap between spin-polarized peaks of mF = −9/2 and mF = +9/2 could be obtained by the lock-in data as is shown in Figure 4c. The average frequency gap was 399(1) Hz, and the corresponding bias magnetic field intensity [13] was 409(1) mG. Combining this measurement and other measurements of the quadratic Zeeman shift coefficient of 87Sr in references [23,24,25,26,27], the weighted average was –(23.47 ± 0.12) MHz/T2. The final quadratic Zeeman shift was 9.20(7) × 10−17 using the weighted average coefficient when our clock routinely operated. The uncertainty was introduced by the uncertainty of the magnetic field and coefficient with equal value of 5 × 10⁻¹⁹.
The short-term drift of the magnetic field was unavoidable in one feedback clock cycle, which may have caused extra error—that is, the residual first-order Zeeman shift. According to the method described in the reference [18], the upper bound of the residual first-order Zeeman shift could be inferred by the full lock-in data of stretched-states frequency gap, as shown in Figure 4c. The upper limit of the residual first-order Zeeman shift was 4(5) × 10−18 and the uncertainty was 1σ statistical uncertainty that mainly came from the fluctuation of lock-in data. The magnetic field had no obvious drift because the residual first-order Zeeman shift was zero under its 1σ measurement uncertainty.

4. Conclusions

We measured the quadratic Zeeman shift coefficient of a 87Sr optical lattice clock at –23.0(4) MHz/T2 and evaluated the Zeeman shift of the system. The residual first-order and quadratic Zeeman shift was 4(5) × 10−18 and the quadratic Zeeman shift was 9.20(7) × 10−17 as obtained by performing a weight average of all measurements of the quadratic Zeeman shift coefficient at –(23.47 ± 0.12) MHz/T2. To further reduce the Zeeman shift coefficient, more experimental data is required. The background magnetic field compensation system should be designed to repress the magnetic field drift and so reduce the first-order Zeeman shift. In order to decrease the frequency uncertainty of the quadratic Zeeman shift, a small bias magnetic field is useful. If it is reduced to 0.2 G, the uncertainty caused by the quadratic Zeeman shift coefficient could be as small as 1 × 10⁻¹⁹.

Author Contributions

Software, X.L., M.Y.; Formal Analysis, T.L., Y.W.; Data Curation, T.L., M.Y.; Writing—Original Draft Preparation, X.L., H.C. All authors have read and agreed to the published version of the manuscript.

Funding

This research is supported by the National Natural Science Foundation of China (Grant Nos. 61775220), the National Key R&D Program of China (Grant No. 2016YFF0200201), the Key Research Project of Frontier Science of the Chinese Academy of Sciences (Grant No. QYZDB-SSW-JSC004), the Strategic Priority Research Program of the Chinese Academy of Sciences (Grant No. XDB21030100), and the Youth innovation promotion Association the Chinese Academy of Sciences (Grant No. 2019400).

Acknowledgments

We would like to thank Longsheng Ma, Baolong Lyu, Lingxiang He, and Yige Lin for their helpful discussions.

Conflicts of Interest

The authors declare no conflicts of interest. The funders had no role in the design of the study; in the collection, analyses, or interpretation of data; in the writing of the manuscript; or in the decision to publish the results.

References

  1. Takamoto, M.; Hong, F.L.; Higashi, R.; Katori, H. An optical lattice clock. Nature 2005, 435, 321–324. [Google Scholar] [CrossRef]
  2. Oelker, E.; Hutson, R.B.; Kennedy, C.J.; Sonderhouse, L.; Bothwell1, T.; Goban, A.; Kedar, D.; Sanner, C.; Robinson, J.M.; Marti, G.E.; et al. Demonstration of 4.8 × 10⁻¹⁷ stability at 1 s for two independent optical clocks. Nat. Photon. 2019, 13, 714–719. [Google Scholar] [CrossRef] [Green Version]
  3. McGrew, W.F.; Zhang, X.; Fasano, R.J.; Schäffer, S.; Beloy, A.K.; Nicolodi, D.; Brown, R.C.; Hinkley, N.; Milani, G.; Schioppo, M.; et al. Atomic clock performance enabling geodesy below the centimetre level. Nature 2018, 564, 87–90. [Google Scholar] [CrossRef] [PubMed] [Green Version]
  4. Grebing, C.; Al-Masoudi, A.; Dörscher, S.; Häfner, S.; Gerginov, V.; Weyers, S.; Lipphardt, B.; Riehle, F.; Serr, U.; Lisdat, C. Realization of a timescale with an accurate optical lattice clock. Optica 2016, 6, 563–569. [Google Scholar] [CrossRef]
  5. Riehle, F. Towards a redefinition of the second based on optical atomic clocks. C.R. Phys. 2015, 16, 506–515. [Google Scholar] [CrossRef] [Green Version]
  6. Kolkowitz, S.; Pikovski, I.; Langellier, N.; Lukin, M.D.; Walsworth, R.L.; Ye, J. Gravitational wave detection with optical lattice atomic clocks. Phys. Rev. D 2016, 94, 124043. [Google Scholar] [CrossRef] [Green Version]
  7. Derevianko, A.; Pospelov, M. Hunting for topological dark matter with atomic clocks. Nat. Phys. 2014, 10, 933–936. [Google Scholar] [CrossRef] [Green Version]
  8. Takano, T.; Takamoto, M.; Ushijima, I.; Ohmae, N.; Akatsuka, T.; Yamaguchi, A.; Kuroishi, Y.; Munekane, H.; Miyahara, B.; Katori, H. Geopotential measurements with synchronously linked optical lattice clocks. Nat. Photon. 2016, 10, 662–666. [Google Scholar] [CrossRef]
  9. Delva, P.; Lodewyck, J.; Bilickiet, S.; Bookjans, E.; Vallet, G.; Targat, R.L.; Pottie, P.-E.; Guerlin, C.; Meynadier, F.; Poncin-Lafitte, C.L.; et al. Test of Special Relativity Using a Fiber Network of Optical Clocks. Phys. Rev. Lett. 2017, 118, 221102. [Google Scholar] [CrossRef] [Green Version]
  10. Safronova, M.S.; Kozlov, M.G.; Clark, C.W. Blackbody radiation shifts in optical atomic clocks. IEEE Trans. Ultrason. Ferroelectr. Freq. Control 2012, 59, 439–447. [Google Scholar] [CrossRef]
  11. Lodewyck, J.; Zawada, M.; Lorini, L.; Gurov, M.; Lemonde, P. Observation and cancellation of a perturbing dc stark shift in strontium optical lattice clocks. IEEE Trans. Ultrason. Ferroelectr. Freq. Control 2012, 59, 411–415. [Google Scholar] [CrossRef] [PubMed] [Green Version]
  12. Ido, T.; Katori, H. Recoil-free spectroscopy of neutral Sr atoms in the Lamb-Dicke regime. Phys. Rev. Lett. 2003, 91, 053001. [Google Scholar] [CrossRef] [PubMed] [Green Version]
  13. Boyd, M.M.; Zelevinsky, T.; Ludlow, A.D.; Blatt, S.; Zanon-Willette, T.; Foreman, S.M.; Ye, J. Nuclear spin effects in optical lattice clocks. Phys. Rev. A 2007, 76, 022510. [Google Scholar] [CrossRef] [Green Version]
  14. Lemke, N.D.; von Stecher, J.; Sherman, J.A.; Rey, A.M.; Oates, C.W.; Ludlow, A.D. p-Wave Cold Collisions in an Optical Lattice Clock. Phys. Rev. Lett. 2011, 107, 103902. [Google Scholar] [CrossRef] [PubMed] [Green Version]
  15. Gibble, K. Scattering of cold atom coherences by hot atoms: Frequency shifts from background gas collisions. Phys. Rev. Lett. 2013, 110, 180802. [Google Scholar] [CrossRef] [PubMed]
  16. Chou, C.W.; Hume, D.B.; Rosenband, T.; Wineland, D.J. Optical Clocks and Relativity. Science 2010, 329, 1630–1633. [Google Scholar] [CrossRef] [Green Version]
  17. Campbell, G.K.; Ludlow, A.D.; Blatt, S.; Thomsen, J.W.; Martin, M.J.; de Miranda, M.H.G.; Zelevinsky, T.; Boyd, M.M.; Ye, J.; Diddams, S.A.; et al. The absolute frequency of the 87Sr optical clock transition. Metrologia 2008, 45, 539–548. [Google Scholar] [CrossRef] [Green Version]
  18. Nicholson, T.L. A New Record in Atomic Clock Performance. Ph.D. Thesis, University of Colorado, Boulder, CO, USA, May 2015. [Google Scholar]
  19. Heavner, T.P.; Jefferts, S.R.; Donley, E.A.; Shirley, J.H.; Parker, T.E. NIS T-F1: Recent improvements and accuracy evaluations. Metrologia 2005, 42, 411–422. [Google Scholar] [CrossRef]
  20. Oskay, W.H.; Diddams, S.A.; Donley, E.A.; Fortier, T.M.; Heavner, T.P.; Hollberg, L.; Itano, W.M.; Jefferts, S.R.; Delaney, M.J.; Kim, K.; et al. Single-atom optical clock with high accuracy. Phys. Rev. Lett. 2006, 97, 020801. [Google Scholar] [CrossRef] [Green Version]
  21. Dubé, P.; Madej, A.A.; Bernard, J.E.; Marmet, L.; Boulanger, J.S.; Cundy, S. Electric Quadrupole Shift Cancellation in Single-Ion Optical Frequency Standards. Phys. Rev. Lett. 2005, 95, 033001. [Google Scholar] [CrossRef]
  22. Huntemann, N.; Sanner, C.; Lipphardt, B.; Schneider, T.; Tamm, C.; Peik, E. Single-Ion Atomic Clock with 3 × 10⁻¹⁸ Systematic Uncertainty. Phys. Rev. Lett. 2016, 116, 063001. [Google Scholar] [CrossRef] [PubMed] [Green Version]
  23. Ludlow, A.D.; Zelevinsky, T.; Campbell, G.K.; Blatt, S.; Boyd, M.M.; de Miranda, M.H.G.; Martin, M.J.; Thomsen, J.W.; Foreman, S.M.; Ye, J.; et al. Sr lattice clock at 1 × 10⁻¹⁶ fractional uncertainty by remote optical evaluation with a Ca clock. Science 2008, 319, 1805–1808. [Google Scholar] [CrossRef] [PubMed]
  24. Bloom, B.J.; Nicholson, T.L.; Williams, J.R.; Campbell, S.L.; Bishof, M.; Zhang, X.; Zhang, W.; Bromley, S.L.; Ye, J. An optical lattice clock with accuracy and stability at the 10−18 level. Nature 2014, 506, 71–75. [Google Scholar] [CrossRef] [PubMed] [Green Version]
  25. Nicholson, T.L.; Campbell, S.L.; Hutson, R.B.; Marti, G.E.; Bloom, B.J.; McNally, R.L.; Zhang, W.; Barrett, M.D.; Safronova, M.S.; Strouse, G.F.; et al. Systematic evaluation of an atomic clock at 2 × 10⁻¹⁸ total uncertainty. Nat. Commun. 2015, 6, 6896. [Google Scholar] [CrossRef] [PubMed]
  26. Westergaard, P.G.; Lodewyck, J.; Lorini, L.; Lecallier, A.; Burt, E.A.; Zawada, M.; Millo, J.; Lemonde, P. Lattice-induced frequency shifts in Sr optical lattice clocks at the 10−17 level. Phys. Rev. Lett. 2011, 106, 210801. [Google Scholar] [CrossRef] [Green Version]
  27. Falke, S.; Schnatz, H.; Vellore Winfred, J.S.R.; Middelmann, T.; Vogt, S.; Weyers, S.; Lipphardt, B.; Grosche, G.; Riehle, F.; Sterr, U.; et al. The 87Sr optical frequency standard at PTB. Metrologia 2011, 48, 399–407. [Google Scholar] [CrossRef] [Green Version]
  28. Wang, Y.B.; Yin, M.J.; Ren, J.; Xu, Q.F.; Lu, B.Q.; Han, J.X.; Guo, Y.; Chang, H. Strontium optical lattice clock at the national time service center. Chin. Phys. B 2018, 27, 023701. [Google Scholar] [CrossRef]
  29. Wang, Y.B.; Lu, X.T.; Lu, B.Q.; Kong, D.H.; Chang, H. Recent Advances Concerning the 87Sr Optical Lattice Clock at the National Time Service Center. Appl. Sci. 2018, 8, 2194. [Google Scholar] [CrossRef] [Green Version]
  30. Blatt, S.; Thomsen, J.W.; Campbell, G.K.; Ludlow, A.D.; Swallows, M.D.; Martin, M.J.; Boyd, M.M.; Ye, J. Rabi spectroscopy and excitation inhomogeneity in a one-dimensional optical lattice clock. Phys. Rev. A 2009, 80, 052703. [Google Scholar] [CrossRef]
  31. Hagemann, C.; Grebing, C.; Lisdat, C.; Falke, S.; Legero, T.; Sterr, U.; Riehle, F.; Martin, M.J.; Ye, J. Ultrastable laser with average fractional frequency drift rate below 5 × 10⁻¹⁹/s. Opt. Lett. 2014, 39, 5102. [Google Scholar] [CrossRef]
  32. Peik, E.; Schneider, T.; Tamm, C. Laser frequency stabilization to a single ion. J. Phys. B Atomic Mol. Opt. Phys. 2006, 39, 145–158. [Google Scholar] [CrossRef]
Figure 1. Experimental setup for preparing cold atoms and detecting the clock transition of the strontium optical lattice clock. C1: a pair of anti-Helmholtz coils, C2: compensating coils consisting of three pairs of Helmholtz coils, TL: trapping laser, SL: string laser, PL: polarizing laser, LAL: lattice laser, CLL: clock laser, CL: convex lens with a focal length of 300 mm, CM: concave mirror with a radius of 250 mm, GP: Glan–Taylor polarizer of which the polarization axis is along the direction of gravity.
Applsci 10 01440 g001
Figure 2. Clock transition spectra. (a) Resolved sideband spectrum of the 87Sr clock transition. (b) Spin-polarized spectrum for the transitions of mF = +9/2→mF = +9/2 and mF = −9/2→mF = −9/2.
Applsci 10 01440 g002
Figure 3. Schematic diagram of measuring the quadratic Zeeman shift. BH and BL: the strength of bias magnetic field are strong and weak respectively; vL1 and vR1: initial center frequency of left and right peaks, when the bias magnetic field is BL; vL2 and vR2: initial center frequency of left and right peaks, when the bias magnetic field is BH; e1~8: excitation fraction; err1~4: error signal; Servo1~4: servo system; Δf1~4: the frequency correction; v’L1~2 and v’R1~2: corrected clock laser frequency; vH0: clock transition frequency when the bias magnetic field is BH; vL0: clock transition frequency when the bias magnetic field is BL; ΔvB: the quadratic Zeeman shift.
Applsci 10 01440 g003
Figure 4. The measurement results of the quadratic Zeeman shift coefficient and the lock-in data. (a) The quadratic Zeeman shift under different Beff and parabola fitting of the experimental data. (b) A typical Allan deviation of the quadratic Zeeman shift. The error bar corresponds to 95% confidence interval; the red line represents the linear fitting by fixing the slope at −0.5. (c) The frequency gap between spin-polarized peaks of mF = –9/2 and mF = +9/2 during the routine operation of the 87Sr optical lattice clock.
Applsci 10 01440 g004aApplsci 10 01440 g004b