Article

MASS: Microphone Array Speech Simulator in Room Acoustic Environment for Multi-Channel Speech Coding and Enhancement

Speech and Audio Signal Processing Laboratory, Faculty of Information Technology, Beijing University of Technology, Beijing 100124, China
*
Author to whom correspondence should be addressed.
Appl. Sci. 2020, 10(4), 1484; https://doi.org/10.3390/app10041484
Submission received: 16 January 2020 / Revised: 17 February 2020 / Accepted: 19 February 2020 / Published: 21 February 2020
(This article belongs to the Special Issue Modelling, Simulation and Data Analysis in Acoustical Problems Ⅱ)

Abstract

:

Featured Application

The proposed MASS can simulate multiple signals collected by microphone array in room acoustic environment for multi-channel speech coding and enhancement.

Abstract

Multi-channel speech coding and enhancement is an indispensable technology in speech communication. In order to verify the effectiveness of multi-channel speech coding and enhancement methods in the research and development, a microphone array speech simulator (MASS) used in room acoustic environment is proposed. The proposed MASS is the improvement and extension of the existing multi-channel speech simulator. It aims to simulate clean speech, noisy speech, clean speech with reverberation, noisy speech with reverberation, and noise signals by microphone array used for multi-channel coding and enhancement of speech signal in room acoustic environment. The experimental results of the multi-channel speech coding and enhancement prove that the MASS could well simulate the signals used in real room acoustic environment and can be applied to the research of the related fields.

1. Introduction

In recent years, with the rapid development of signal processing and deep learning technology, more and more speech signal processing algorithms are proposed, which greatly promotes the progress of the speech processing, especially for multi-channel speech signal processing technology, such as multi-channel speech coding and multi-channel speech enhancement, because it can use the spatial information of speech signal, so as to obtain better processing effect than single-channel methods [1]. Due to the popularity of multi-channel speech signal processing algorithms, more and more researchers are engaged in the research of related fields. However, in practice, multi-channel speech signal processing methods often need a large number of microphone arrays with different shapes as the research basis, which often leads to additional economy expenditure. Therefore, the research of microphone array speech simulator for real life simulation has become an indispensable step in the research of multi-channel speech signal processing. It allows one to quickly test and iterate a large number of ideas. In addition, it makes it possible to finely tune parameters for the algorithm before going to experiments in the physical world.
So far, many microphone array speech simulation methods have been proposed. For example, Odeon Room Acoustics Software [2] and Enhanced Acoustics Simulator for Engineers (EASE) [3] are the commercial architecture simulators to simulate the room acoustics of echoic environments. However, they focus on the audible and architectural analysis of geometrically complex rooms such as concert halls, churches, etc. This level of sophistication is not necessarily required for the analysis of three-dimensional speech algorithms or evaluation of microphone array in echoic environments. In addition, a shoebox room acoustics simulator [4] was proposed by Schimmel et al., which could simulate specular and diffuse reverberant sound. This simulator caters more for evaluating signal processing algorithms and is freely available. Although it is efficient, it does not provide the ability to simulate arbitrary microphone arrays. Also, any phase inherent in the directional gain of a microphone is ignored. For example, a dipole microphone would appear to have two positive lobes. Based on the shoebox room acoustics, a multi-channel room acoustics simulator (MCROOMSIM) [5] was proposed by Wabnitz et al., which can simulate the recordings of arbitrary microphone arrays within an echoic shoebox room. Furthermore, this simulator provides realistic phase information thus resulting in accurate inter-channel time delays that is required for accurate simulation of microphone arrays. Nielsen et al. proposed a new single-channel and multi-channel audio recordings database (SMARD) [6], which contains multi-channel recordings for 20 audio segments in 48 different configurations arising from using three different loudspeakers, four different microphone arrays, various sound sources, and sensor locations inside a box-shaped listening room. Scheibler et al. proposed a pyroomacoustics [7] by Python, a software package aimed at the rapid development and testing of microphone array speech processing algorithms. The pyroomacoustics can use the image source model (ISM) to find all image sources up to a maximum specified order and generate the room impulse responses (RIRs) by their positions. It can be used to simulate various kinds of microphone array noisy reverberation speech in various room environments. The pyroomacoustics is available from GitHub (https://github.com/LCAV/pyroomacoustics). However, the pyroomacoustics can only add white noise to the speech in the form of analog microphone self-noise and cannot add any other diffuse noise signal according to the research needs.
In recent years, there have been other simulation methods of microphone array speech. For example, Diverse Environments Multi-channel Acoustic Noise Database (DEMAND) [8] provided a set of 16-channel noise files recorded in a variety of indoor and outdoor settings. The data were recorded using a planar microphone array consisting of four staggered rows. It can be used to simulate real noise signals of multi-channels in specific situations instead of self-design. Zhang et al. built an articulatory dataset specifying in Chinese Mandarin [9] and investigated its efficacy in speech animation, and the dataset was created by Carstens EMA AG501 device. This real multi-channel speech data can be only used for specific structures but not for the simulation in any acoustic environment. Hadad et al. proposed a multi-channel room impulse responses dataset [10]. The room impulse responses were measured by three microphones in different locations of the room under three different reverberation conditions. Therefore, it can only be used for multi-channel simulation in these specific environments. Suh et al. proposed a method for collecting the distant multi-channel speech and noise dataset [11]. The data were collected at four different distant positions in an indoor room, in which an artificial mouth was used for playing the clean source speech data and three kinds of multi-channel microphone arrays were used for recording the distant speech data. The dataset can be used for creating the simulated noisy speech data reflecting various indoor acoustic conditions corrupted by room reverberation and additive noise. However, its microphone array structure is fixed and cannot be adjusted for specific situations. Tang et al. proposed a geometric sound simulation approach for generating and augmenting training data in speech-related machine learning tasks [12]. The method is capable of modeling occlusion, specular, and diffuse reflections of sound in the complicated acoustic environments. Spatialized Multi-Speaker Wall Street Journal (SMS-WSJ) [13] proposed by Drude et al. is a multi-channel dataset of overlapping speech for training, evaluation, and the detailed analysis of source separation and extraction. It has a high degree of randomness w.r.t. room size, array center, and rotation, as well as speaker position. However, the microphone array in this dataset is only a circular array and cannot be changed, so it cannot be applied to the scenes that require a specific shape of the microphone array. Chen et al. proposed a dataset [14] for evaluating continuous speech separation. In this dataset, the speech signal is continuous, containing both the overlapped and overlap-free components. However, only circular arrays are available in this data set, and no other array types are included. Although these methods recently proposed can better simulate the microphone array speech data in a real acoustic environment, most of them have certain limitations and cannot be arbitrarily changed according to the goal of the researcher, so this provides a direction for research on more adaptable microphone array speech simulator.
In this paper, a pyroomacoustics-based microphone array speech simulator (MASS) in room acoustic environment is proposed. In the MASS, the pyroomacoustics is extended to be able to add any kinds of isotropic spherically diffuse noise and set the corresponding signal-to-noise ratio (SNR) to better simulate real life scenes, such as meeting room acoustic environment. Through the analysis of the simulated microphone array speech and the experiments on the multi-channel speech coding and enhancement methods, it can be seen that the microphone array speech signals simulated by the MASS can well simulate the speech data in the real room acoustic environment, and can be applied in the research of related fields.
The structure of the paper is organized as follows: The proposed microphone array speech simulator is described in Section 2. The simulation and analysis are given in Section 3. Application in multi-channel speech coding and enhancement are shown in Section 4. Finally, conclusions and future work are summarized in Section 5.

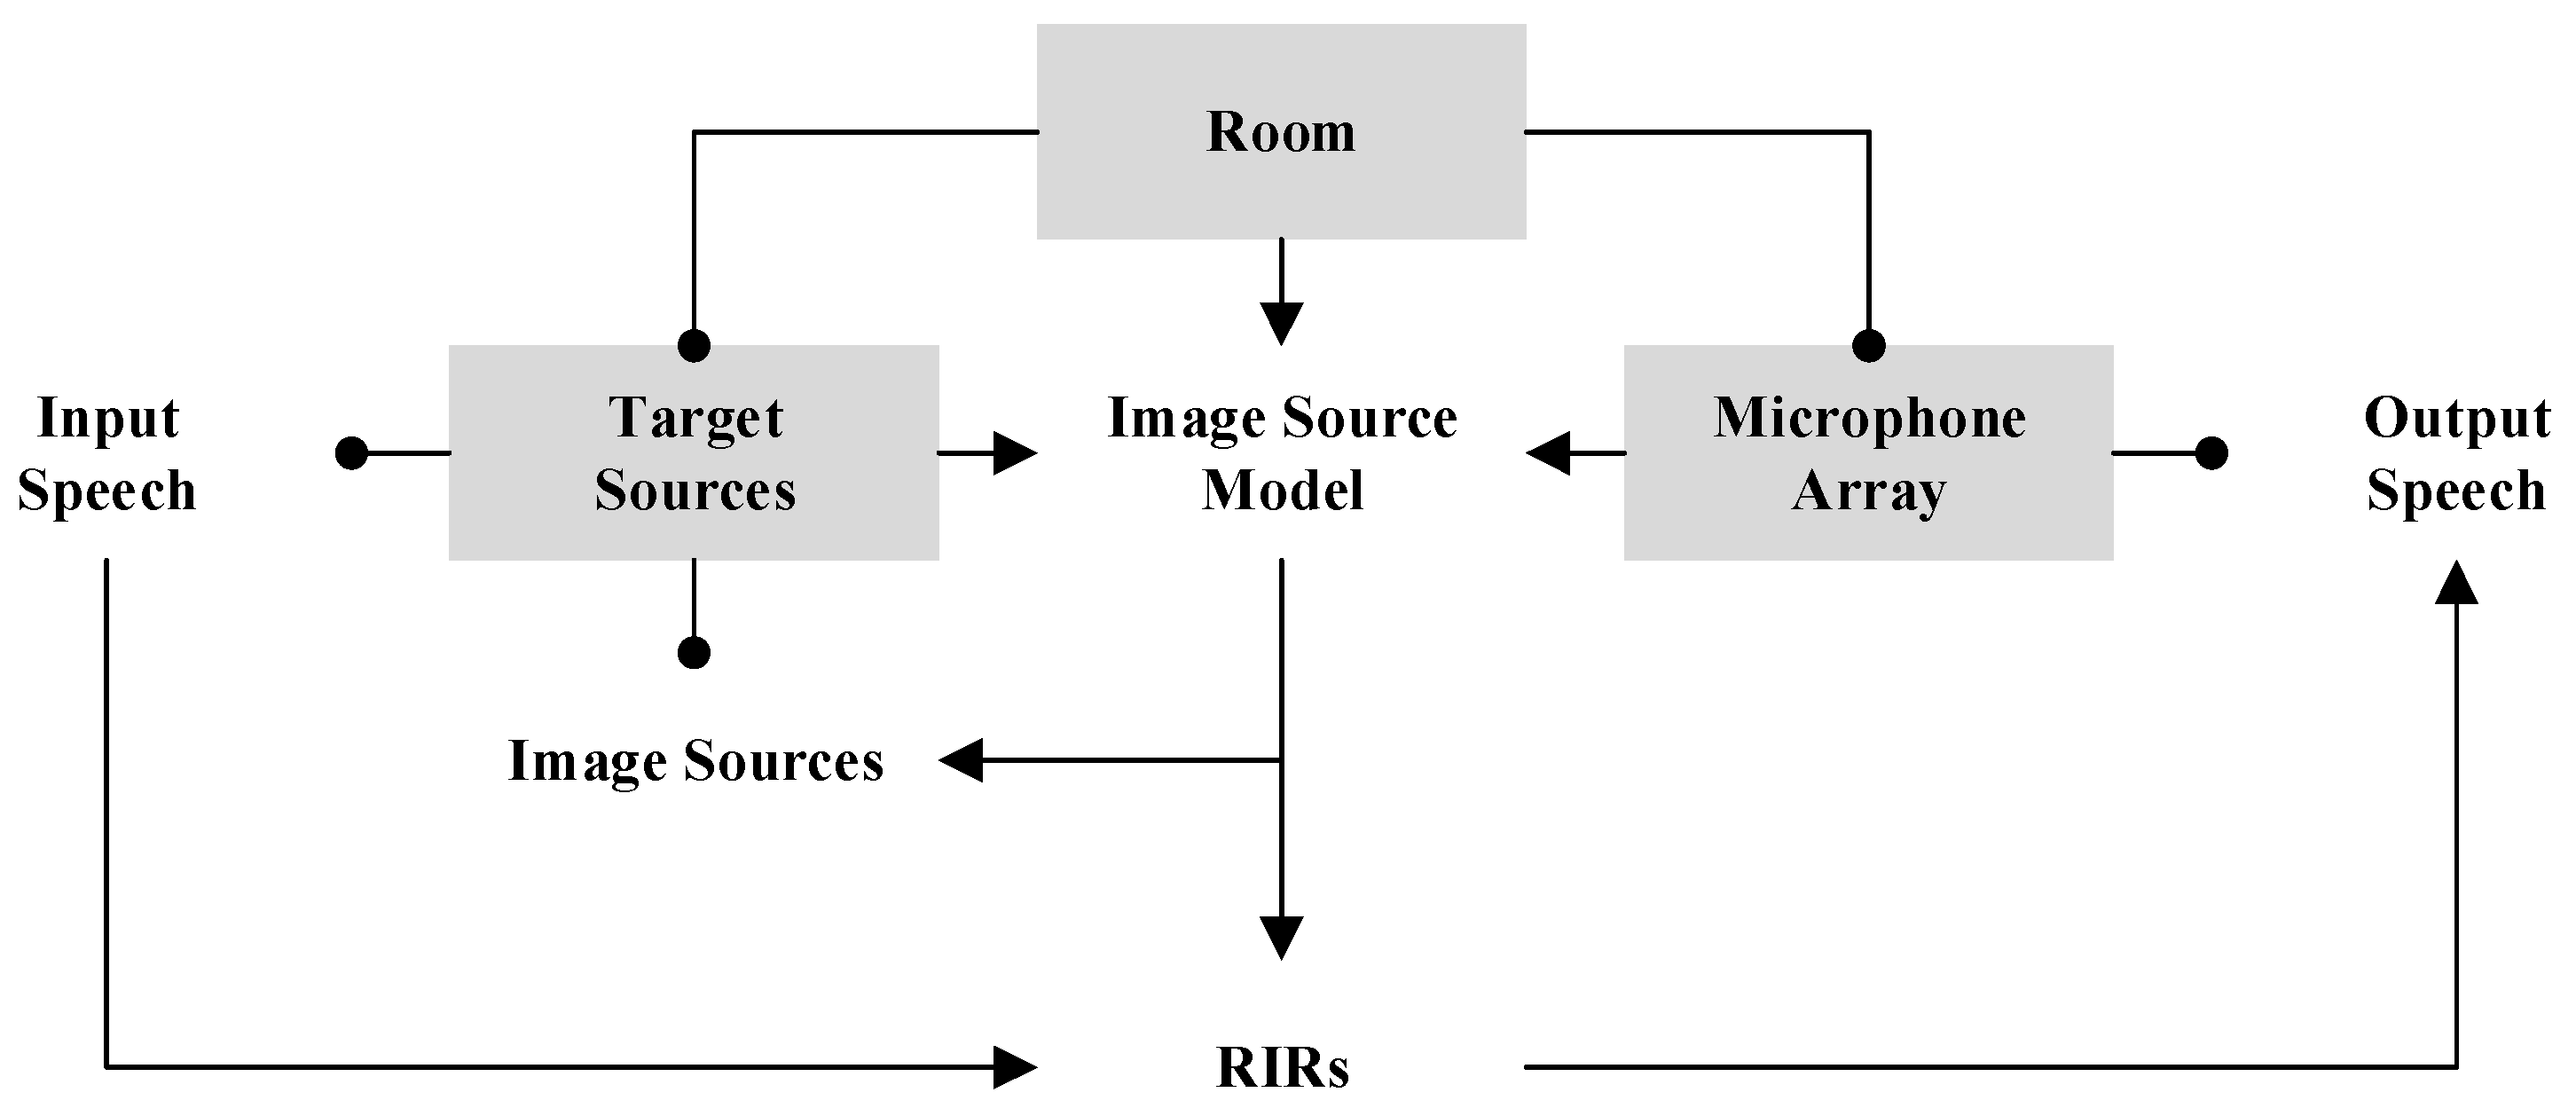
2. Microphone Array Speech Simulator

The proposed MASS is an improvement and extension of the existing pyroomacoustics, which exploits the object-oriented features of Python to create a clean and intuitive application programming interface (API) for room acoustics simulation. As depicted in Figure 1, the pyroomacoustics is mainly composed of three parts including room, target sources, and microphone array that can be set. The room shape and height can be drawn freely in the form of coordinate points, and each microphone and target source can be placed arbitrarily according to the research needs. Therefore, it is very friendly to the research of speech signal processing based on microphone array in room acoustic environment.
In pyroomacoustics, the ISM is used to find all image sources up to a maximum specified order and RIRs are generated from their positions. For a microphone array placed at r, a target source s, and a set of its visible image sources Vi(s), the RIR ar(s, n) between r and s is given by
a r ( s , n ) = s i V i ( s ) ( 1 α ) o r d e r ( s i ) 4 π r s i δ L P ( n F s r s i c )
where order(s) gives the reflection order of source s, α ∈ [0, 1] is the absorption factor of the walls, c is the speed of sound, Fs is sampling rate of signal, and δLP is the windowed sinc function, which is defined by
δ L P ( t ) = { 1 2 ( 1 + cos ( 2 π t T w ) ) sinc ( t ) if   T w 2 t T w 2 0 otherwise
where Tw is the length of the window. Based on Sabine’s formula [15], the reverberation time (RT60) of the room can be obtained indirectly from the absorption factor α, which can be written by
R T 60 = 0.161 V r o o m α S r o o m
where Vroom and Sroom represent the volume and surface area of the room, respectively. Note that for simplicity, we assumed the absorption factor α to be identical for all walls. Nevertheless, the pyroomacoustics allows to specify a different absorption factor for each wall. Therefore, pyroomacoustics can simulate the microphone array speech in room acoustic environment very conveniently. In the pyroomacoustics, for example, a simulation scenario is created by first defining a room where a speech source and a microphone array are attached. The actual speech is attached to the source as a raw speech sample. The ISM is then used to find all image sources up to a maximum specified order and the RIRs are generated from their positions. The microphone signals are then created by convolving speech samples associated to source with the appropriate RIRs. Since the simulation is done on discrete-time signals, a sampling frequency is specified for the room and the sources it contains. Microphones can optionally operate at a different sampling frequency; a rate conversion is done in this case [7].
In the actual research and application, however, it should be further improved. For example, when adding noise to the simulated microphone array speech, the pyroomacoustics can only add white noise to the speech in the form of analog microphone self-noise and cannot add any other diffuse noise signal according to the research needs. This provides a direction for the expansion of pyroomacoustics.
In order to better simulate microphone array speech in room acoustic environment for various research needs, according to the non-stationary array noise simulation method of isotropic noise field [16], we will expand the pyroomacoustics to add any isotropic spherically diffuse noise with any SNR to the simulated acoustic environment.
For the non-stationary array noise simulation method in isotropic noise field [16], the noise field is assumed to be homogeneous. So, in an isotropic spherically noise field, the spatial coherence function values at angular frequency ωk is given by
γ p q ( ω k ) = sin ( ω k d p q / c ) ω k d p q / c
where dpq denotes the distance between the pth microphone and the qth microphone. We can define a matrix G(ωk) for each ωk that consists of the spatial coherence values as follows:
G ( ω k ) = [ γ 11 ( ω k ) γ 12 ( ω k ) γ 1 M ( ω k ) γ 21 ( ω k ) γ 22 ( ω k ) γ 2 M ( ω k ) γ M 1 ( ω k ) γ M 2 ( ω k ) γ M M ( ω k ) ]
where M is the number of microphones. The eigenvalue decomposition (EVD) is used to decompose matrix G(ωk) as follows
G ( ω k ) = V ( ω k ) D ( ω k ) V H ( ω k )
where D(ωk) is a diagonal matrix and (⋅)H is the Hermitian operation. So, the transformation matrix C(ωk) can be obtained by
C ( ω k ) = D ( ω k ) V H ( ω k )
Given noise matrix Nc(l,ωk) = [Nc1(l,ωk), Nc2(l,ωk), …, NcM(l,ωk)]T, where the elements of the Nc(l,ωk) are randomly selected from complete noise signal as long as clean speech and mutually independent. l denotes the frame index. So, in frequency domain, the noise signals N(l,ωk) = [N1(l,ωk), N2(l,ωk), …, NM(l,ωk)]T that will be used in microphone array can be obtained by
N ( l , ω k ) = C H ( ω k ) N c ( l , ω k )
Finally, in time-domain, the noise signals that will be used in each microphone can be obtained by inverse short-time Fourier transform (STFT) on each element of the N(l,ωk).
The integration of the pyroomacoustics and the non-stationary array noise simulation method in isotropic noise field can be used to simulate the room acoustic environment closer to the real situation, such as the meeting room and other scenes that may have various non-stationary noises. The proposed extension method is shown in Figure 2.
Firstly, as described in Figure 2, for a target speech source located at a specific location, we set up a room (such as a meeting room) and add the required microphone array by using pyroomacoustics. In order to better simulate the microphone array speech, we choose omnidirectional microphone with 10 times amplifier [6] to form the microphone array placed in the room, so as to get an auditory acceptable microphone array speech. When we set the absorption factor α to 1.0, we think that the walls of the room can absorb all the speech signals being propagated without any reflection and image source, and then the corresponding clean speech signals of microphone array are obtained. At the same time, we can set the absorption factor α to be less than 1.0, so as to get the clean speech with reverberation of microphone array by corresponding reverberation time according to Equation (3). Then, based on the collected speech signal at each microphone and noise signal, we can calculate noise signal of each microphone for the specific SNR level; that is, the power of noise signal in each channel can be expressed as
P n , i = P s , i 10 S N R 10
where Ps,i and Pn,i are the powers of clean speech and noise at the ith channel of the microphone array, respectively. For example, we use babble noise to simulate diffuse noise derived from the meeting room. Finally, by adding noise with clean speech and clean speech with reverberation of each microphone, respectively, the noisy speech and noisy speech with reverberation of microphone array are obtained, respectively.
Therefore, the proposed MASS based on pyroomacoustics can simulate more real microphone array speech with isotropic spherically diffuse noise in room acoustic environment. Table 1 shows the inputs and outputs of the MASS. With these parameters listed in the inputs, the corresponding five types of microphone array signals can be obtained in the outputs.

3. Simulation and Analysis of Microphone Array Speech

3.1. Simulation of Microphone Array Speech in Room Acoustic Environment

In order to show and analyze microphone array speech simulated by the proposed MASS more intuitively, as shown in Figure 3, a common three-dimensional room acoustic environment for a meeting room is created. The simulated meeting room is 4 m long, 3 m wide, and 3 m high. In the center of the meeting room, a 2.2 m long, 1.1 m wide, and 0.75 m high rectangular conference table is placed. A uniform linear microphone array with a spacing of 4cm is placed in the center of the conference table to collect the sound signals in the room. Around the conference table, there are 19 chairs (Target 1~Target 19) as shown in terms of the square and a TV screen that somebody is speaking (Target 20) hung on the wall to simulate target speech sources in the meeting room acoustic environment. The coordinates of microphone array and each target speech source are also shown in Figure 3. In order to simplify the simulation, we assume that: (1) Each target speech source makes sound independently without overlapping, but they can be set to overlapping if needed; and (2) the conference table and chairs are ideal and have no reflection to the incident sound wave.
So, based on such a meeting room acoustic environment in Figure 3, the room acoustic environment can be abstracted as the room shape, target speech source, and microphone array settings for simulating microphone array speech in room acoustic environment by the proposed MASS as shown in Figure 4.

3.2. Analysis of the Simulated Microphone Array Speech

With the room shape, target speech sources, and microphone array parameters described above, we can build the required microphone array speech by setting noise signal (such as babble noise), SNR level, absorption factor, which reflects the RT60, and other parameters. The clean target speech used is randomly selected from TIMIT corpus [17]. Figure 5 depicts a real RIR with the RT60 of 500 ms and Figure 6 shows the simulated RIRs between Target 1 and each microphone when the RT60 is 500 ms. From the RIRs shown in Figure 6, we can clearly see that the simulated RIRs have similar positive and negative values as the real ones and obviously show the three features, direct path, early echoes, and reverberation, are similar to those in Figure 5. So, the speech signals of microphone array obtained by the RIRs can simulate the real microphone array speech well. Figure 7 shows the spectrograms of clean speech, noisy speech, clean speech with reverberation, noisy speech with reverberation, and noise signals of microphones array for Target 1 when the RT60 is 500 ms and the SNR level is 5 dB.
From Figure 7, we can watch various types of speech and noise signals in each microphone. As a whole, due to the close distance between each microphone, the speech signals between each channel are very similar, but when we carefully observe their time-domain waveforms, we can clearly see their differences.
In order to verify whether the simulated microphone array speech conforms to the sound wave propagation model, we draw a segmental time-domain waveform of clean speech of microphone array in Figure 8a and a segmental comparison waveform with Target 1 in Figure 8b. The selected speech waveforms are enlarged for observing the relationship of each waveform.
Through Figure 8, we can clearly see that there is a large amplitude attenuation and propagation delay between Target 1 and the speech signals of microphone array. In addition, we also find that amplitude attenuation and propagation delay between the microphones are small. According to sound wave propagation model given in [18], the speech signals of microphone array and target speech signals have the following approximate relationship:
x i ( t ) = σ s j ( t τ ) = 10 4 π q i j s j ( t q i j c )
where σ and τ represent amplitude attenuation factor and propagation delay, respectively. xj(t) and si(t) represent speech signal of the ith microphone and the jth target speech source, respectively. qij is the distance from the target speech source jth to the ith microphone. Based on Equation (10) and time-domain waveform shown in Figure 8, we can quantitatively analyze the accuracy of time difference of arrival (TDOA) for microphone array. Given the location of speech source of Target 1 and microphone array in Figure 3, and combined with the sound wave propagation model, we can calculate the theoretical TDOA as
TDOA theoretical = ( q 91 q 01 ) / 9 c F s = ( 2.1187 1.8657 ) / 9 343 × 16000   samples = 1.3113   samples
At the same time, according to horizontal axis in Figure 8a, we can roughly find that the TDOA of microphone array speech simulated by the MASS is about 1.3 samples. Table 2 gives a comparison of the TDOA for theoretical and simulated values. From Table 2, we can see that the simulated TDOA could accurately reflect theoretical TDOA between the microphones. The TDOA reflects the spatial characteristics of the target speech source.
Figure 9 shows the spatial coherence of the noise signals of microphone array. From Figure 9, we can see that the isotropic spherically diffuse noise is coherent at low frequency region, while the coherence at high frequency tends to zero. This phenomenon is consistent with the isotropic spherical diffuse noise model given in [16]. This means that the noise signals of microphone array simulated by the MASS can well simulate the isotropic spherically diffuse noise in the real environment and can be used to simulate noisy speech of microphone array.

3.3. Comparison with Other Speech Simulation Methods

In order to further verify the effectiveness of the proposed MASS method in real acoustic environment, the comparison of the MASS with the existing multi-channel speech simulation method (called MCS) [19] and SMARD method [6] is shown in this subsection. The noisy speech dataset of microphone array with reverberation simulated by the three methods is used for training a convolutional neural network (CNN)-based multi-channel speech enhancement method [19], respectively. Then three trained CNN models representing three different microphone array speech simulation methods are obtained. Three trained CNN models are tested using the microphone array speech in the real environment, and the CNN model with the best test results is expressed as the corresponding microphone array speech simulation method that can better simulate the real acoustic environment.
To ensure the generality of the experiment, the same parameters and configurations are set in three different microphone array speech simulation methods, so that the three datasets describing the same acoustic environment are obtained. The acoustic environment described in the dataset is similar to that in Figure 3. The only difference is that a four-channel uniform linear microphone array with a distance of 5 cm is used, which is to match real microphone array data during the testing. Each position of target speech source matches 20 different speech segments that are randomly selected from the TIMIT corpus [17]. The dataset uses four types of the SNR levels (e.g., −5 dB, 0 dB, 5 dB, and 10 dB) of babble noise and seven types of reverberation time (e.g., as 200 ms, 300 ms, 400 ms, 500 ms, 600 ms, 700 ms, and 800 ms), and the total duration is about 10 hours. During the test, clean speech of microphone array with reverberation is obtained from the real recorded speech in LibriSpeech corpus [20] by using three microphone array speech simulation methods, and then the final real speech for the testing is obtained by adding the real recorded meeting room noise signals in the DEMAND dataset [8]. In the test set, each position of target speech source is equipped with five different speech segments, with the SNR levels of −5 dB, 0 dB, 5 dB, and 10 dB, and reverberation time of 300 ms, 500 ms, and 700 ms. The test set duration is about 1 hour.
The average results of all the speech on all the target speech source positions in real speech data are shown in Table 3. The improvements of perceptual evaluation of speech quality (PESQ) [21] ΔP and short-time objective intelligibility (STOI) [22] ΔS are used to test the corresponding results. As can be seen from Table 3, the CNN model trained by the proposed MASS method (called CNN_MASS) can achieve better speech enhancement effect than that trained by the MCS method (called CNN_MCS) or trained by the SMARD method (called CNN_SMARD). Especially in the case of low SNR levels, the simulation of isotropic spherically diffuse noise field in the proposed MASS method can better describe the real acoustic environment, so it can obtain a higher amount of improvement in the use of real data testing.
Therefore, based on the above analysis, the proposed MASS can well simulate the room acoustic environment with isotropic spherically diffuse noise, so as to simulate the required speech signals of microphone array for the research of related fields. In the next section, the multi-channel speech coding and enhancement methods are further used to verify the proposed MASS.

4. Applications in Multi-Channel Speech Coding and Enhancement

4.1. Simulation of Microphone Array Speech Signals

In order to better verify the accuracy of the microphone array speech signals simulated by the proposed MASS, we use the MASS to simulate the microphone array speech signals for multi-channel speech coding and enhancement. Table 4 shows the application conditions of the MASS. The room acoustic environment configuration used to simulate microphone array speech signals is same as Figure 3.

4.2. Application in Multi-Channel Speech Coding

The enhance voice services (EVS) [23] is a new kind of speech coding standard after adaptive multi-rate (AMR) [24] and adaptive multi-rate wideband (AMR-WB) [25]. It has gradually replaced AMR and AMR-WB as a mainstream trend on mobile devices such as mobile phones. Compared with existing coding standards, the EVS codec enhanced quality and coding efficiency for narrowband (NB) and wideband (WB) speech services and enhanced quality by the introduction of super wideband (SWB) and full band (FB). Furthermore, the EVS codec has backward compatibility to the AMR-WB codec [26]. Given the EVS codec, a multi-channel speech codec based on the EVS and time delay of the TDOA estimation is proposed. That is, the speech signal of reference channel is encoded by the EVS codec, and the time delay between other channels and reference channel is estimated and used to represent spatial information. The encoded speech bitstream and the coded time delay bitstream are integrated to form final transmission bitstream. At the decoder, the speech bitstream and the time delay bitstream are separated and decoded, and finally, the multi-channel output speech is recovered. In order to get a more accurate time delay, the linear forward spatial prediction-based TDOA estimation method [27] is used. The block diagram of the proposed multi-channel speech coding method combining with EVS and TDOA (called Multi-EVS-TDOA) are shown in Figure 10.
Once the time delay is estimated, it is quantized by uniform quantization method. As shown in Figure 3, the speech source can appear at any position relative to the microphone array. Under the far-field assumption, the time delay between the microphones is 0 when the speech source is facing the microphone array. When the speech source is in line with the microphone array, the time delay between the microphones reaches the maximum. So, for the uniform linear array in this work, the distance between microphones is 0.04 m, and the maximum value of time delay is 2 samples. In this way, a 2-bit uniform quantizer with four levels can be used to quantize the estimated time delay that is the spatial information of speech source. Thus, its bit rate is calculated as (2560 bits/frame × 1 channel + 2 bits/frame) × 50 frames/s = 128.1 kbps, where 2560 is the bit number of one frame of EVS codec at 128 kbits/s, 2 is the bit number of one frame for the time delay, and 50 is the frame rate.
The performance bottleneck of the Multi-EVS-TDOA method is the accuracy of time delay estimation. In the current room acoustic environment, as shown in Table 2, the time delay should be 1.3113 samples. Because the time delay can only be estimated as an integer value, we have to manifold up-sample signal such as 10 times and estimate time delay. This up-sampling method improves the accuracy of time delay estimation, reduces the error, and increases speech quality. The block diagram of the proposed up-sampling-based multi-channel speech coding method combining with EVS and TDOA (called US-Multi-EVS-TDOA) are shown in Figure 11. For the proposed multi-channel speech coding method, the sampling rate can be seen as a priori knowledge, and for multi-channel speech with a specific sampling frequency, the proposed multi-channel speech coding method based on the up-sampling can be directly used for the encoding and decoding. Due to the up-sampling, the maximum value of delay goes up to 20. These result in more bit requirements for the quantization of time delay. Here, a 5-bit uniform quantizer with 32 levels is used for quantizing time delay. The new bit rate becomes (2560 bits/frame × 1 channel + 5 bits/frame) × 50 frames/s = 128.25 kbps.
In this work, in order to show the best effect of the proposed codec, the 16 kHz sampling rate and 128 kbps bit rates are used to set the parameters of the EVS codec, while other parameters remain unchanged by default. In order to better demonstrate the superiority of the proposed method, the Multi-EVS method is considered as a reference method. In the Multi-EVS method, the collected speech signal of each microphone is encoded separately by the EVS and transmitted in the form of bitstream integration for realizing multi-channel codec. Thus, the bit rate of 10 channels is calculated as 2560 bits/frame × 50 frames/s × 10 channels = 1280 kbps.
The PESQ, STOI, segment SNR (SSNR) [28], and logarithm spectral distortion (LSD) [29] are used to evaluate the performance of the decoded speech. The average test results of Target 1 to Target 20 are shown in Figure 12.
From Figure 12, we can see that the Multi-EVS obtains the highest PESQ, STOI, SSNR, and the lowest LSD because it encodes each channel separately under the maximum bit rates. Although Multi-EVS-TDOA only encodes one channel and time delays, its PESQ and STOI scores are larger at 4.4 and 0.999. respectively, and its LSD is also less than 1.0. However, due to precision problems of time delay estimation, the SSNR of the Multi-EVS-TDOA shows a downward trend, or even drops to 0dB or below. By contrast, the up-sampling used in the US-Multi-EVS-TDOA greatly increases the accuracy of delay estimation. This leads to a significant improvement of the SSNR. At the same time, compared with the Multi-EVS-TDOA, the US-Multi-EVS-TDOA has a certain degree of increase in LSD due to the introduction of up-sampling and down-sampling. Fortunately, the increase of the LSD does not exceed the scope of transparent coding; that is, the LSD should be less than 1.0 for transparent. So, the US-Multi-EVS-TDOA greatly improved the coding efficiency while maintaining the PESQ, STOI, SSNR, and LSD within an acceptable range. Therefore, we can draw a conclusion that the speech simulated by the proposed MASS method can be used in the research of multi-channel speech coding.

4.3. Application in Multi-Channel Speech Enhancement

In order to verify the accuracy of the MASS more comprehensively, we propose a multi-channel speech enhancement for the microphone array speech simulated by the proposed MASS, which is the integration of the weighted prediction error (WPE)-based dereverberation method [30] and complex Gaussian mixture model-based minimum variance distortionless response (CGMM-MVDR) beamforming method [31] (called WPE-CGMM-MVDR). Figure 13 shows the block diagram of the WPE-based dereverberation method, the CGMM-MVDR beamforming method, and the proposed WPE-CGMM-MVDR method using Figure 13a–c, respectively. The inputs of the system consist of noisy speech, clean speech with reverberation, or noisy speech with reverberation of microphone array that are simulated by the MASS. For dereverberation performance evaluation, such as Figure 13a, the input microphone array clean speech with reverberation goes through the WPE-based dereverberation module, which achieves the purpose of removing the reverberation part after 20 iterations. For the denoising performance evaluation, such as Figure 13b, a beamformer that uses a novel steering vector estimation method based on time-frequency masks is employed. The time-frequency masks are used to avoid inaccurate prior knowledge such as array geometry and plane wave propagation assumption. Thus, it provides a robust steering vector estimation. Here, the time-frequency masks are estimated by using a spectral model based on the CGMM. For the microphone array noisy speech with reverberation, such as Figure 13c, the WPE-based dereverberation and the CGMM-MVDR beamforming are integrated together to implement a complete speech enhancement system that can also finish dereverberation and denoising tasks.
After the multi-channel speech enhancement experiments, the enhanced speech is obtained. The PESQ, STOI, SSNR, and LSD are used to evaluate the quality of the enhanced speech as well. The average evaluation results of Target 1 to Target 20 are shown in Figure 14. Among them, the test results of noisy speech, clean speech with reverberation, and noisy speech with reverberation come from reference microphone 0 in Figure 3.
Through Figure 14, we can clearly see the multi-channel speech enhancement results of the microphone array speech obtained by the proposed MASS. Experimental results show that whether it is dereverberation, denoising, or dereverberation plus denoising at the same time, the speech enhancement effect is still obvious even at a low SNR level. This phenomenon is consistent with the characteristics of the corresponding speech enhancement method. Therefore, we can draw a conclusion that the speech simulated by the proposed MASS method can be used in the research of multi-channel speech enhancement.

5. Conclusions

In this paper, a microphone array speech simulator, which is closer to a real room acoustic environment, was proposed based on the pyroomacoustics. The proposed MASS can better simulate some specific room acoustic environment, especially in the presence of isotropic spherically diffused noise. It can be used not only to simulate individual microphone array speech segments, but also to build microphone array speech datasets for deep neural network training. By analyzing the microphone array speech simulated by the proposed MASS and experiments based on multi-channel speech coding and enhancement, we can see that the simulated microphone array speech conforms to the sound wave propagation model in the corresponding acoustic environment, both in terms of amplitude attenuation and propagation delay, and the noise signal also conforms to the characteristics of isotropic spherically diffused noise. Through the corresponding multi-channel speech encoding and enhancement experiments, we can see that the proposed multi-channel speech coding and enhancement method can be well performed on the simulated microphone array speech, and the simulated microphone array speech signals can be used for research in the related fields. So, the proposed MASS is valid. In the future, we will continue to improve the MASS and apply it to more applications.

Author Contributions

Conceptualization, C.B., R.C. and Z.C.; methodology, C.B. and R.C.; software, R.C. and Z.C.; validation, C.B., R.C. and Z.C.; formal analysis, C.B. and R.C.; investigation, R.C.; resources, R.C.; data curation, R.C.; writing—original draft preparation, R.C.; writing—review and editing, C.B. and Z.C.; visualization, R.C.; supervision, C.B. All authors have read and agreed to the published version of the manuscript.

Funding

This research was funded by the National Natural Science Foundation of China, grant numbers 61831019 and 61471014.

Acknowledgments

The authors are grateful to the thorough reviewers.

Conflicts of Interest

The authors declare no conflict of interest.

References

  1. Benesty, J.; Chen, J.; Huang, Y. Microphone Array Signal Processing; Springer: Berlin/Heidelberg, Germany, 2008. [Google Scholar]
  2. Odeon Room Acoustics Software. Available online: http://www.odeon.dk (accessed on 21 February 2020).
  3. Enhanced Acoustics Simulator for Engineers (EASE). Available online: http://www.auralisation.de (accessed on 21 February 2020).
  4. Schimmel, S.M.; Muller, M.F.; Dillier, N. A fast and accurate “shoebox” room acoustics simulator. In Proceedings of the 2009 IEEE International Conference on Acoustics, Speech and Signal Processing, Taipei, Taiwan, 19–24 April 2009; pp. 241–244. [Google Scholar]
  5. Wabnitz, A.; Epain, N.; Jin, C.T.; van Schaik, A. Room acoustics simulation for multichannel microphone arrays. In Proceedings of the 2010 International Symposium on Room Acoustics, Melbourne, Australia, 29–31 August 2010; pp. 1–6. [Google Scholar]
  6. Nielsen, J.K.; Jensen, J.R.; Jensen, S.H.; Christensen, M.G. The single- and multichannel audio recordings database (SMARD). In Proceedings of the 2014 14th International Workshop on Acoustic Signal. Enhancement (IWAENC), Juan-les-Pins, France, 8–11 September 2014; pp. 40–44. [Google Scholar]
  7. Scheibler, R.; Bezzam, E.; Dokmanic, I. Pyroomacoustics: A Python Package for Audio Room Simulation and Array Processing Algorithms. In Proceedings of the 2018 IEEE International Conference on Acoustics, Speech and Signal Processing (ICASSP), Calgary, AB, Canada, 15–20 April 2018; pp. 351–355. [Google Scholar]
  8. Thieman, J.; Ito, N.; Vincent, E. The diverse environments multi-channel acoustic noise database: A database of multichannel environmental noise recordings. J. Acoust. Soc. Am. 2013, 133, 3591. [Google Scholar] [CrossRef]
  9. Zhang, D.; Liu, X.; Yan, N.; Wang, L.; Zhu, Y.; Chen, H. A multi-channel/multi-speaker articulatory database in Mandarin for speech visualization. In Proceedings of the 9th International Symposium on Chinese Spoken Language Processing, Singapore, 12–14 September 2014; pp. 299–303. [Google Scholar]
  10. Hadad, E.; Heese, F.; Vary, P.; Gannot, S. Multichannel audio database in various acoustic environments. In Proceedings of the 2014 14th International Workshop on Acoustic Signal Enhancement (IWAENC), Juan-les-Pins, France, 8–11 September 2014; pp. 313–317. [Google Scholar]
  11. Suh, Y.; Kim, Y.; Lim, H.; Goo, J.; Jung, Y.; Choi, Y.; Kim, H.; Choi, D.-L.; Lee, Y. Development of distant multi-channel speech and noise databases for speech recognition by in-door conversational robots. In Proceedings of the 2017 20th Conference of the Oriental Chapter of the International Coordinating Committee on Speech Databases and Speech I/O Systems and Assessment (O-COCOSDA), Seoul, Korea, 1–3 November 2017; pp. 1–4. [Google Scholar]
  12. Tang, Z.; Chen, L.; Wu, B.; Yu, D.; Manocha, D. Improving reverberant Speech Training Using Diffuse Acoustic Simulation. Available online: https://arxiv.org/abs/1907.03988v4 (accessed on 10 February 2020).
  13. Drude, L.; Heitkaemper, J.; Boeddeker, C.; Haeb-Umbach, R. SMS-WSJ: Database, Performance Measures, and Baseline Recipe for Multi-Channel Source Separation and Recognition. Available online: https://arxiv.org/abs/1910.13934 (accessed on 30 October 2019).
  14. Chen, Z.; Yoshioka, Y.; Lu, L.; Zhou, T.; Meng, Z.; Luo, Y.; Wu, J.; Li, J. Continuous Speech Separation: Dataset and Analysis. Available online: https://arxiv.org/abs/2001.11482 (accessed on 30 January 2020).
  15. Sabine, W.C.; Egan, M.D. Collected Papers on Acoustics. J. Acoust. Soc. Am. 1994, 95, 3679–3680. [Google Scholar] [CrossRef] [Green Version]
  16. Habets, E.A.P.; Cohen, I.; Gannot, S. Generating nonstationary multisensor signals under a spatial coherence constraint. J. Acoust. Soc. Am. 2008, 124, 2911–2917. [Google Scholar] [CrossRef] [PubMed]
  17. Garofolo, J.S.; Lamel, L.F.; Fisher, W.M.; Fiscus, J.G.; Pallett, D.S. DARPA TIMIT Acoustic-Phonetic Continous Speech Corpus CD-ROM. NIST Speech disc 1-1.1; NASA STI/Recon Technical Report N 93, 27403; NASA: Washington, DC, USA, 1993.
  18. Gannot, S.; Vincent, E.; Markovich-Golan, S.; Ozerov, A. A Consolidated Perspective on Multimicrophone Speech Enhancement and Source Separation. IEEE/ACM Trans. Audio Speech Lang. Process. 2017, 25, 692–730. [Google Scholar] [CrossRef] [Green Version]
  19. Chakrabarty, S.; Wang, D.; Habets, E.A.P. Time-Frequency Masking Based Online Speech Enhancement with Multi-Channel Data Using Convolutional Neural Networks. In Proceedings of the 2018 16th International Workshop on Acoustic Signal Enhancement (IWAENC), Tokyo, Japan, 17–20 September 2018; pp. 476–480. [Google Scholar]
  20. Panayotov, V.; Chen, G.; Povey, D.; Khudanpur, S. Librispeech: An ASR corpus based on public domain audio books. In Proceedings of the 2015 IEEE International Conference on Acoustics, Speech and Signal Processing (ICASSP), Brisbane, QLD, Australia, 19–24 April 2015; pp. 5206–5210. [Google Scholar]
  21. Rix, A.W.; Beerends, J.G.; Hollier, M.P.; Hekstra, A.P. Perceptual evaluation of speech quality (PESQ)-a new method for speech quality assessment of telephone networks and codecs. In Proceedings of the 2001 IEEE International Conference on Acoustics, Speech, and Signal Processing, Salt Lake City, UT, USA, 7–11 May 2001; pp. 749–752. [Google Scholar]
  22. Taal, C.; Hendriks, R.C.; Heusdens, R.; Jensen, J. An algorithm for intelligibility prediction of time–frequency weighted noisy speech. IEEE/ACM Trans. Audio, Speech, Lang. Process. 2011, 19, 2125–2136. [Google Scholar] [CrossRef]
  23. 3GPP TS 26.445. Codec for Enhanced Voice Services (EVS); Detailed Algorithmic Description. Available online: https://portal.3gpp.org/desktopmodules/Specifications/SpecificationDetails.aspx?specificationId=1467 (accessed on 14 June 2019).
  24. 3GPP TS 26.071. Mandatory Speech CODEC Speech Processing Functions; AMR Speech Codec; General Description. Available online: https://portal.3gpp.org/desktopmodules/Specifications/SpecificationDetails.aspx?specificationId=1386 (accessed on 22 June 2018).
  25. 3GPP TS 26.171. Speech Codec Speech Processing Functions; Adaptive Multi-Rate -Wideband (AMR-WB) Speech Codec; General Description. Available online: https://portal.3gpp.org/desktopmodules/Specifications/SpecificationDetails.aspx?specificationId=1420 (accessed on 22 June 2018).
  26. Dietz, M.; Multrus, M.; Eksler, V.; Malenovsky, V.; Norvell, E.; Pobloth, H.; Miao, L.; Wang, Z.; Laaksonen, L.; Vasilache, A.; et al. Overview of the EVS codec architecture. In Proceedings of the 2015 IEEE International Conference on Acoustics, Speech and Signal Processing (ICASSP), Brisbane, QLD, Australia, 19–24 April 2015; pp. 5698–5702. [Google Scholar]
  27. Chen, J.; Benesty, J.; Huang, Y. Robust time delay estimation exploiting redundancy among multiple microphones. IEEE Trans. Speech Audio Process. 2003, 11, 549–557. [Google Scholar] [CrossRef]
  28. Hansen, J.H.L.; Pellom, B.L. An Effective Quality Evaluation Protocol For Speech Enhancement Algorithms. In Proceedings of the 5th International Conference on Spoken Language Processing, Sydney, Australia, 30 November–4 December 1998; pp. 2819–2822. [Google Scholar]
  29. Abramson, A.; Cohen, I. Simultaneous Detection and Estimation Approach for Speech Enhancement. IEEE Trans. Speech Audio Process. 2007, 15, 2348–2359. [Google Scholar] [CrossRef]
  30. Nakatani, T.; Yoshioka, T.; Kinoshita, K.; Miyoshi, M.; Juang, B.-H. Speech Dereverberation Based on Variance-Normalized Delayed Linear Prediction. IEEE Trans. Speech Audio Process. 2010, 18, 1717–1731. [Google Scholar] [CrossRef]
  31. Higuchi, T.; Ito, N.; Yoshioka, T.; Nakatani, T. Robust MVDR beamforming using time-frequency masks for online/offline ASR in noise. In Proceedings of the 2016 IEEE International Conference on Acoustics, Speech and Signal Processing (ICASSP), Shanghai, China, 20–25 March 2016; pp. 5210–5214. [Google Scholar]
Figure 1. The block diagram of the pyroomacoustics. The lines terminated by a bullet indicate attribute relationship and arrows indicates parameters to functions.
Applsci 10 01484 g001
Figure 2. The block diagram of the proposed microphone array speech simulator (MASS); it is an extension of the pyroomacoustics.
Applsci 10 01484 g002
Figure 3. The meeting room acoustic environment with 20 target speech sources and a uniform linear microphone array.
Applsci 10 01484 g003
Figure 4. The abstracted meeting room acoustic environment with 20 target speech sources and a uniform linear microphone array.
Applsci 10 01484 g004
Figure 5. The real room impulse response (RIR) for the RT60 of 500 ms.
Applsci 10 01484 g005
Figure 6. The RIRs between Target (Tar.) 1 and each microphone (Mic.) when the RT60 is 500 ms.
Applsci 10 01484 g006
Figure 7. The spectrograms of clean speech, noisy speech, clean speech with reverberation, noisy speech with reverberation, and noise signals of microphone (Mic.) array for Target 1 when the RT60 is 500 ms and the signal-to-noise ratio (SNR) level is 5 dB.
Applsci 10 01484 g007
Figure 8. Time-domain waveform comparison; (a) clean speech signals of microphone array; (b) clean speech signals of microphone array together with the Target 1.
Applsci 10 01484 g008
Figure 9. The spatial coherence of noise signals of microphone array.
Applsci 10 01484 g009
Figure 10. Block diagram of the Multi-enhance voice services (EVS)-TDOA.
Applsci 10 01484 g010
Figure 11. Block diagram of the up-sampling (US)-Multi-EVS-TDOA.
Applsci 10 01484 g011
Figure 12. Performance comparison of multi-channel speech coding: (a) Perceptual evaluation of speech quality (PESQ) results; (b) short-time objective intelligibility (STOI) results; (c) segment SNR (SSNR) results; (d) logarithm spectral distortion (LSD) results.
Applsci 10 01484 g012
Figure 13. The block diagram of the multi-channel speech enhancement method: (a) Weighted prediction error (WPE)-based dereverberation method; (b) complex Gaussian mixture model-based minimum variance distortionless response (CGMM-MVDR)-based denoising method; (c) WPE-CGMM-MVDR-based dereverberation and denoising method.
Applsci 10 01484 g013
Figure 14. The average evaluation results of multi-channel speech enhancement. (a) PESQ results; (b) STOI results; (c) SSNR improvement results; (d) LSD results.
Applsci 10 01484 g014
Table 1. The inputs and outputs of the MASS.
InputsOutputs
room size
source location
microphone array location
signal-to-noise ratio (SNR)
absorption factor
clean speech (for target speech source)
noise signal (for diffuse noise)
microphone array clean speech
microphone array clean speech with reverberation
microphone array noisy speech
microphone array noisy speech with reverberation
microphone array noise signals
Table 2. Comparison of the time difference of arrival (TDOA) for theoretical and simulated values.
Theoretical TDOASimulated TDOA
1.3113 samplesabout 1.3 samples
Table 3. The average improvement results in real speech data (The best performing methods are shown in bold).
SNR [dB]RT60 [ms]CNN_SMARDCNN_MCSCNN_MASS
ΔPΔSΔPΔSΔPΔS
-57000.42890.29510.43450.30210.45020.3101
5000.66210.27060.65980.29890.67890.3012
3000.77310.31510.79020.32010.80670.3395
07000.56450.18920.57620.18030.58010.1992
5000.65870.20410.64120.21540.66210.2201
3000.65980.22630.67010.23120.66890.2298
57000.36780.14990.35620.14280.36090.1501
5000.47260.12750.48930.13640.50110.1468
3000.49870.13450.50980.14520.51260.1402
107000.32510.09240.31780.09510.33650.0899
5000.44820.08980.45570.09420.44060.1021
3000.50410.10920.51890.11250.52080.1198
Table 4. Applications of the MASS.
ApplicationMulti-Channel Speech CodingMulti-Channel Speech Enhancement
InputClean speechNoisy speech
Clean speech with reverberation
Noisy speech with reverberation

