Abstract
In this work, we generate optical vortices from the supercontinuum output of an ultrafast laser interacting with a micro-structured fiber. Using a segmented spatial light modulator, multiple vortices are designed and dynamically generated and shifted in order to observe their superposition in the image plane. It is shown that single-color patterns of exquisite complexity can be generated across a wide frequency range. Multi-color interference patterns are experimentally generated and compared to the results of computer simulations. Multiple vortices of varying colors are also generated and independently controlled, demonstrating that no spatial interference occurs. Experimental results are compared with theoretical and numerical simulations, showing excellent agreement.
1. Introduction
There has been a great interest in the propagation and properties of optical vortices over the last few decades [1,2]. With the prediction and subsequent demonstration that vortex beams carry orbital angular momentum [3], vortices have found a wide range of applications, such as optical trapping [4,5], quantum information processing [6,7], microscopy imaging [8,9] and laser micromachining [10,11]. Their generation has been proposed through interferometric setups [12], by using spiral phase plates [13] or in general, by using birefringent elements [1], where the spatial light modulator (SLM) is a popular choice as it offers dynamic control of vortex properties [14]. These advances allow for research under wide range of conditions, in this case, working with ultrashort laser pulses.
Femtosecond light pulses allow for the generation of optical vortices with high energy and ultrashort temporal profiles [15], crucial to generating a supercontinuum and probing other nonlinear phenomena. Femtosecond vortices have found their main applications in subwavelength nonlinear microscopy [16] and femtosecond micro–nano manipulation [17], and their production has been recently studied by several groups [10,18,19]. Rapid technological improvements in supercontinuum generation (SCG), particularly with microstructured fiber, have sparked this development. With the unique ability to generate a wide spectral range of coherent light from a femtosecond laser of modest power (a mode-locked oscillator itself is sufficient), SCG fiber sources are opening the door to exciting new physics [20]. Combining a spatial light modulator with SCG sources is attractive, since it permits the production of vortex beams of varying color [21]. Vortex generation using polychromatic and SCG sources has been explored by Berry [22,23], Tokizane et al. [24] and Bharat et al. [25]. In this paper, we create an optical system of unique versatility. In particular, we demonstrate that with the use of a large aperture SLM, multiple vortices may be produced and made to interfere in the focal plane of a lens. Indeed, each section of the SLM acts as an independent modulator, allowing one to precisely control the generation and propagation dynamics of each vortex beam. Bandpass filters may be employed in front of each segment, generating spectrally separate vortices of arbitrary charge. These engineered femtosecond white-light vortex beams are programmable, tunable, extremely high quality, yet still user-friendly. Patterns of exquisite complexity are produced and compared with numerical modeling based on the Huygens–Fresnel wavelet theory.
In Section 2, we present the theoretical expressions, simulations and experimental setup for combining femtosecond vortices with SCG. In Section 3, the results from our experiments are presented, showing agreement with the simulations and leading to the discussion section and to our conclusions, presented in Section 4 and Section 5, respectively.
2. Materials and Methods
The theoretical underpinnings of optical vortices have been studied by several groups over the years [26]. In this section, we present a brief synopsis of their derivations with a particular emphasis on the nature of interference between vortices. Then, a numerical simulation based on this theory and the proposed experimental setup are described.
2.1. Analytic Solutions
Following the discussion from Berry [23] for the propagation of the vortex, the transverse wavevectors follow the Poynting vector as it spirals around the azimuth. The wave can be written as a superposition of plane waves with the transverse wavevectors for a number of phase steps all the way around the azimuth. The wave is then written as a summation over the transverse wavevectors, expressed as
As the number of phase steps approaches infinity, or in the limit as around the azimuth, the summation can be replaced as an integral over all transverse wavevectors, K
Considering the orthogonality relation between the basis functions, the amplitude Am can be determined as a plane wave with the added vortex phase from the near field,
Multiplying both sides of Equation (2) by , and integrating over R, at z = 0
The expression from Equation (3) is then solved for the amplitude, and the remaining integral can be solved in terms of Bessel functions,
where is a Bessel function of the first kind, implemented as , where m is the vortex charge and θ is the azimuth angle. Equation (4) represents the amplitude of the wave, which can then be substituted into the propagating paraxial wave, where , using the approximation for a paraxial wave. The plane wave can then be rewritten as
where , is the combination of half-integer Bessel functions.
Then, the superposition of a pair of vortices leads to the intensity contributions from each vortex and , as well as the interference term that governs the interference pattern, with . The latter term can be determined by Equation (5), where the phase difference arises from the difference in the Bessel functions. The phase difference will then have a dependence on the charge of the vortex in addition to the length of propagation and initial phase. The interference of two vortices is solved analytically by writing and , as
and
Then, the intensity of their superposition would be expressed as
Since the electric field , the intensity term , and the expected interference pattern would present 2m fringes around the azimuthal angle. When the two vortices interact, the resulting interference depends on the charge of the vortices, as presented in the numerical simulations.
2.2. Numerical Simulations
In order to determine the far-field amplitude and phase distributions of vortex beams, a computer program was used to simulate the propagation of an incident beam with an arbitrary amplitude and phase distribution through a focusing lens. The code, written in Wolfram Mathematica, sums the Huygens wavelet contributions using the Fresnel approximation from the near field to points in the far field [22]. In this paper, we model a flattop beam passing through a spiral phase plate and a perfect focusing lens, however, the computer code can be used to calculate the effect of a wide range of beam profiles, phase distributions and optical aberrations. Since we use an SLM to imprint phase patterns onto an incident beam, the phase distribution is written modulo 2π, allowing for the full use of the dynamic range of the SLM in the zero to 2π range, while still allowing for the equivalent of arbitrarily high phases to be expressed. For extremely short pulses, where the number of optical cycles in the pulse is comparable to the value of the charge m, using the full phase pattern would result in a temporal “walk-off” of the different phase-shifted portions of the beam within the focal region. Using the modulo 2π phase has the added benefit of limiting these ultrashort pulse width effects. In Figure 1, we present an example of the code and output of the simulations done in Wolfram Mathematica.
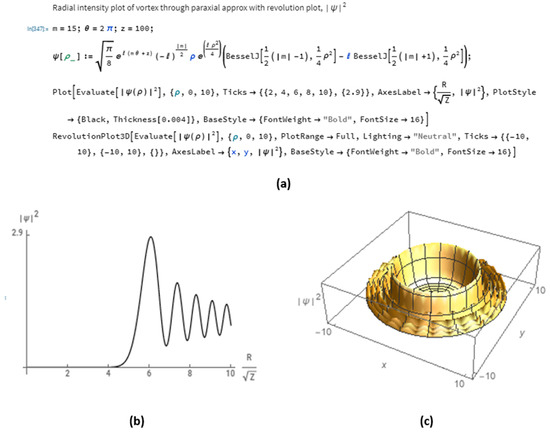
Figure 1.
Vortex simulation in Mathematica. (a) Code of paraxial approximation to generate (b) the intensity plot and (c) the 3D pattern of a focused vortex.
The program from Figure 1a computes the radial intensity plot of a vortex through paraxial approximation using Equation (5), and computing . Figure 1b,c correspond to the 2D and 3D plots of the radial intensity of a vortex with a topological charge , computed with respect to a horizontal rate , respectively. The superposition of a pair of vortices is simulated by implementing code that allows the visualization of the intensity profile of various charge vortices limited by a Gaussian beam profile and then computes their interference, based on Equations (6)–(8). The simulated intensity patterns are presented in Figure 2 and Figure 3, for equally and opposite charged coplanar and non-coplanar vortices, respectively. In these simulations, no free parameters are used, in order to compare the experimental results directly with the simulations presented in this section.
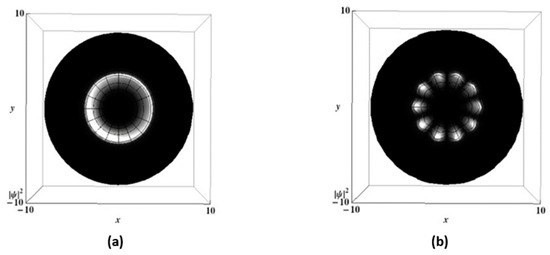
Figure 2.
Superposition of coplanar optical vortices. (a) Equally charged with
overlapped to produce an optical vortex with constructive interference; (b) Oppositely charged vortices with and overlapped to produce 2m interference fringes.
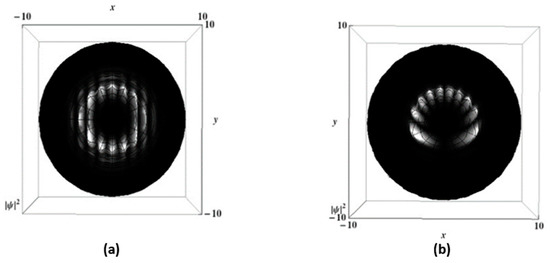
Figure 3.
Superposition of optical vortices with a phase tilt. (a) Equally charged with
overlapped to produce interference fringes; (b) Oppositely charged vortices with and overlapped to produce a firebird pattern.
For two equally charged coplanar vortices, there should only be constructive interference since both vortices are identical, as presented in Figure 2a. When both coplanar vortices have opposite charges, there should be destructive interference producing a number of fringes around the vortex equal to twice the charge, as presented in Figure 2b.
A phase tilt can be added to the numerical results to better simulate what occurs in the laboratory, where individual vortices intersect at a small angle. For equally charged vortices, the phase tilt causes interference fringes to appear in the vortex. The number of fringes increases as the phase tilt does. These fringes run along one direction, as the typical fringes seen when two coherent and in-phase laser beams intersect. When two oppositely charged vortices are superimposed with a phase tilt, the result is an interference pattern that has varying spacing between the interference fringes around the vortex. This pattern is known as the firebird pattern, becoming more pronounced as the phase tilt increases. Figure 3 shows the described interference patterns.
It is also of interest to obtain the intensity patterns of the superposition of multiple wavelength vortices. Through the use of a blazed fork pattern to diffract vortices into the first order, a wide range of wavelengths can be used to generate quality vortices without the need for multiple spatial light modulators. Therefore, the full spectrum of the supercontinuum light source can be used to either selectively pick the desired wavelength of a vortex or to generate multiple vortices. If the full supercontinuum spectrum of wavelengths is incident on the SLM, many vortices are generated and diffracted into the first order. While each vortex of different wavelength would have a slightly different size and position, all vortices would overlap to some extent. Figure 4 presents a simulated supercontinuum vortex generated by the superposition of individual charge ten vortices with wavelengths λ = 520 nm, 570 nm, 600 nm and 650 nm. This image was generated with a custom computer code written in the Interactive Data Language (IDL), previously used to demonstrate excellent comparisons with experiment for extremely detailed patterns [27].
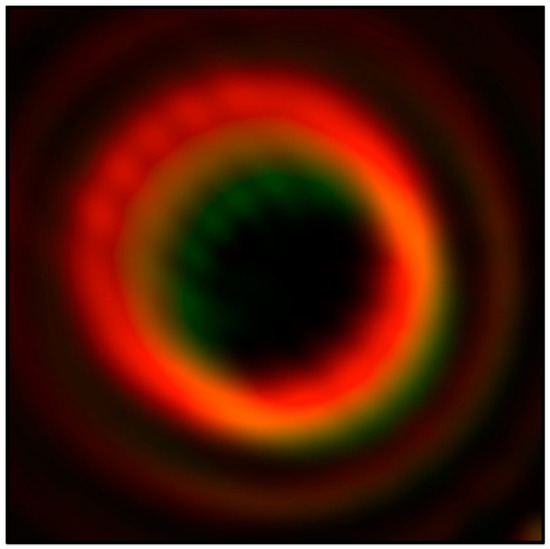
Figure 4.
Simulated supercontinuum vortex generated from the superposition of individual vortices with wavelengths λ = 520 nm, 570 nm, 600 nm and 650 nm.
2.3. Experimental Setup
The experimental setup for generating white-light vortices consists of a femtosecond oscillator, a microstructured photonic crystal fiber, a two-dimensional SLM and various detectors, as depicted in Figure 5. These devices are arranged in a Fourier lens system with the SLM in the Fourier plane to generate optical vortices in the image plane. The laser oscillator is a Nd:YAG pumped Ti:Sapphire oscillator emitting at a center wavelength of 800 nm. This laser generates ultrashort pulses when mode-locked with a 20 fs duration. Immediately after the oscillator, the beam passes through a pulse-shaping compressor, essential for optimizing the super-continuum output by pre-chirping the input pulse. Before the beam is coupled into the microstructured fiber, steering mirrors and a waveplate are used to ensure a level and horizontally polarized beam. A 20X microscope objective lens is mounted onto an XYZ translation stage to couple the beam into the nonlinear photonic crystal fiber (NKT Photonics FemtoWhite 800), mounted on a similar stage. The fiber consists of a honeycomb structure with a central core surrounded by air gaps. The core of the fiber is 1.8 ± 0.3 µm, allowing a single transverse mode and a nonlinear interaction through the length of the fiber, which produces a broad spectral bandwidth from 500 nm to over 1000 nm. The Femtowhite 800 fiber is designed to work optimally with a Ti:Sapphire oscillator.
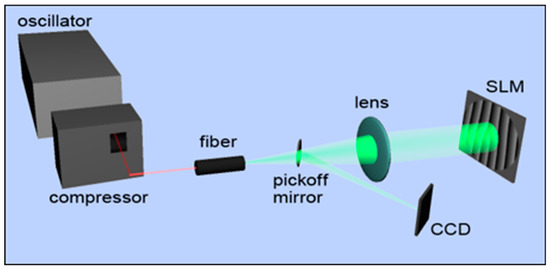
Figure 5.
Experimental setup for generation of white-light vortices from a femtosecond source, with a spatial light modulator.
The coherent supercontinuum beam exiting the fiber then travels through a 4f Fourier lens system. The output light expanding from the fiber is collimated with a 70 cm focal length lens, and is incident onto a Hamamatsu X8267-14DB two-dimensional SLM, located at 70 cm from the lens. This SLM has a pixel array of 768 × 768 active pixels, with a pixel size of 26 µm2 and a diffraction efficiency above 70% for a blazed grating conformed by a four-pixel sawtooth phase lattice. Its 2π phase modulation depends upon the wavelength, it requires a gray level scale from 0 to 97 for 540 nm, increasing to 228 levels for 900 nm [28]. Since the SLM has a large aperture (2 cm × 2 cm), various colored filters can be placed in front of it to segment the SLM by color, or the entire supercontinuum spectrum can be used to generate white light vortices. The modulated light is reflected back through the f = 70 cm lens and onto a pick-off mirror that reflects the light to the CCD detector in the imaging plane. This well-known technique creates a far-field pattern at the CCD that is a Fourier transform of the field at the SLM, as presented in Figure 6.
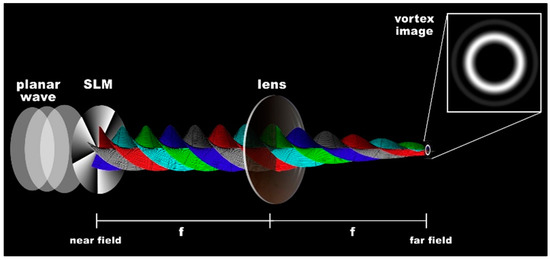
Figure 6.
Spatial modulation in the far field from phase modulation in the near field with a 2f system.
Various detectors are used to collect the white light vortex data. The supercontinuum spectrum is collected using an Ocean Optics spectrum analyzer (USB2000 + XR), the vortex intensity image (in false color) is captured using a DataRay WinCamD-UHR and the colored optical vortices are recorded with a 24.7 × 15.6 mm CCD sensor in a Nikon D70s DSLR camera.
The optimized supercontinuum spectrum ranges from 500 nm to over 1000 nm in the near IR. Various experiments call for the use of filters to narrow down the spectrum incident on the SLM. A variable wavelength filter placed directly after the fiber may be used to select a narrow bandwidth, approximately 20 nm wide, that can be centered anywhere over the entire range of the supercontinuum. Red and green filters (Edmund Optics NT46-139 and NT30-634) that transmit a larger region of the spectrum are employed as well. These filters can be placed side-by-side directly in front of the SLM to generate independently controllable vortices of different color.
The supercontinuum spectrum can be altered by changing the power or pulse shape of the input beam into the fiber. By lowering the power of the input beam, a simple method is provided to switch between a broadband supercontinuum light source from the fiber and the narrowband (~40 nm) femtosecond source. In the low-power case, the fiber acts merely as a spatial filter for the mode locked laser. This is used as a quick reference to view the difference between SCG vortex interference and narrowband interference, and it is also possible to un-modelock the laser to compare with the CW case. When the SCG vortices are not filtered to a narrow bandwidth, the various colors will diffract at different angles, giving the vortex image a spatial chirp. With a CW beam, there is no spatial chirp.
Optical vortices are generated by encoded phase patterns onto the SLM resulting in phase modulation of the SCG beam. To generate a single vortex, a forked grating pattern is displayed on the 768 × 768 pixel active region of the SLM, generated by a LabView VI that allows for real time control of the blazed grating and spiral phase (vortex charge). Multiple vortices can also be displayed on the SLM, allowing for independent control of different vortices. Figure 7 shows the VI with a sample vortex pattern that is displayed onto the SLM.
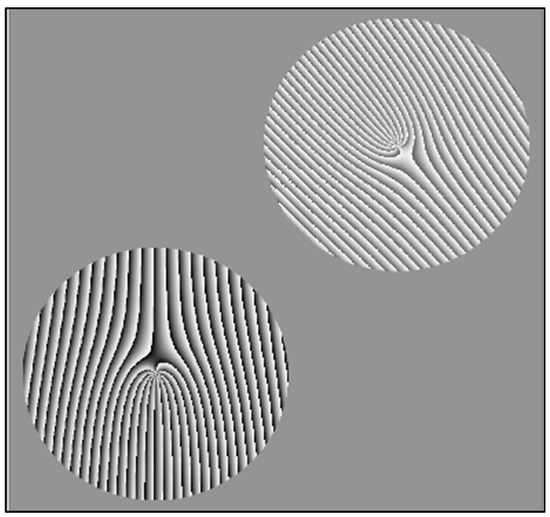
Figure 7.
LabView VI for vortex manipulation. Patterns are displayed on separate sections of the SLM, and each pattern is calibrated for a particular wavelength, with different grayscale.
The LabView VI generates a vortex pattern through the combination of a blazed grating with a spiral phase. The blazed grating is set from 0 to 2π through the grayscale of the SLM, and this allows for the vortex to be diffracted away from the zeroth order. The SLM has been calibrated for various wavelengths in order to display the correct gray level scale for the wavelength incident on the vortex pattern. The size of the blazed grating in both the x and y-direction, the charge of the spiral phase plate, the gray level scale, the quantity of vortex patterns displayed onto the SLM and their location can all be controlled through the LabView VI. This provides ultimate flexibility in generating multiple vortices of arbitrary size, charge and location.
The broad spectrum of the supercontinuum light allows for the use of optical filters for selecting the color of the vortex. Multiple filters can be used, each covering a small section of the SLM that matches a specific vortex pattern. Since the Hamamatsu SLM has a large active area and high-resolution, it is possible to separate different regions of the SLM as effectively independent modulators. This is used to demonstrate vortex interference, whereby two vortices are created on each half of the SLM, then made to interfere in the image plane. Since the two sections of the SLM are independently controllable by the LabView code, vortex generation of equal or unequal charge is possible. Additionally, arbitrary blazed gratings can be added to each vortex controlling their location in the image plane. This setup can produce multiple vortices, each at different wavelengths with the use of only a single light source. With this experimental setup we have been able to produce up to six independent vortices with full control. For clarity, we present results here for only a pair of independent vortices.
3. Results
Here, the results from the fully implemented experimental setup are presented. Multi-colored vortices are created, color-tunable vortices are individually tested and their superposition is captured. These results are discussed and compared to analytical solutions and the Huygens–Fresnel computer simulations.
3.1. Multi-Color Vortices
Using the entire spectrum from the supercontinuum source, a multi-colored vortex of charge 10 is demonstrated in Figure 8. The spectrum is slightly smeared out as a result of the blazed grating added to the vortex (to separate the vortex from the zeroth order bleed-through). The vortex in Figure 8 agrees well with the theoretical expectation seen in Figure 4.
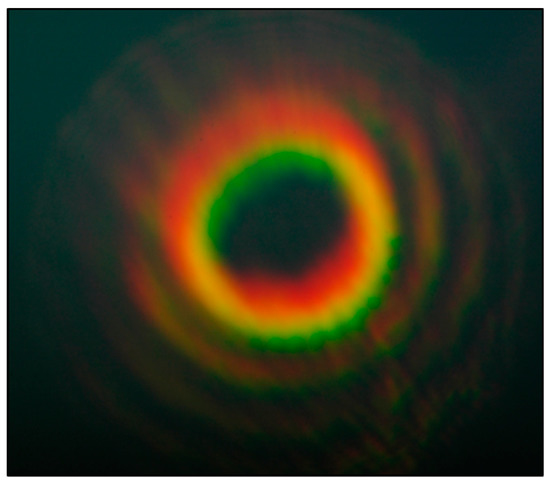
Figure 8.
Multi-color vortex of charge +10. The color offset is a result of the diffraction into the first order.
3.2. Vortex Interference
Interference between two vortices can produce interesting and complex patterns. An experimental example of this is shown in Figure 9, where two vortices with a topological charge of m = 10 and m = −10 are made to interfere. The result from the IDL numerical model for a broad spectrum is presented for direct comparison, showing good agreement.
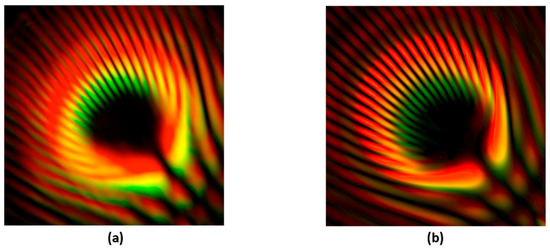
Figure 9.
Interference of two spatially dispersed multi-color vortices of opposite charge (+10 and −10), (a) experimental result; (b) numerical modeling.
The numerical result is generated by combining the contributions of three distinct colors to the vortex pattern. An even more accurate image could easily be generated by including more colors, and by incorporating the supercontinuum spectrum, the SLM spectral efficiency and the CCD efficiency in the calculation of the relative intensity of each color.
3.3. Color-Tunable Vortices
Chromatic effects in white-light vortices can be troublesome [21]. One option is filtering, whereby the broad spectrum exiting the supercontinuum fiber may be spectrally filtered to pick out one particular color. In this example, we used a variable wavelength filter to isolate red or green light. The SLM is easily calibrated for either of these wavelengths, and independent vortices are produced to demonstrate interference, as shown in Figure 10. The SLM is AR coated for 800 nm, which means that at the green wavelengths, the amount of zeroth order reflection substantially increases. But since we typically use the first order diffraction, this only affects the brightness of the vortices and not their quality. In this result, the entire SLM is illuminated with either red or green light. The SLM generates two vortices of opposite charge that interfere in the image plane of the CCD. The experimental results are in excellent agreement with the numerical model from Figure 3b.
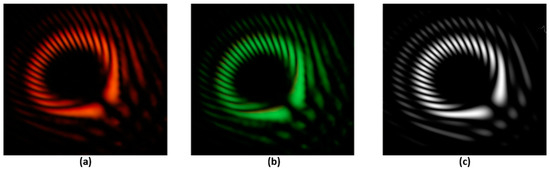
Figure 10.
Interference from oppositely charged vortices (m = 10 and m = −10), (a) red vortex interference; (b) green vortex interference; and (c) numerical prediction from the IDL code.
For experiments relying on the suppression of interference, we developed an approach for generating two independent vortices of different color. Spectral transmission filters are placed in front of the SLM to section off two halves (one for red, one for green). Each vortex is then independently controllable, and the color is determined by the particular filter. This system allows us to generate perfect integral vortices with high efficiency, since each half of the SLM can be addressed with a different gray level. For instance, on an 8-bit grayscale (0 to 255), the red vortex with a 630 nm center wavelength has a gray level that goes from 0 to 135, which corresponds to 0 to 2π. The green vortex with a 540 nm center wavelength has a gray level that goes from 0 to 97, which for this wavelength corresponds to 0 to 2π. The red and green vortices are shown in the lower panels of Figure 11. In the upper panels, a red vortex is held stationary while a second red vortex passes through it. Not surprisingly, interference fringes develop as the red vortices overlap. In the lower panels, the green vortex is held stationary while the red vortex passes through it. Note that when the green and red vortices overlap there is, of course, no interference pattern, but merely a superposition of red and green, making yellow. Furthermore, since the vortex diameter may be controlled independently of the charge, it is possible to generate two or more distinct vortices that can have equal or unequal charge but still have the same size. This could be a huge asset for two-particle trapping experiments that require true independent control, with no crosstalk between trapping regions.
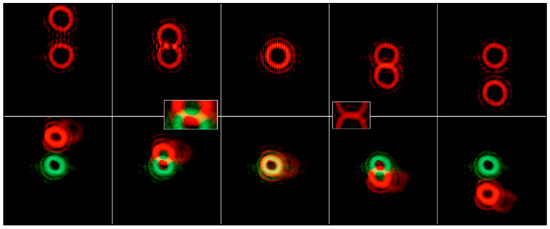
Figure 11.
Left to right: vortices passing through each other. Above, red vortices pass through each other and interfere. Below, red and green vortices pass through each other and superimpose to make yellow. The insets show a close-up view of the overlap regions.
The interference of a pair of vortices of same color, like the one seen above in Figure 11, is tested when using the same and opposite topological charges. This sequence is seen in Supplementary Material Figure S1.
4. Discussion
The production and interference of multiple vortex beams obeys the laws of classical optics. Namely, the wavelet approach of Huygens and Fresnel clearly predicts the experimental results presented herein. In particular, it is worth noting that the vortex beam interference demonstrated in Figure S1 matches the theoretical prediction nearly exactly, including the number of primary and secondary lobes, and the relative distribution of energy. This agreement is not only a testament to the theory, but also to the experimental system: the fiber-lens arrangement does an excellent job of generating a very near plane-wave, and the 100% fill-factor SLM generates modified beams that are largely free of unwanted phase structure. This ability to control multiple vortices simultaneously has broad appeal. For instance, it is possible to generate a series of vortices, where their angular momentum attracts microparticles along the ring. With several vortices operating in conjunction, this can lead to a microfluidic pump [29]. In beam and pulse shaping, the loss in mutual coherence allows multiple vortices to be superimposed. Thus, multiple vortices could be used for spatial beam shaping.
In Stimulated Emission Depletion (STED) microscopy, the vortex singularity is utilized to deplete the fluorescence in the surrounding area of a sample before exciting its center, which increases the resolution by only observing small parts of the sample at once [30]. This idea has been broadened to multi-spectral STED, where multiple vortex beams of different wavelengths are used to deplete fluorophores that are sensitive to each wavelength used for the vortices. This approach allows a single SCG source and SLM to be used to generate N vortices, limited by bandwidth of each and resolution required for the vortex generation pattern.
As it was demonstrated, the overlap of vortices can lead to rich interference patterns, which could be beneficial for particular trapping schemes. For instance, the sculpted profile of fringes could be used to separate particles of different size, or its center could be used as a trap exit. If interference fringes are instead detrimental, they can be removed entirely by the use of separate color vortices. These vortices can overlap without interfering which would permit, for instance, extremely precise control of potential wells. For trapping experiments in air or experiments with two-species Bose-Einstein Condensates, this could have broad appeal.
Perhaps the most impressive result here is the production of vortices with a miscalibrated SLM. That is, an SLM that is calibrated for green (0 to 2π), for example, will necessarily be miscalibrated for red (0 to 1.5π). This is problematic when zeroth order vortices are created with a simple spiral phase plate; the phase plate will have a phase range from zero to 1.5π, leading to a fractional vortex. However, with the addition of a blazed diffraction grating, used to shift the vortex to the first order, this problem disappears. That is, a spiral phase plate that goes from 0 to 1.5π, when combined with a blazed grating that also goes from 0 to 1.5π, creates a nearly perfect vortex in the first order diffracted beam. The only difference between a miscalibrated forked grating and a properly calibrated forked grating is the amount of energy that is sent into the first order. In the miscalibrated case, the vortex will be dimmer, but will still be the same size, shape and quality as one generated with perfect calibration. In essence, a forked grating can produce vortices independent of the calibration of the SLM or the wavelength being used. In the SCG case, this explains the production of good quality vortex beams at wavelengths well outside of the calibration window. Even though the diffraction efficiency is low, the light that does make it to the first order creates a high-quality green, yellow or red vortex. This result has profound implications for the pulse shaping community. First, the precise calibration of SLMs appears to be unnecessary; it simply changes the diffraction efficiency of the device. Second, the use of the forked grating for multiple wavelengths simultaneously generates high-quality vortices, and third, the extension of standard SLMs to even longer wavelengths appear to be feasible. Namely, it was assumed that to be useful, an SLM had to deliver a 0 to 2π retardance at the wavelength of interest, and this becomes increasingly difficult as the wavelength increases. However, our results indicate that even a partial-wave retardance is sufficient to create proper vortices with a forked grating. Thus, SLMs can be extended well outside their design wavelengths, possibly opening the door to beam manipulation at novel wavelengths at the short or long end of the spectrum.
5. Conclusions
In this paper, we have demonstrated the generation and control of tunable multi-color optical vortices. Arbitrary charge, orientation and color are available with our approach. Furthermore, we have identified that by using a forked grating, good vortex production is still possible even with sub full-wave retardance. These techniques are versatile and robust, and could find wide application to a variety of physics experiments. For instance, the behavior of dual vortices undergoing nonlinear propagation is a means to study vortex–vortex coupling, which will have applications to cold atoms and BECs. Optical tweezers and optical trapping in air will both benefit from an ability to construct novel vortex beams for particle confinement. Quantum information schemes relying on wideband down-conversion could be enhanced by the ability to control a wide range of wavelengths simultaneously. Indeed there is a broad array of physics experiments that can be impacted by this technique.
Supplementary Materials
The following are available online at https://www.mdpi.com/2076-3417/10/6/1966/s1, Figure S1: Sequence showing vortex interference for vortices with (a) same and (b) opposite topological charges.
Author Contributions
Conceptualization, M.E.A.; methodology, M.E.A. and C.S.; validation, C.S. and J.L.C.; formal analysis, C.S. and A.S.; investigation, C.S., A.T., N.M.; resources, C.S. and A.S.; data curation, C.S., A.T., N.M.; writing—original draft preparation, C.S., M.E.A. and J.L.C.; writing—review and editing, M.E.A., A.S. and J.L.C.; visualization, C.S. and A.S.; supervision, M.E.A.; project administration, M.E.A. All authors have read and agreed to the published version of the manuscript.
Funding
This research was funded by the Blasker-Rose-Miah Fund of the San Diego Foundation.
Conflicts of Interest
The authors declare no conflict of interest.
References
- Zhan, Q. Cylindrical vector beams: From mathematical concepts to applications. Adv. Opt. Photon. 2009, 1, 1–57. [Google Scholar] [CrossRef]
- Zhu, L.; Wang, J. A review of multiple optical vortices generation: Methods and applications. Front. Optoelectron. 2019, 12, 52–68. [Google Scholar] [CrossRef]
- Allen, L.; Beijersbergen, M.W.; Spreeuw, R.J.C.; Woerdman, J.P. Orbital Angular-Momentum of Light and the Transformation of Laguerre-Gaussian Laser Modes. Phys. Rev. A 1992, 45, 8185–8189. [Google Scholar] [CrossRef]
- Gahagan, K.T.; Swartzlander, G.A. Optical vortex trapping of particles. Opt. Lett. 1996, 21, 827–829. [Google Scholar] [CrossRef]
- Li, L.; Chang, C.; Yuan, X.; Yuan, C.; Feng, S.; Nie, S.; Ding, J. Generation of optical vortex array along arbitrary curvilinear arrangement. Opt. Express 2018, 26, 9798–9812. [Google Scholar] [CrossRef]
- Mair, A.; Vaziri, A.; Weihs, G.; Zeilinger, A. Entanglement of the orbital angular momentum states of photons. Nature 2001, 412, 313–316. [Google Scholar] [CrossRef]
- Ndagano, B.; Nape, I.; Cox, M.A.; Rosales-Guzman, C.; Forbes, A. Creation and Detection of Vector Vortex Modes for Classical and Quantum Communication. J. Lightwave Technol. 2018, 36, 292–301. [Google Scholar] [CrossRef]
- Spektor, B.; Normatov, A.; Shamir, J. Singular beam microscopy. Appl. Opt. 2008, 47, A78–A87. [Google Scholar] [CrossRef]
- Serrano-Trujillo, A.; Anderson, M.E. Surface profilometry using vortex beams generated with a spatial light modulator. Opt. Commun. 2018, 427, 557–562. [Google Scholar] [CrossRef]
- Cheng, W.; Liu, X.; Polynkin, P. Simultaneously spatially and temporally focused femtosecond vortex beams for laser micromachining. J. Opt. Soc. Am. B 2018, 35, B16–B19. [Google Scholar] [CrossRef]
- Hnatovsky, C.; Shvedov, V.G.; Krolikowski, W.; Rode, A.V. Materials processing with a tightly focused femtosecond laser vortex pulse. Opt. Lett. 2010, 35, 3417–3419. [Google Scholar] [CrossRef] [PubMed]
- Tidwell, S.C.; Ford, D.H.; Kimura, W.D. Generating radially polarized beams interferometrically. Appl. Opt. 1990, 29, 2234–2239. [Google Scholar] [CrossRef] [PubMed]
- Kotlyar, V.V.; Almazov, A.A.; Khonina, S.N.; Soifer, V.A.; Elfstrom, H.; Turunen, J. Generation of phase singularity through diffracting a plane or Gaussian beam by a spiral phase plate. J. Opt. Soc. Am. A 2005, 22, 849–861. [Google Scholar] [CrossRef] [PubMed]
- Moreno, I.; Davis, J.A.; Womble-Dahl, T.; Cottrell, D.M. Azimuthal multiple-beam interference effects with combinations of vortex beams. Opt. Lett. 2015, 40, 2341–2344. [Google Scholar] [CrossRef]
- Yu-Chieh, L.; Yasuo, N.; Katsumi, M. Generation of intense femtosecond optical vortex pulses with blazed-phase grating in chirped-pulse amplification system of Ti:sapphire laser. Appl. Phys. B 2016, 122, 280. [Google Scholar]
- Nian, T.; Ling, F.; Min, G. Resolution and contrast enhancement of subtractive second harmonic generation microscopy with a circularly polarized vortex beam. Sci. Rep. 2015, 5, 1–8. [Google Scholar]
- Qiao, Z.; Kong, L.; Xie, G.; Qin, Z.; Yuan, P.; Qian, L.; Xu, X.; Xu, J.; Fan, D. Ultraclean femtosecond vortices from a tunable high-order transverse-mode femtosecond laser. Opt. Lett. 2017, 42, 2547–2550. [Google Scholar] [CrossRef]
- Mariyenko, I.G.; Strohaber, J.; Uiterwaal, C.J. Creation of optical vortices in femtosecond pulses. Opt. Express 2005, 13, 7599–7608. [Google Scholar] [CrossRef]
- Hansinger, P.; Maleshkov, G.; Garanovich, I.L.; Skryabin, D.V.; Neshev, D.N.; Dreischuh, A.; Paulus, G.G. White light generated by femtosecond optical vortex beams. J. Opt. Soc. Am. B 2016, 33, 681–690. [Google Scholar] [CrossRef]
- Alfano, R.R. The Supercontinuum Laser Source: Fundamentals with Updated References, 2nd ed.; Springer: New York, NY, USA, 2006; pp. 33–183. [Google Scholar]
- Leach, J.; Padgett, M.J. Observation of chromatic effects near a white-light vortex. New J. Phys. 2003, 5, 154. [Google Scholar] [CrossRef]
- Berry, M.V. Coloured phase singularities. New J. Phys. 2002, 4, 66.1–66.14. [Google Scholar] [CrossRef]
- Berry, M.V. Optical vortices evolving from helicoidal integer and fractional phase steps. Appl. Opt. 2004, 6, 259–268. [Google Scholar] [CrossRef]
- Tokizane, Y.; Oka, K.; Morita, R. Supercontinuum optical vortex pulse generation without spatial or topological-charge dispersion. Opt. Express 2009, 17, 14517–14525. [Google Scholar] [CrossRef] [PubMed]
- Bharat, K.Y.; Stuti, J.; Hem, C.K. Experimental observation of the effect of generic singularities in polychromatic dark hollow beams. Opt. Lett. 2014, 39, 4966–4969. [Google Scholar]
- Padgett, M.J. Orbital angular momentum 25 years on [Invited]. Opt. Express 2017, 25, 11265–11274. [Google Scholar] [CrossRef]
- Mitry, M.; Doughty, D.C.; Chaloupka, J.L.; Anderson, M.E. Experimental realization of the devil’s vortex Fresnel lens with a programmable spatial light modulator. Appl. Opt. 2012, 51, 4103–4108. [Google Scholar] [CrossRef]
- Hamamatsu Photonics, K.K. SLM Module. In Programmable Phase Modulator; Hamamatsu: Iwata, Japan, 2003. [Google Scholar]
- Ladavac, K.; Grier, D.G. Microoptomechanical pumps assembled and driven by holographic optical vortex arrays. Opt. Exp. 2004, 12, 1144–1149. [Google Scholar] [CrossRef]
- Leutenegger, M.; Eggeling, C.; Hell, S.W. Analytical description of STED microscopy performance. Opt. Express 2010, 18, 26417–26429. [Google Scholar] [CrossRef]


© 2020 by the authors. Licensee MDPI, Basel, Switzerland. This article is an open access article distributed under the terms and conditions of the Creative Commons Attribution (CC BY) license (http://creativecommons.org/licenses/by/4.0/).