Abstract
Atrazine (ATZ) is one of the most heavily used types of herbicide that is currently applied in the agricultural industry all around the world, especially Australia and the United States. This study investigates the effect of atrazine contamination on the mechanical characteristics of two Western Australian natural clays and one commercial type of clay. A series of the Atterberg limit, compaction, and torsional ring shear tests were performed on the clays contaminated with 2, 4, and 6% atrazine content. The results showed that increasing the atrazine content led to a reduction in both liquid limit (LL) and plastic (PL) of the tested soils. Similarly, the optimum moisture content (OMC) and maximum dry density (MDD) decreased by increasing the atrazine in all tested clays. The ring shear results showed that the peak shear strength and residual stress ratio of the clays decreased by increasing the contamination. Also, the results showed that atrazine contamination caused an increase in cohesion and a decrease in the friction angle of the tested soils. Also, longer periods of contamination caused a reduction in strength characteristics of the tested soils.
1. Introduction
Every type of soil has its particular deficiency that should be improved to be applicable in various projects. The mechanical behaviour of soil can be improved using addition of additives. Previous studies showed that characteristics of soils such as shear strength, compaction, compressibility, and permeability can be improved using additives such as fibre, fly ash, and slag [1,2,3,4,5,6,7,8,9,10,11,12,13,14].
Western Australia is the largest grain-producing state in Australia that, due to the application of a wide range of herbicides, is known as one of the world’s most significant herbicide-affected areas [12]. Atrazine (ATZ) is one of the most heavily used types of herbicide that is currently widely applied in the agricultural operations of Western Australia [15,16,17,18]. Therefore, the soil in this state is highly prone to exposure to atrazine due to agricultural operations such as storage, carrying, and application by pest control companies or users [19]. The previous reports proved this hypothesis by recording a high level of atrazine concentration (≤2000 μg/L) in an urban water table located in Perth metro, Western Australia [19,20,21,22]. It was reported that atrazine entered the groundwater from a depot belonging to a pest control company [19]. Shear strength and residual shear strength are important parameters in ground improvement and stability analysis of the soil. The Perth is a fast-growing city in Western Australia and the transportation systems and construction industry is expanding. Therefore, understanding the effects of contamination on strength characteristics of the soils in this area is a pivotal matter.
Previous studies investigated the effects of contamination on mechanical characteristics of the fine-grained and coarse-grained soil [20,21,22,23,24,25,26,27,28,29,30,31,32,33,34,35,36]. However, to date, no studies have been performed on the effects of herbicides on the mechanical characteristics of soil. This study seeks to investigate the effects of atrazine contamination on the mechanical characteristics of two Western Australian natural clays and one type of commercial clay.
2. Study Area and Site Investigations
The study area is within the Perth metro area, the capital of Western Australia, located in the south west of this state. This area is in Perth basin in the western part of the Darling fault with its eastern part extended to the Darling Plateau (Yilgarn Craton) [37]. Figure 1 illustrates an overview of the study area. Also, Figure 1 illustrates an overview of pest control depots as potential areas for atrazine contamination. The site investigations in the observed atrazine-contaminated area (Dianella site) show that the soil in this area is mainly of a coarse-grained nature (mainly sand).
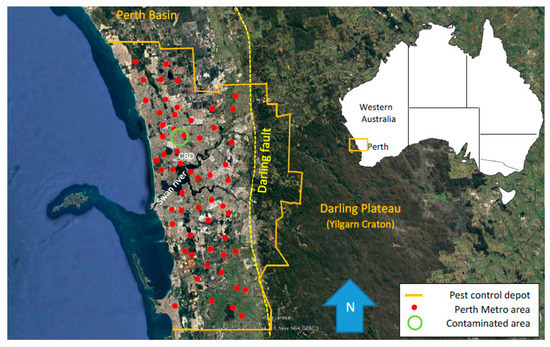
Figure 1.
Depot pest control locations in Perth (idea from [39]) and contaminated groundwater spots by atrazine [40].
A review of current literature on the effects of contamination on the mechanical characteristics of soil showed that the studies in contaminated soil have mainly been conducted on clayey soils ([28,30,31] amongst others). This huge body of literature indicates that contamination has almost no impact on coarse-grained soils due to their relatively high hydraulic conductivity characteristic. In fact, a permeable soil causes contamination to infiltrate to groundwater and no interactions occur. Also, the recorded contaminated groundwater in this area is another proof for this fact. Therefore, the sites contained clayey soils were considered for the field investigations. According to [38], the Guildford formation is a clayey formation that is mainly located in the eastern and southern parts of Perth. Therefore, field investigations were mainly focused in this region.
The field investigations in the southern suburbs showed that some parts of the two areas: Armadale and Rockingham contain the clayey soil. Also, further studies showed that due to the rural nature of a large part of these two areas, many pest control companies currently provide services for the farms, gardens, and parks in these areas. Therefore, these two areas were selected as the most prone to atrazine contamination and the soils were collected from these areas. Figure 2 illustrates the locations of the investigated sites.
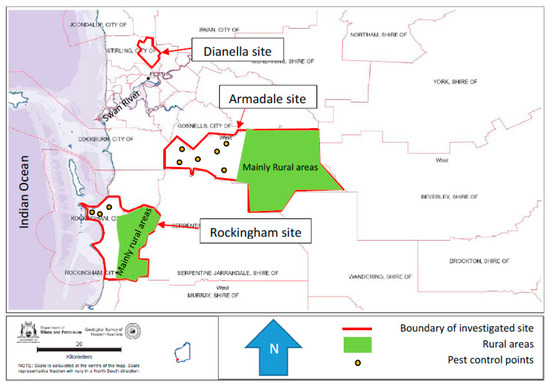
Figure 2.
Investigated spots in southern parts of the Perth [41].
3. Methodology
3.1. Used Materials
The collected soils from the Armadale and Rockingham sites had an amber and blackish colour and they were named Amber Clay (AC) and Black Clay (BC) according to their colour, similar to [42]. Also, to control the consistency of the results, one type of commercially available clay was added to perform the study commonly known as kaolinite clay (KC). The kaolinite clay used had a white colour and was purchased from a local provider in Perth [43].
To figure out the physical properties of the specimens, particle size analysis and index properties tests were performed according to [44,45] respectively. Table 1 illustrates the results of the index properties and Figure 3 illustrates the results of the particle size distribution (PSD) of the used soils. The atrazine was purchased from 4farmers—a local herbicide provider— and has a viscosity of 501 cps at 20 °C.

Table 1.
Index characteristics of the investigated clays in this study.
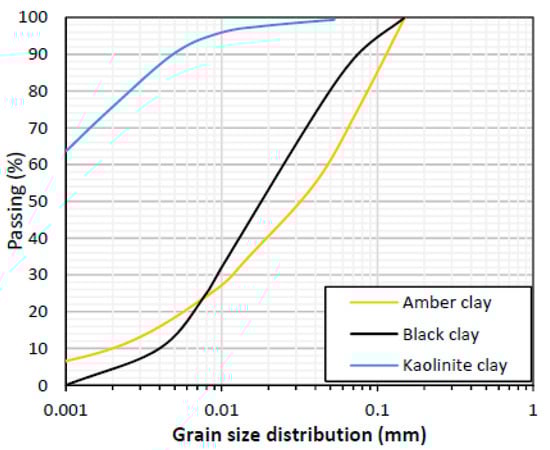
Figure 3.
Particle size distribution (PSD) of the amber clay, black clay and kaolinite clay.
3.2. Sample Preparation
The clays were collected from a depth of 0.5–1 m by digging (using auger) into the ground and removing the top soils. After collection, the laboratory soil contamination assessments showed that no herbicide contamination existed in the clays. After that, the natural clays were dried in an oven with a 105 ± 5 °C temperature for 2 h. They were then manually crushed and passed through a sieve No. 100 to have a uniform texture and to remove the clusters and agglomerated particles [31]. Three percentages of 2, 4, and 6% by dry weight of soil was considered to mix with the soil [27,31]. To contaminate clays, initially, the desired amount of soil was placed in a 50 mm layer in the tray and a predetermined volume of atrazine was sprayed on and thoroughly mixed in. The contaminated soil was then flattened, and the next layer of the soil was placed on the previous soil layer and the previous section repeated. After finishing the mixing process, the soil was placed in a sealed plastic bag and stored in a moisture and temperature control room for 7, 14, and 21 d to reach to an equilibrium condition [28,31,46].
A Bromhead torsional ring shear apparatus with a modified (knurled) top porous platen [47] was employed to investigate the shear strength characteristics of the contaminated soils [48]. This device has a container with an outer diameter of 100 mm, an inner diameter of the 70 mm and a height of 5 mm similar to [47,49,50]. To reduce the generation of excess pore water pressure and soil extrusion from the container during the test, samples were sheared at a very slow shearing rate of the 0.018 mm/min [47,48,49,50,51]. The specimens selectively were placed under three normal stresses (σ′n) of 100, 150 and 200 kPa [31,52,53,54] and left until the vertical strains become constant then shearing stage started. Figure 4 illustrates typical prepared specimens of amber, black, and kaolinite clay in this study. Also, a summary of the test design is illustrated in Table 2.
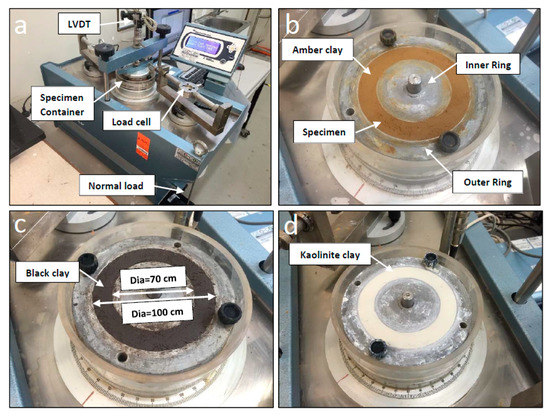
Figure 4.
(a) Torsional ring shear used to perform shear strength tests (b) amber clay specimen; (c) black clay; (d) a kaolinite clay specimen.
Table 2.
A summary of the designed tests in this study.
4. Microstructural Characterisations
To understand the main constituent minerals of the used clays, a series of X-ray powder diffraction tests (XRD) were performed. The results showed that similar to kaolinite clay, the main constituent of amber clay was kaolinite (K) and quartz (Q). The same compositions were observed in the black clay XRD results in addition to some traces of nontronite (N) and montmorillonite (M) as shown in Figure 5. In general, the XRD analysis on the tested clays showed that the tested clays belong to the kaolinite clay group.
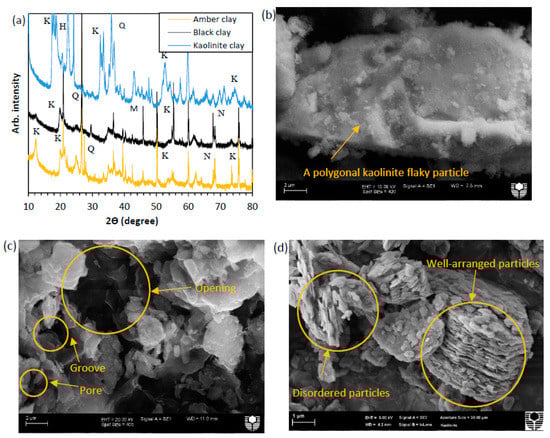
Figure 5.
(a) X-ray powder diffraction (XRD) tests and SEM analysis of (b) amber clay; (c) black clay; and (d) kaolinite clay.
The physical characteristics of the soil particles, such as shape and topography, have an effective role in the mechanical behaviour of the soil under different stresses or when exposed to contamination [46]. Therefore, a series of scanning electron microscopy (SEM) tests were performed on the used soils and results presented in Figure 5. The results show that the used clays mainly have disordered polygonal flaky particles with a series of grooves and openings in their surface.
5. Results and Discussion
5.1. Effect of Contamination on Atterberg Limit Characteristics
Atterberg limit tests were performed according to ASTM standard on AC, BC and KC contaminated at different atrazine content and the results were presented in Figure 6. As shown in Figure 6a, addition of 2% atrazine to the AC, BC and KC specimens decreased the liquid limit (LL) value from 62%, 58% and 58% to 60%, 86% and 56% respectively. The liquid limit value decreased even more by increasing the atrazine content to each specimen. For instance, in AC specimens an increase in atrazine contamination from 2% to 4% and 6% caused a reduction to 59% and 58% for LL values. This trend for BC specimens was similar, however in a greater range (i.e., 85% and 84%). The lowest values of the Atterberg limit tests belonged to the KC specimens. This value reduced to 55% and 53% after addition of the 4% and 6% atrazine. Similarly, the plastic limit values of the tested clays after addition of atrazine showed a decreasing trend, however in a lower range. As can be seen in Figure 6b, an increase in atrazine contamination from the range of 2% ≤ ATZ ≤ 6% caused a decrease in the range of 27% ≤ PL ≤ 30% for AC specimens. The PL value of the uncontaminated AC specimen was 31%. The PL value for BC specimen also showed a decreasing trend from 50% to 47% when 2% to 6% atrazine was added to the specimens respectively while the PL value for uncontaminated BC specimen was 51%. A similar trend for KC contaminated specimens was recorded. For instance, a PL range between 25% and 27% after the addition of 2% to 6% atrazine was recorded in the KC specimens while this value for uncontaminated soil was 28%. The reported results in this section is in good agreement with reported results by [27,31] where clays with similar constituent minerals to those in this study were used in their studies. Sridharan and Rao [55] indicated that in kaolinite clay, the mechanical parameters are the main governing factors to form the mechanical behaviour of the soil. Therefore, the observed LL and PL behaviour of the soil might be attributed to the viscosity of the atrazine. Since this herbicide possesses a high value of viscosity, increasing its contribution caused a lower surface tension of the clay particles [56,57,58,59] and lower LL and PL values for the specimens at higher percentages of ATZ.
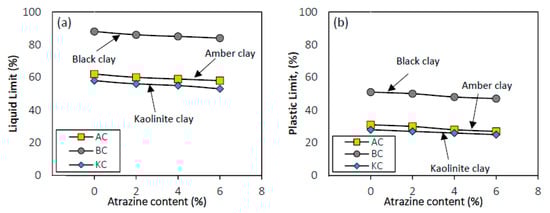
Figure 6.
Atterberg limit test results for Amber Clay (AC), Black Clay (BC), and Kaolinite Clay (KC) specimens contaminated at different Atrazine contents (a) Liquid Limit (LL) versus Atrazine content; (b) Plastic Limit (PL) versus Atrazine content.
5.2. Effect of Contamination on Compaction Parameters
A series of compaction tests were performed on AC, BC and KC specimens to investigate the effect of contamination on optimum moisture content (wopt) and maximum dry density (ɣdmax). As shown in Figure 7a, addition of atrazine resulted in a decreasing trend for OMC values of the contaminated mixtures. For instance, addition of the 2%, 4%, and 6% atrazine, caused a reduction from 20.12% to 18.74% for AC specimens while the OMC value for uncontaminated AC was 21.35%. The addition of atrazine showed an identical trend for BC and KC specimens. For instance, a decreasing OMC trend value in the range of 19.7% ≤ wopt ≤ 22.74% and 17.8% ≤ wopt ≤ 18.69% for the atrazine range of 2% ≤ ATZ ≤ 6% were recorded for BC and KC specimens. The OMC values for uncontaminated BC and KC values were 23.45% and 19.74%. Similarly, the recorded MDD values showed a decreasing trend with the addition of atrazine as shown in Figure 7b. For instance, the addition of 2%, 4%, and 6% atrazine increased the MDD values of the AC to 1.85, 1.82 and 1.78 T/m3. The identical increasing trend for BC and KC specimens were recorded. For example, the MDD for BC and KC were between 1.86 ≤ ɣdmax ≤ 1.98 T/m3 and 1.69 ≤ ɣdmax ≤ 1.81 T/m3 after addition of the atrazine between 2% ≤ ATZ ≤ 6% whereas the MDD for uncontaminated BC and KC were 1.91 and 1.72 T/m3. The acquired results in this section is in good agreement with [27]. Viscosity has a vital role in reducing the optimum moisture contents and maximum dry density. The used atrazine has a viscosity higher than water, and this characteristic can be the main reason for reduction in MDD and OMD when the atrazine content of the soil increased [60,61,62].
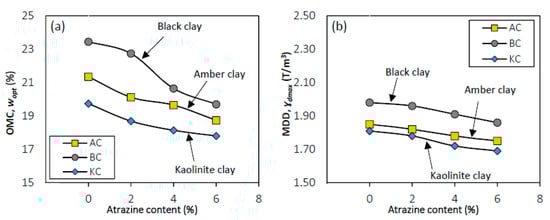
Figure 7.
Compaction test results for Amber Clay (AC), Black Clay (BC) and Kaolinite Clay (KC) specimens contaminated at different Atrazine contents (a) Optimum moisture content (OMC) versus Atrazine content; (b) Maximum dray density (MDD) versus Atrazine content.
5.3. Ring Shear Results
5.3.1. Effect of Contamination on Shear Strength
The effect of atrazine contents on peak shear strength (vp) of the AC, BC and KC specimens under 200 kPa normal stress were shown in Figure 8a. As can be seen, increasing the atrazine content of the specimens, reduced the peak shear strength of the specimens. For instance, the peak shear strength of the uncontaminated AC specimen was 0.279 MPa while this value reduced to 0.247, 0.2 and 0.15 MPa after addition of 2, 4, and 6% atrazine to the specimens. This trend was identical for BC and KC specimens after the addition of the same atrazine content. While the peak shear strength values of the BC and KC specimens were 0.345 and 0.2 MPa these values reduced to the range 0.16 ≤ vp ≤ 0.34 and 0.12 ≤ vp ≤ 0.20 after the addition of 2% ≤ ATZ ≤ 6%. The residual stress ratio showed a similar trend, as shown in Figure 8b. For instance, while the residual stress ratio for the uncontaminated AC, BC and KC specimens were 1.39, 1.72 and 0.99 respectively, these values decreased with the addition of atrazine content from 2% to 6%. The residual stress ratio for the AC specimens were between 1.24 and 0.76, BC specimens were between 1.70 and 0.80, and KC specimens were between 0.97 and 0.55.
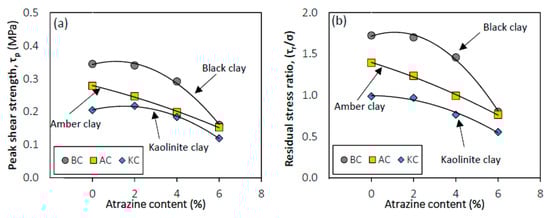
Figure 8.
Ring shear test results for AC, BC and KC specimens under 200 kPa normal stress for (a) peak shear stress versus atrazine content; (b) Residual stress ratio versus atrazine content.
Ratnaweera and Meegoda [26] indicated that the reduction of shear strength due to contamination might be attributed to the viscosity of pore fluid. They reported that shear strength of the soil reduced with increasing viscosity of pore fluid. It was mentioned that a viscos pore fluid not only fills the voids amongst the clay particles but also behaves like a lubricant agent and caused the particles to slide and lowers the shear strength value recorded. Ratnaweera and Meegoda [26] strengthen their discussion based on the [60,61] findings. They observed that increasing the temperature decreased the shear strength of the soil and concluded that the dependency of temperature with shear strength shows that viscosity has a vital role in reducing the shear strength of soil. The used atrazine has a viscosity higher than water, and this characteristic can be the main reason for reduced shear strength and residual stress ratio of the soil when the atrazine content of the soil increased. The presented results in this section was also confirmed by previous studies performed by [27,55,63,64].
5.3.2. Effect of Contamination on Cohesion and Friction Angle
Figure 9 shows the effect of the atrazine contents on the friction angle ($) and cohesion (C) of the AC, BC and KC specimens. As shown in Figure 9a, increasing the atrazine contents of the specimens caused a reduction in friction angle in all cases. For instance, the friction angle of the uncontaminated AC specimens was 27.32°, while this value decreased to 25.32° and 21.70° when 4% and 6% atrazine were added to the specimens. An identical trend was observed for BC and KC specimens. For instance, the friction angle was in the range of 23.40° ≤ $ ≤ 25.10° and 22.40° ≤ $ ≤ 24.30° for BC and KC specimens with an uncontaminated friction angle value of 28.80° and 26.80° respectively. Conversely, increasing the atrazine content showed an increasing trend on cohesion of the tested specimens. As can be seen from Figure 9b, a cohesion value of 6.4, 8.6 and 4.7 kPa for uncontaminated AC, BC and KC specimens were recorded while this value increased to 7.8 ≤ C ≤ 9.5 kPa, 10.2 ≤ C ≤ 12.6 kPa, and 6.3 ≤ C ≤ 7.2 kPa when 4% to 6% atrazine was added to the AC, BC and KC specimens respectively. The reported results in this section has a good agreement with reported results by [31]. Increasing the viscosity of the clays caused a lower surface tension of the clay particles [57,58] lower values of the friction angle, and greater values of cohesion at higher percentages of ATZ.
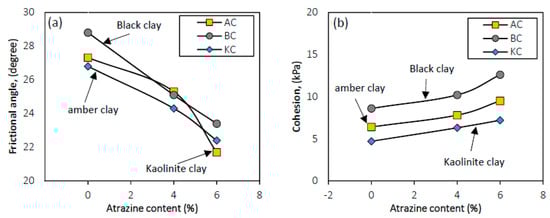
Figure 9.
Effect of atrazine contamination on (a) Friction angle; (b) cohesion.
5.3.3. Effect of Duration of the Contamination
Figure 10 illustrates the effect of 7, 14, and 21 d duration of contamination on peak shear strength and residual stress ratio of the tested AC, BC, and KC specimens. As can be seen in Figure 10a increasing the duration of the contamination slightly decreased the shear strength of the tested specimens. For instance, the peak shear strength of the AC specimens reduced from 152.7 to 138.5 kPa when the contamination duration continued for 14 and 21 d. This trend was in the range of 148.7 ≤ vp ≤ 160 kPa and 102.1 ≤ vp ≤ 119.9 kPa for BC and KC specimens. Similar trends were recorded for residual stress ratio of the tested specimens. For instance, a residual stress ratio from 0.76 to 0.69, from 0.80 to 0.74, and from 0.55 to 0.5 were recorded for AC BC and KC specimens when the contamination was continued for 7 to 21 d. Variations of the peak and residual shear strength were seen by increasing the ageing time after 14 and 21 d for the soil with atrazine percentage of 6% under 200 kPa normal load [see Figure 10b]. It can be clearly seen that increasing the ageing time caused a decrease in peak and residual shear strength of the soil. More reduction in recorded peak shear strength and residual stress ratio of the soil can be attributed to the simulated long-term contamination condition that changed the soil structure and caused a reduction in dielectric constant of the pore fluid and accordingly lower values of shear strength were observed [26].
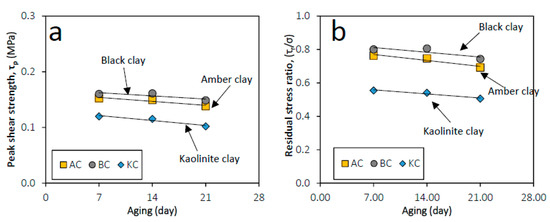
Figure 10.
Effect of ageing of the atrazine contamination on AC, BC and KC specimens on (a) Peak shear strength and; (b) residual stress ratio.
6. Conclusions
This study investigated mechanical characteristics of atrazine-contaminated clay by performing a series of Atterberg limit, compaction, and torsional ring shear tests. Following conclusions can be drawn:
- ▯
- The results showed that enhancing atrazine content in soil increased the liquid limit (LL) and plastic limit (PL) characteristics of the tested clays due to viscous nature of the contamination agent.
- ▯
- Increasing atrazine contamination content of the soil reduced maximum dry density (MDD) and optimum moisture content (OMC) of the tested clays.
- ▯
- Peak shear strength and residual stress ratio of the tested soils reduced by increasing the atrazine contents. This reduction was attributed to an increase in the viscosity of the soil which caused the pore fluid in the clay to behave like a lubricant agent and let the clay particles easily slide when external stress is applied.
- ▯
- Peak shear strength and residual stress ratio reduced even more when duration of the contaminating soil increased. This behaviour was attributed to simulation of the long-term contamination condition that caused a reduction dielectric constant and accordingly the shear strength characteristics of the tested soils.
Author Contributions
M.K. and A.C. conceived and designed the experiments; M.K. performed the experiments; M.K., A.C. and H.N. analyzed the data; Y.Y. contributed reagents/materials/analysis tools; M.K., A.C., H.N., Y.Y. wrote the paper. All authors have read and agreed to th published version of the manuscript.
Funding
This research received no external funding.
Acknowledgments
The authors acknowledge the use of Curtin University’s Microscopy & Microanalysis Facility, whose instrumentation has been partially funded by the University, and State and Commonwealth Governments.
Conflicts of Interest
The authors declare no conflict of interest.
References
- Al-Rkaby, A.H.J.; Chegenizadeh, A.; Nikraz, H.R. Directional-dependence in the mechanical characteristics of sand: A review. Int. J. Geotech. Eng. 2016, 10, 499–509. [Google Scholar] [CrossRef]
- Al-Rkaby, A.H.J.; Chegenizadeh, A.; Nikraz, H. Anisotropic strength of large scale geogrid-reinforced sand: Experimental study. Soils Found. 2017, 57, 557–574. [Google Scholar] [CrossRef]
- Chegenizadeh, A.; Nikraz, H. Shear Test on Reinforced Clay. Adv. Mater. Res. 2011, 250, 3223–3227. [Google Scholar] [CrossRef]
- Chegenizadeh, A.; Nikraz, H. Composite Soil: Fiber Inclusion and Strength. Adv. Mater. Res. 2011, 308, 1646–1650. [Google Scholar] [CrossRef]
- Chegenizadeh, A.; Nikraz, H. Permeability test on reinforced clayey sand. World Acad. Sci. Eng. Technol. 2011, 54, 130–133. [Google Scholar]
- Chegenizadeh, A.; Nikraz, H. Investigation on Compaction Characteristics of Reinforced Soil. Adv. Mater. Res. 2011, 261, 964–968. [Google Scholar] [CrossRef]
- Chegenizadeh, A.; Nikraz, H. Investigation on Strength of Fiber Reinforced Clay. Adv. Mater. Res. 2011, 261, 957–963. [Google Scholar] [CrossRef]
- Chegenizadeh, A.; Ghadimi, B.; Nikraz, H.; Şimşek, M. A novel two-dimensional approach to modelling functionally graded beams resting on a soil medium. Struct. Eng. Mech. 2014, 51, 727–741. [Google Scholar] [CrossRef]
- Chegenizadeh, A.; Keramatikerman, M.; Nikraz, H. Liquefaction resistance of fibre reinforced low-plasticity silt. Soil Dyn. Earthq. Eng. 2018, 104, 372–377. [Google Scholar] [CrossRef]
- Chegenizadeh, A.; Keramatikerman, M.; Santa, G.D.; Nikraz, H. Influence of recycled tyre amendment on the mechanical behaviour of soil-bentonite cut-off walls. J. Clean. Prod. 2018, 177, 507–515. [Google Scholar] [CrossRef]
- Chegenizadeh, A.; Keramatikerman, M.; Panizza, S.; Nikraz, H. Effect of Powdered Recycled Tire on Sulfate Resistance of Cemented Clay. J. Mater. Civ. Eng. 2017, 29, 04017160. [Google Scholar] [CrossRef]
- Keramatikerman, M.; Chegenizadeh, A.; Nikraz, H. Effect of Slag on Restoration Mechanical Characteristics of Ethanol Gasoline–Contaminated Clay. J. Environ. Eng. 2018, 144, 06018001. [Google Scholar] [CrossRef]
- Keramatikerman, M.; Chegenizadeh, A.; Nikraz, H. Shear strength characteristics of over-consolidated clay treated with ggbfs. Aust. Geomech. 2018, 53, 141–149. [Google Scholar]
- Keramatikerman, M.; Chegenizadeh, A.; Nikraz, H. Effect of Flyash on Post-Cyclic Behavior of Sand. J. Earthq. Eng. 2018, 15, 1–3. [Google Scholar] [CrossRef]
- Llewellyn, R.S.; Powles, S.; Powles, S.B. High Levels of Herbicide Resistance in Rigid Ryegrass (Lolium rigidum) in the Wheat Belt of Western Australia1. Weed Technol. 2001, 15, 242–248. [Google Scholar] [CrossRef]
- Powles, S.; Howat, P.D. Herbicide-resistant Weeds in Australia. Weed Technol. 1990, 4, 178–185. [Google Scholar] [CrossRef]
- Walker, S.R.; Blacklow, W.M. Adsorption and degradation of triazine herbicides in soils used for lupin production in Western-Australia-Laboratory studies and a simulation model. Soil Res. 1994, 32, 1189–1205. [Google Scholar]
- Gerritse, R.; Beltrán, J.; Hernández, F. Adsorption of atrazine, simazine, and glyphosate in soils of the Gnangara Mound, Western Australia. Soil Res. 1996, 34, 599–607. [Google Scholar] [CrossRef]
- Appleyard, S. Groundwater quality in the Perth region. Aust. Geomech. 2003, 38, 103–112. [Google Scholar]
- Joll, C.A.; Franzmann, P.D. A Review and Recommendations for the Remediation of Atrazine and Fenamiphos Contamination of Soil and Groundwater at Dianella; Centre for Groundwater Studies (CSIRO): Canberra, Australia, 1997; p. 79. [Google Scholar]
- Franzmann, P.D.; Zappia, L.R.; Tilbury, A.L.; Patterson, B.M.; Davis, G.B.; Mandelbaum, R.T. Bioaugmentation of Atrazine and Fenamiphos Impacted Groundwater: Laboratory Evaluation. Bioremediation J. 2000, 4, 237–248. [Google Scholar] [CrossRef]
- Chau, P.C. The Role of Pesticide Metabolites and Preferential Flow in Understanding Pesticide Fate in the Vadose Zone. Bachelor’s Thesis, University of Western Australia, Perth, Australia, 2010. [Google Scholar]
- Bell, A.L.; McCullough, L.M.; Gregory, B.J. Clay contamination in crushed rock highway sub-bases. In Proceedings of the The Second Australian Conference on Engineering Materials, Sydney, Australia, 6–38 July 1981. [Google Scholar]
- Meegoda, J.N.; Rajapakse, R.A. Short-Term and Long-Term Permeabilities of Contaminated Clays. J. Environ. Eng. 1993, 119, 725–743. [Google Scholar] [CrossRef]
- Meegoda, J.N.; Vallejo, L.E.; Reddi, L.N. Engineered Contaminated Soils and Interaction of Soil Geomembranes; American Society of Civil Engineers, Sessions of ASCE National Convention: Washington, DC, USA, 1996. [Google Scholar]
- Ratnaweera, P.; Meegoda, J.N. Shear strength and stress-strain behaviour of contaminated soils. Geotech. Test. J. 2006, 29, 133–140. [Google Scholar]
- Khamehchiyan, M.; Charkhabi, A.H.; Tajik, M. Effects of crude oil contamination on geotechnical properties of clayey and sandy soils. Eng. Geol. 2007, 89, 220–229. [Google Scholar] [CrossRef]
- Singh, S.K.; Srivastava, R.; John, S. Studies on soil contamination due to used motor oil and its remediation. Can. Geotech. J. 2009, 46, 1077–1083. [Google Scholar] [CrossRef]
- Sunil, B.M.; Shrihari, S.; Nayak, S. Shear strength characteristics and chemical characteristics of leachate-contaminated lateritic soil. Eng. Geol. 2009, 106, 20–25. [Google Scholar] [CrossRef]
- Di Matteo, L.; Bigotti, F.; Ricco, R. Compressibility of Kaolinitic Clay Contaminated by Ethanol-Gasoline Blends. J. Geotech. Geoenvironmental Eng. 2011, 137, 846–849. [Google Scholar] [CrossRef]
- Khosravi, E.; Ghasemzadeh, H.; Sabour, M.R.; Yazdani, H. Geotechnical properties of gas oil-contaminated kaolinite. Eng. Geol. 2013, 166, 11–16. [Google Scholar] [CrossRef]
- Keramatikerman, M.; Chegenizadeh, A.; Nikraz, H. Experimental study on effect of fly ash on liquefaction resistance of sand. Soil Dyn. Earthq. Eng. 2017, 93, 1–6. [Google Scholar] [CrossRef]
- Keramatikerman, M.; Chegenizadeh, A.; Pu, H. Effect of Atrazine Contamination on Compressibility and Permeability Characteristics of Clay. Geotech. Test. J. 2017, 40, 936–950. [Google Scholar] [CrossRef]
- Keramatikerman, M.; Chegenizadeh, A.; Nikraz, H.; Sabbar, A.S. Effect of flyash on liquefaction behaviour of sand-bentonite mixture. Soils Found. 2018, 58, 1288–1296. [Google Scholar] [CrossRef]
- Estabragh, A.R.; Beytolahpour, I.; Moradi, M.; Javadi, A.A. Mechanical behavior of a clay soil contaminated with glycerol and ethanol. Eur. J. Environ. Civ. Eng. 2015, 20, 1–17. [Google Scholar] [CrossRef]
- Chegenizadeh, A.; Keramatikerman, M.; Miceli, S.; Nikraz, H.; Salih Sabbar, A. Investigation on Recycled Sawdust in Controlling Sulphate Attack in Cemented Clay. Appl. Sci. 2020, 10, 1441. [Google Scholar] [CrossRef]
- Moss, S.J.; Freeman, M.; George, A.D.; Marshall, A.; Dunphy, J.M. The Prider Field Trip—The Rock Cycle and Geology the Perth Metropolitan Area. A Professional Development Day for High School Geology and Science Teachers; Geological Society of Australia (WA Division): Hornsby, NSW, Australia, 1998; Volume 10, p. 72. [Google Scholar]
- McPherson, A.; Jones, A. Appendix D: Perth Basin geology review and site class assessment. In Natural Hazard Risk in Perth, Western Australia; 2005; pp. 313–344. Available online: https://www.researchgate.net/profile/Andrew_Mcpherson6/publication/265671763_Perth_Basin_geology_Appendix_D_PERTH_BASIN_GEOLOGY_REVIEW_and_SITE_CLASS_ASSESSMENT/links/55f0adb808ae0af8ee1d2cd9/Perth-Basin-geology-Appendix-D-PERTH-BASIN-GEOLOGY-REVIEW-and-SITE-CLASS-ASSESSMENT.pdf (accessed on 2 April 2020).
- Appleyard, S.J. Investigation of Ground Water Contamination by Fenamiphos and Atrazine in a Residential Area: Source and Distribution of Contamination. Ground Water Monit. Remediat. 1995, 15, 110–113. [Google Scholar] [CrossRef]
- Google Earth. Perth, Western Australia 32°02’46.63″S, 116°08’37.44″E, elevation 289m. 2016. Available online: https://www.google.com/maps/@-31.9738665,115.8327241,11.21z (accessed on 15 August 2016).
- Geological Survey of Western Australia. Extracted from GeoVIEW.WA extracted from GeoVIEW WA, Perth. Department of Mines and Petroleum. 2016. Available online: https://dasc.dmp.wa.gov.au/dasc/ (accessed on 28 March 2020).
- Gratchev, I.; Sassa, K. Shear Strength of Clay at Different Shear Rates. J. Geotech. Geoenvironmental Eng. 2015, 141, 06015002. [Google Scholar] [CrossRef]
- Sibelco Australia. Material Safety Data Sheet for Clay Prestige NY. 2011. Available online: http://wc.strategyonline.com/documents/msds/WC-BA214-MSDS.pdf (accessed on 2 April 2020).
- ASTM. Standard Test Methods for Liquid Limit, Plastic Limit, and Plasticity Index of Soils; ASTM: West Conshohocken, PA, USA, 2010. [Google Scholar]
- ASTM. Standard Test Method for Dispersive Characteristics of Clay Soil by Double Hydrometer; ASTM D4221; ASTM: West Conshohocken, PA, USA, 2011. [Google Scholar]
- Singh, S.K.; Srivastava, R.; John, S. Settlement Characteristics of Clayey Soils Contaminated with Petroleum Hydrocarbons. Soil Sediment Contam. Int. J. 2008, 17, 290–300. [Google Scholar] [CrossRef]
- Meehan, C.L.; Brandon, T.L.; Duncan, J.M. Measuring drained residual strengths in the Bromhead ring shear. Geotech. Test. J. 2007, 30, 466–473. [Google Scholar]
- ASTM. Standard Test Method for Torsional Ring Shear Test to Determine Drained Residual Shear Strength of Cohesive Soils; ASTM D6467; ASTM: West Conshohocken, PA, USA, 1999. [Google Scholar]
- Stark, T.D.; Eid, H.T. Modified Bromhead ring shear apparatus. Geotech. Test. J. 1993, 16, 100–107. [Google Scholar] [CrossRef]
- Keramatikerman, M.; Chegenizadeh, A. Effect of Particle Shape on Monotonic Liquefaction: Natural and Crushed Sand. Exp. Mech. 2017, 57, 1341–1348. [Google Scholar] [CrossRef]
- Stark, T.D.; Contreras, I.A. Constant volume ring shear apparatus. Geotech. Test. J. 1996, 19, 3–11. [Google Scholar] [CrossRef]
- Eid, H.; Doerfler, C. Effect of Shear Displacement Rate on Internal Shear Strength of a Reinforced Geosynthetic Clay Liner. Geosynth. Int. 1999, 6, 219–239. [Google Scholar] [CrossRef]
- Sabbar, A.S.; Chegenizadeh, A.; Nikraz, H. Static liquefaction of very loose sand–slag–bentonite mixtures. Soils Found. 2017, 57, 341–356. [Google Scholar] [CrossRef]
- Keramatikerman, M.; Chegenizadeh, A.; Yilmaz, Y.; Nikraz, H. Effect of Lime Treatment on Static Liquefaction Behavior of Sand–Bentonite Mixtures. J. Mater. Civ. Eng. 2018, 30, 06018017. [Google Scholar] [CrossRef]
- Sridharan, A.; Rao, G.V. Shear strength behaviour of saturated clays and the role of the effective stress concept. Géotechnique 1979, 29, 177–193. [Google Scholar] [CrossRef]
- Sridharan, A.; Rao, G.V. Mechanisms controlling volume change of saturated clays and the role of the effective stress concept. Géotechnique 1973, 23, 359–382. [Google Scholar] [CrossRef]
- Meegoda, N.J.; Ratnaweera, P. Compressibility of contaminated fine-grained soils. Geotech. Test. J. 1994, 17, 101–112. [Google Scholar] [CrossRef]
- Naeini, S.A.; Jahanfar, M.A. Effect of salt solution and plasticity index on undrain shear strength of clays. World Acad. Sci. Eng. Technol. 2011, 49, 982–986. [Google Scholar]
- Akinwumi, I.I.; Diwa, D.; Obianigwe, N. Effects of crude oil contamination on the index properties, strength and permeability of lateritic clay. Int. J. Appl. Sci. Eng. Res. 2014, 3, 816–824. [Google Scholar]
- Sherif, M.A.; Burrous, C.M. Temperature Effects on the Unconfined Shear Strength of Saturated, Cohesive Soil; Highway Research Board Special Report, Proceedings of an International Conference Held at Washington, D.C., January 16 1969 With the Support of the National Science Foundation; Washington DC, United States, January 16 1969; On-Line Publishers, Inc: Lancaster, PA, USA, 1969. [Google Scholar]
- Nazir, A.K. Effect of motor oil contamination on geotechnical properties of over consolidated clay. Alex. Eng. J. 2011, 50, 331–335. [Google Scholar] [CrossRef]
- Alhassan, H.M.; Fagge, S.A. Effects of crude oil, low point pour fuel oil and vacuum gas oil contamination on the geotechnical properties sand, clay and laterite soils. Int. J. Eng. Res. Appl. 2013, 3, 1947–1954. [Google Scholar]
- Ghadyani, M.; Hamidi, A.; Hatambeigi, M. Triaxial shear behaviour of oil contaminated clays. Eur. J. Environ. Civ. Eng. 2016, 23, 112–135. [Google Scholar] [CrossRef]
- Moore, C.A.; Mitchell, J.K. Electromagnetic forces and soil strength. Géotechnique 1974, 24, 627–640. [Google Scholar] [CrossRef]


© 2020 by the authors. Licensee MDPI, Basel, Switzerland. This article is an open access article distributed under the terms and conditions of the Creative Commons Attribution (CC BY) license (http://creativecommons.org/licenses/by/4.0/).