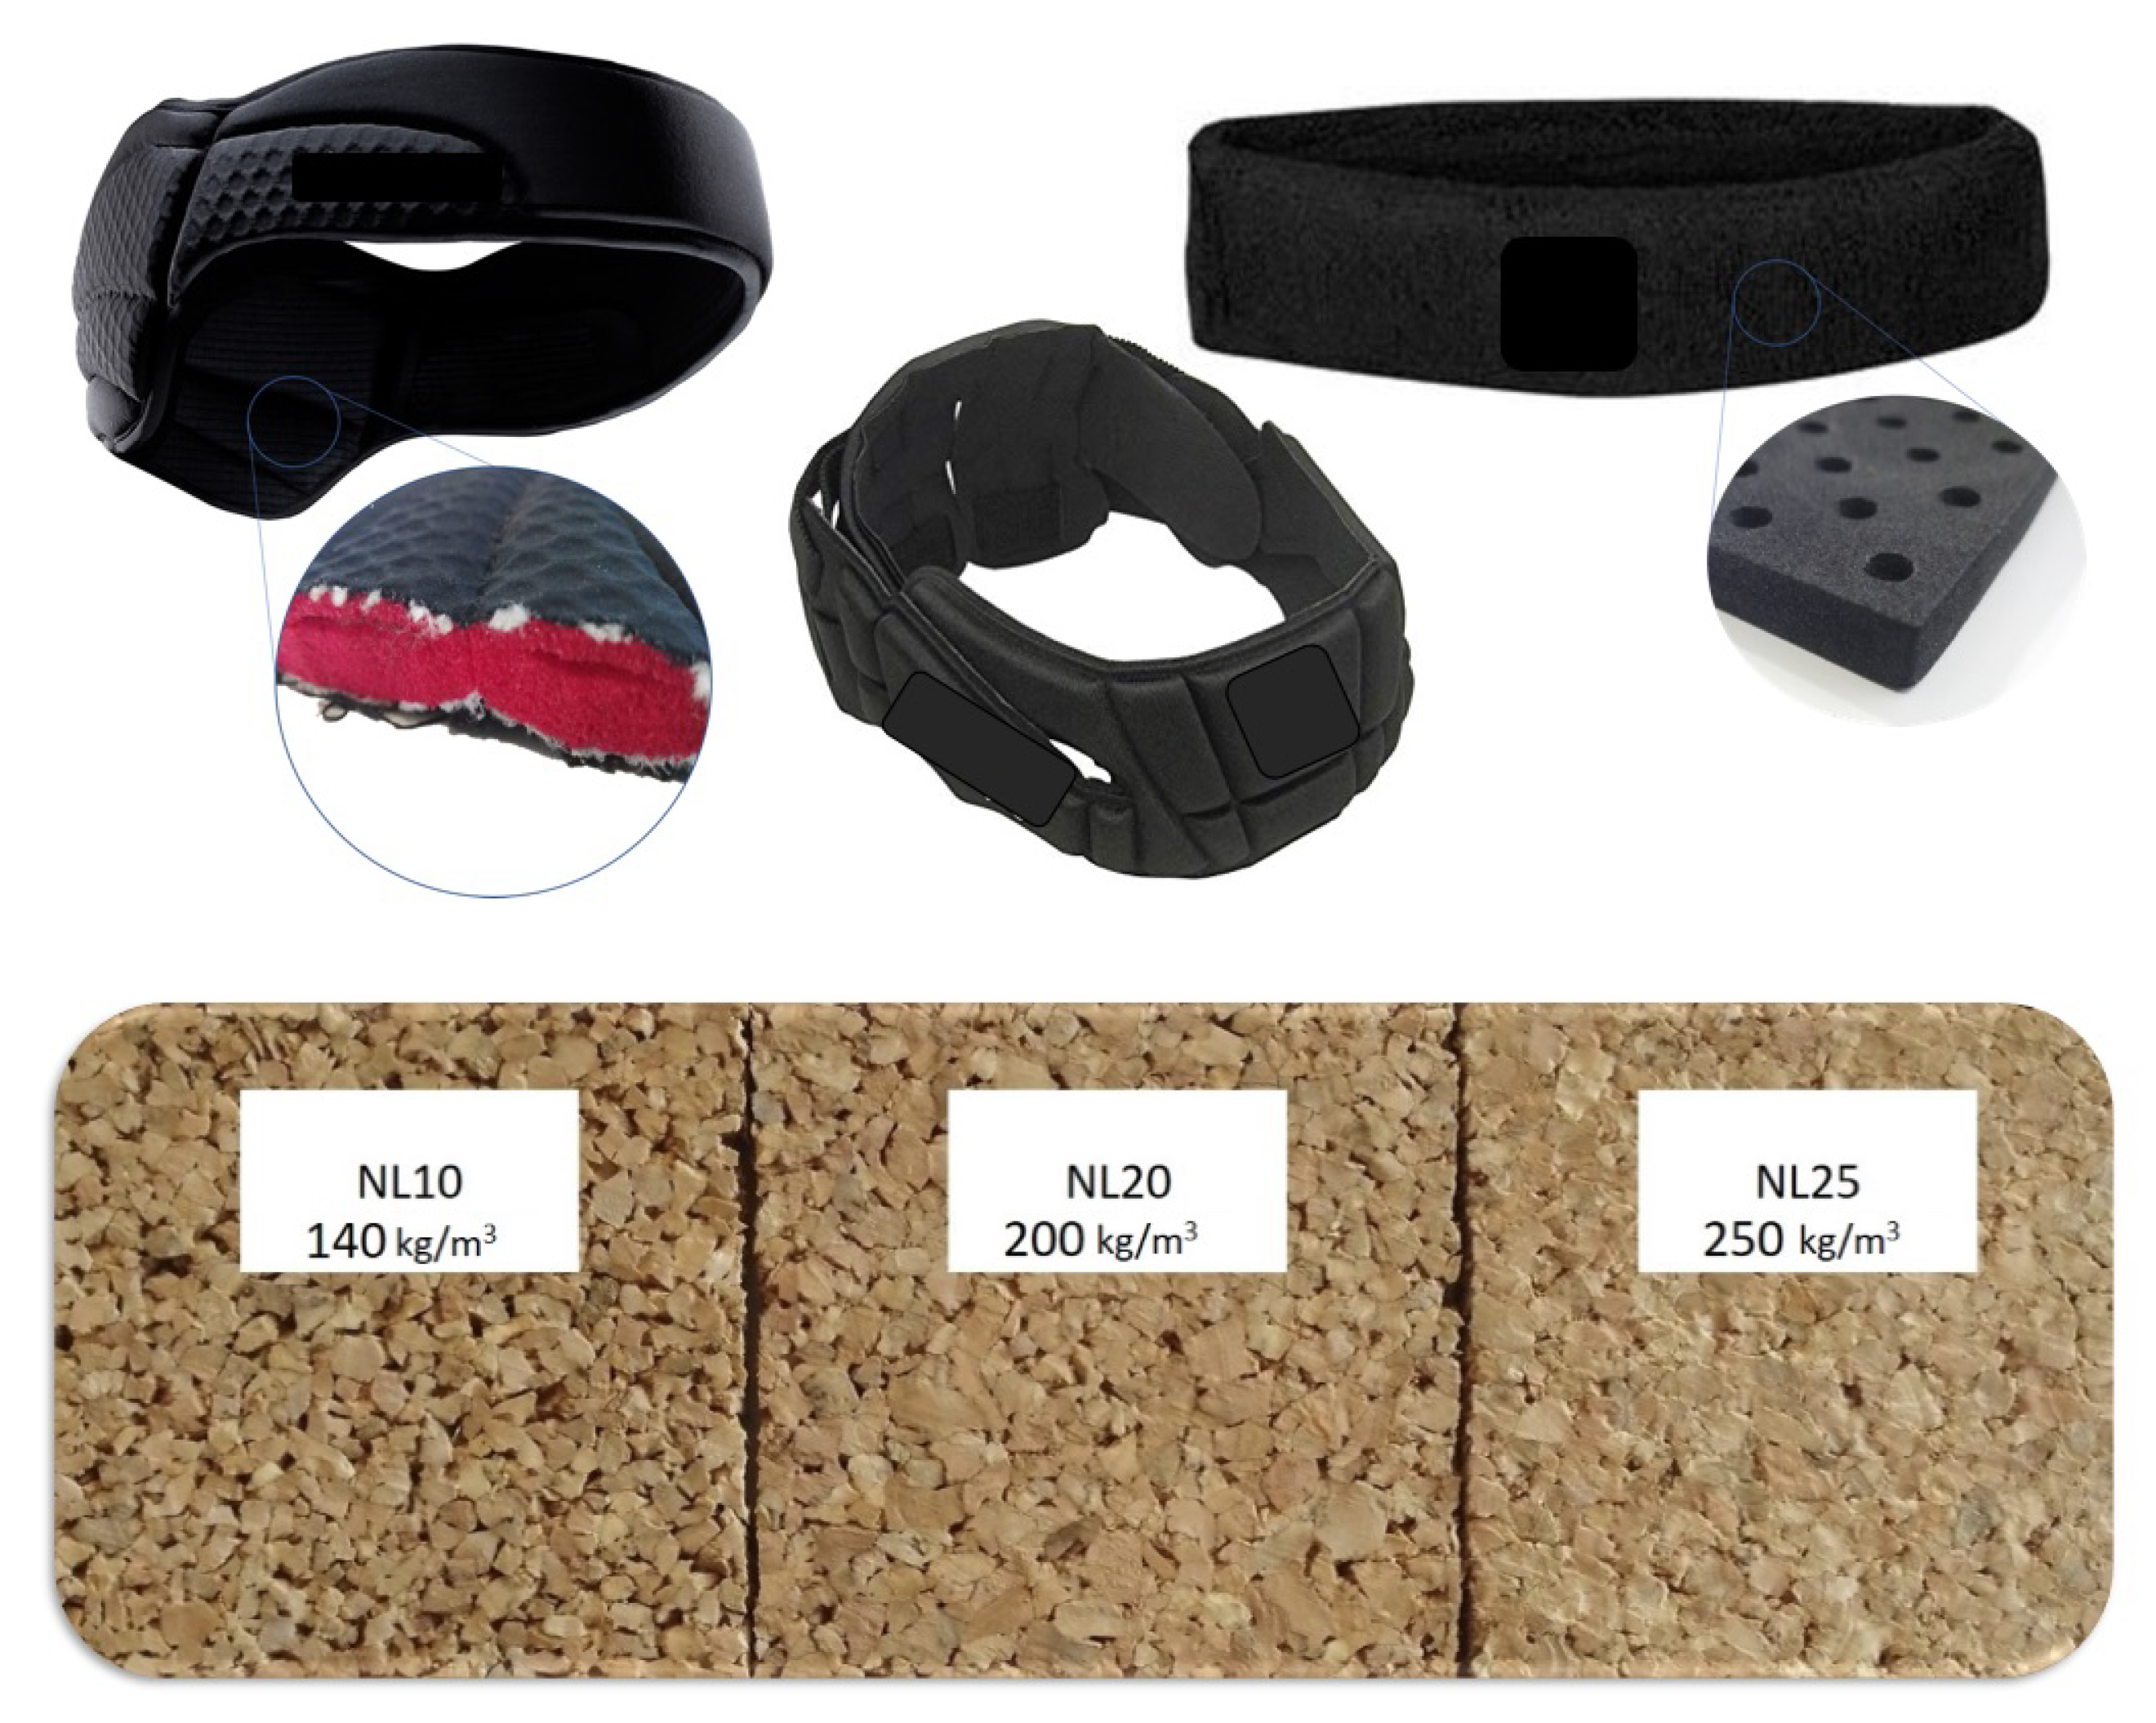
Three commercial headbands with distinct price tags and material densities and three cork agglomerates were tested. In order to perform mechanical tests, more specifically uniaxial compressions, a representative piece of material was extracted from the commercial headbands, as depicted in
Figure 1. Cork agglomerates in three different densities were provided by Amorim Cork Composites (ACC, Mozelos, Portugal).
Three samples from each product were tested. They were removed preferably from the forehead area of the headbands; firstly, because the product area is generally larger there; secondly, from
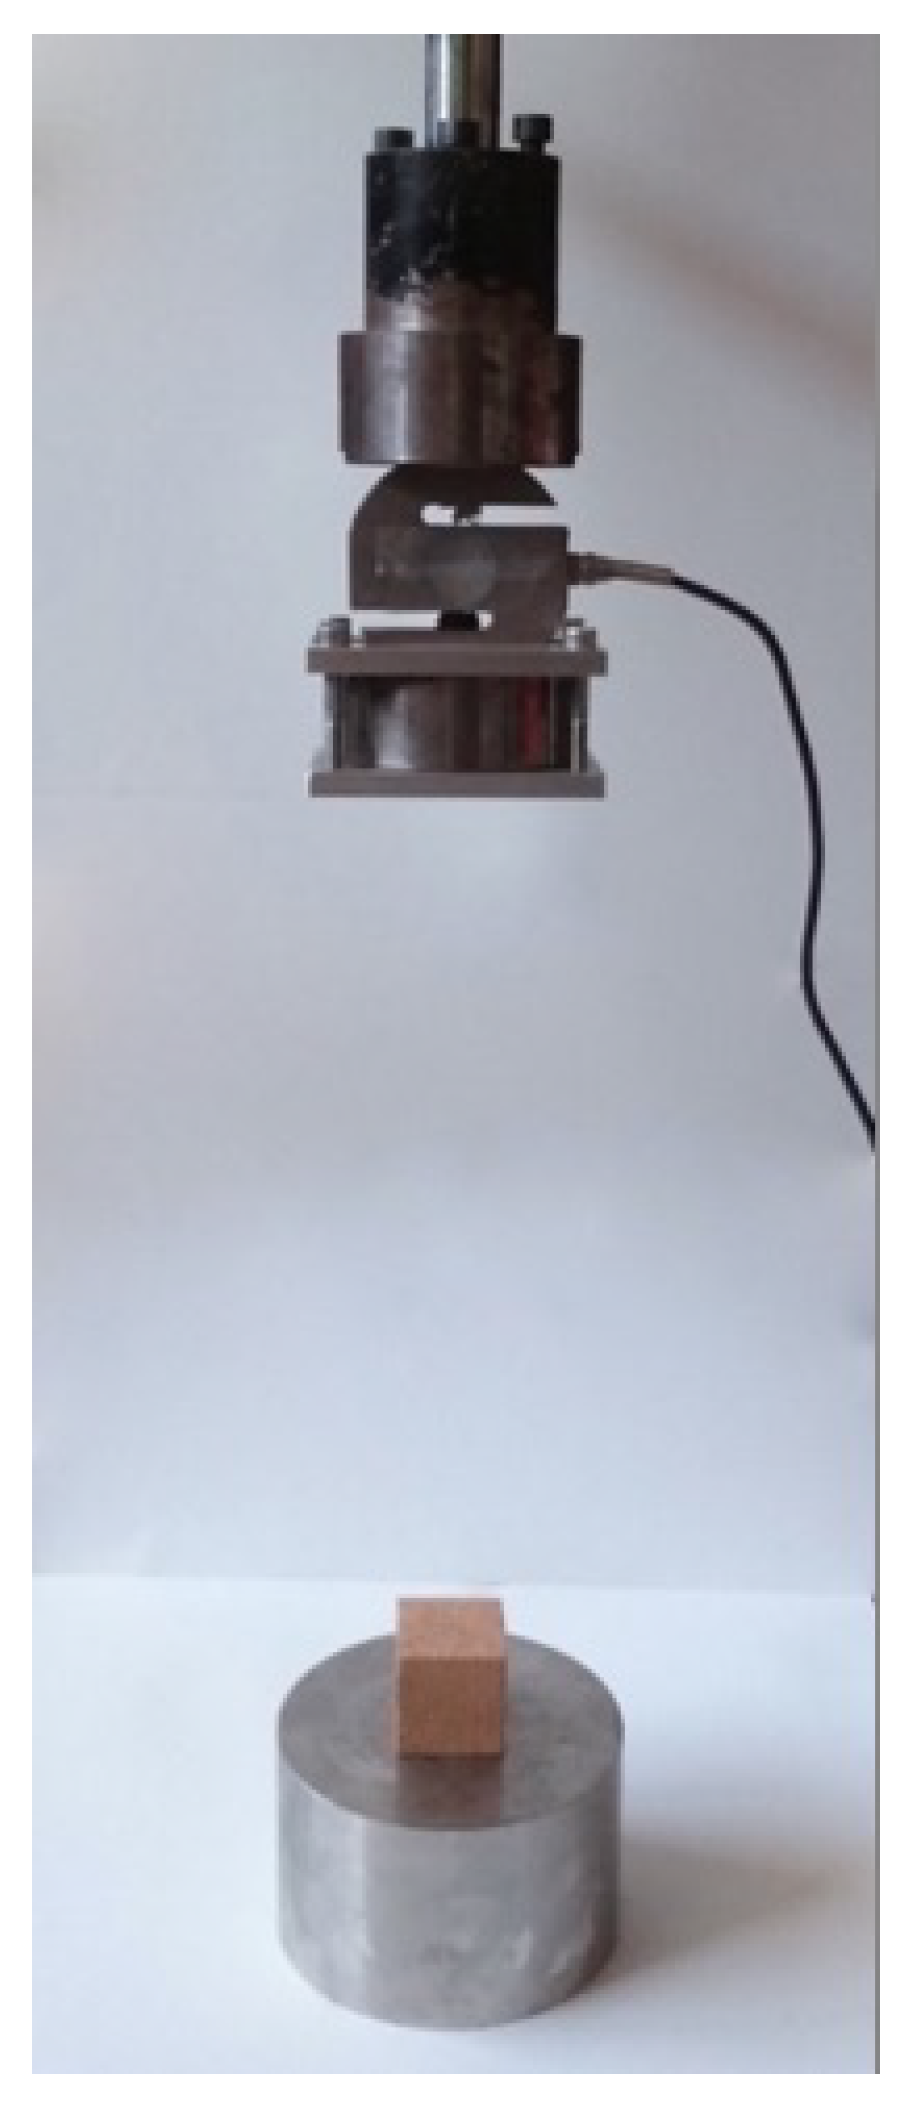
Table 3, it is the head zone where impact likeliness is also bigger. At first, a quasi-static uniaxial compression test was performed using a Shimadzu universal testing machine. Given the limited size of the samples extracted it was not possible to follow any standard. Nevertheless, the parameters were chosen carefully as shown in
Table 5.
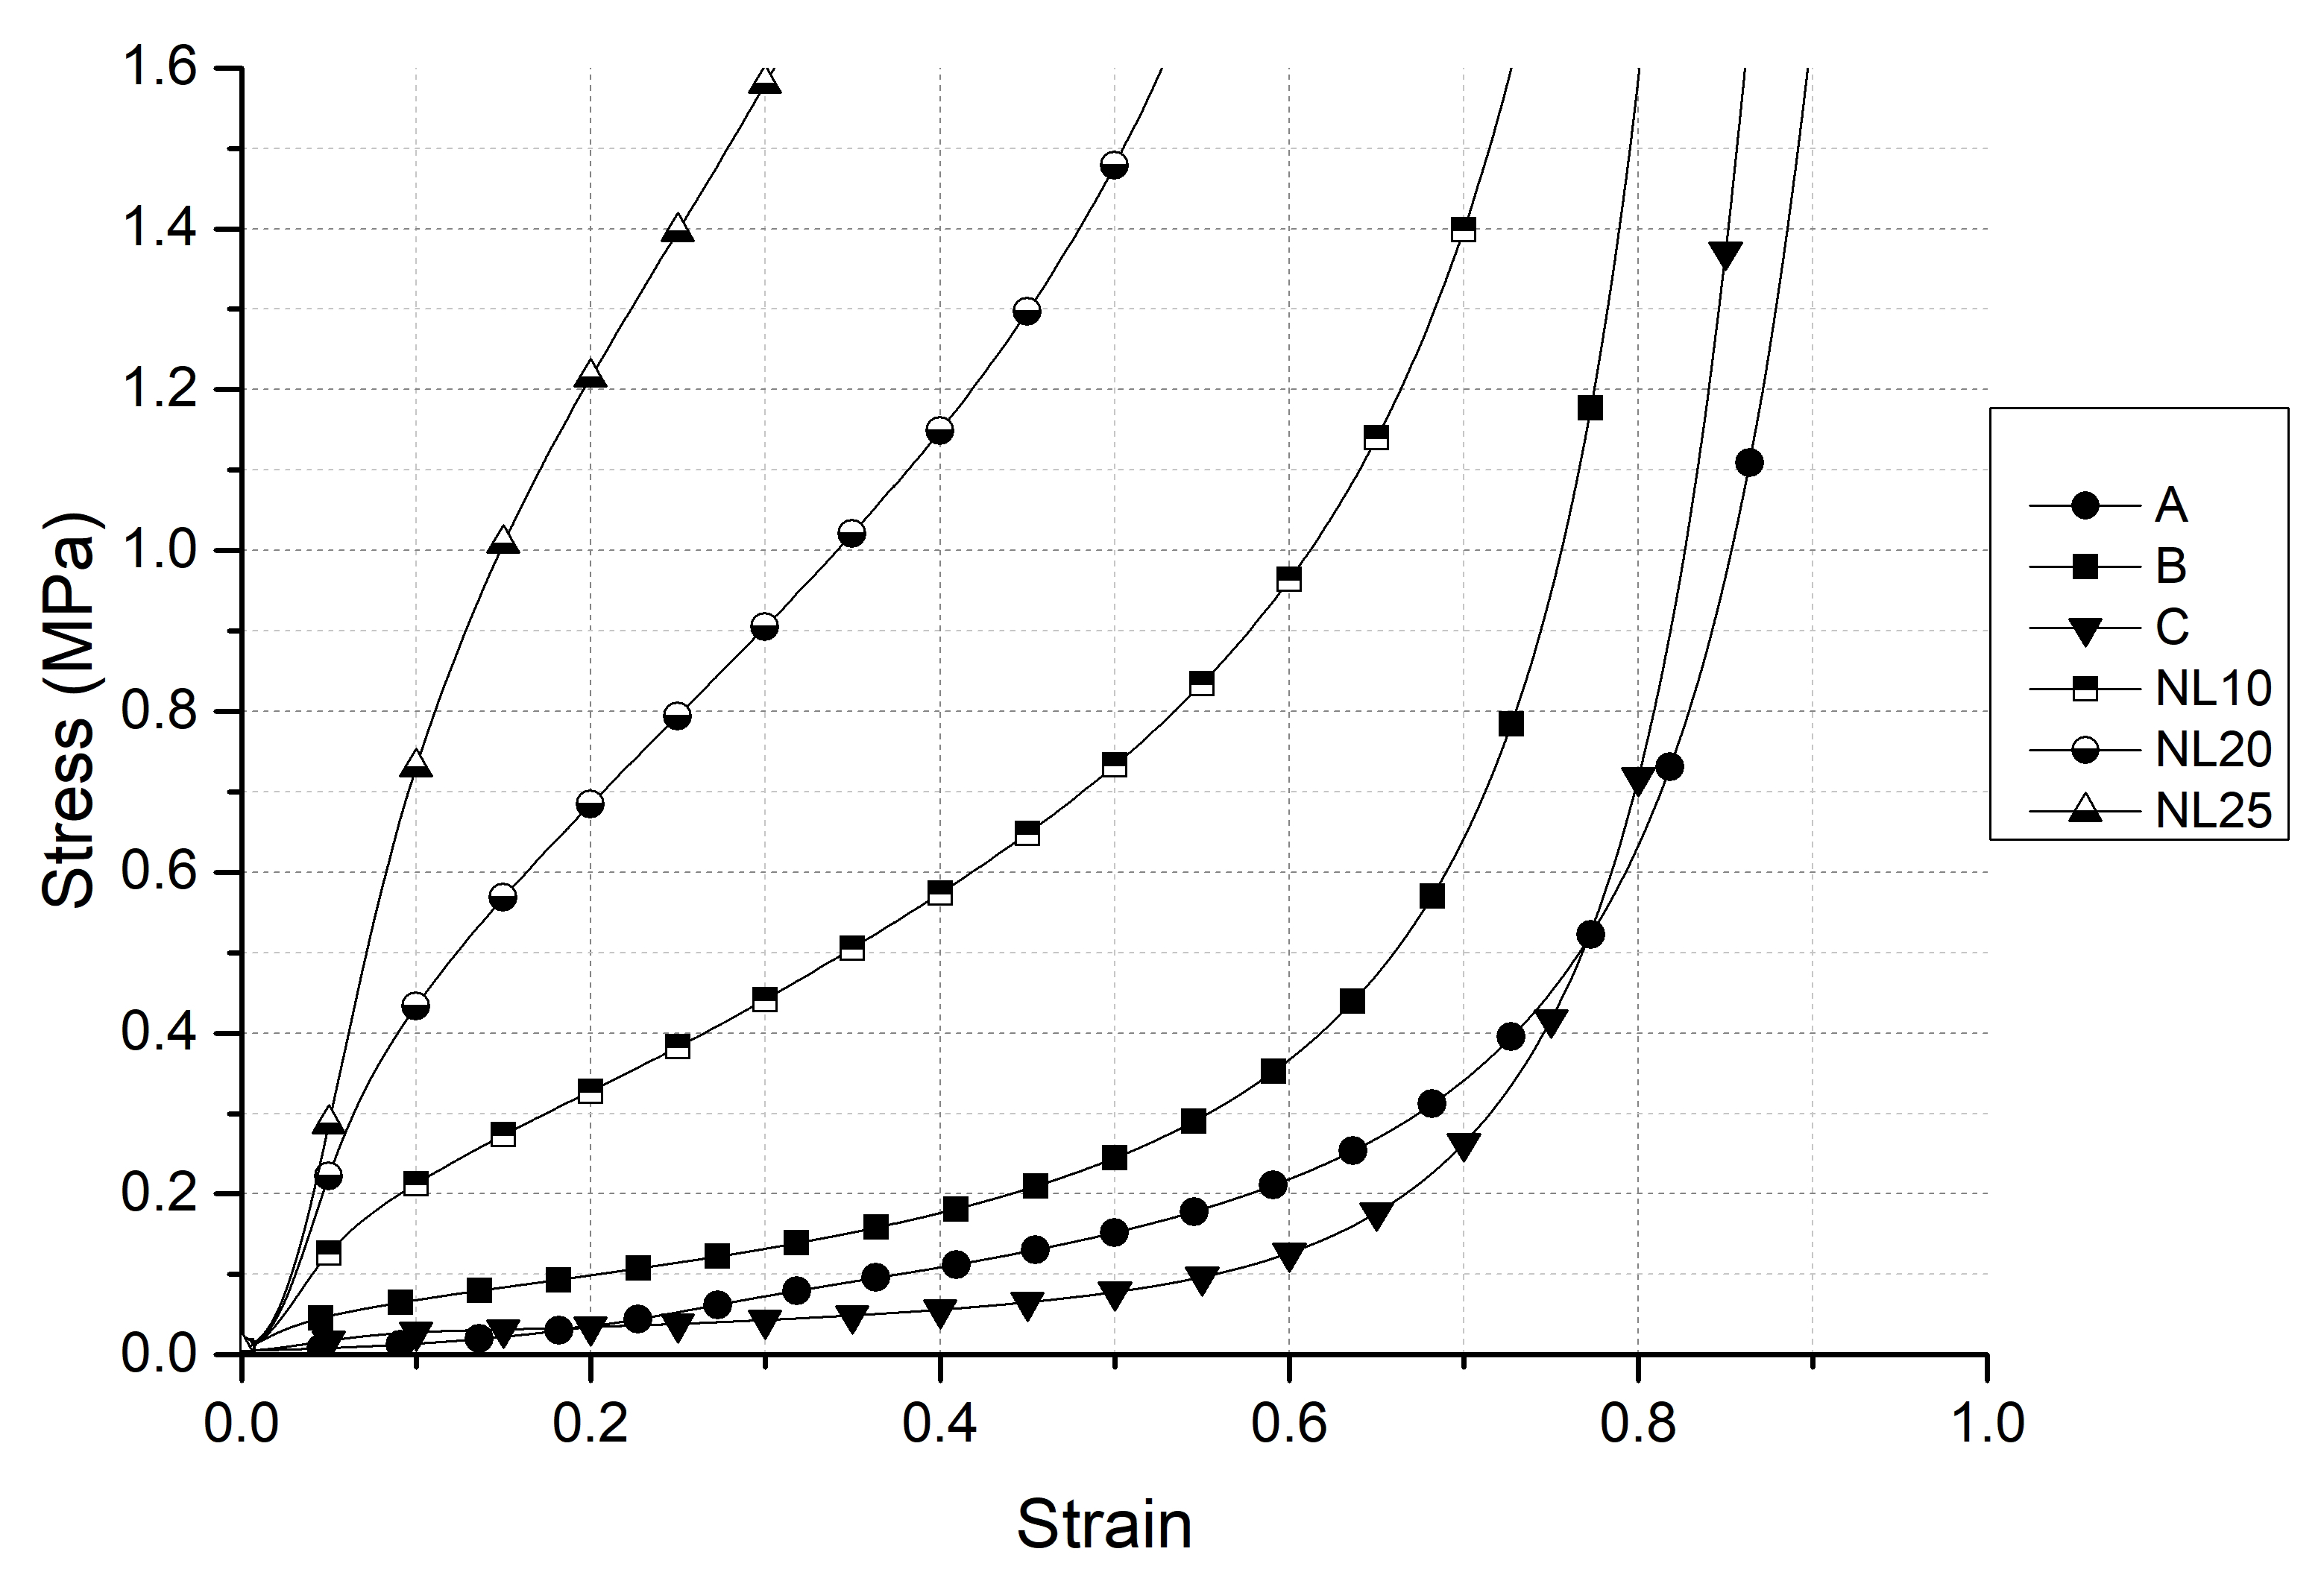
Figure 2 presents uniaxial compressive strain-stress curves for all materials under analysis. Tests were repeated at least three times. It became evident that after the initial elastic deformation, the so-called plateau stage was developed under lower stresses for synthetic foams A, B and C. NL10, given its lower density, was the cork agglomerate yielding lower plateau stresses and later densification strain. In fact, NL10 showed compatible mechanical response compared to commercial headbands. NL20 and NL25 showed more stiff behaviour, exceeding stress values of 1 MPa for very low strain values, which were not compatible with an application where impact energy must be sustained at low-stress levels.
In fact, NL20 and NL25 were discarded as potential materials for the headband device. By setting a threshold of 50% strain, it was possible to conclude that cork could absorb more energy per unit volume than the synthetic foams used in the market headbands, but at the expense of larger reaction forces. Subsequently, NL10 was tested against synthetic foams in dynamic conditions. Similarly to quasi-static tests, dynamic tests did not follow any standard due to the samples’ limited thickness.
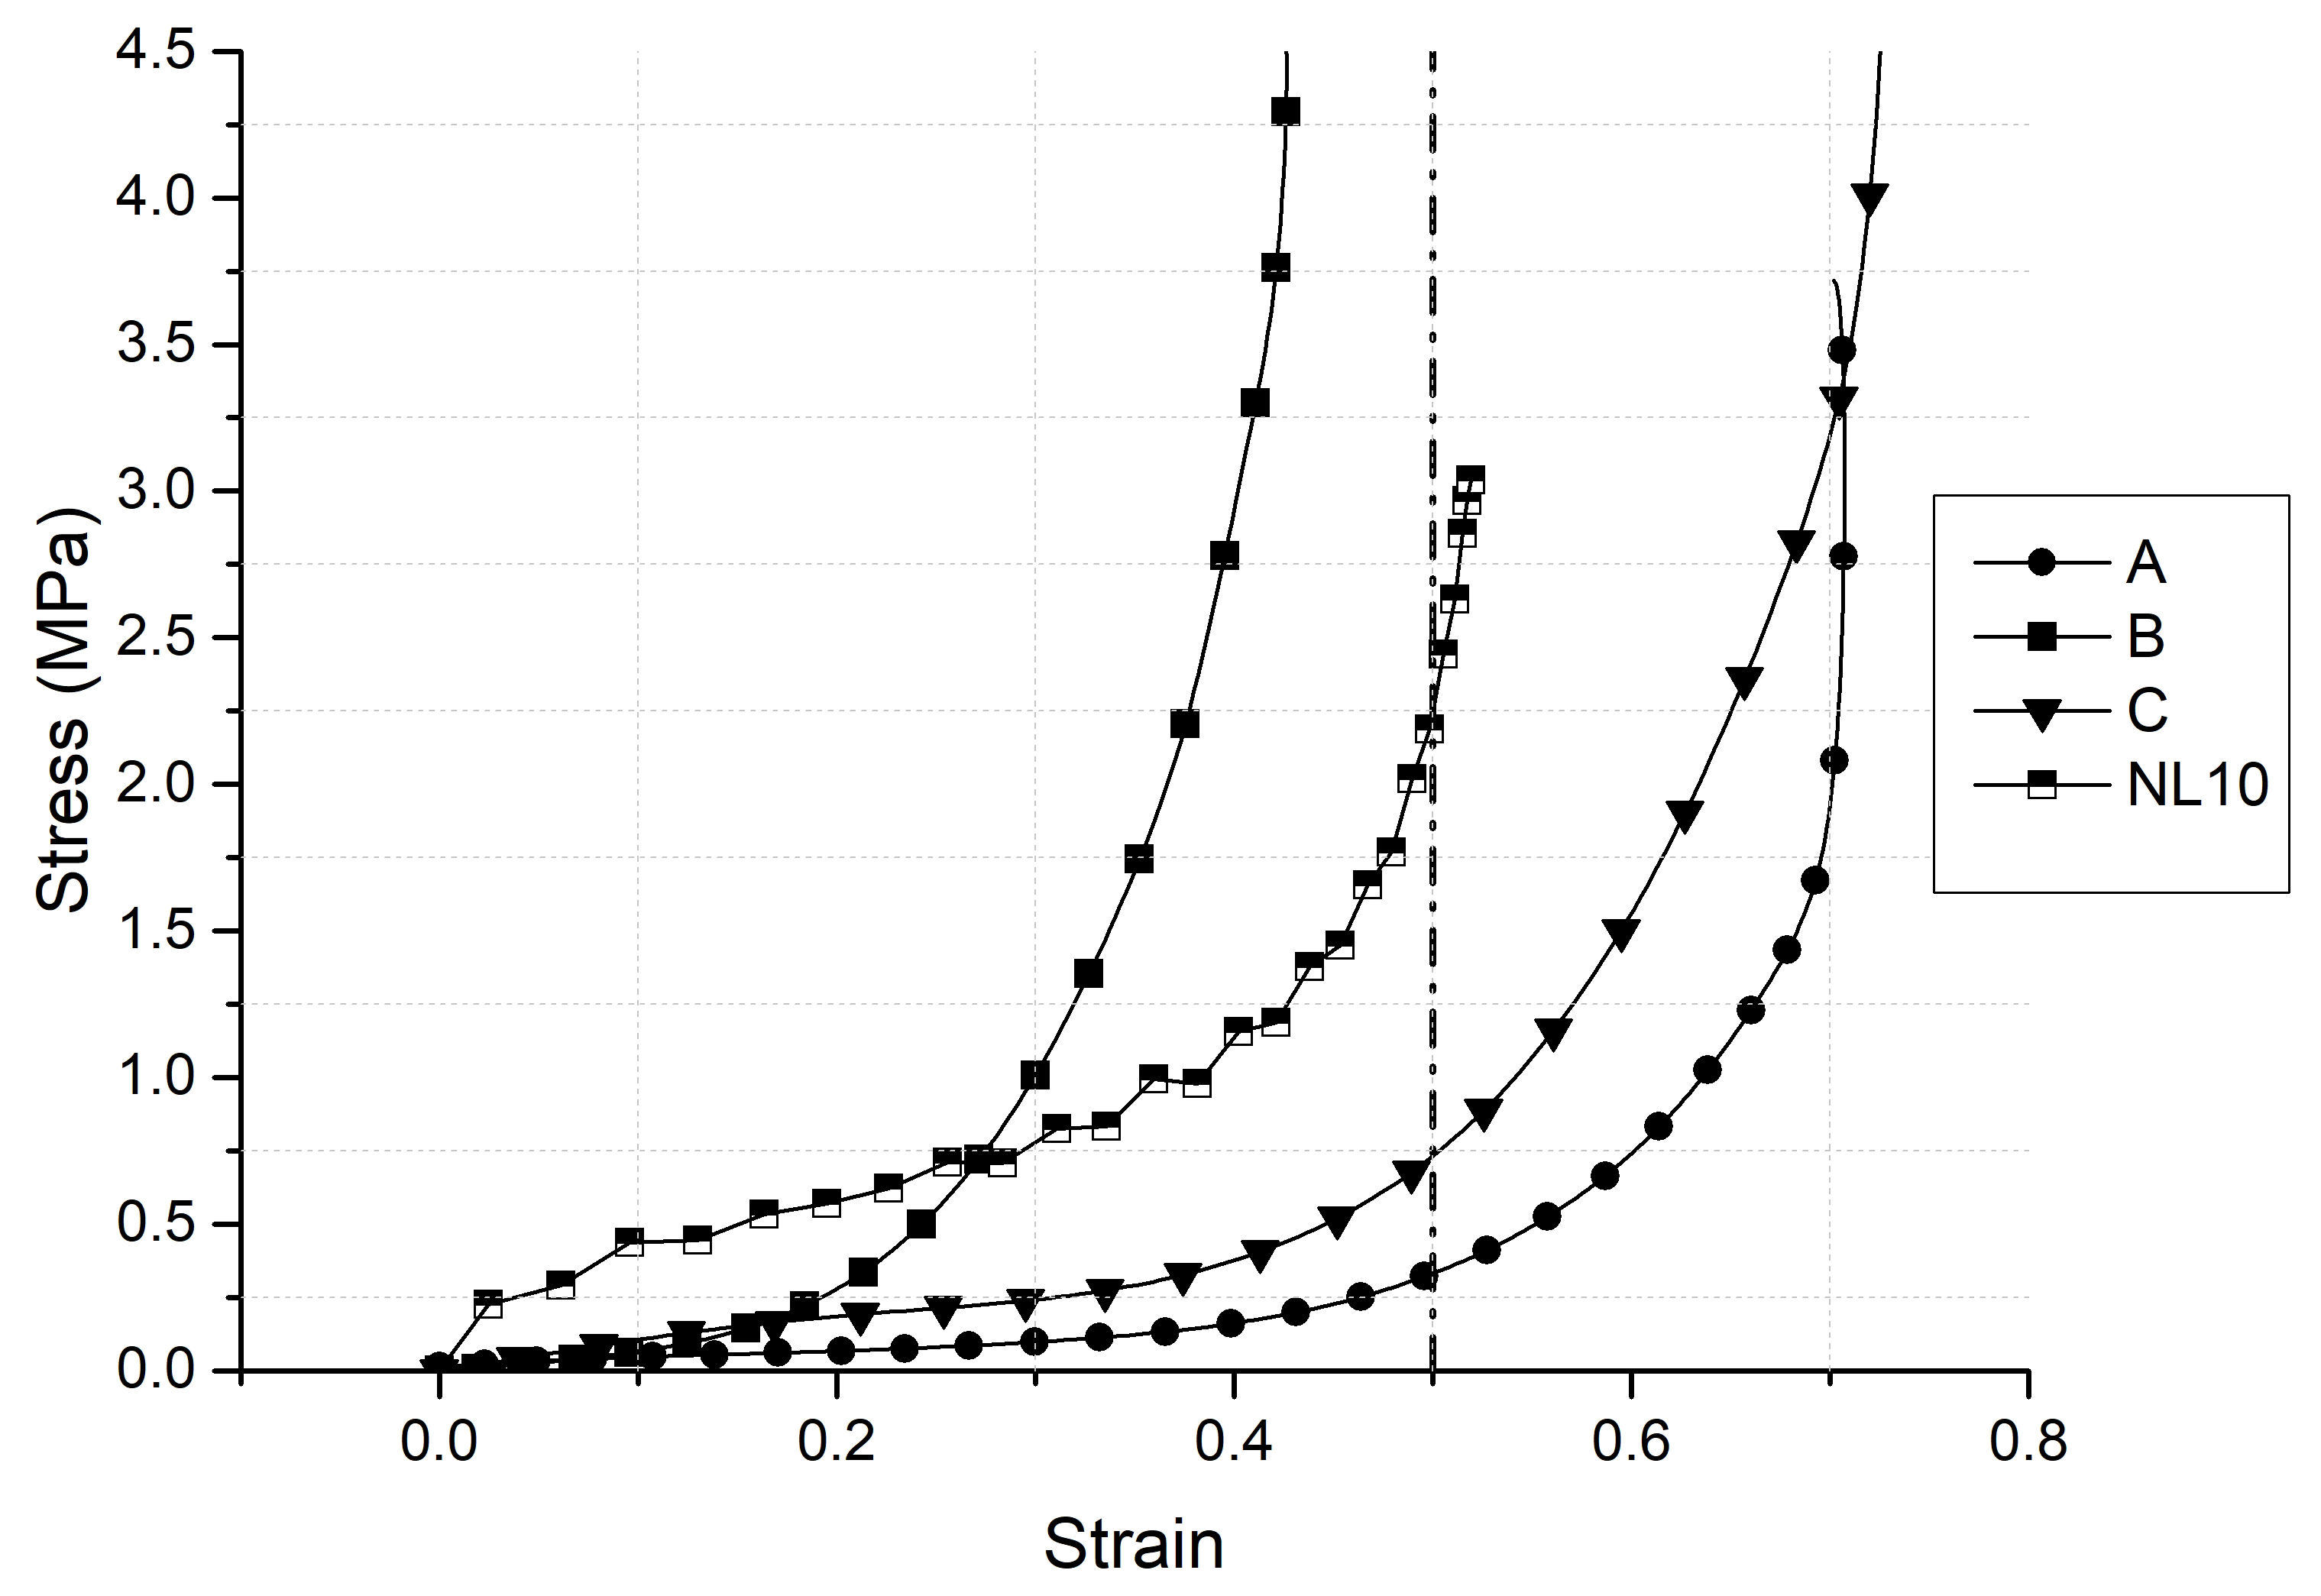
Figure 4 presents the dynamic stress-strain curves. Tests were repeated at least three times. Compared to quasi-static ones, the stress-strain curves presented a higher stress level for the same strain values, which is common in cellular materials due to their strain-rate sensitivity between quasi-static and dynamic levels. However, the way each material response varied with the deformation speed was interesting: it was possible to check that material from headband B was much more sensitive to strain-rate than the others. Cork NL10 material response was, in fact, more close to synthetic materials under dynamic loads, which shows the compatibility and capacity of cork regarding this kind of applications. A strain threshold of 0.5 also made evident that headband B’s material became too stiff under quick compression, reaching early densification and possibly increasing the risk of injury by transmitting higher reaction forces to the head. Given the lower density of Headband A’s material, it had a lower capacity to absorb impact energy, whereas C-type headband and NL10 cork presented a good compromise between densification strain and plateaus stress.
The overall observation of quasi-static and dynamic tests made clear the outstanding capabilities of cork agglomerates for energy absorption purposes, especially in the dynamic regime. Agglomerated cork could absorb more energy (per volume) than the materials from commercial headbands. The B-headband foam had early densification due to its high density. Inside the group of the synthetic foams, C-type presented the best performance. In addition, NL10 showed promising potential in a dynamic situation.
2.1. Constitutive Modelling
For product development purposes, it becomes important to provide reliable constitutive numerical models to represent the materials tested previously. In this work, all the numerical modelling resorted to finite element techniques within the commercial package Abaqus [
29]. An extensive and versatile material library is provided, including material models that can simulate the mechanical behaviour of a great variety of cellular materials.
The hyperelastic constitutive model is mostly employed for materials displaying an immediate nonlinear elastic reaction to applied loads, keeping this behaviour to large strains. Well-known examples are latex or any other elastomer [
29]. Hyperelasticity is described using strain energy potentials, which in simple terms, defines, per unit volume in the undeformed configuration, the strain energy stored in the material. Usually, the strain energy is a function of the strain components at the material point. However, there are numerous strain energy potentials accessible from materials libraries, able to model isotropic elastomers: the Arruda-Boyce, Marlow, Mooney-Rivlin, Neo-Hookean, Ogden form, polynomial/reduced polynomial, among others [
29]. In the present work, two different models were used: the reduced polynomial (Equation (
1)) and Ogden form (Equation (
4)). The employed reduced polynomial strain energy potential follows as:
Being
U the strain energy (per reference volume);
N is an integer (the polynomial order);
and
are parameters depending on temperature;
is the first strain invariant (deviatoric):
refers to the deviatoric stretches whereas
J refers to the total volume ratio;
is the elastic counterpart and
are the principal stretches. Finally, the initial shear and bulk moduli are:
The Ogden form of the strain energy potential follows as:
where
points to the deviatoric principal stretches
;
N is again(the polynomial order;
translate temperature-dependent parameters. The initial shear and bulk moduli in the case of Ogden form follows as:
The Hyperfoam material model present in Abaqus library is isotropic and nonlinear. It is typically employed to model elastomeric foams showing hyperelastic behaviour. It is commonly used in finite-strain applications, where compressive deformations can reach up to 90%. Again, it derives from a strain energy potential, as follows:
being
N the polynomial order, while
,
, and
temperature-related parameters;
where
and
are the elastic and thermal volume ratios. The coefficients
are linked to the initial shear modulus,
, as follows:
whereas the initial bulk modulus,
, comes as:
For each term in the energy function,
determines the compressibility degree.
is also related to the Poisson’s ratio,
:
Doing so, if is equal for all the equation terms, there will be a single value for the Poisson’s ratio, , valid for all finite logarithmic principal strains.
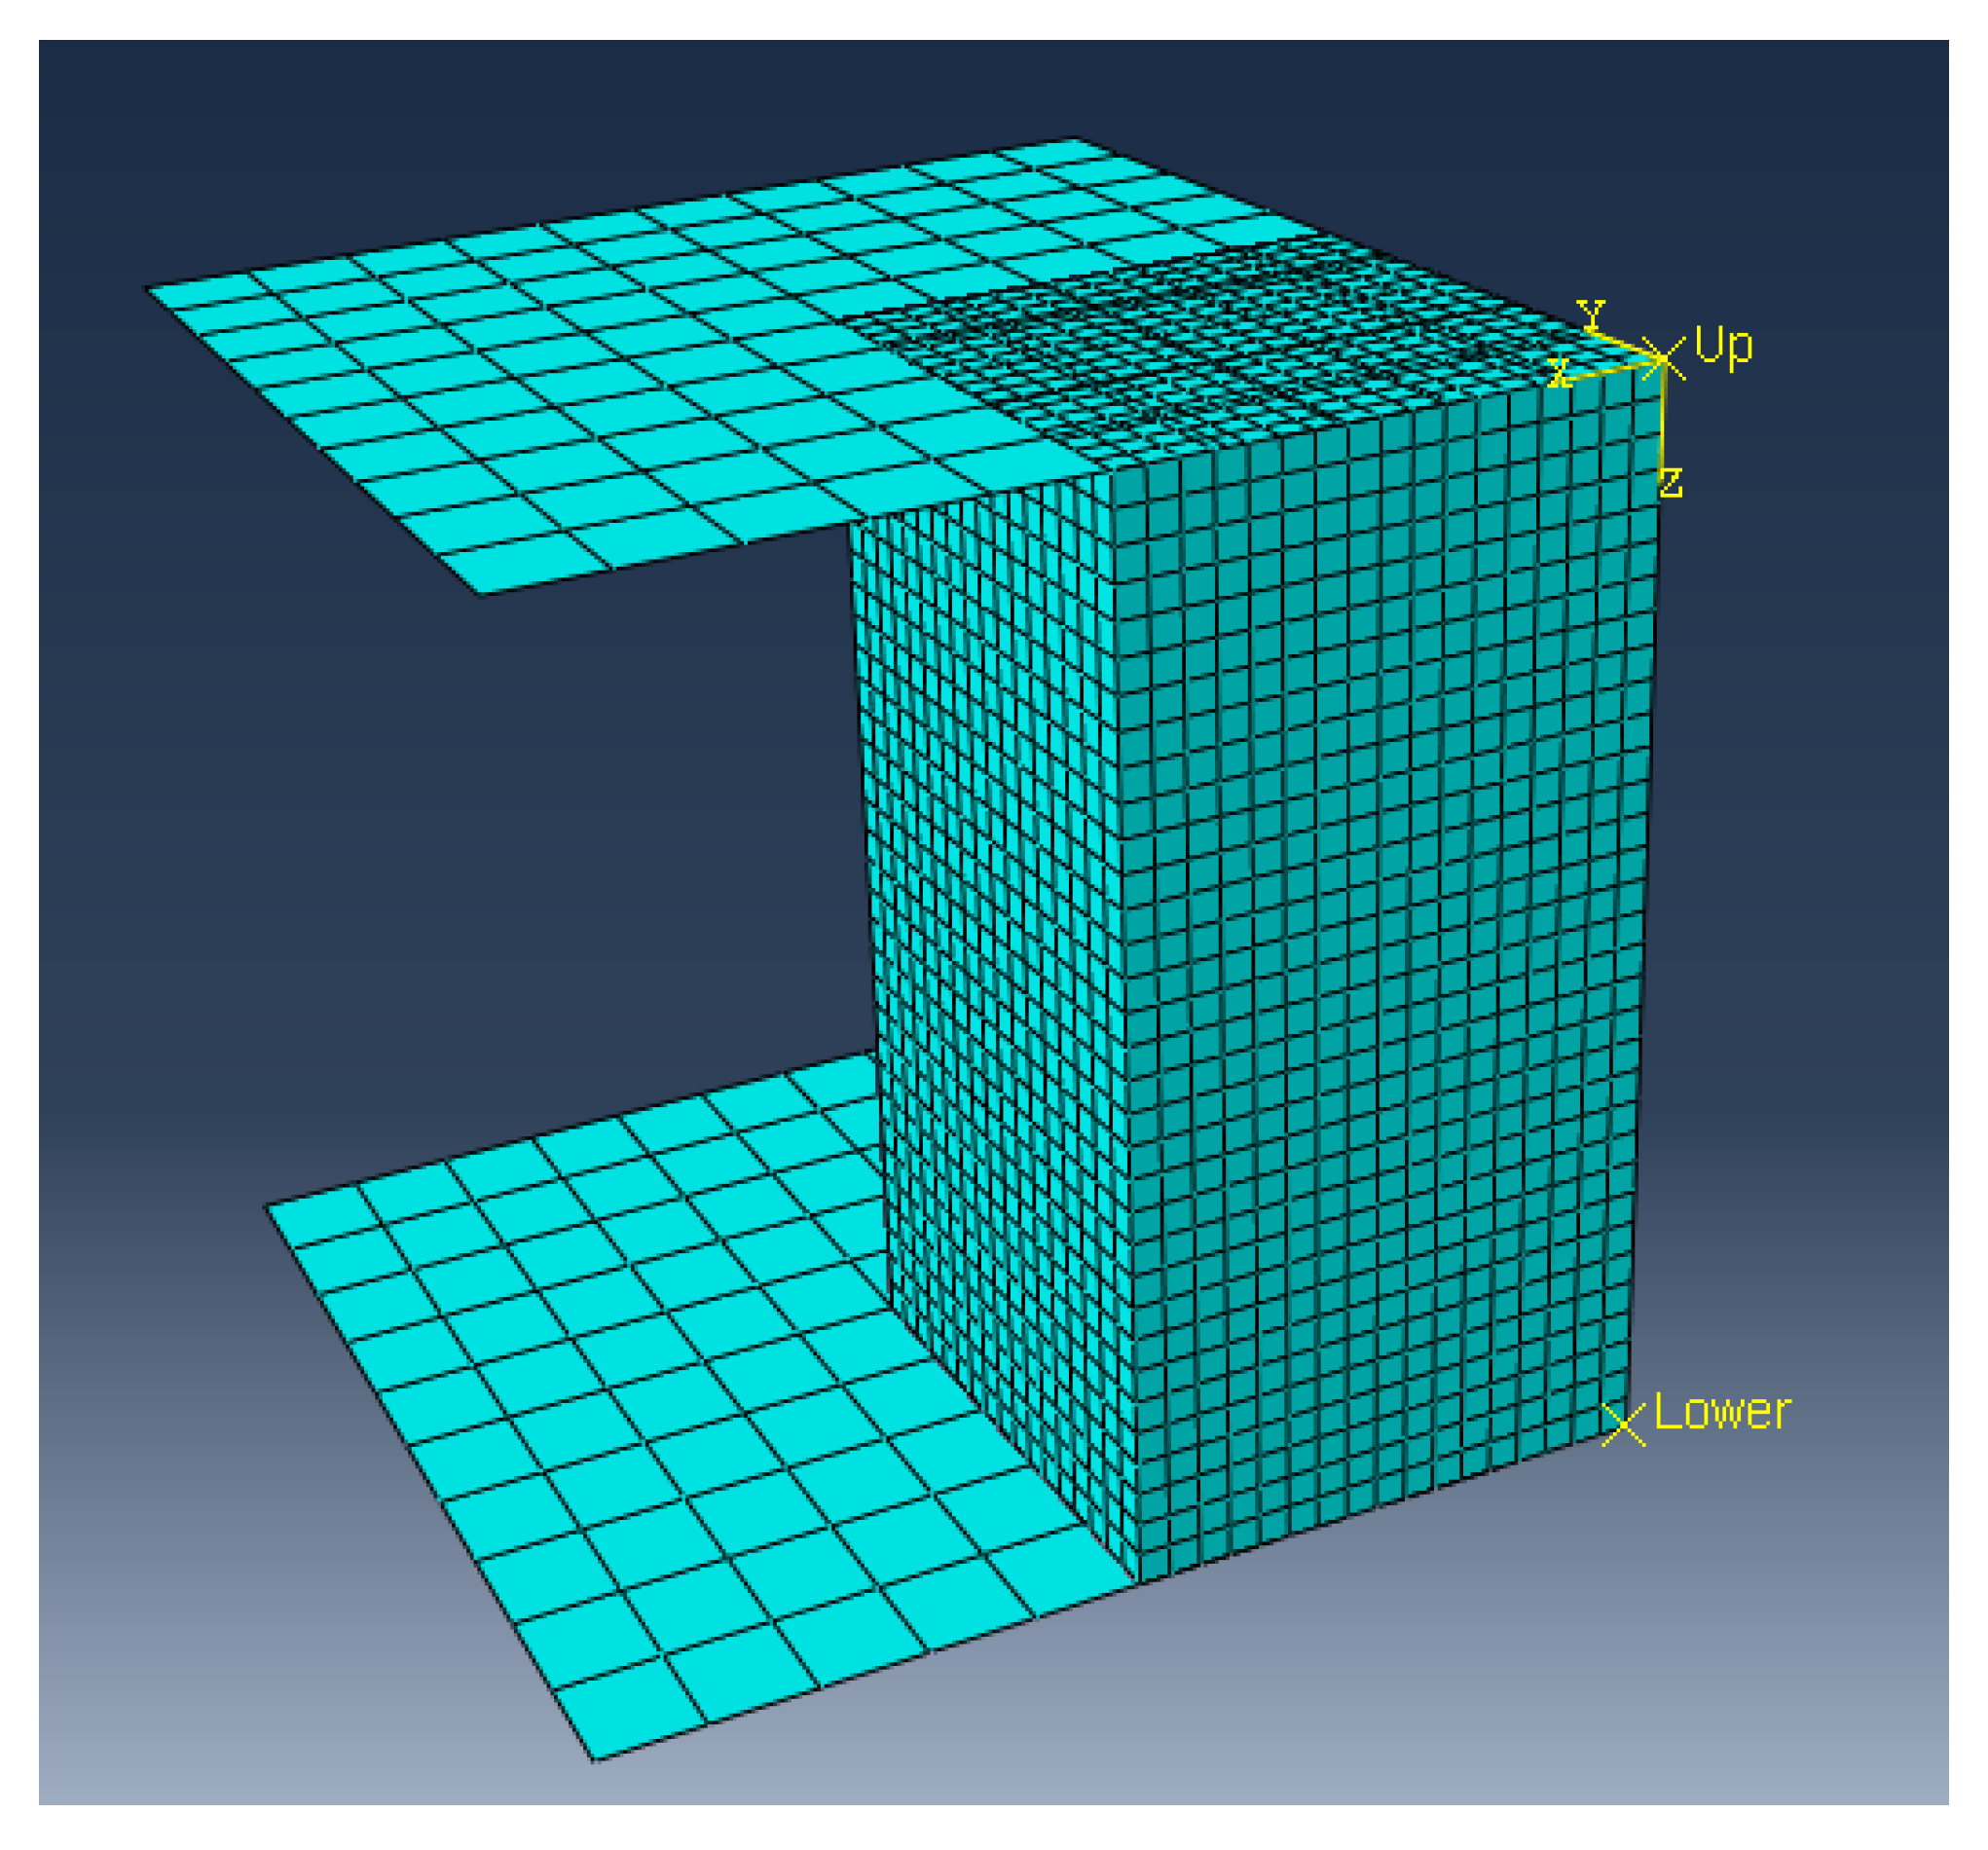
Regarding geometry, the numerical model is composed by a deformable solid (only 1/4 modelled due to symmetry), which represents the material sample and by two discrete rigid shells that represent the impactor and the ground anvil (
Figure 5). The elements used in the deformable body were hexahedrons with reduced integration and hourglass control (C3D8R). Mesh size was chosen in order to prevent any possibly numerical pathology such as locking and/or hourglassing [
30].
Table 6 summarises the optimum choice of the polynomial order. Poisson’s ratio values are also reported. They are consistent with the experimental observations, being null due to the absence of lateral deformation during uniaxial compression. On the other hand, the SE potential order was based on the material calibration analysis carried. The orders indicated in
Table 6 were the ones that enabled a better agreement with the experiments. Remaining input data consisted of the experimental uniaxial compressive stress-strain data, directly inserted as data points in the material card.
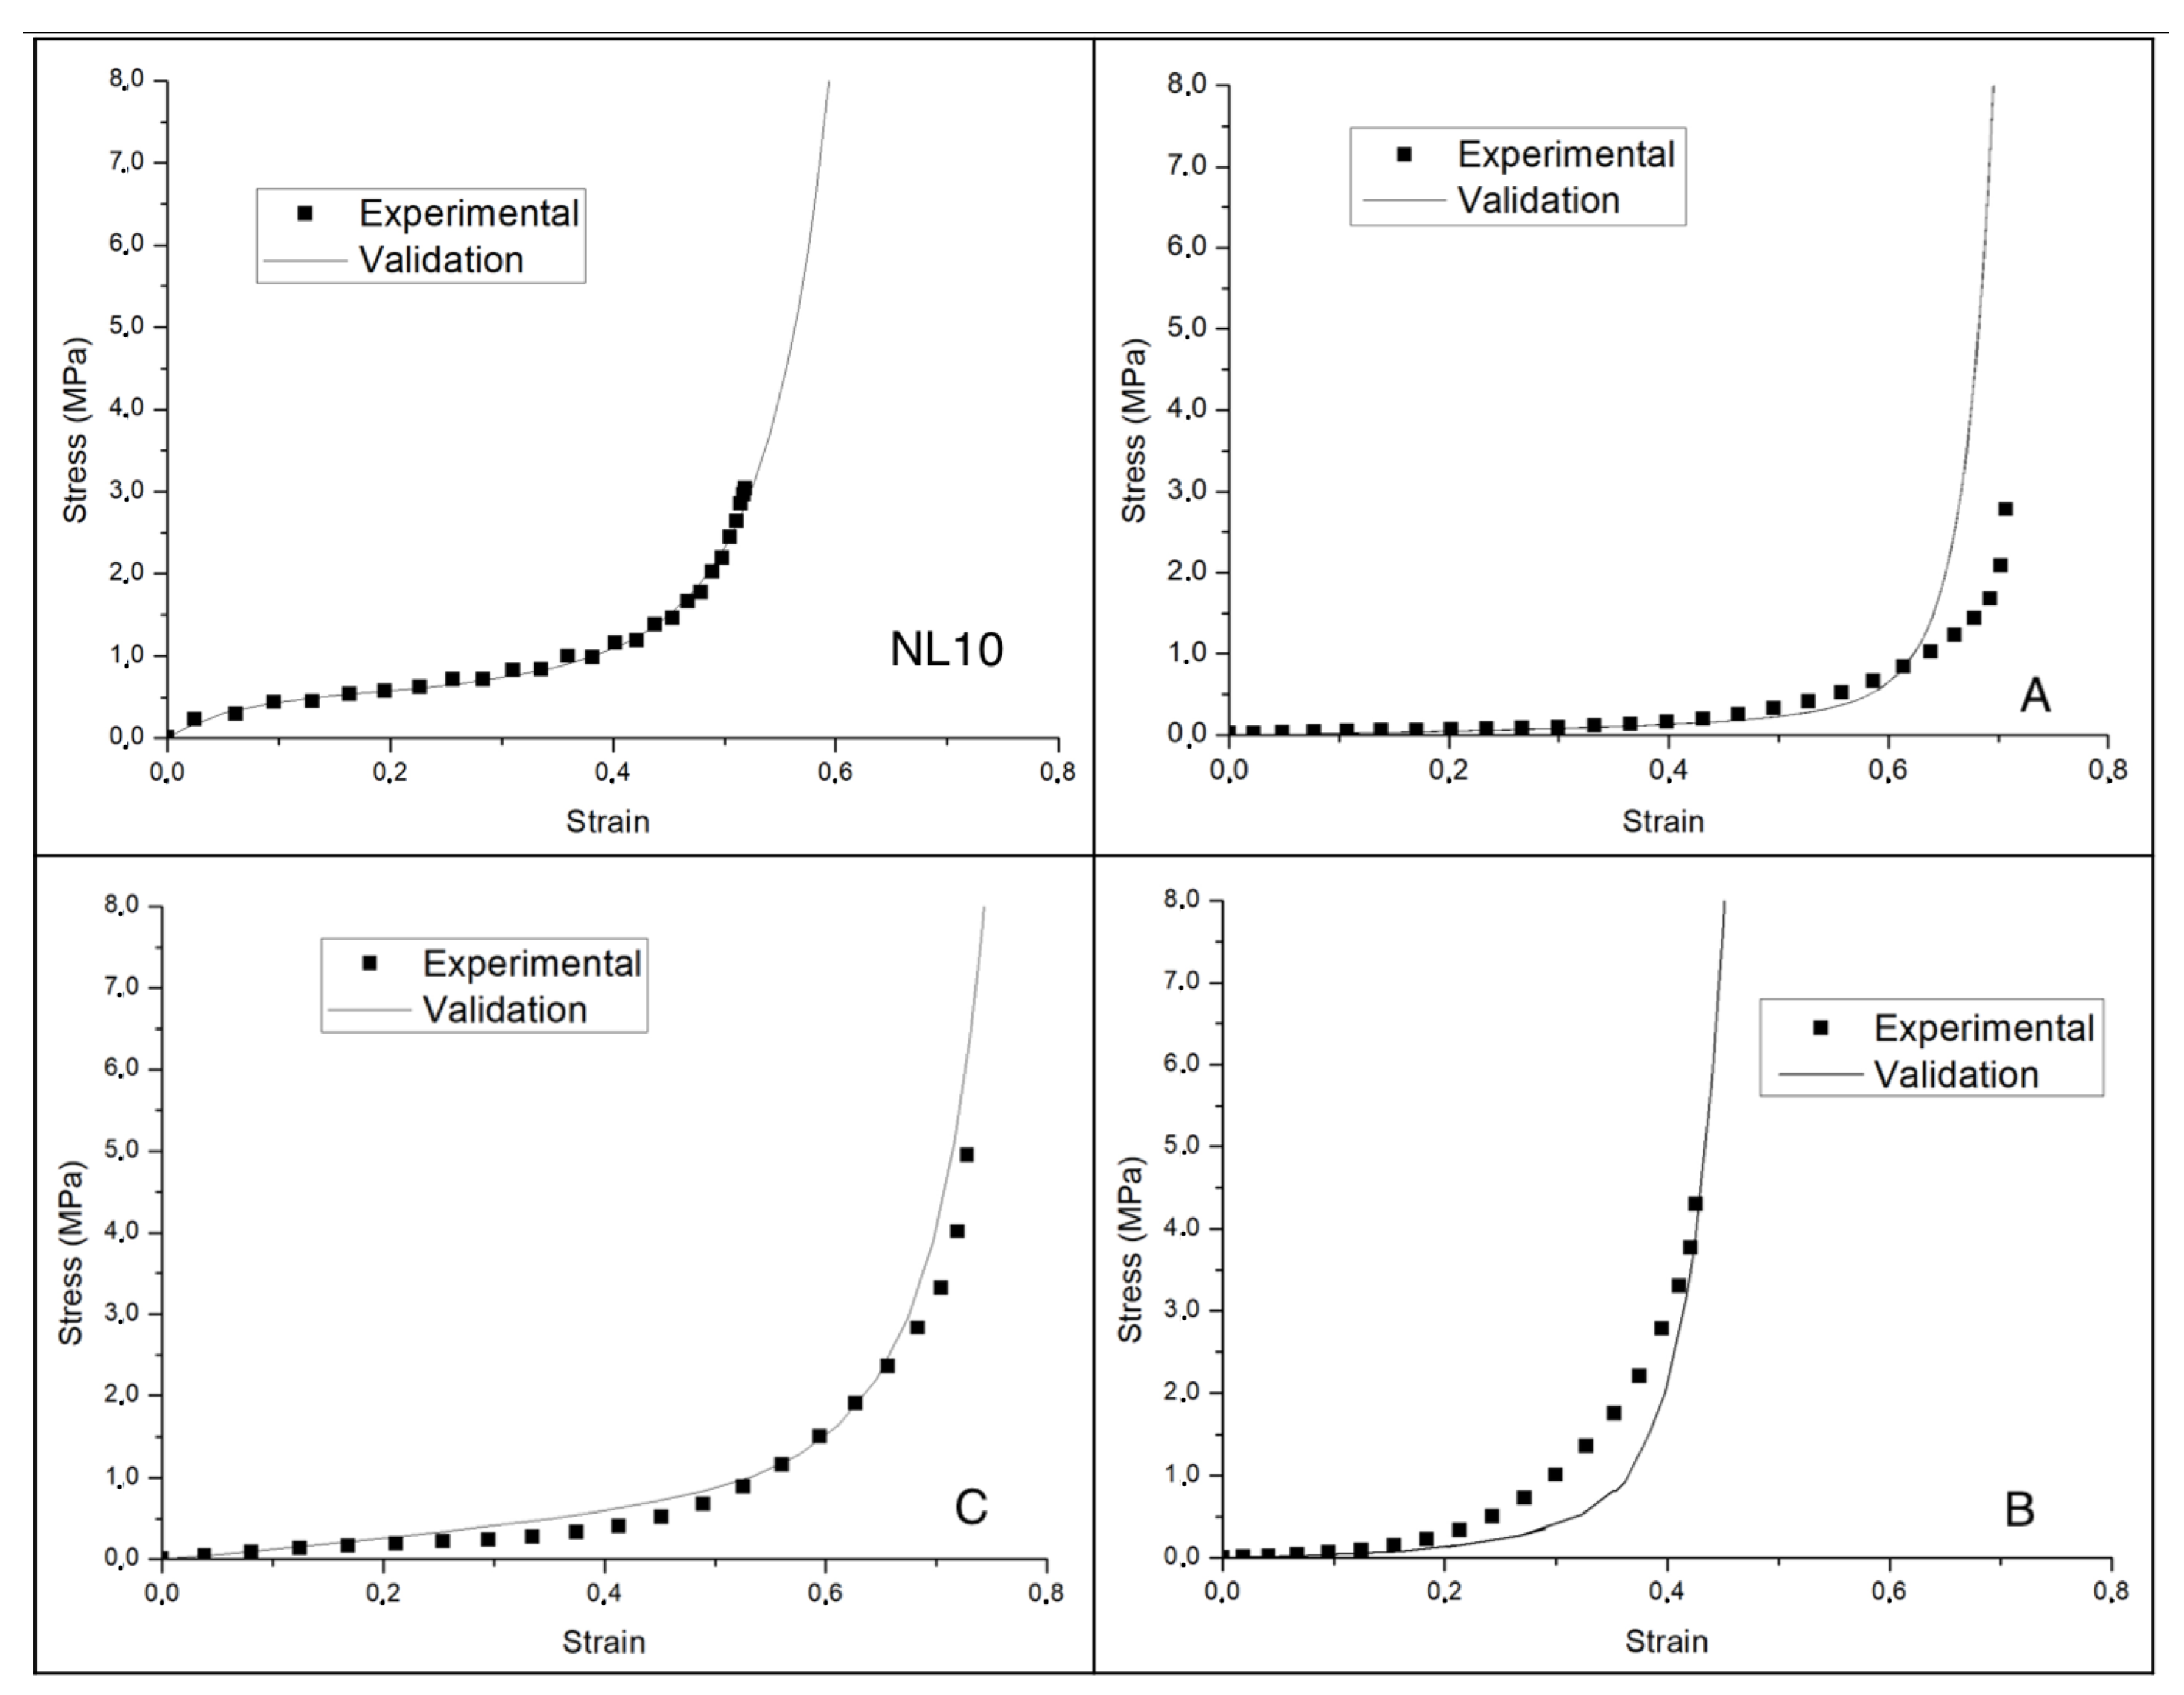
Figure 6 presents the comparison between the simulated and the experimentally measured stress-strain curves, depicting a good match between them for each material.


