Article

Determination of the Optimum Amount of Superplasticizer Additive for Self-Compacting Concrete

LADICIM (Laboratory of Materials Science and Engineering), University of Cantabria. E.T.S. de Ingenieros de Caminos, Canales y Puertos, Av./Los Castros 44, 39005 Santander, Spain
*
Author to whom correspondence should be addressed.
Appl. Sci. 2020, 10(9), 3096; https://doi.org/10.3390/app10093096
Submission received: 7 April 2020 / Revised: 20 April 2020 / Accepted: 23 April 2020 / Published: 29 April 2020
(This article belongs to the Special Issue Concrete and Mortar with Non-conventional Materials)

Abstract

:

Featured Application

This research proposes a method capable of determining the optimal amount of superplasticizer additive necessary to obtain self-compacting concrete by an indirect method through measuring the concrete mixer’s electrical consumption.

Abstract

Self-compacting concrete modifies its workability with small variations in the amount of superplasticizer additive. For this reason, large number of tests are required to monitor its workability. In order to determine the appropriate amount of additive for a single mix, the evolution of the power consumption of the concrete mixer during the addition of small amounts of additive to the concrete was analyzed. These results were compared both with typical workability characterization for self-compacting concrete and with the saturation point results, determined by the Marsh cone method. After this comparison, a good correlation was obtained between the results from the traditional tests and the proposed “concrete mixer method”.

1. Introduction

Self-compacting concrete (SCC) was developed to solve durability problems in reinforced concrete structures, which were appearing at the beginning of the nineteen eighties in Japan. These problems were due to the lack of experience of the workers in the construction sector, which had an impact on construction quality and, especially, durability [1]. For this reason, Professor Hajime Okamura of the University of Tokyo proposed the design of a concrete whose final result depended as little as possible on the construction process, more specifically, to mix a concrete that did not need to be vibrated after pouring [2,3]. The use of SCC brings a series of advantages that can be classified into two types: logistical and technical. The logistical advantages are a consequence of eliminating the vibration phase for concrete, in other words, the number of operators and the execution time are reduced [4]. In addition, eliminating the vibration phase provides savings in electricity costs and reduces noise pollution. The technical advantages are derived from this concrete’s greater flow capacity, which, regardless of the density of the reinforcement, makes it easier to pour and even pump. It can better encapsulate the reinforcements and facilitates the filling of formworks with complex geometries [5,6].
It is estimated that approximately 10% of man-made CO2 emissions are from concrete production and transportation [7]. SCC is one of the most eco-friendly types of concrete because waste materials have always been used in SCC as the mineral powder, such as marble powder or fly ash [8]. This substitution is generalized because SCC requires a high quantity of fine particles and, in order to limit the economic cost by reducing the quantity of cement, other fine particles are used. As an example, Yepes et al. [9] found that the optimal cost solutions have quite satisfactory environmental outcomes when using high strength SCC for the construction of precast–prestressed concrete U-beam road bridges.
There are three main differences between SCC and conventional concrete are in terms of composition. The first of these is the use of a lower content of coarse aggregate, which usually has a relatively small maximum size, in order to minimize the segregation tendency [10]. Secondly, it has a higher fine particle content, specifically, with fines of less than 125 μm. Thirdly, and most importantly, it is imperative to use superplasticiser admixtures (SPAs) in order to achieve the workability necessary for a self-compacting concrete [11]. These three conditions must be fulfilled to generate a mixture with an appropriate viscosity/flowability ratio, which allows the fresh mixture to flow, but without allowing any of the concrete components to segregate [12].
SPAs are considered to be the most important element in SCC. The progress, evolution and popularity of SCC in recent years has been driven by progress in the chemical formulation of the latest SPA generation. The polycarboxylate type SPA makes it possible to achieve appropriate workability and flowability in concrete in spite of the high content of fines that these concretes have, making the mixture more viscous and reducing the amount of water by up to 40% [13]. In addition, it has been shown that the use of these SPAs enables the recycled concretes to minimize the property reduction caused by using these recycled aggregates [14,15,16]. Nonetheless, as Revilla-Cuesta et al. [17] concluded, the optimization of the water content is necessary to balance the extra water required by the high water absorption of the recycled aggregates and the reduction in the effective water/cemet (w/c) ratio required to increase the mechanical properties of recycled concretes.
There is no specific tool for determining the optimum amount of SPA for SCC. A lack of SPA in the concrete without enough flowability can lead to serious durability problems in structures. A low flowability can cause high porosity and permeability with a corresponding loss of durability. In addition, the concrete will require higher energy consumption for its correct vibration, if this is necessary/possible. On the other hand, an excessive amount of SPA will result in an increase in cost without improving the properties of the concrete, since the SPA will cease to be efficient above the saturation point determined by the Marsh cone test, the quantity of SPA above which the concrete’s fluidity gain is minimal despite a notable increase in the amount of SPA [18,19,20].
As Okamura states, “When self-compacting concrete becomes so widely used that it is seen as the “standard concrete” rather than a “special concrete,” we will have succeeded in creating durable and reliable concrete structures that require very little maintenance work.” [21]. To achieve this objective, it is necessary to have a design method for SCC that is as fast, economical and robust as possible. According to the method proposed by Okamura, the design of a self-compacting concrete begins with the determination of the SPA in mortars, after which, it is adjusted in concrete mix trials. Other methods are based on the definition of the saturation point determined in pastes. The advantage of this method is that the volume and cost of mortars and pastes is smaller than of concrete. Melo et al. [22] proposed a method to optimize the SPA in self-compacting concretes by mean of tests performed in pastes and mortars. Kwan et al. [23] concluded that the effect of SPA varies according to the w/c ratio and the fine/total aggregate ratio, making it even more difficult to design these SCCs. Brouwers et al. [24] defined a design method for conventional strength SCC based on minimizing the volume of mortar. All these different methods that have been developed, according Ashish et al. [25], could be divided in six categories, namely, empirical design methods, statistical factorial design methods, strength-based design methods, rheology of paste methods, particle packing methods and Eco-SCC mixture design methods.
At present, the process of determining the amount of SPA in SCC involves carrying out a wide range of tests on cement pastes, mortars and concretes [26]. In the present work, an alternative method has been proposed for determining the optimum amount of SPA. In order to validate this hypothesis, in this study, the relevant tests were carried out on cement pastes and concretes to arrive at the appropriate mix proportions of an SCC and, subsequently, a concrete mix was made while recording the evolution of the mixer’s power consumption. This concrete mix was based on an initial situation with a 0% SPA/cement (SPA/C) ratio. Subsequently, small quantities of SPA were added so that the effect of increasing this quantity of SPA on the consumption of the concrete mixer could be seen, with the consumption of the concrete mixer being correlated to the fluidity of the mixture.

2. Materials and Methods

2.1. Materials

For the manufacture of the cement paste and the concrete, a CEM IV (V) 32.5 N type according to EN 197-1 [27] was used [28]. The density of this concrete is 2.85 g/cm3, determined according to UNE 80103 [29], and the Blaine specific surface was 3885 cm2/g, obtained according to EN 196-6 [30]. In Table 1, the chemical composition of the cement is given. This cement was chosen because it has a high replacement of clinker by fly ash, so it can provide the fine particles that are needed for SCC. Furthermore, this cement was chosen because it has an adequate open time for analyzing its workability, showing that there was no hydration, even after 30 min.
The SPA used in this work is a polycarboxylic ether type superplasticizer called “MasterGlenium® ACE 450 BASF” [31].
The aggregate properties obtained were the densities according Table 2 and the grading curve (see Figure 1) according to EN 933–1 [32].

2.2. Mix Proportions

All the concrete mixes, both the ones used to perform the conventional workability tests and the one whose amount of SPA was progressively increased, contained the same amounts of water, cement, silica sand and limestone gravel. Table 3 defines the mix proportions. The amount of SPA/C varied across the different type of test.

2.3. Cement Paste Flowability

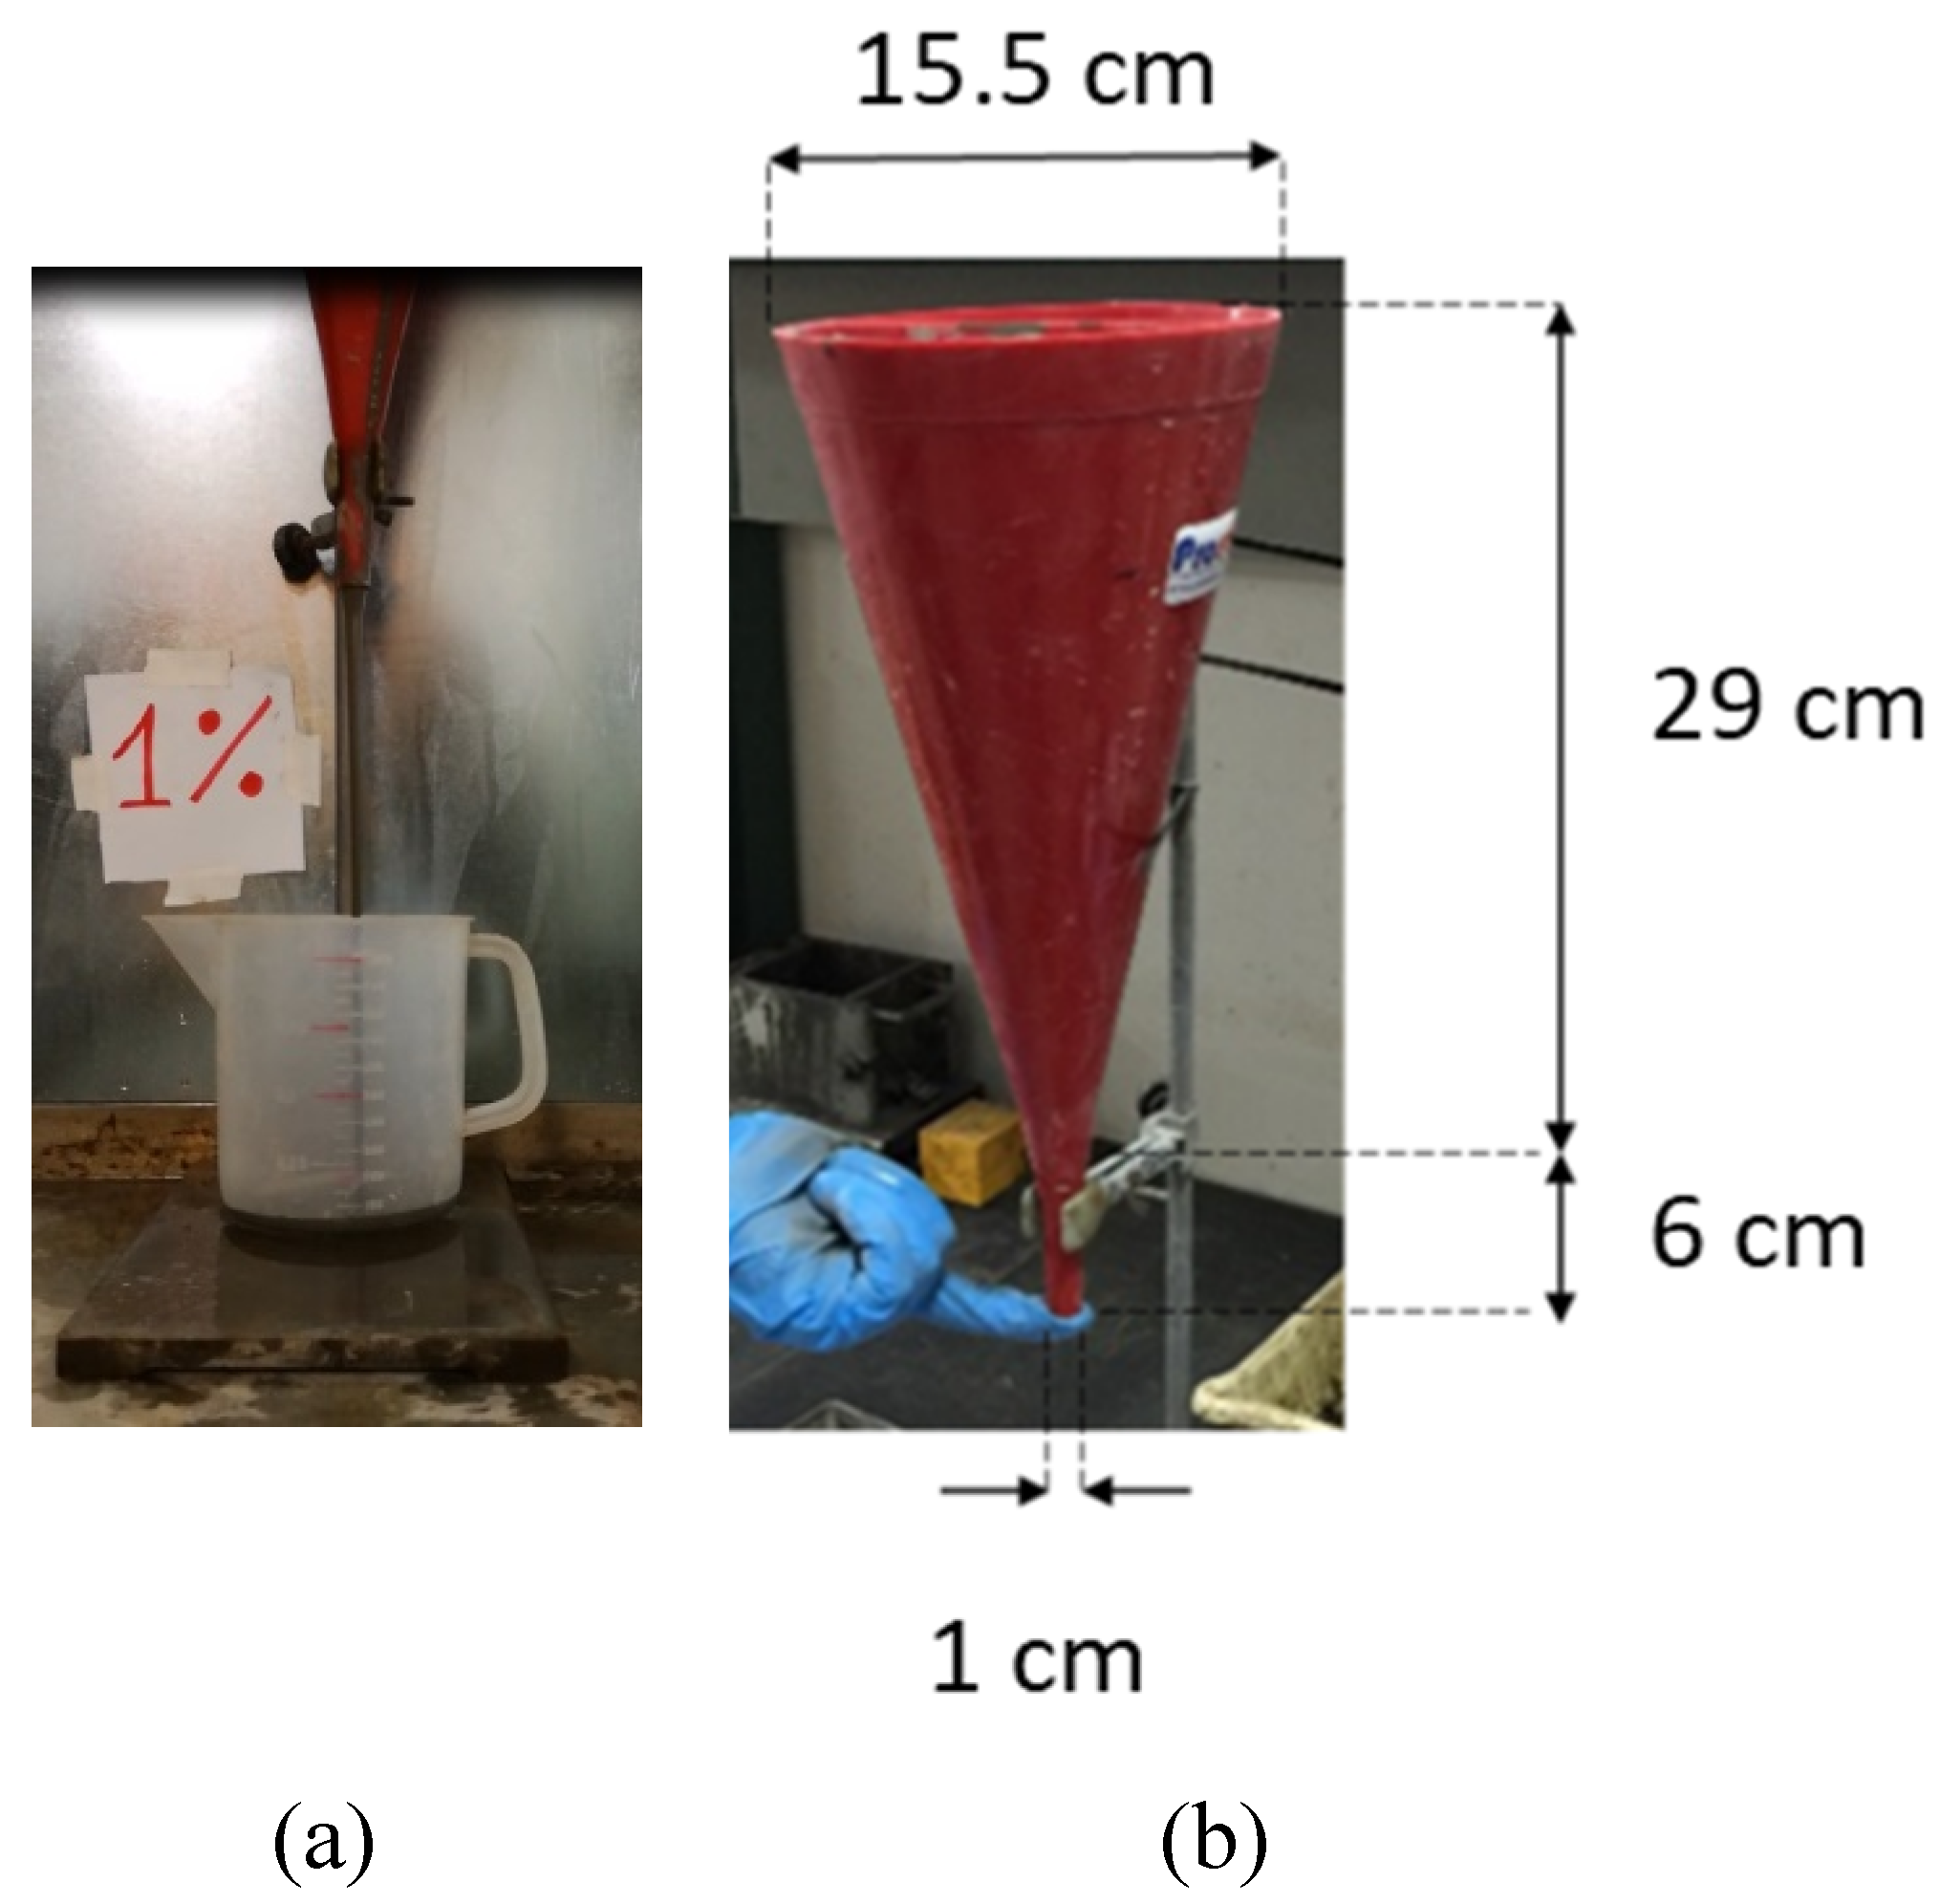
The analysis of the effect of the amount of SPA was started by determining the saturation point in the Marsh cone test, see Figure 2a,b. The Marsh cone evaluates the flowability of cement pastes or mortars. The procedure is performed according to ASTM C939-97 [33] and, in this case, consists of passing a volume of fresh cement paste through the test tool, registering the time that it takes to pass the first 200 mL (see Figure 2a). Before beginning to manufacture the mortars, the water and the SPA were mixed, after which the cement, water and SPA were mixed for 3 min.
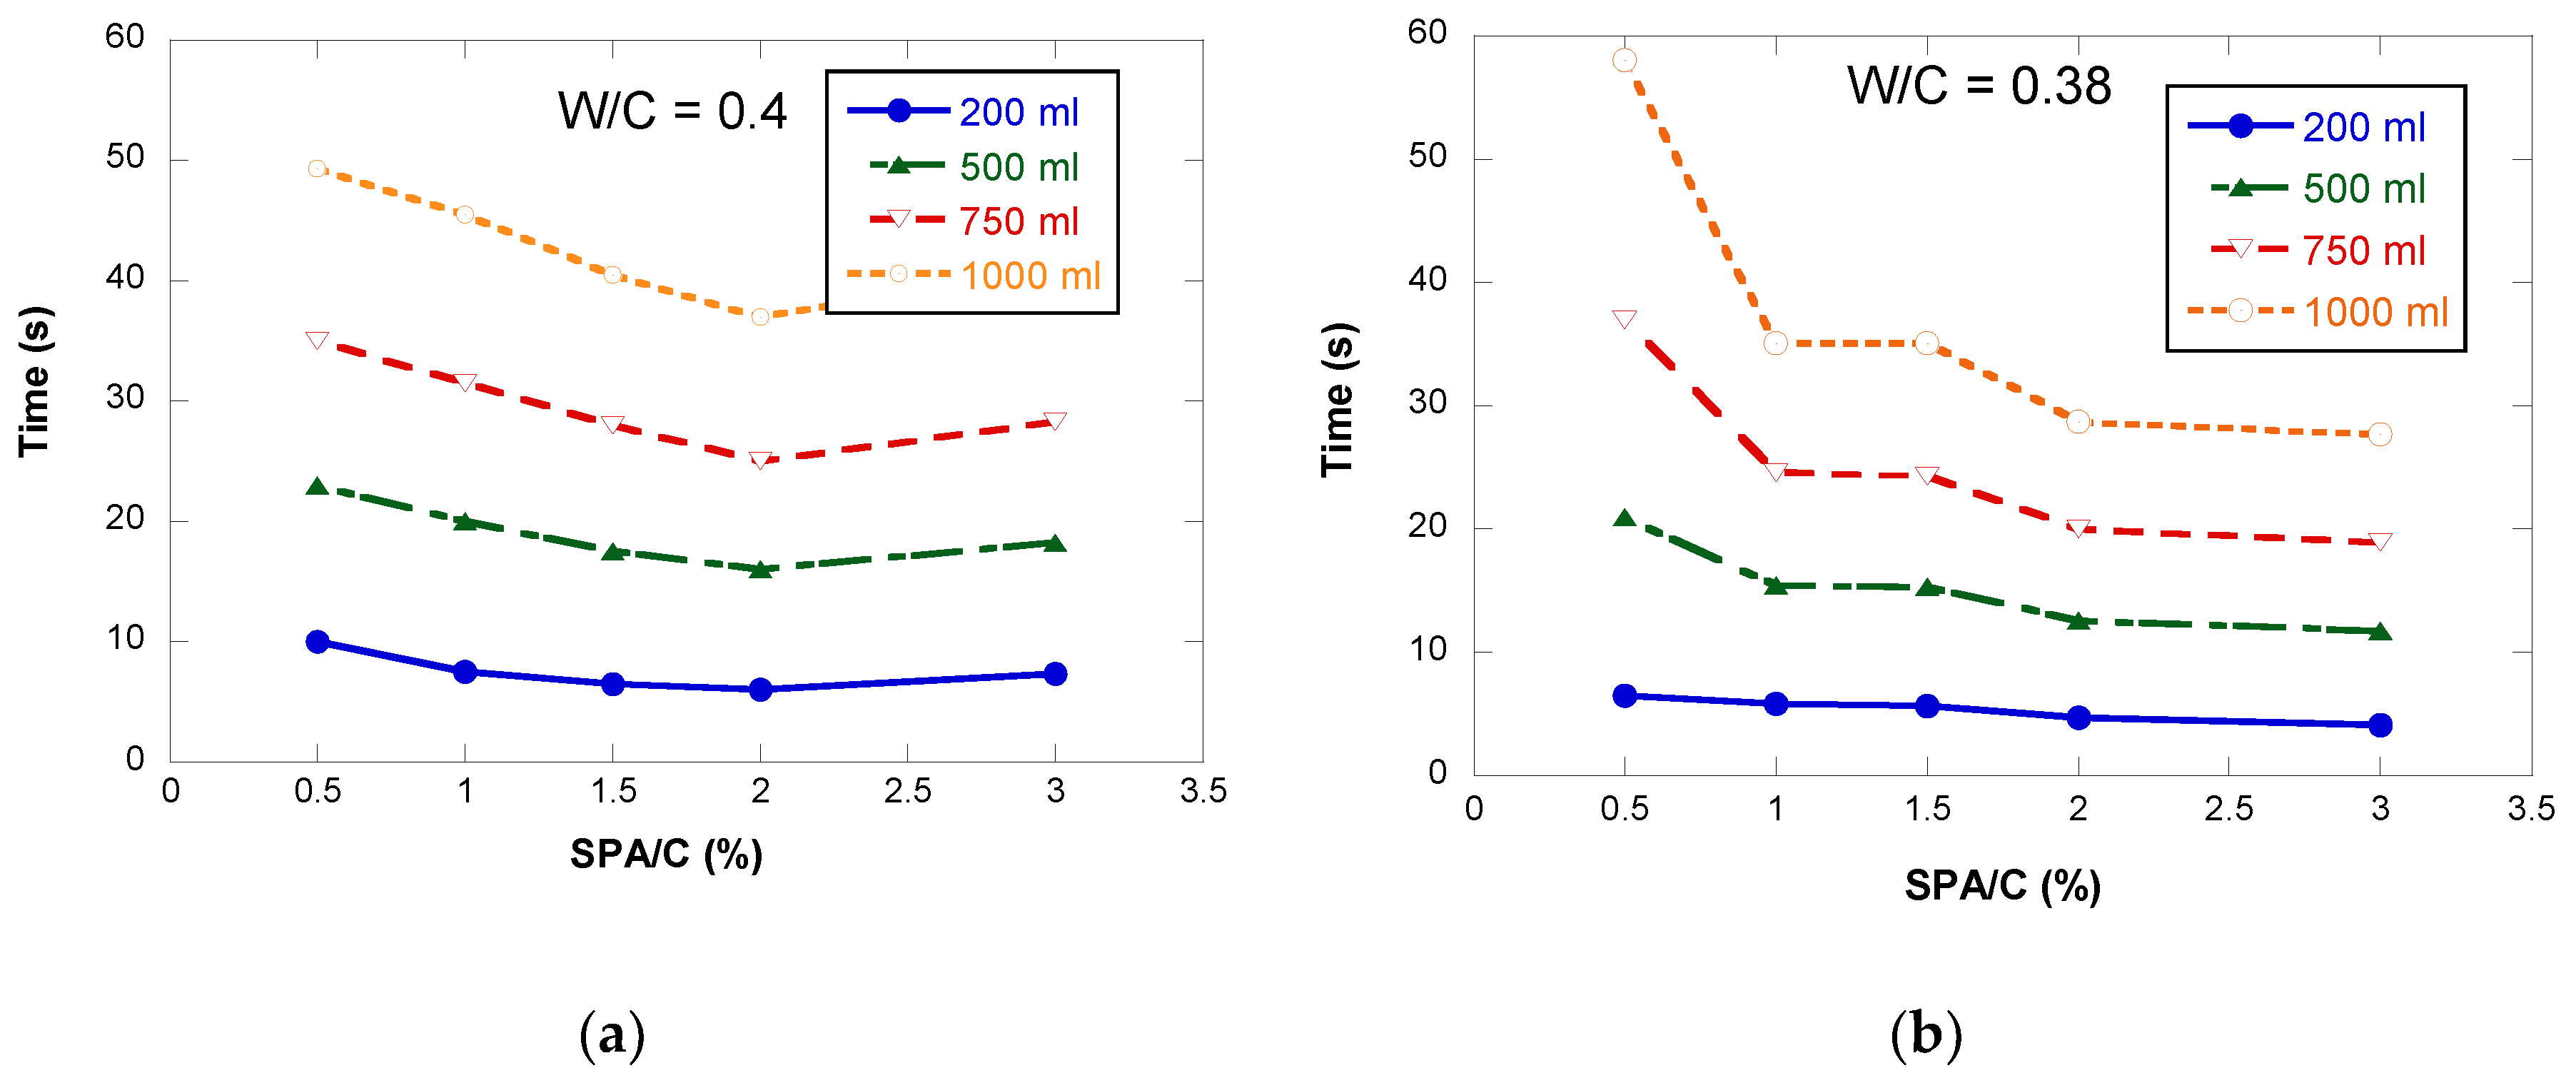
The test was carried out on cement pastes with SPA/C percentages of 0%, 0.5%, 1%, 1.5%, 2% and 3%. To evaluate the influence of the w/c ratio on the saturation point, or optimal SPA concentration, the tests were repeated with a paste with a w/c of 0.38 and 0.40, respectively. Additionally, as Sainz-Aja et al. [34] did, the flow times for 500, 750 and 1000 mL were recorded, in order to obtain more robust results. The flowability is undoubtedly influenced by the mixing time of SP addition, and testing with other time intervals for the addition of SP and/or adding different percentage amounts could result in a more accurate saturation point value. In this case, the measurement results are influenced by the time of SP addition, but this way is not necessarily more accurate. However, in order to obtain a greater precision in the testing times, the tests were recorded on video and later, from these videos, the different testing times were determined.

2.4. Concrete Flowability

In order to analyze the concrete flowability as a function of the SPA/C, standardized tests were carried out to characterize it. Specifically, the following tests were carried out: slump flow, L-box and V-funnel. Firstly, the aggregates were introduced into the concrete mixer from the largest to the smallest, after which the cement was added; at this point, the concrete mixer was started and approximately 90% of the adjusted amount of water was added. After 1 min of mixing, the remaining 10% of the adjusted amount of water and the SPA were added. The mixing procedure continued for 8 min before the workability tests were performed.
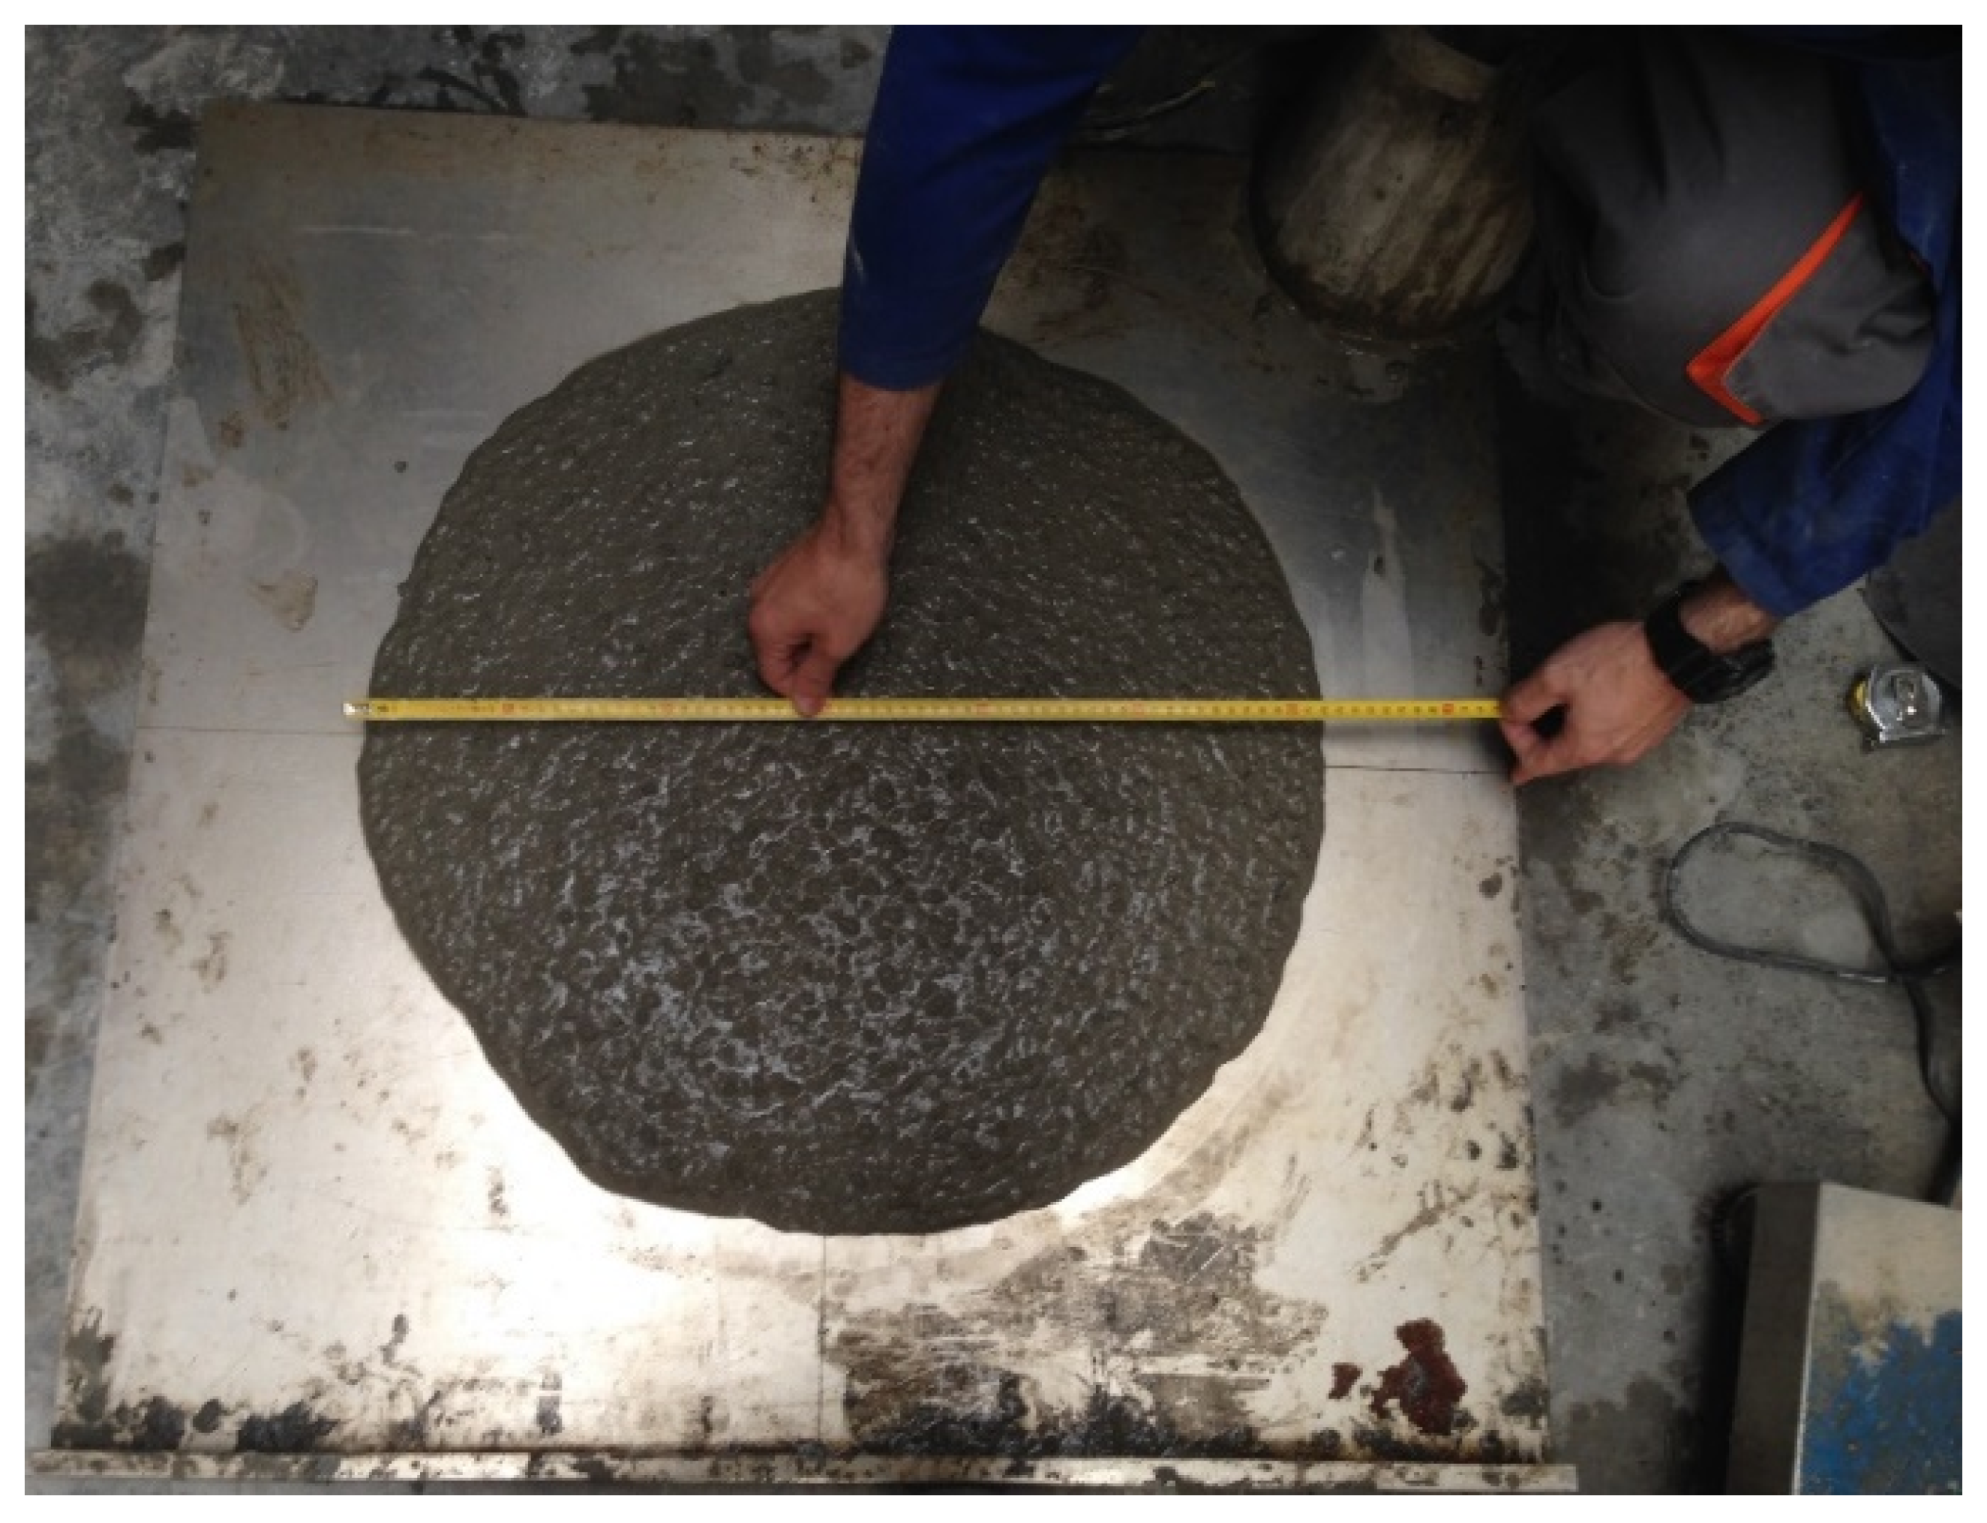
Slump flow tests were carried out according to standard EN 12350-5 [35], which takes as a reference the test described in standard EN 12350-2 [36]. The concrete is filled into a conical metal mold supported by a metal plate, and after waiting for 30 s, it is lifted. Once it has been vertically removed, the following parameters are measured: the time that it takes for the concrete to reach 500 mm, marked on the metal plate (t500), and the slump flow diameters in two perpendicular directions once the concrete has stopped flowing (D1 and D2). In addition to the acquisition of data defined by the standard, photos were taken of the final appearance of the slump flow given the information that it provides. An example of the process followed to measure each of the diameters can be seen in Figure 3.
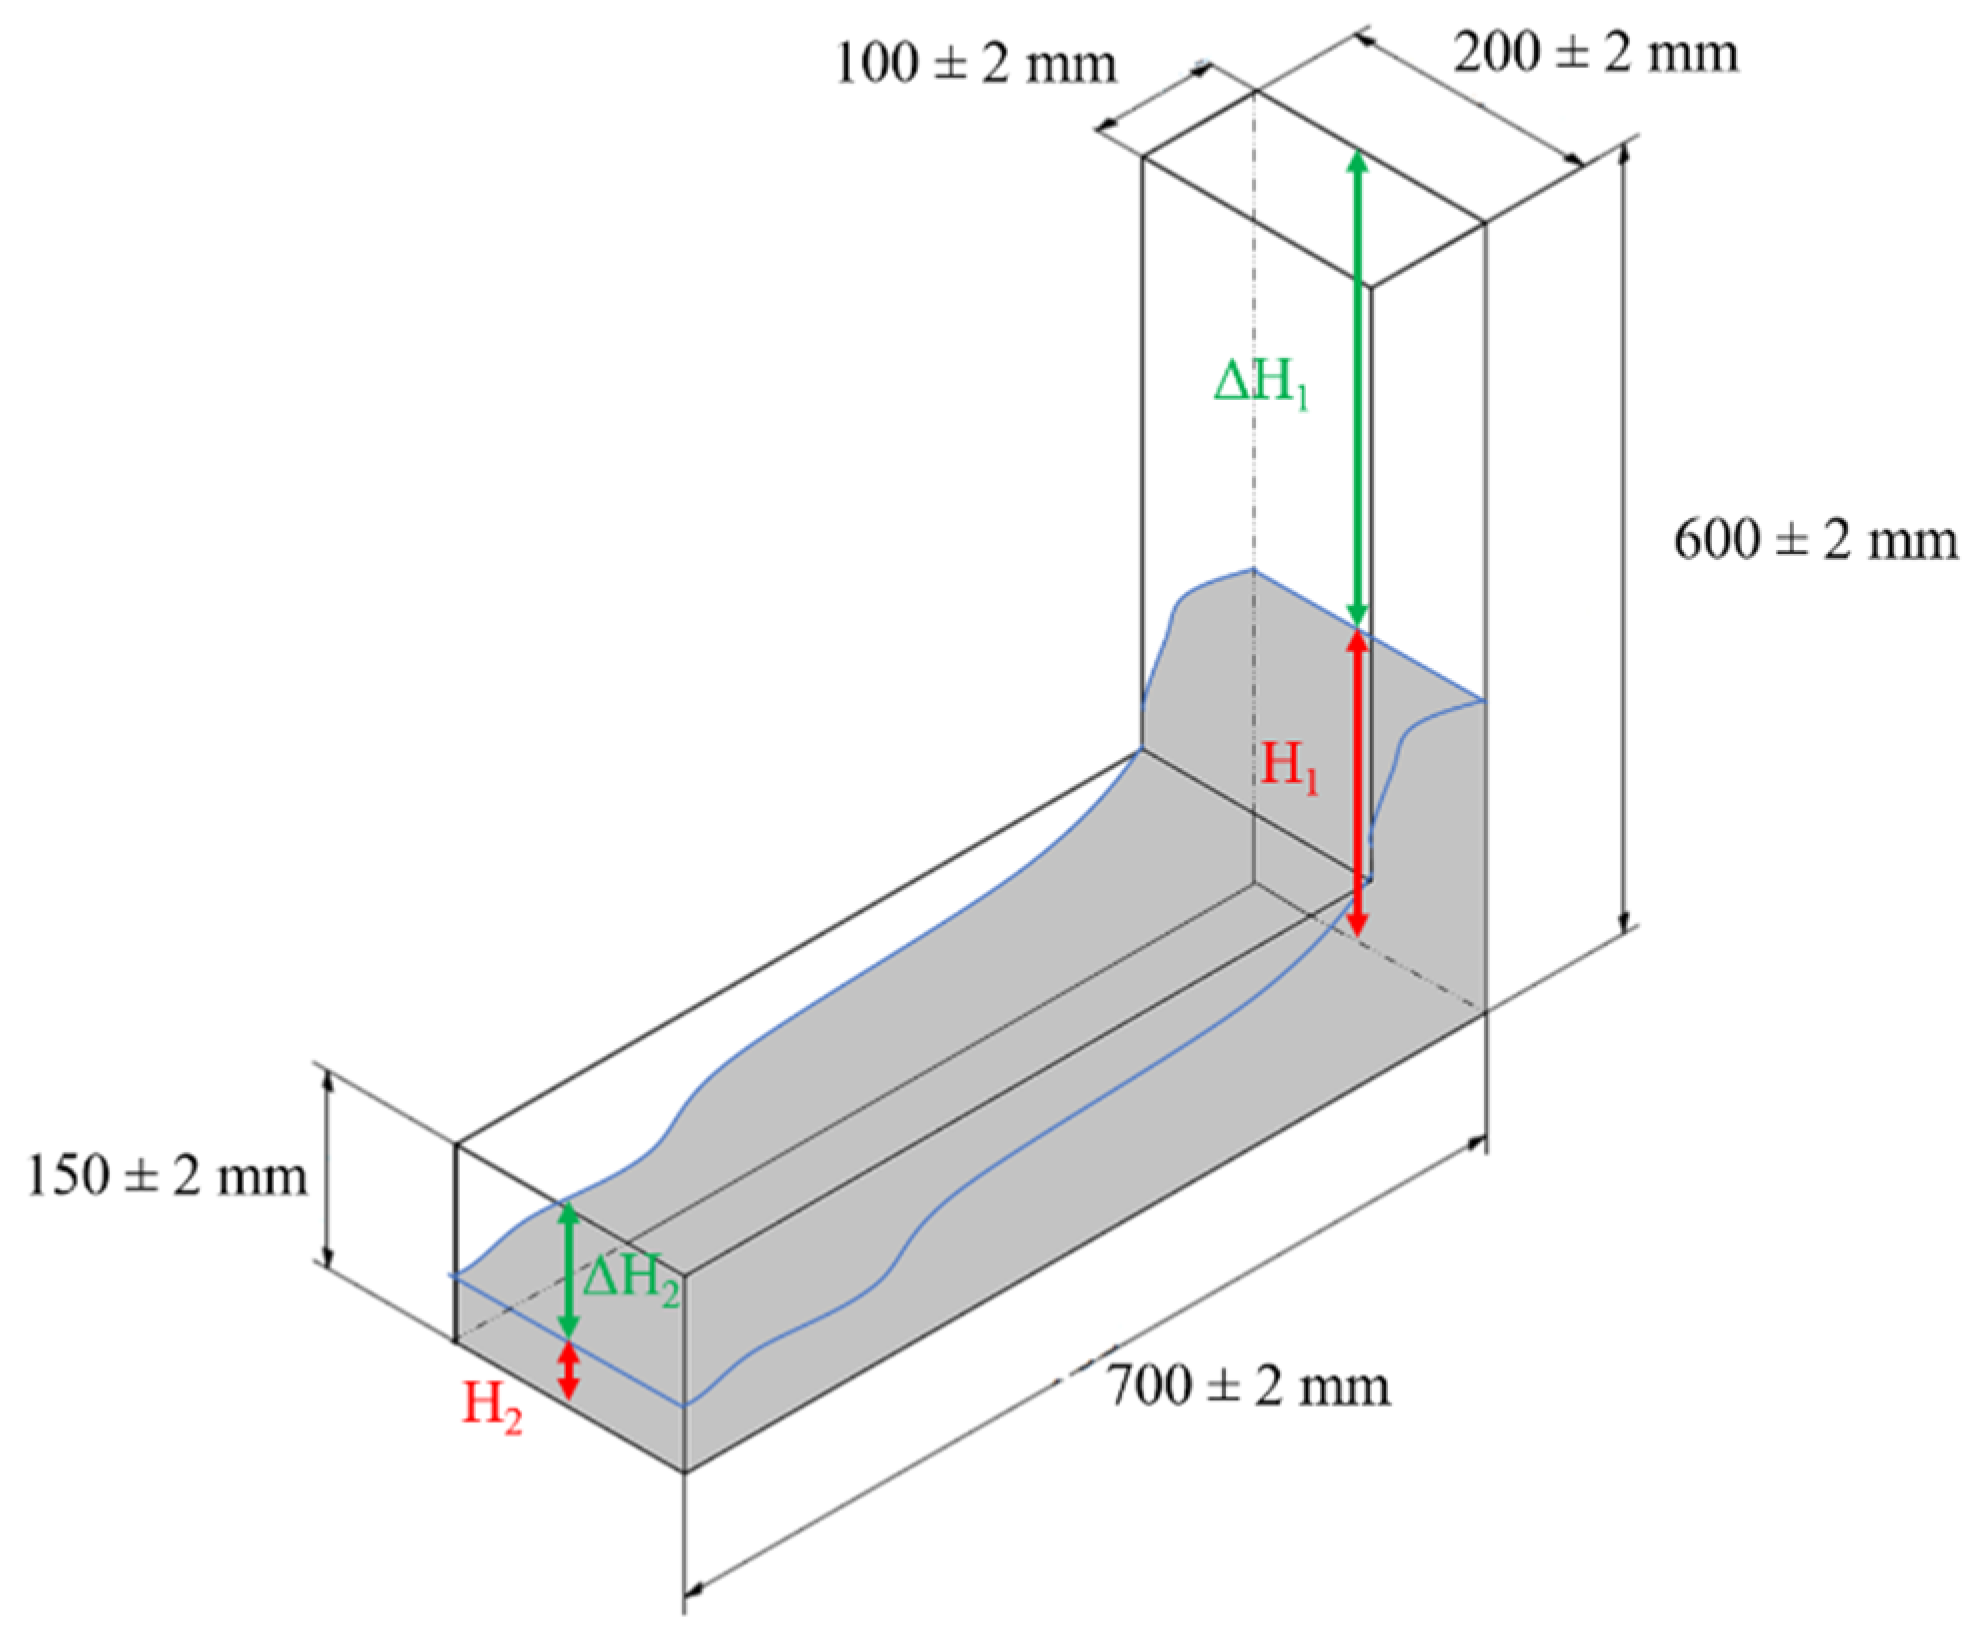
L-box tests are carried out in accordance with the EN 12350-10 [37] standard, consisting of filling the vertical part of the mold with fresh concrete continuously and without any compaction. After waiting 60 s, the gate is opened and, once concrete has finished flowing, the difference in the height of the fresh concrete between the inlet (H1) and outlet (H2) of the box is measured (Figure 4).
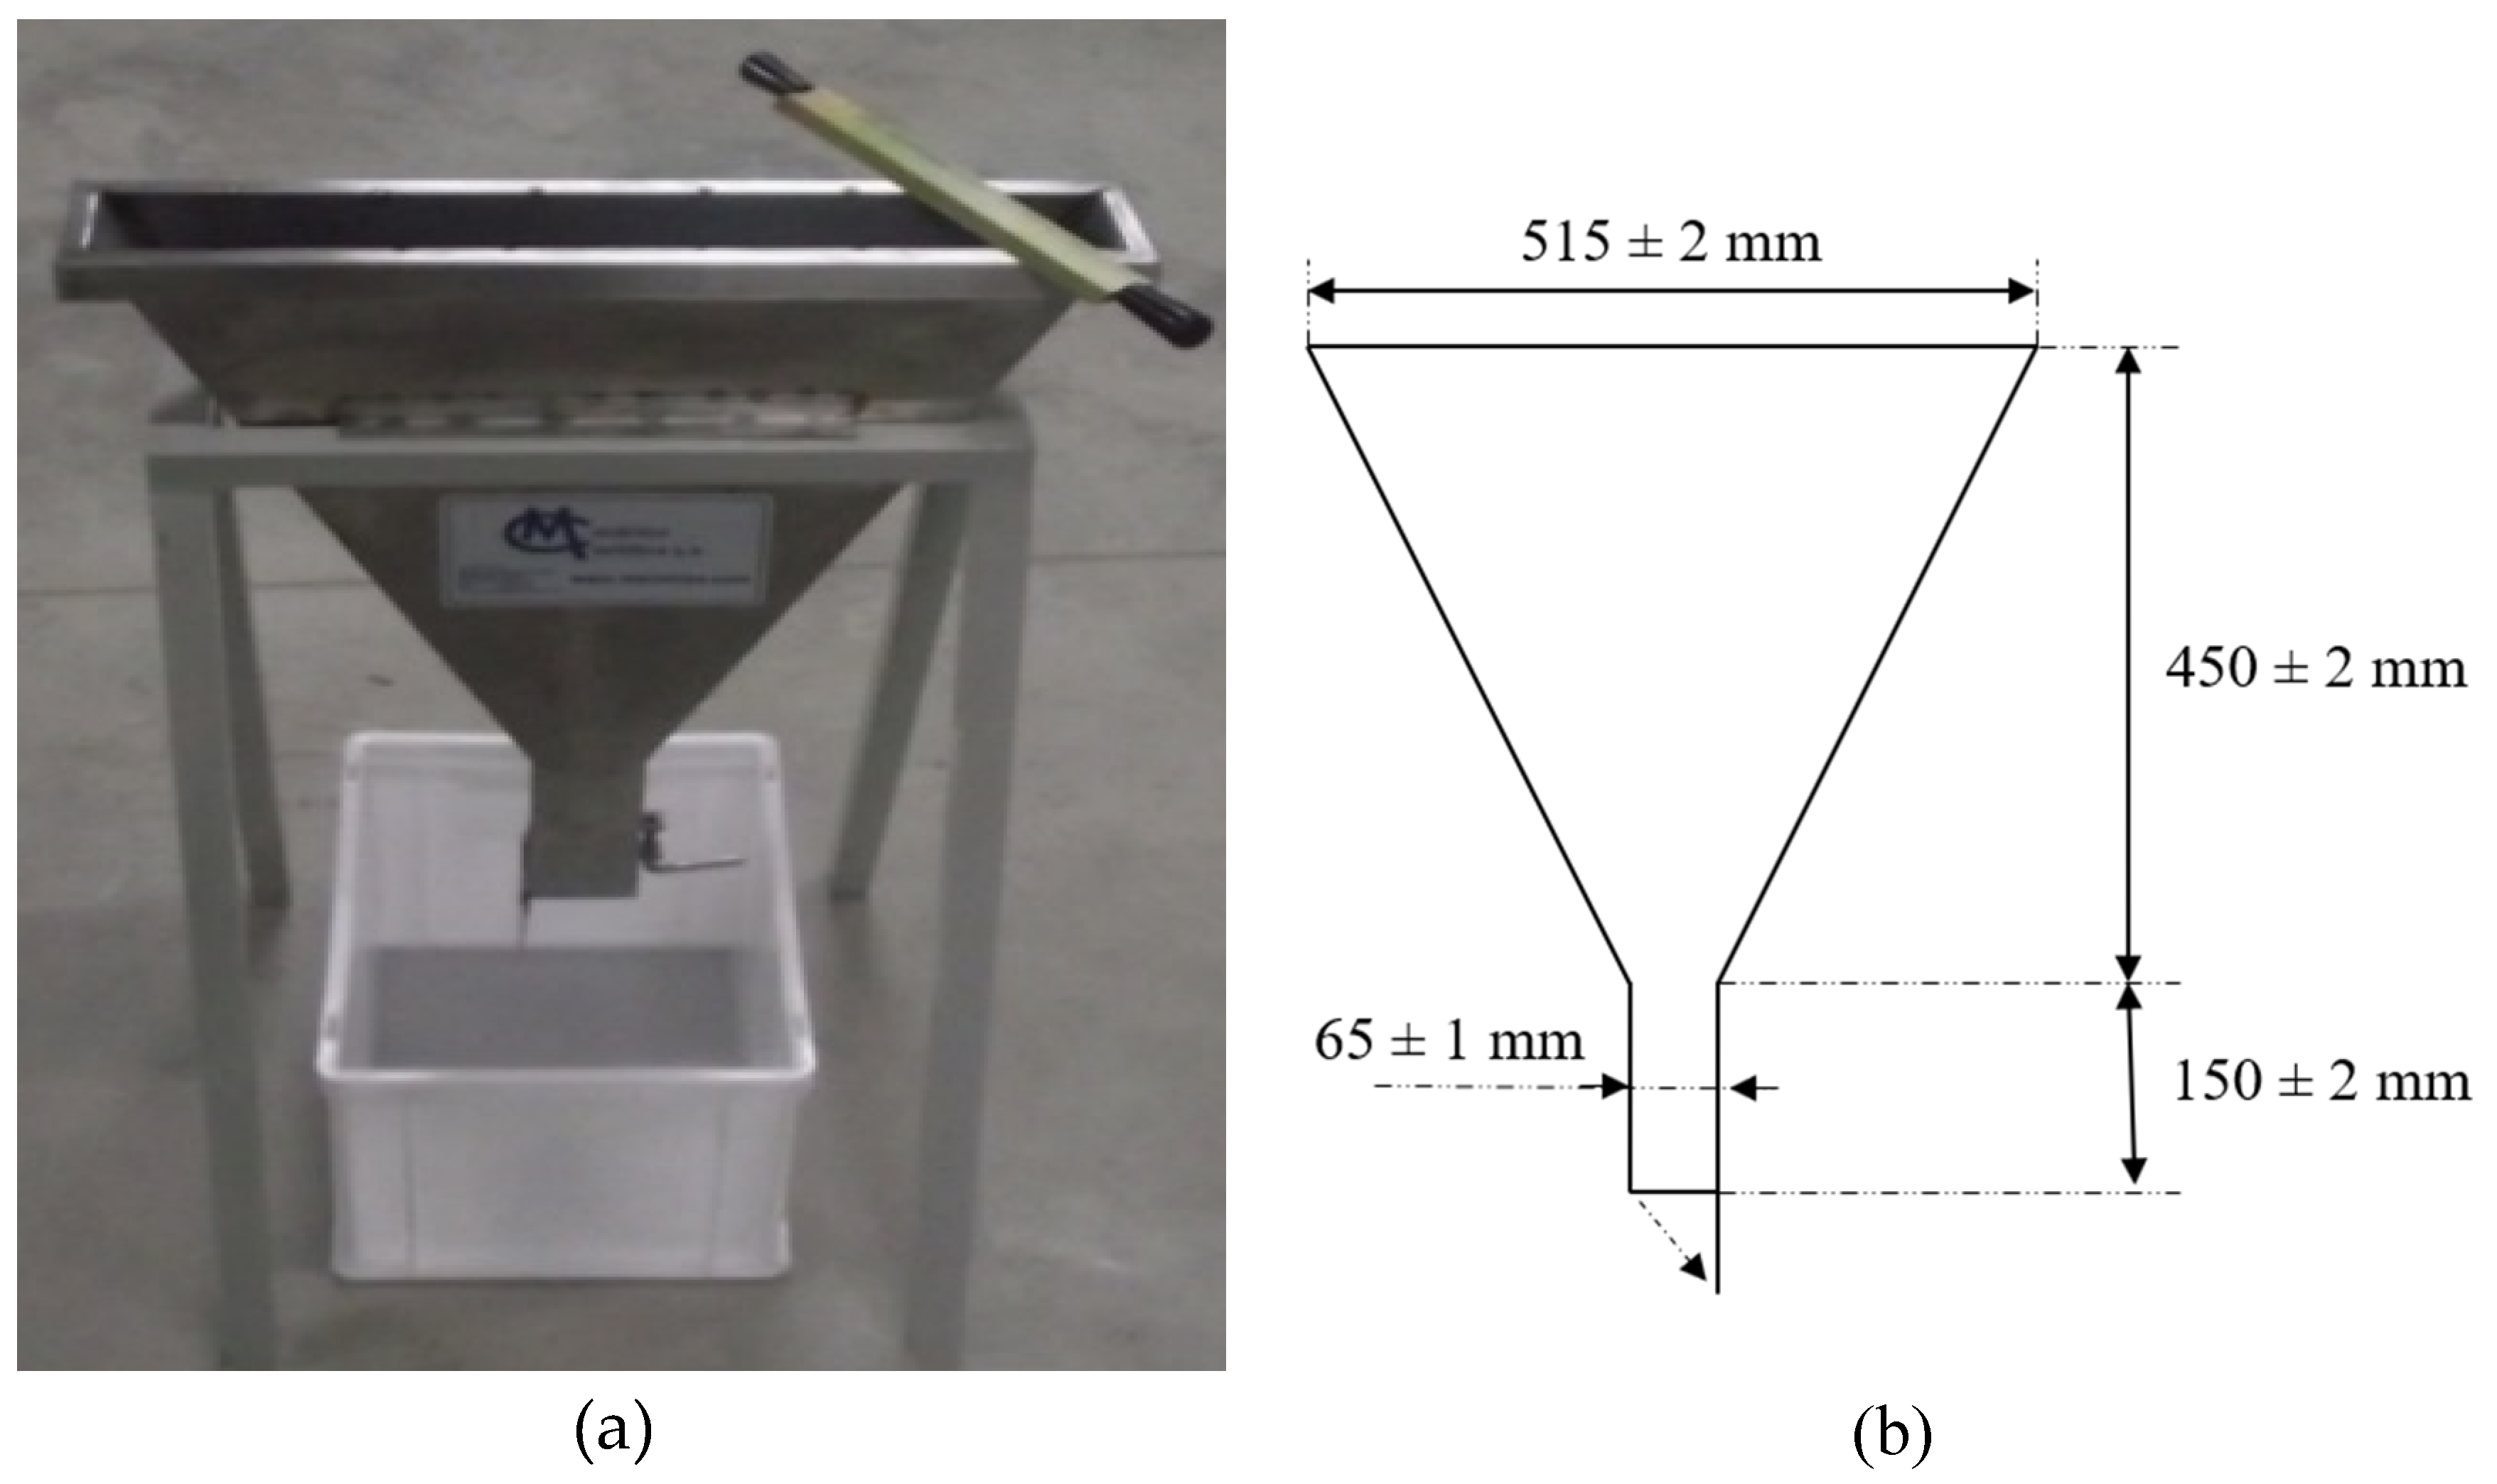
V-funnel tests were carried out in accordance with the EN 12350-9 standard [38], consisting of evaluating the ability of the concrete to flow through restricted areas in a vertical direction, evaluating the blockage and observing the variation in flow speed. The V-funnel is shown Figure 5a,b. The test consists of filling the funnel continuously and without any compaction; after a waiting time of 10 s, the gate is opened, and at that moment, the time it takes for the total volume of concrete to flow through the opening is measured.

2.5. Concrete Mixer Method

Based on the rheometer concept, there is a correlation between the concrete’s flowability and the electrical power that the mixer consumes to make its blades rotate. Since SPAs modify the fluidity of the concrete, it is suggested that the electrical power consumed by the concrete mixer will also be modified. During the test, the concrete mixer’s engine works with lower power consumption than its capacity. In this situation, the mixer’s blades rotate at the same velocity.
To validate the hypothesis that there is a correlation between the power consumption and the workability, during the mixing process, controlled amounts of SPA are added at programmed times, modifying the flowability of fresh concrete. The method proposes the use of a conventional vertical axis concrete mixer, as shown in Figure 6. The method requires the measurement of the flowability in an indirect way through the power consumption of the electrical engine, coming from a three-phase electrical source. To do this, the voltage and current of each of the phases were measured, in order to monitor the power consumed by the mixer during the mixing process, using a DIEM DZ100VS. The mixer has a vertical axle with an orbital mixing mechanism, a capacity of 100 l and a 700 mm diameter. The concrete mixer was fitted with a Gossen Metrawatt MAVOWATT 40 three-phase power analyzer. During the entire mixing process, the voltage and intensity in each of the three electrical phases were recorded at a frequency of one item per second.
Firstly, the aggregates were introduced into the concrete mixer, from the largest to the smallest. Then, the cement and the adjusted amount of water were added; at this point, the concrete mixer was started. The mixer was run for 3 min without adding any SPA to allow the components to be mixed properly. After this time, the SPA was added every 3 min. In the first phase, until 1% of SPA/C was reached, 0.2% of SPA/C was added in each step. In the second phase, until 3.4% of SPA/C was reached, 0.4% of SPA/C was added in each step. This increase in the quantity of SPA/C per step was because the effect of SPA is greater for a small SPA/C. Table 4 shows the entire process of mixing concrete with the SPA. Where t0 is the initial time for each step, t is the duration of each mixing step and SPA a is the accumulated quantity of SPA in each of the steps.

3. Results and Discussion

3.1. Cement Paste Flowability

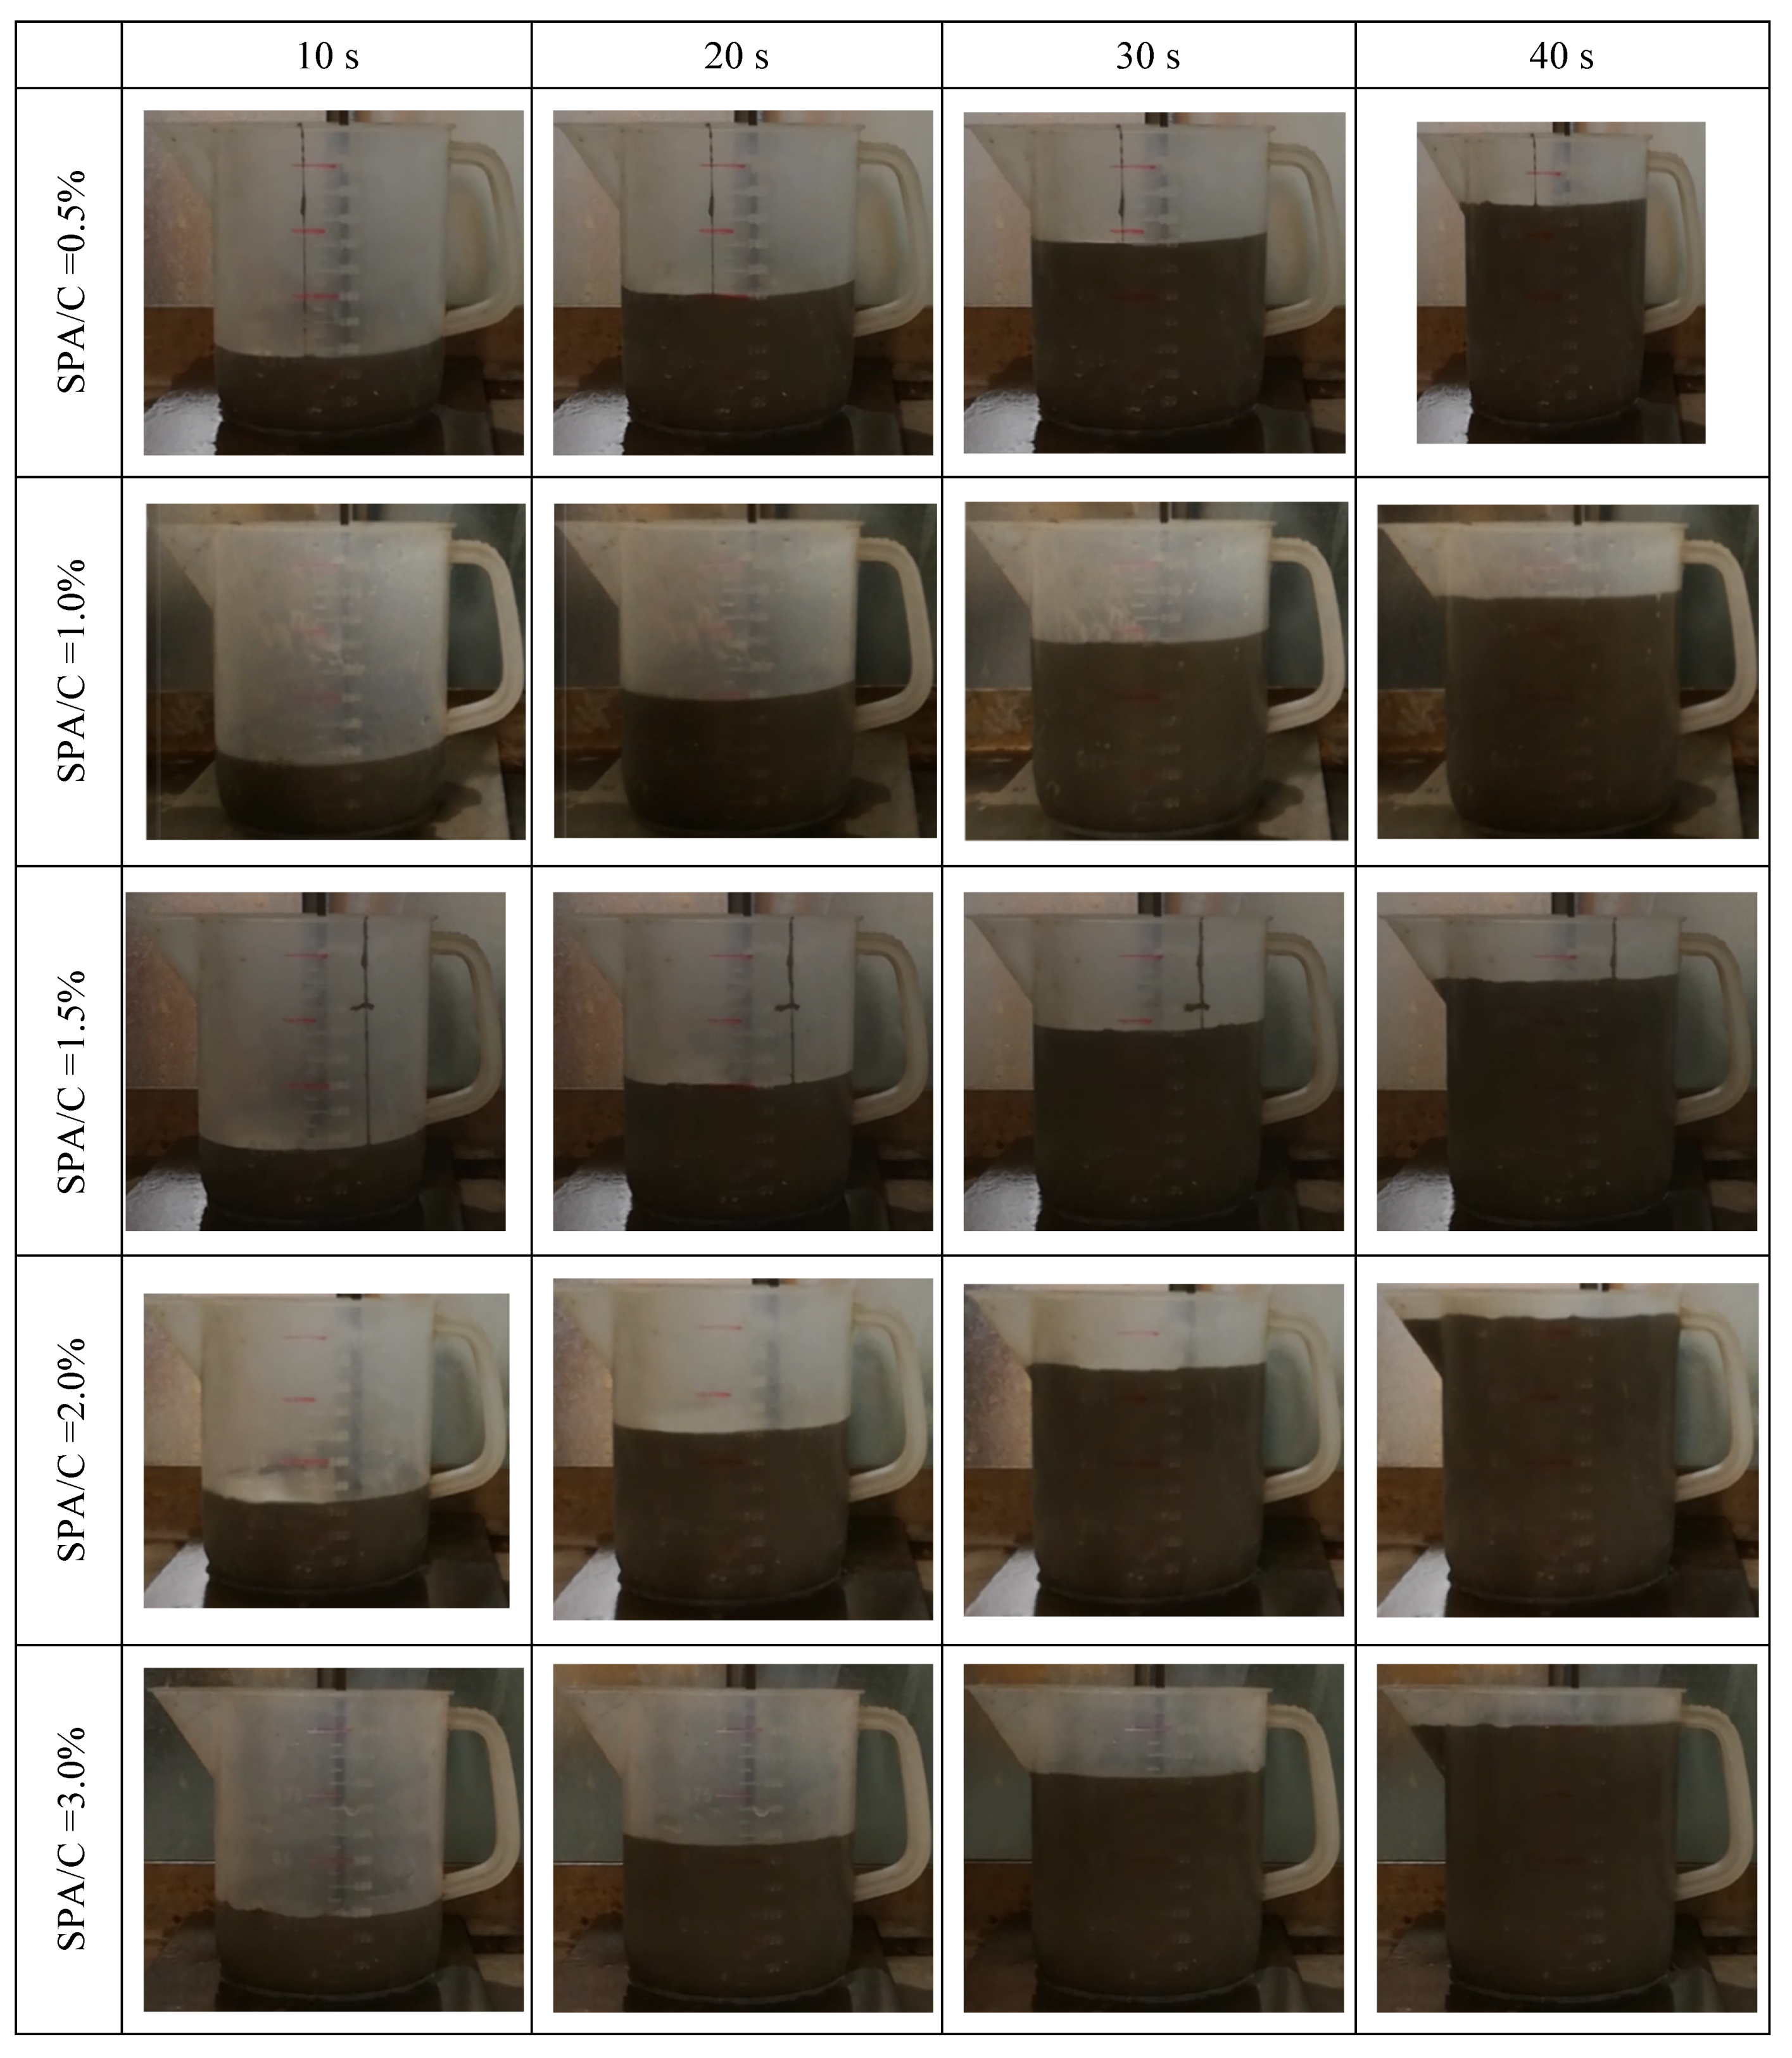
Once the times for each SPA/C and for the two w/c ratios were obtained, the isochoric curves were generated and are shown in Figure 7a,b for the 0.4 and 0.38 w/c ratios, respectively. Figure 8 shows the quantity of cement paste with a 0.4 w/c ratio that flowed during 10, 20, 30 and 40 s, respectively, for the different SPA/C ratios (0.5%, 1%, 1.5%, 2% and 3%).
As can be seen in the graphs, the saturation point is easier to determine as the volume of paste analyzed increases. On the other hand, there is hardly any difference between the two w/c ratios. For w/c = 0.4, the saturation point is clearly defined for 2% SPA. However, for w/c = 0.38, although the definition is not so clear, it is verified that above 2%, the fluidity does not improve, so this value is also considered as the saturation point in the Marsh cone test, as increasing the SPA implies a cost increase. If more tests were done, the measurements results would be influenced by the time of SP addition.

3.2. Concrete Flowability

Once the saturation point in the Marsh cone test had been defined at 2%, different mixes were made with the previously indicated mix proportions, modifying the amount of the superplasticizer SPA used: 1%, 1.5%, 2% and 3%. Workability tests were carried out on these mixes to verify whether the saturation point in the Marsh cone test corresponded to the optimum amount of SPA in the concrete.
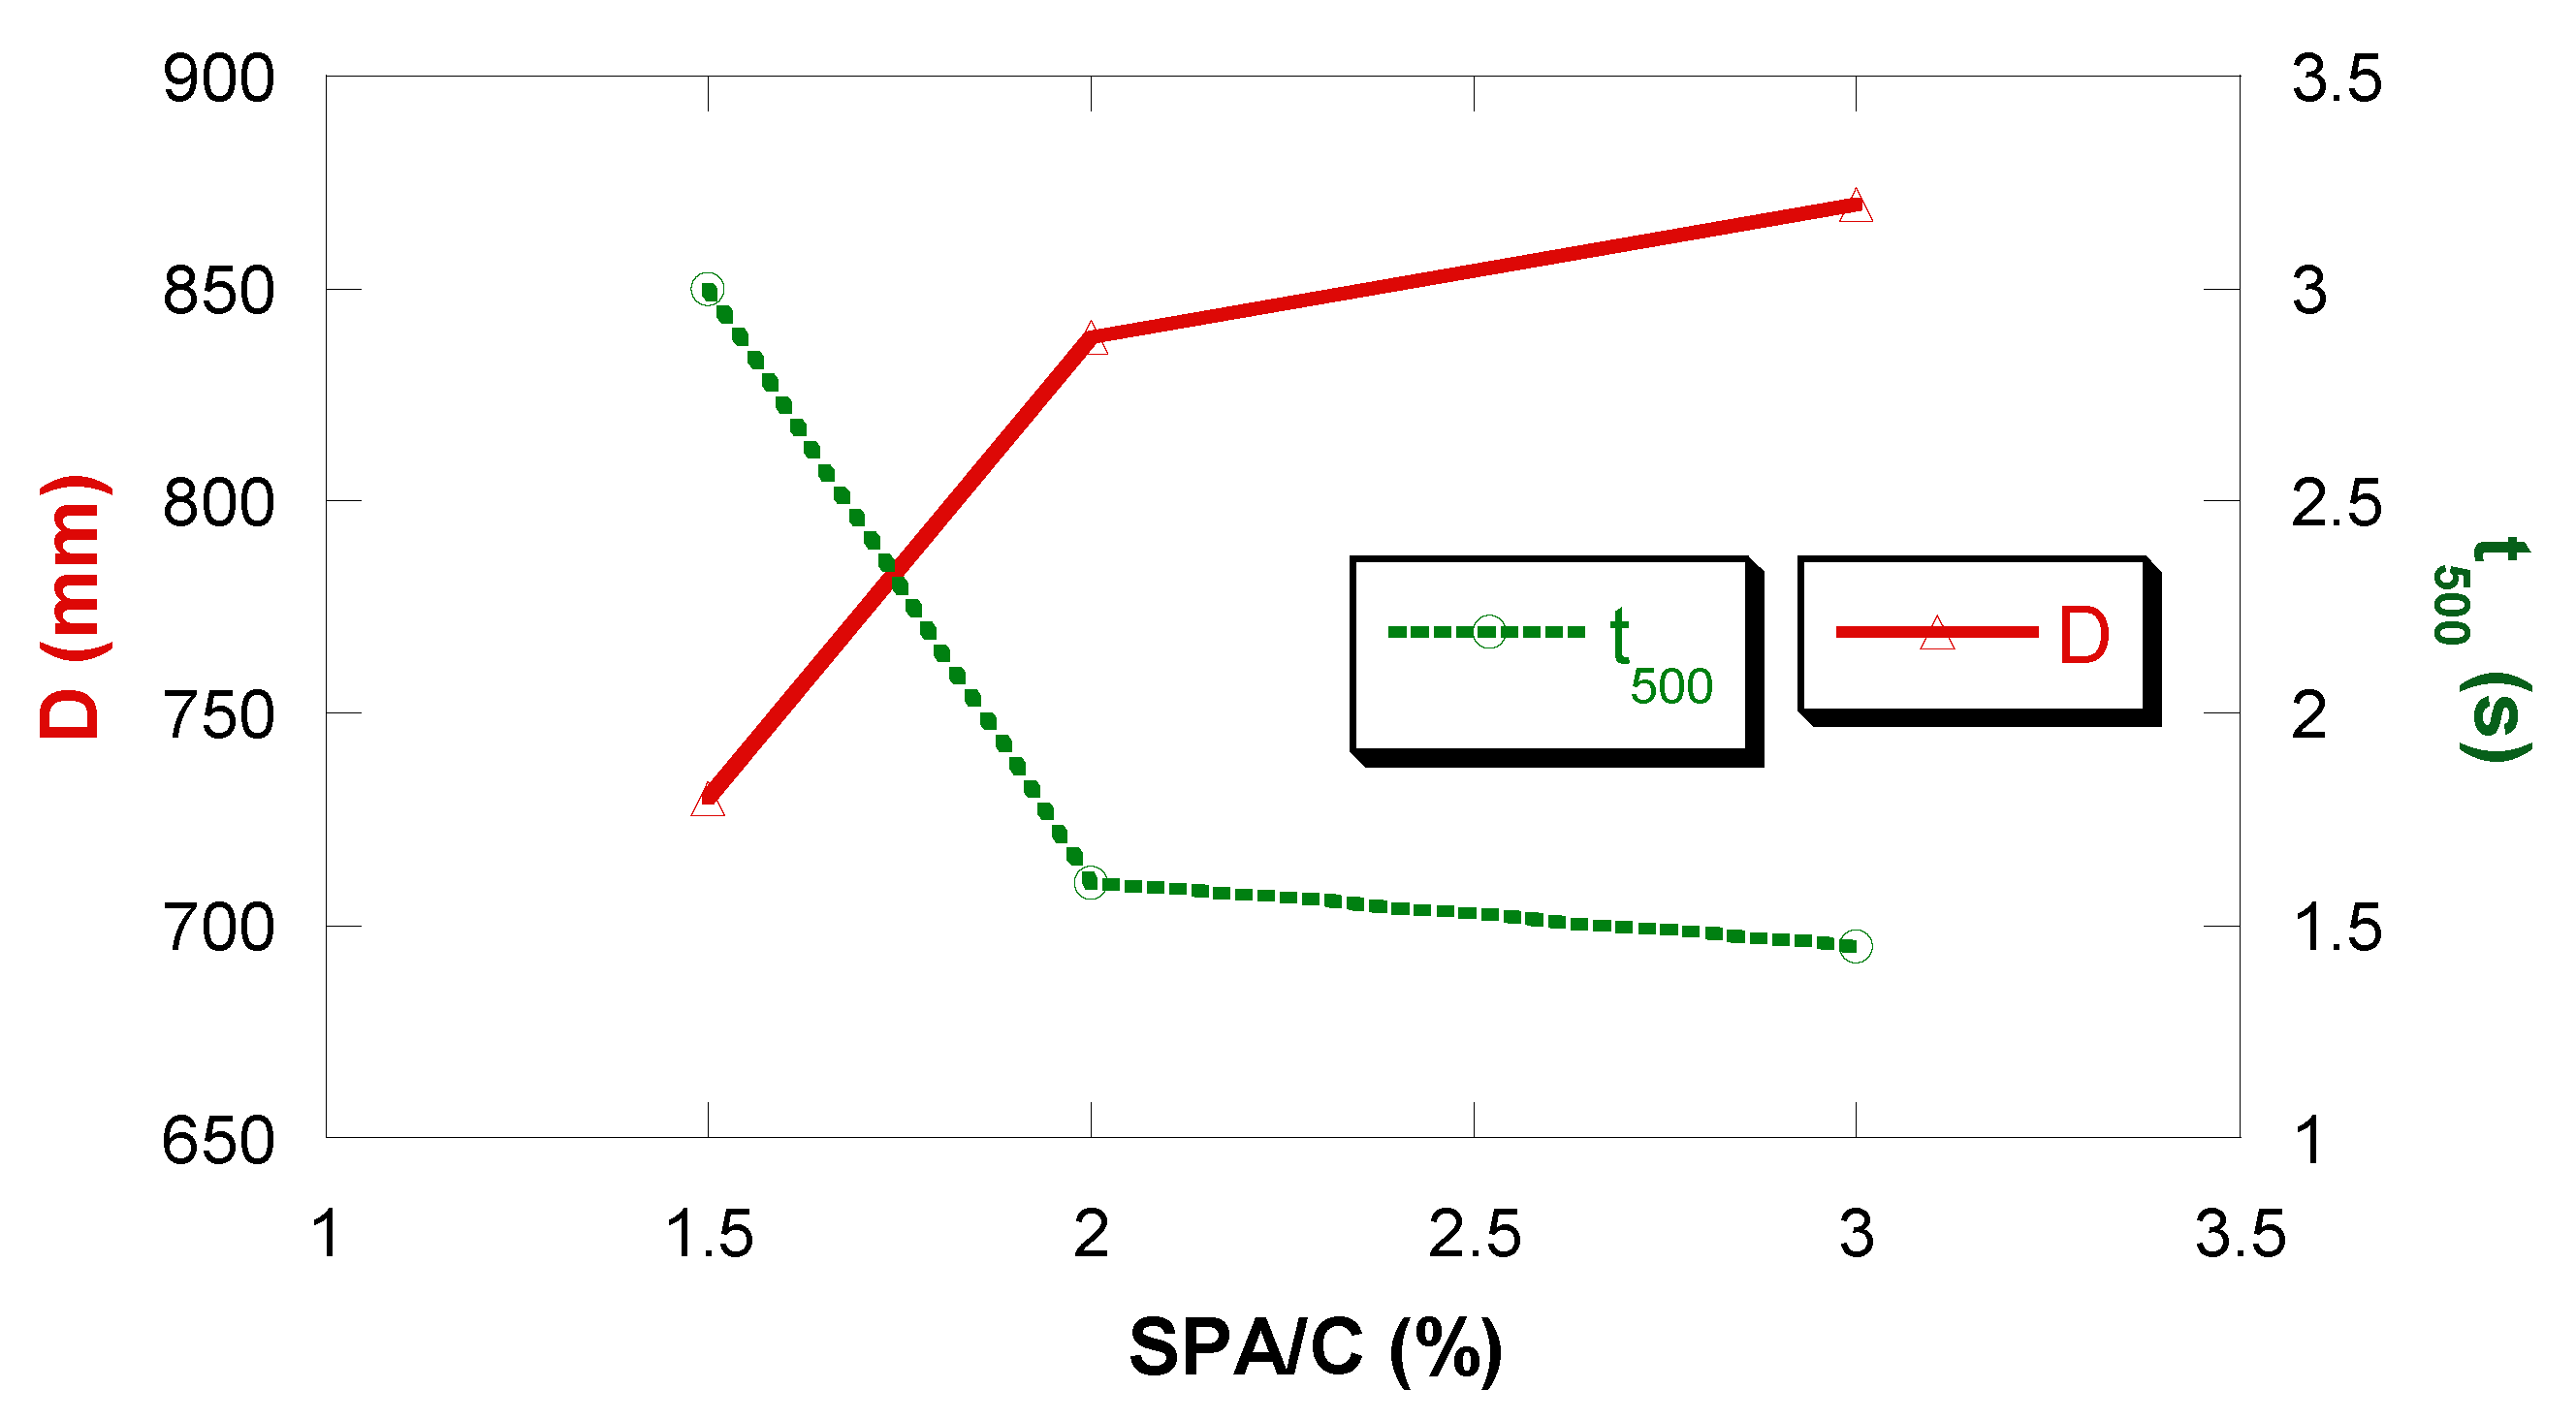
The diameter of the slump flow is useful to evaluate the deformation capacity of SCC, while the t500 is used to characterize its viscosity and cohesion.
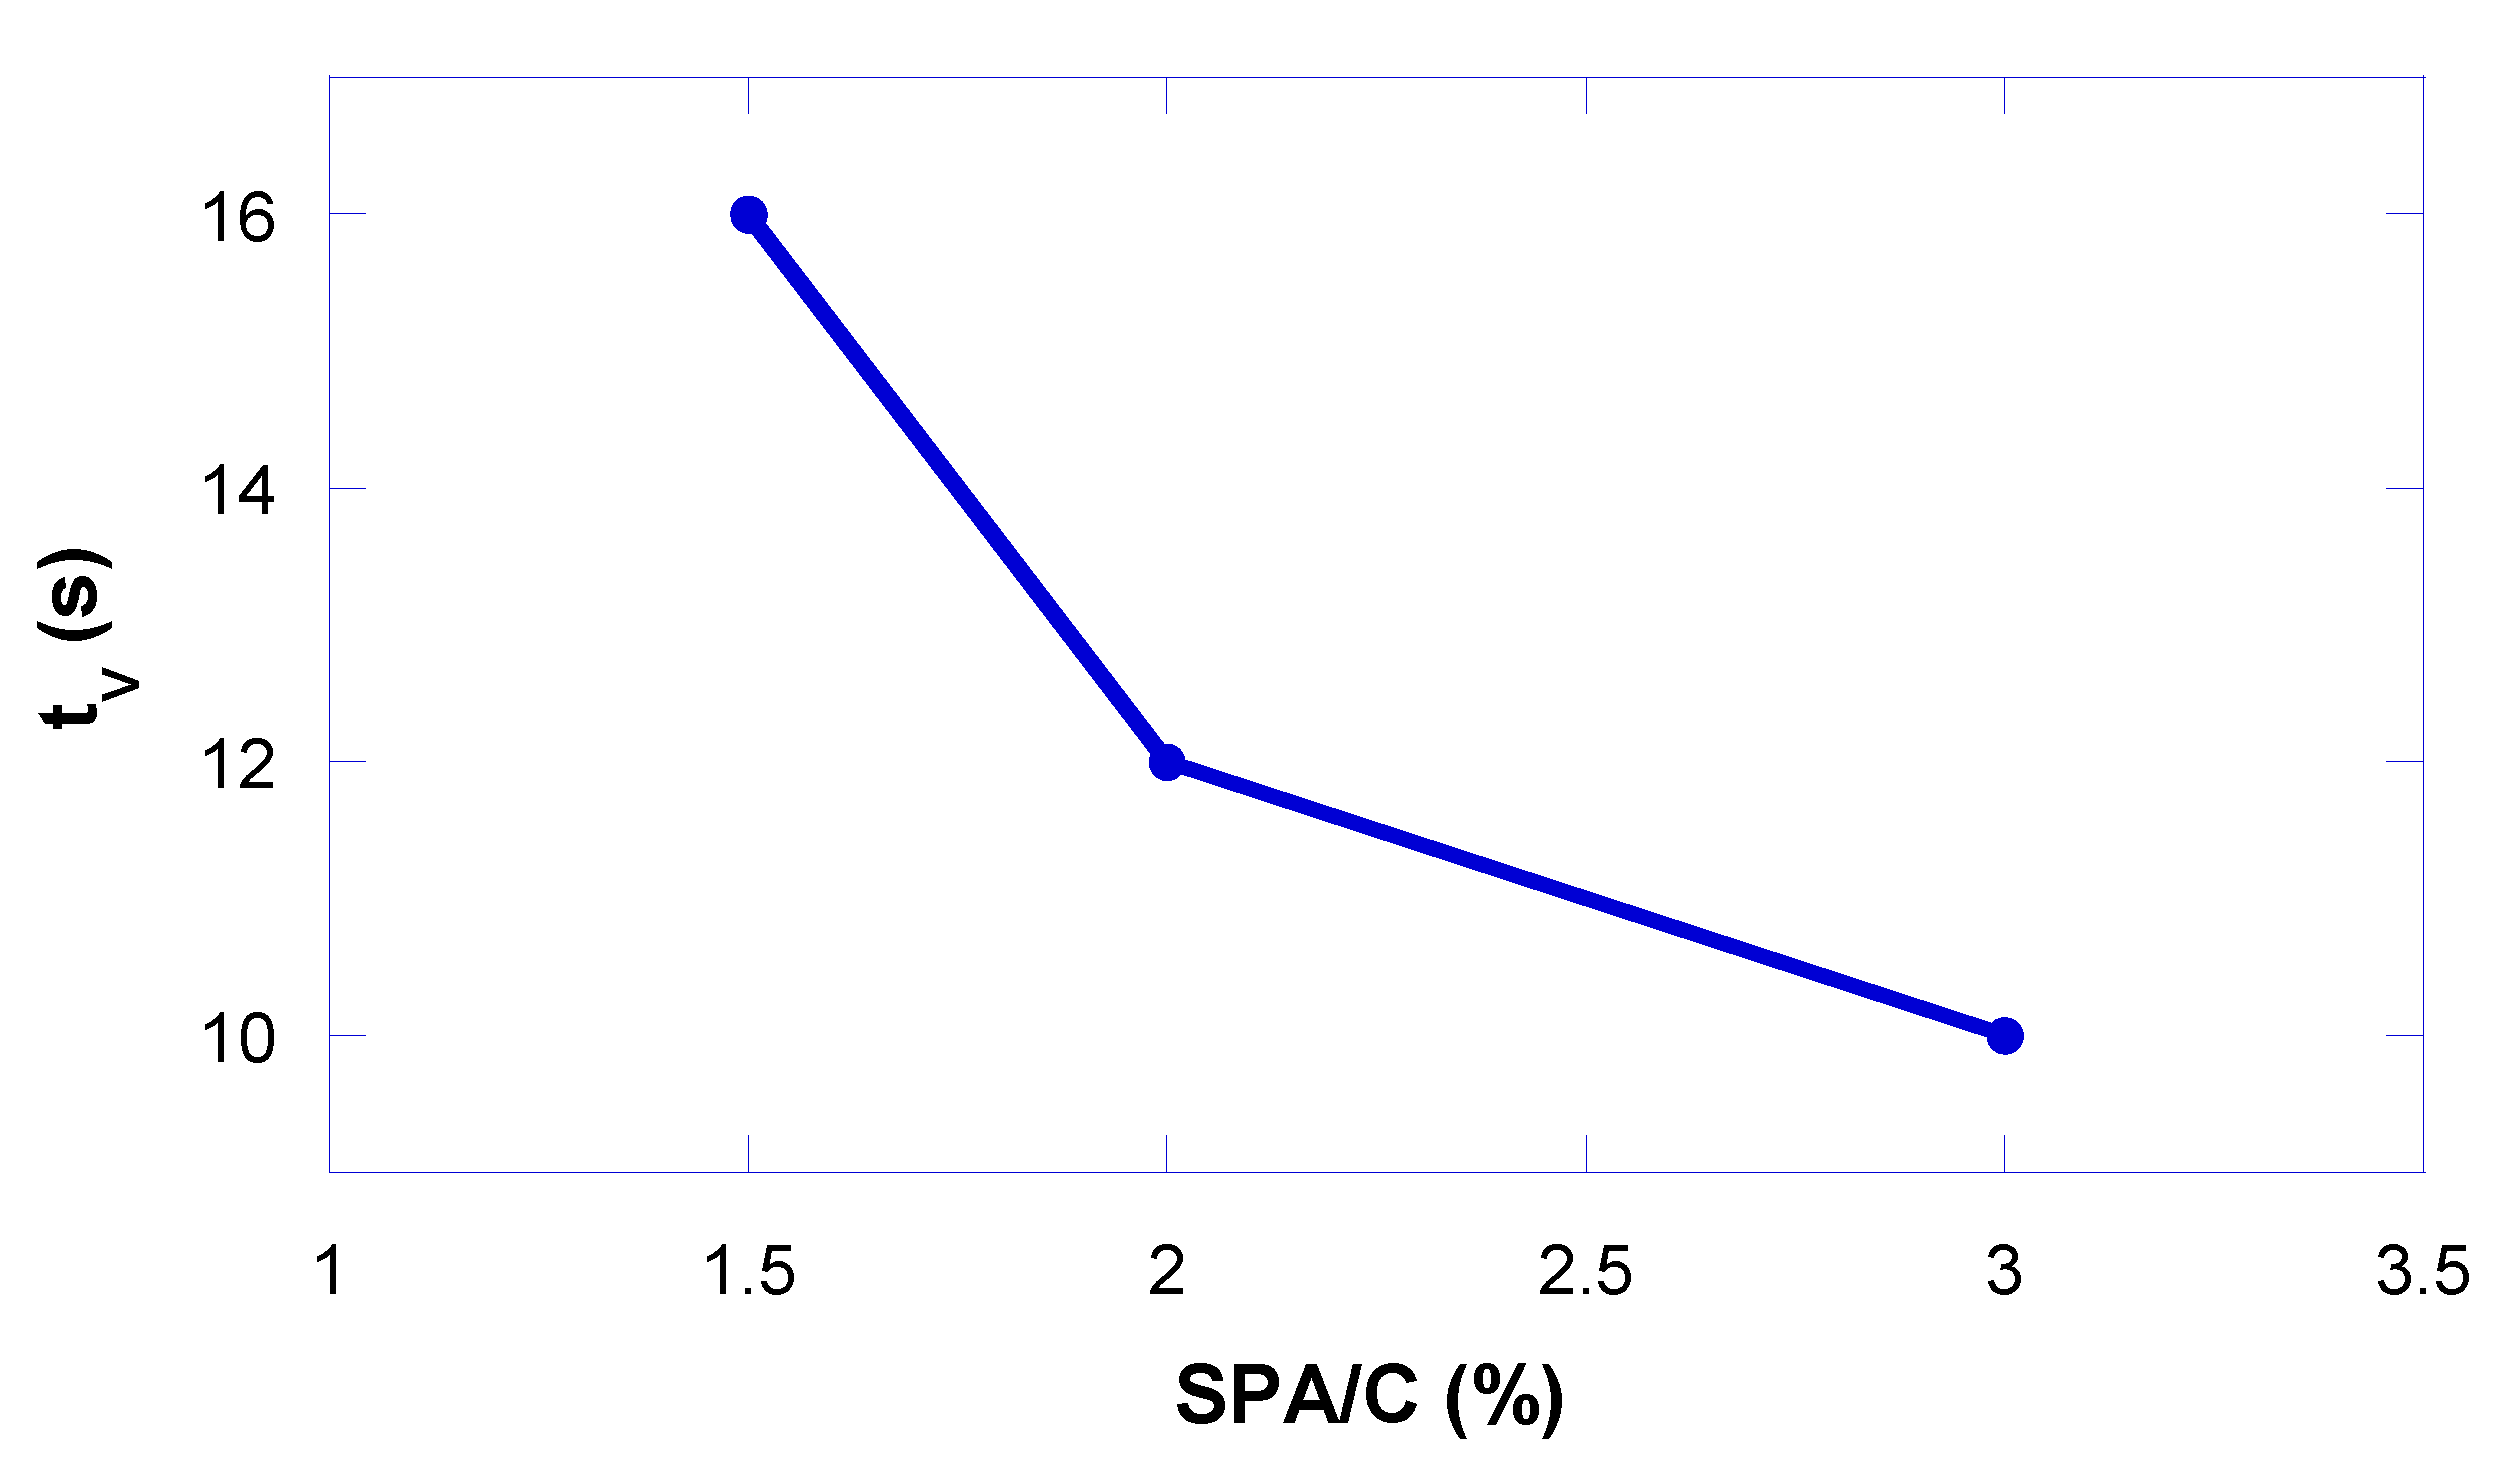
Figure 9 shows the values of the slump flow diameter and the t500. It can be seen how both the diameter and the t500 show an important variation when passing from SPA/C = 1.5% to 2%, agreeing with the saturation point obtained with the Marsh cone test. However, between 2% and 3%, there is no variation.
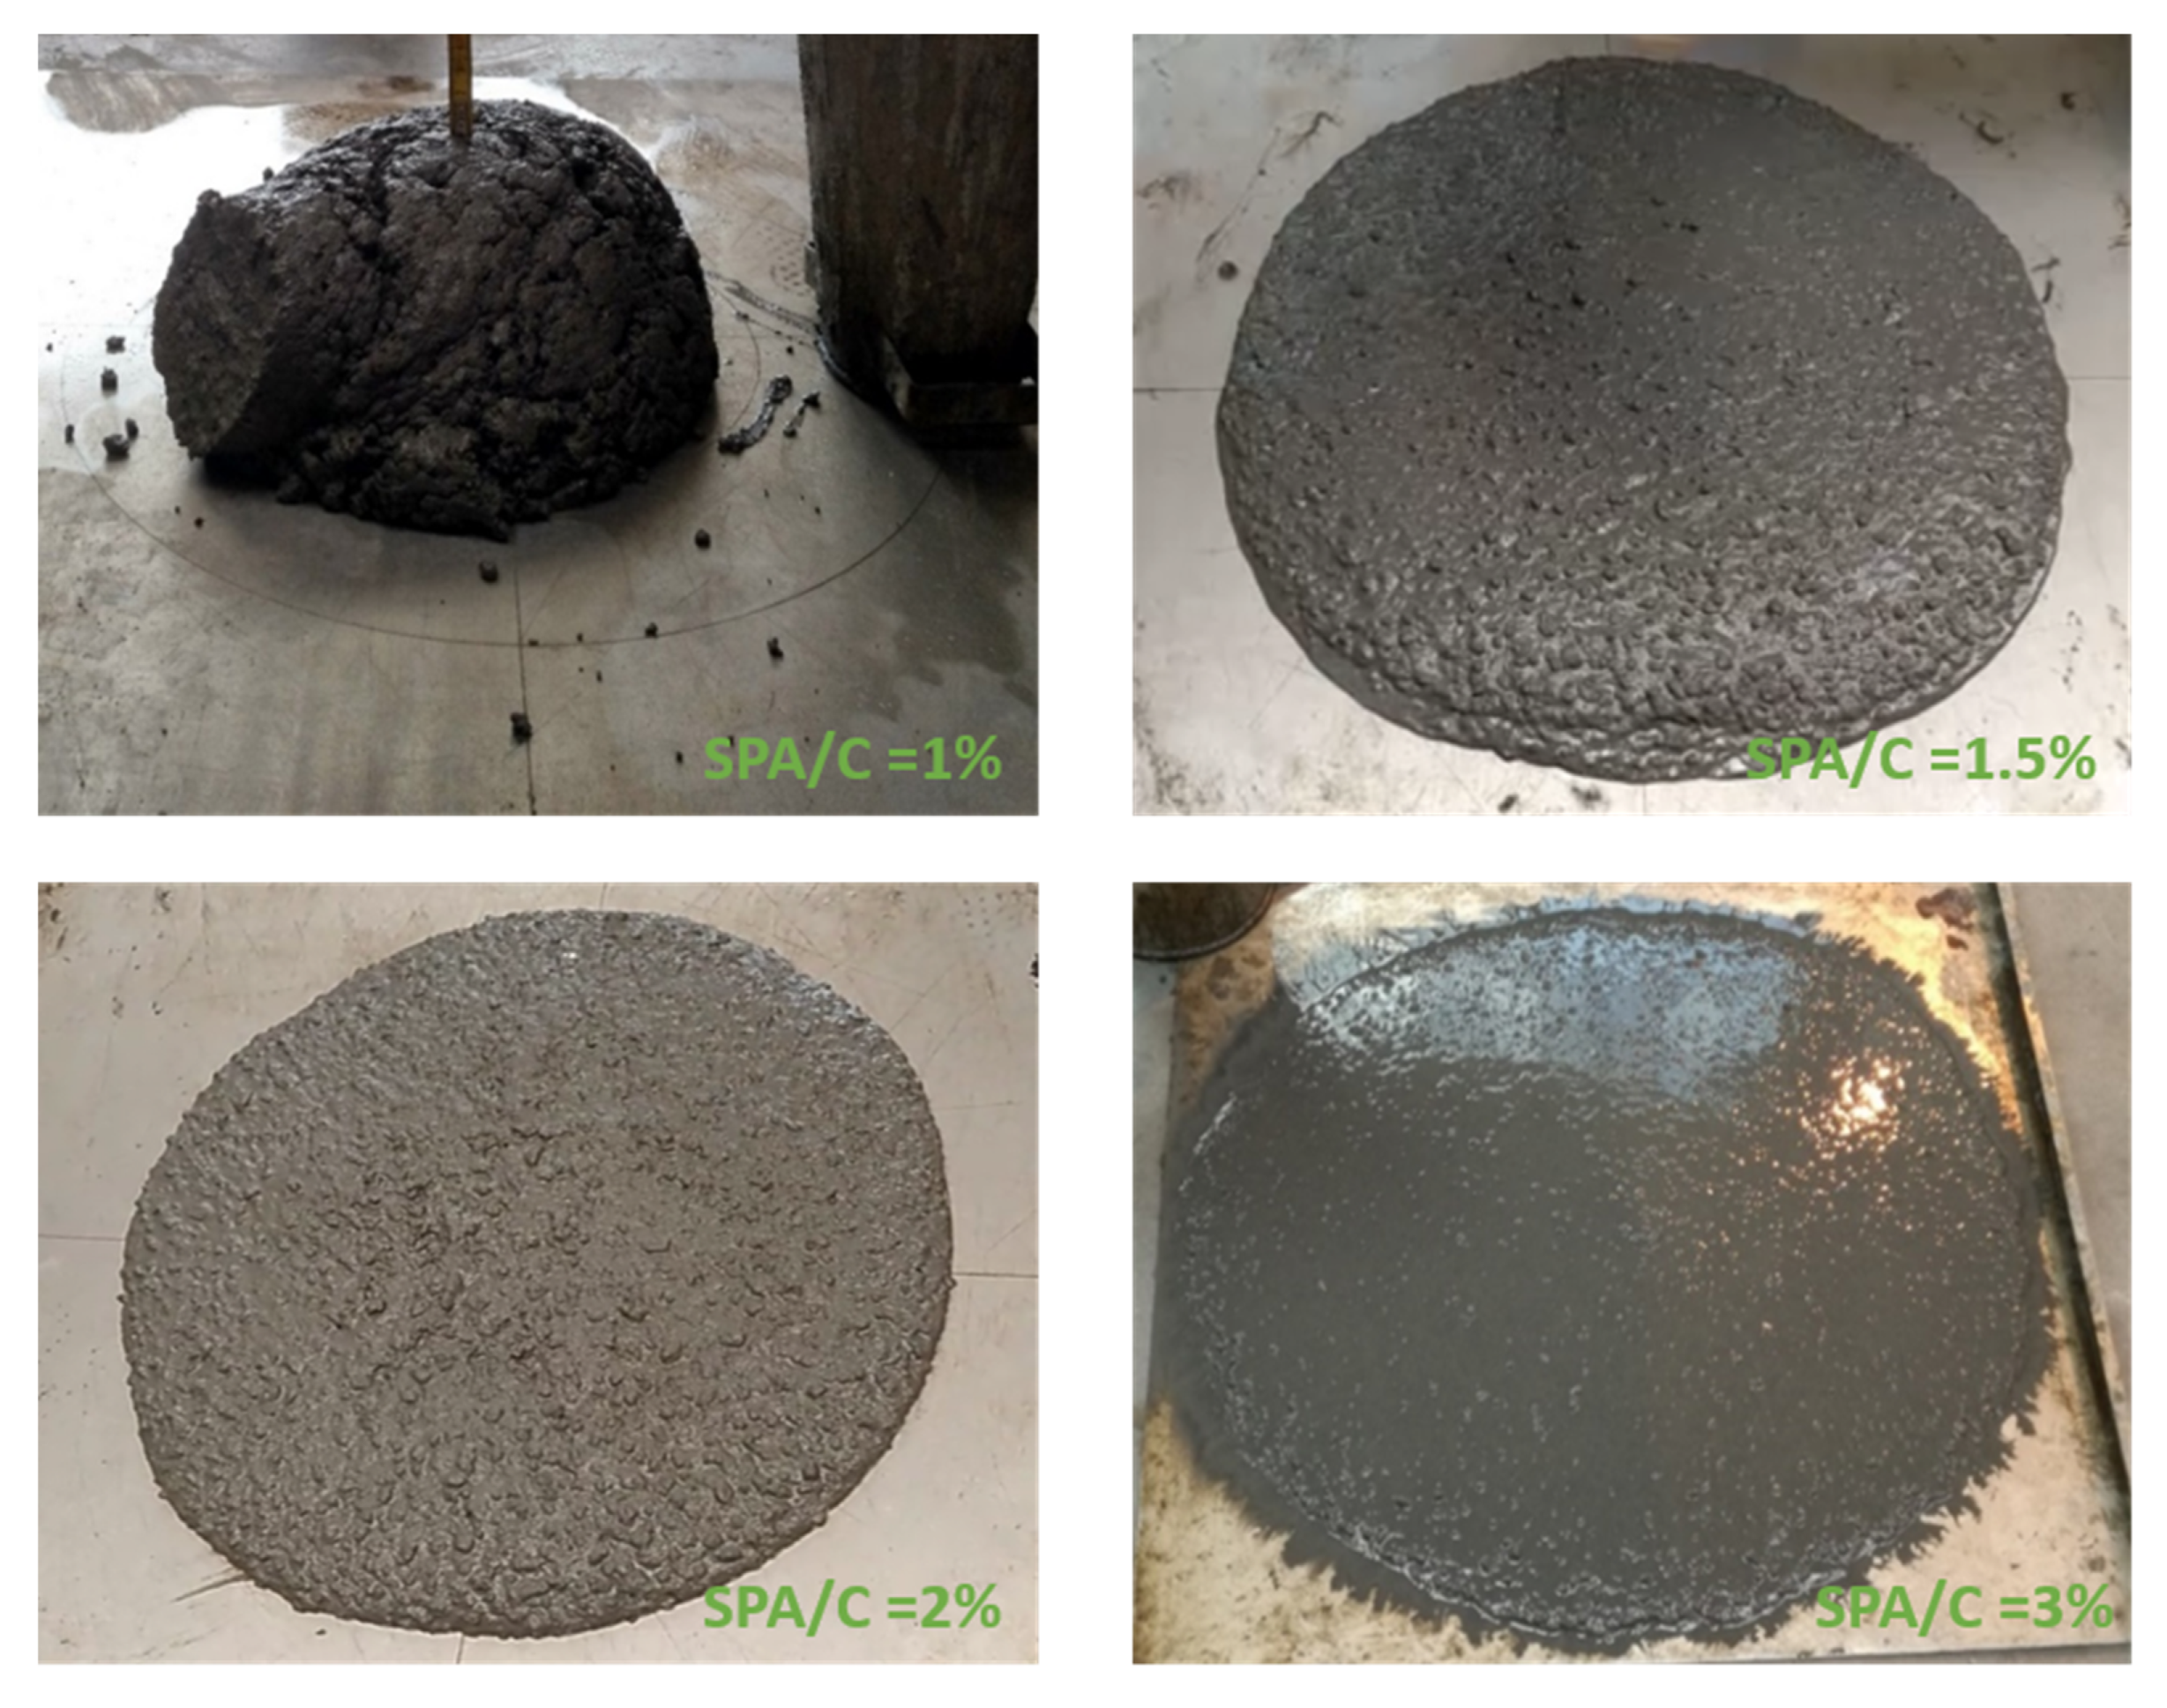
Figure 9 does not show data for the mix with 1% SPA/C as no conclusive data are available, since it is a concrete with plastic consistency, as shown in Figure 10, where it can be seen that its fluidity is almost zero.
Figure 10 shows the appearance of the different mixes after the slump flow test. Based on this result of the mixing with SPA/C = 1% in the slump flow test, the L-box and V-funnel tests will not be carried out for this mix, given that it does not make sense as it is not a SCC. In the case of 1.5%, it can be seen that it is a concrete with good workability that does not present a water/paste/mortar ring beyond the coarse aggregate; nevertheless, it can also be seen that the thickness of the flow spread is excessive, so it can be expected that when increasing the quantity of SPA, it will continue to maintain its cohesion without presenting segregation. In the case of 2%, it can be seen how the concrete has spread uniformly without presenting a water/paste/mortar ring beyond the coarse aggregate, reaching a higher diameter value. Finally, it can be seen that for the 3% admixture mix, there is a clear water/paste ring beyond the coarse aggregate that penalizes SPA contents higher than 2%.
Figure 11 shows the results obtained with the L-box. When this saturation point value is exceeded, it can be seen that, although the value of H2 remains approximately constant, the value of H1 increases. This is because this amount of SPA causes the thixotropy of the mixture to become inappropriate, producing a degree of segregation of the coarse aggregate, which stops moving together with the mortar and accumulates in the initial part of the L-shaped box.
On the other hand, the blocking coefficient (CB = H2/H1), a good indicator of the ability to pass through narrow openings, which includes the capacity for deformation and resistance to blocking, presents a maximum also coinciding with the saturation point.
The results obtained in the V-funnel test are shown in Figure 12. For this test, the results obtained decreased to 3%, with no minimum at the saturation point. Greater fluidity can be seen in this figure when the SPA/C ratio is increased, but it has been proven in the previous test that SPA/C contents above 2% cause segregation, so the paste and the aggregate do not flow together.
The method proves to be efficient for evaluating the ability of concrete to flow in restricted areas in the vertical direction; however, the test does not allow a good qualification of the tendency towards segregation and blockage between the reinforcements. Moreover, the result does not reflect the ability to flow in the horizontal or anti-gravity direction. Therefore, the flow time obtained in this test is not enough to quantify the properties necessary to guarantee the performance of the concrete as an SCC and must be complemented by other tests.

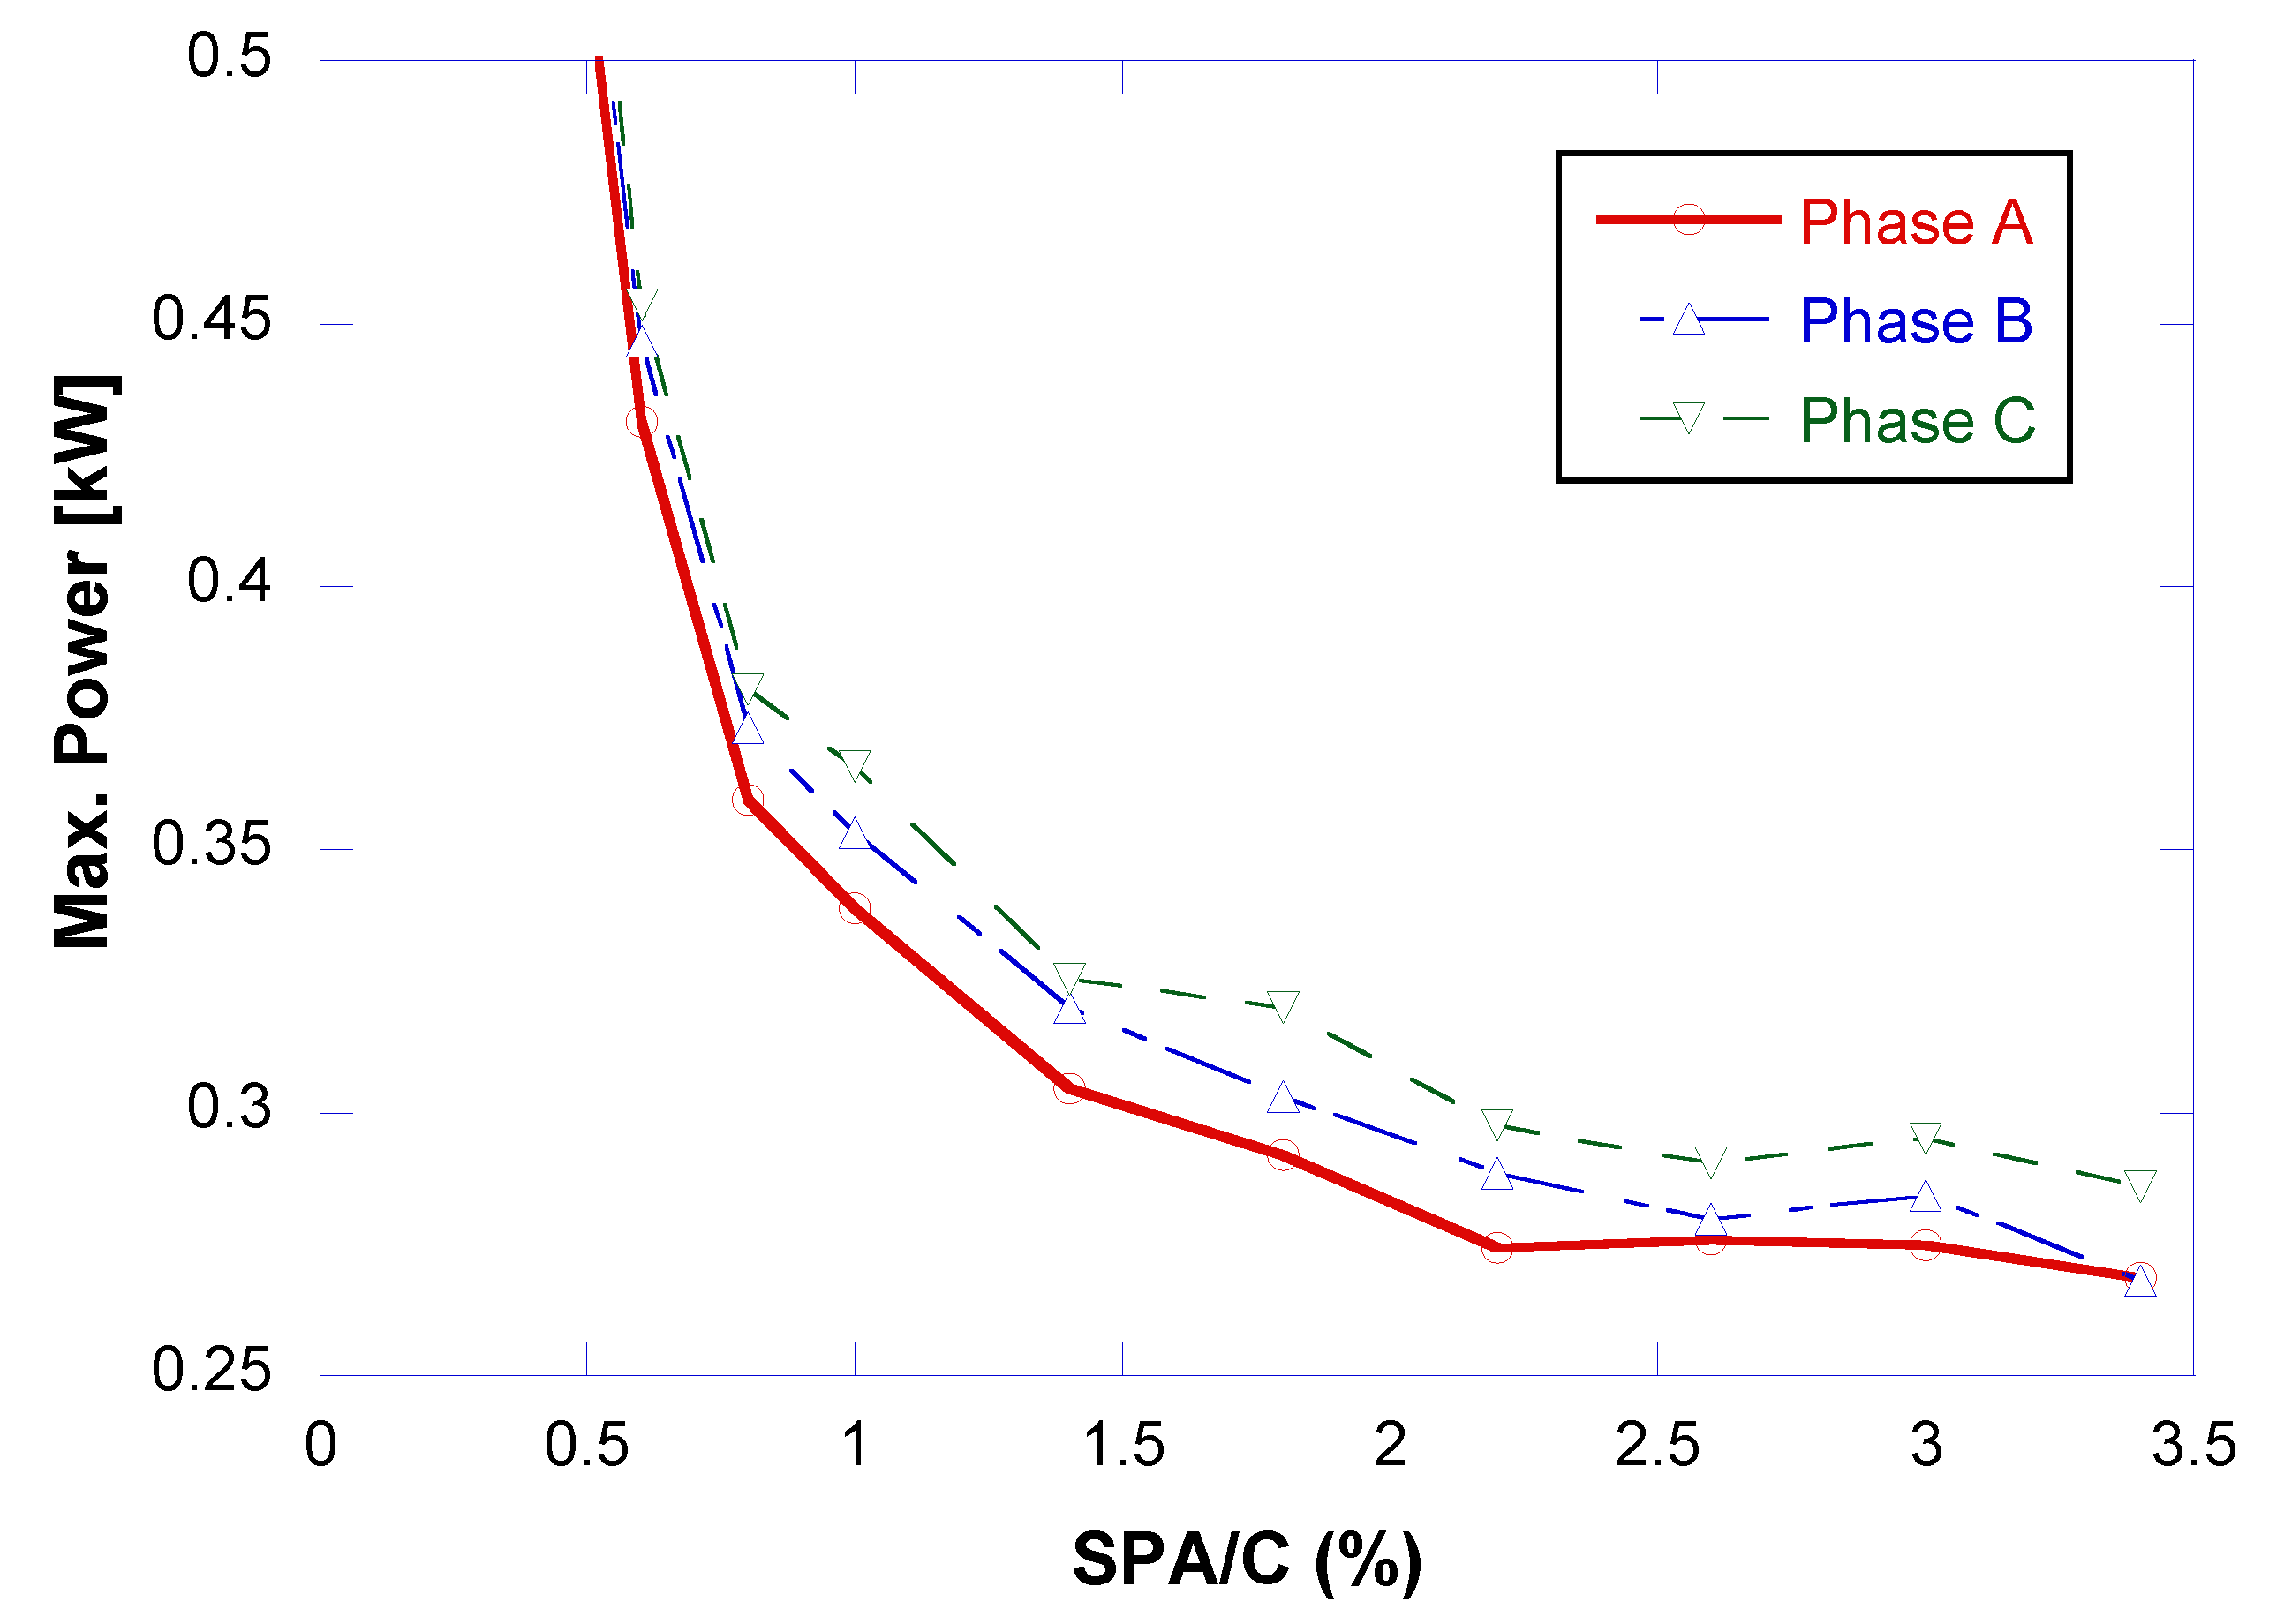
3.3. Concrete Mixer Method

From each step, the last 50 s were selected (each step has a duration of 180 s), when the step is already considered to be stabilized. In this section, the maximum recorded power value is selected. The decision was made to record the maximum value because this value reflects the moment when the concrete exerts the greatest resistance to the rotation of the blades, i.e., the moment when the concrete is least fluid and therefore the most unfavourable situation for each step (once it has stabilised). Figure 13 shows the evolution of the power consumed by each of the phases during the mixing process for the different partial quantities of the SPA/C. In this graph, each time the SPA/C is increased, there is a corresponding decrease in power or what would be equivalent, a corresponding decrease in viscosity, or increase in fluidity of the mixture. It can be seen that when exceeding 1% of SPA/C, the power tends to stabilize, but it is from 2% onwards that the power becomes constant, which is why 2% of the SPA is defined as the optimum percentage of SPA, also coinciding with the saturation point measured through the Marsh cone test and the rest of the tests on the fresh concrete.

3.4. Correlation between the Results from the Marsh Cone, Concrete Workability and Concrete Mixer Methods

A correlation was found between the results obtained using the Marsh cone test and the concrete mixer method. Through both methods, it is possible to determine the same saturation point in terms of the SPA/C value, from either the time, in the case of the Marsh cone test, or the minimum value of the mixer power consumption, in the case of the concrete mixer method. In addition, through both methods, a significantly greater effect can be seen when the SPA/C is less than 1%, from which point the effect decreases until approximately 2%, where the effect is almost zero.
If concrete mixer method results are correlated with the slump flow test results, it can be seen that results proportional to those of t500 and inversely proportional to D were obtained. In this test, it is also possible to detect that the effect of the SPA/C is greater up to the value of 2%, a value defined as the saturation point both by the Marsh cone method and by the concrete mixer method.
If the concrete mixer method results are correlated with the L-box test results, it is not possible to determine a proper correlation. This is because the L-box test evaluates the passing capacity of concrete while the concrete mixer method evaluates the flowability of concrete. For this reason, the concrete mixer method is not a direct alternative for the L-box test, since the concrete mixer method does not enable the evaluation of whether there is segregation. Since segregation implies that either there is an excess amount of water or that the SPA no longer interacts with the concrete but remains on its surface, it is understood that segregation is only possible in the section where the maximum power consumption value is already stabilized. Therefore, if progressively greater quantities of SPA are added, the onset of segregation could be predicted.
If the concrete mixer method results are correlated with the V-funnel tests results, as both methods evaluate the flowability of concrete, it can be appreciated that there is a direct relationship between the two methods.

4. Conclusions

The optimum quantity of SPA is very important when designing an SCC since it is the key factor in its workability. In this context, having a tool able to indirectly determine, in real time, this optimum quantity of SPA will reduce the time, materials and money dedicated to the proper definition of the mix proportions of an SCC. In this work, in has been proven that there is a measurable relationship between the concrete mixer power computation and the concrete flowability, so it is possible with just one test to define the optimum quantity of SPA required.
  • After analyzing the results, it can be seen that the optimum quantity of SPA/C for the study case is 2%.
  • Cement pastes and concretes with an SPA/C of 3% can show, in some cases, greater fluidity than for 2%, but the segregation of their elements is notable, and this is a situation to be avoided.
  • Regarding the proposed concrete mixer test method, it has been revealed as a valid methodology to obtain the optimum amount of additive.
  • This method is quicker than the current technique, since it allows results to be obtained from a single mix and also eliminates variables in the study when working on the real components of the concrete.
  • On the other hand, it has been proven that obtaining the saturation point of the Marsh cone test is more precise when using a higher volume than that recommended by current standards.
  • The measurement of the power of the three electrical phases has proved to be similar, so the methodology could be simplified by using only one of the phases of the concrete mixer.
This study opens the door to the design of an external element that can be implemented in a concrete mixer in order not only to evaluate the flowability of all of the SCC mixes that are made, but also to indicate whether that mix has an adequate flowability or if, to the contrary, a certain amount of SPA needs to be added to correct its flowability.

Author Contributions

Conceptualization, C.T.; J.A.S.-A., I.A.C. Data curation, S.D.; Formal analysis, J.A.S.-A., I.A.C. and J.A.P.; Investigation, J.A.S.-A., I.A.C., J.A.P., I.S. and J.C.; Methodology, I.A.C., J.A.P. and C.T.; Resources, S.D.; Supervision, J.C.; Writing—original draft, J.A.S.-A., Writing—review & editing, C.T. All authors have read and agreed to the published version of the manuscript.

Funding

This research was funded by Spanish Ministry of Economy and Competitiveness of Spain, grant number MAT2014-57544-R”.

Acknowledgments

The authors would like to thank: LADICIM, the Laboratory of Materials Science and Engineering of the University of Cantabria, for making the facilities used in this research available to the authors.

Conflicts of Interest

The authors declare no conflict of interest. The funders had no role in the design of the study; in the collection, analyses, or interpretation of data; in the writing of the manuscript, or in the decision to publish the results.

References

  1. Salhi, M.; Ghrici, M.; Bilir, T.; Uysal, M. Combined effect of temperature and time on the flow properties of self-compacting concrete. Constr. Build. Mater. 2020, 240, 117914. [Google Scholar] [CrossRef]
  2. Okamura, H.; Ozawa, K. Self-compacting high performance concrete. Struct. Eng. Int. J. Int. Assoc. Bridg. Struct. Eng. 1996. [Google Scholar] [CrossRef]
  3. Okamura, H.; Ouchi, M.; Ozawa, K. Self-compacting concrete. Struct. Concr. 2000. [Google Scholar] [CrossRef] [Green Version]
  4. Heirman, G.; Vandewalle, L. The influence of fillers on the properties of self-compacting concrete in fresh and hardened state. In Proceedings of the 3rd International RILEM Symposium on Self-Compacting Concrete (SCC2003), Reykjavik, Iceland, 17–20 August 2003; RILEM Publications SARL: Paris, France, 2003; pp. 606–618. [Google Scholar]
  5. Kanellopoulos, A.; Savva, P.; Petrou, M.F.; Ioannou, I.; Pantazopoulou, S. Assessing the quality of concrete—Reinforcement interface in Self Compacting Concrete. Constr. Build. Mater. 2020, 240, 117933. [Google Scholar] [CrossRef]
  6. Diego Carro-López, B.G.-F. Dosificación, propiedades en estado fresco y reología de hormigón autocompactante con áridos reciclados finos. Hormigón Y Acero 2018, 69, 286. [Google Scholar]
  7. Long, G.; Gao, Y.; Xie, Y. Designing more sustainable and greener self-compacting concrete. Constr. Build. Mater. 2015, 84, 301–306. [Google Scholar] [CrossRef]
  8. Alyamac, K.E.; Ghafari, E.; Ince, R. Development of eco-efficient self-compacting concrete with waste marble powder using the response surface method. J. Clean. Prod. 2017, 144, 192–202. [Google Scholar] [CrossRef]
  9. Yepes, V.; Martí, J.V.; García-Segura, T. Cost and CO2 emission optimization of precast-prestressed concrete U-beam road bridges by a hybrid glowworm swarm algorithm. Autom. Constr. 2015, 49, 123–134. [Google Scholar] [CrossRef]
  10. Sonebi, M.; Rooney, M.; Bartos, P.J.M. Evaluation of the segregation resistance of fresh self-compacting concrete using different test methods. In Proceedings of the SCC’2005-China: 1st International Symposium on Design, Performance and Use of Self-Consolidating Concrete, Changsha, China, 26–28 May 2005; RILEM Publications SARL: Paris, France, 2005; pp. 301–308. [Google Scholar]
  11. Sonebi, M.; Grünewald, S.; Walraven, J. Filling ability and passing ability of self-consolidating concrete. ACI Mater. J. 2007, 104, 162–170. [Google Scholar]
  12. Sainz-Aja, J.A. Slab Track Manufacture Using Out of Service Railways Wastes. Ph.D. Thesis, University of Cantabria, Santander, Spain, 2019. [Google Scholar]
  13. ACHE—Asociación Científico Técnica del Hormigón Estructural. M-16: Manual de Tecnología de Aditivos para Hormigón; ACHE: Madrid, Spain, 2010. [Google Scholar]
  14. Kou, S.C.C.; Poon, C.S.S. Properties of self-compacting concrete prepared with coarse and fine recycled concrete aggregates. Cem. Concr. Compos. 2009, 31, 622–627. [Google Scholar] [CrossRef]
  15. Sainz-Aja, J.; Thomas, C.; Polanco, J.A.; Carrascal, I. High-Frequency Fatigue Testing of Recycled Aggregate Concrete. Appl. Sci. 2019, 10, 10. [Google Scholar] [CrossRef] [Green Version]
  16. Pereira-De-Oliveira, L.A.; Nepomuceno, M.C.S.; Castro-Gomes, J.P.; Vila, M.F.C. Permeability properties of self-Compacting concrete with coarse recycled aggregates. Constr. Build. Mater. 2014, 51, 113–120. [Google Scholar] [CrossRef]
  17. Revilla-Cuesta, V.; Skaf, M.; Faleschini, F.; Manso, J.M.; Ortega-López, V. Self-compacting concrete manufactured with recycled concrete aggregate: An overview. J. Clean. Prod. 2020, 262, 121362. [Google Scholar] [CrossRef]
  18. Torrents, J.M.; Roncero, J.; Gettu, R. Utilization of impedance spectroscopy for studying the retarding effect of a superplasticizer on the setting of cement. Cem. Concr. Res. 1998, 28, 1325–1333. [Google Scholar] [CrossRef]
  19. Roncero, J.; Gettu, R.; Agulló, L.; Vázquez, E. Flow behaviour of superplasticised cement pastes: Influence of silica fume. Indian Concr. J. 2002, 76, 31–35. [Google Scholar]
  20. Roncero, J.; Valls, S.; Gettu, R. Study of the influence of superplasticizers on the hydration of cement paste using nuclear magnetic resonance and X-ray diffraction techniques. Cem. Concr. Res. 2002, 32, 103–108. [Google Scholar] [CrossRef]
  21. Okamura, H.; Ouchi, M. Self-Compacting Concrete. J. Adv. Concr. Technol. 2003, 1, 5–15. [Google Scholar] [CrossRef]
  22. Melo, K.A.; Repette, W.L. Optimization of Superplasticizer Content in Self-Compacting Concrete Bt—Measuring, Monitoring and Modeling Concrete Properties; Konsta-Gdoutos, M.S., Ed.; Springer: Dordrecht, The Netherlands, 2006; pp. 469–477. [Google Scholar]
  23. Kwan, A.K.H.; Ng, I.Y.T. Optimum superplasticiser dosage and aggregate proportions for SCC. Mag. Concr. Res. 2009, 61, 281–292. [Google Scholar] [CrossRef] [Green Version]
  24. Brouwers, H.J.H.; Radix, H.J. Self-Compacting Concrete: Theoretical and experimental study. Cem. Concr. Res. 2005, 35, 2116–2136. [Google Scholar] [CrossRef]
  25. Ashish, D.K.; Verma, S.K. An overview on mixture design of self-compacting concrete. Struct. Concr. 2019, 20, 371–395. [Google Scholar] [CrossRef] [Green Version]
  26. Asociación Española del Hormigón Estructural, A.C.T. M-13: Hormigón Autocompactante: Diseño Y Aplicación; ACHE: Madrid, Spain, 2008. [Google Scholar]
  27. Cement Part 1: Composition, Specifications and Conformity Criteria for Common Cements; EN 197-1; European Committee for Standardization: Brussels, Belgium, 2011.
  28. Alfa, C. CEM IV/B (V) 32,5 N. Available online: http://www.valderrivas.es/recursos/doc/Productos/Cemento/Productos/Hontoria/214926555_2112011132543.pdf. (accessed on 28 April 2020).
  29. Test Methods of Cements. Physical Analysis. Actual Density Determination; UNE 80103:2013; Asociacion Espanola de Normalizacion: Madrid, Spain, 2013.
  30. Methods of Testing Cement—Part 6: Determination of Fineness; SS-EN 196-6:2010; Swedish Institute for Standards: Stockholm, Sweden, 2010.
  31. Basf MasterGlenium® ACE 450. Available online: https://assets.master-builders-solutions.basf.com/en-tr/eng_masterglenium-ace450-tds.pdf (accessed on 5 February 2020).
  32. Tests for Geometrical Properties of Aggregates—Part 1: Determination of Particle Size Distribution—Sieving Method; BS EN 933-1:2012; European Committee for Standardization: Brussels, Belgium, 2012.
  33. ASTM International. ASTM C 939-97 Flow of Grout for Preplaced-Aggregate Concrete (Flow ConeMethod); ASTM International: West Conshohocken, PA, USA, 1997. [Google Scholar]
  34. Sainz-Aja, J.; Carrascal, I.; Polanco, J.A.; Thomas, C.; Sosa, I.; Casado, J.; Diego, S. Self-compacting recycled aggregate concrete using out-of-service railway superstructure wastes. J. Clean. Prod. 2019, 230. [Google Scholar] [CrossRef]
  35. Testing Fresh Concrete—Part 8: Self-Compacting Concrete—Slump-Flow Test; I.S. EN 12350-8:2010; National Standards Authority of Ireland: Dublin, Ireland, 2011.
  36. Testing Fresh Concrete—Part 2: Slump-Test; I.S. EN 12350-2:2009; National Standards Authority of Ireland: Dublin, Ireland, 2009.
  37. Testing Fresh Concrete—Part 10: Self-Compacting Concrete—L Box Test; I.S. EN 12350-10:2010; National Standards Authority of Ireland: Dublin, Ireland, 2015.
  38. Testing Fresh Concrete—Part 9: Self-Compacting Concrete—V-Funnel Test; I.S. EN 12350-9:2010; National Standards Authority of Ireland: Dublin, Ireland, 2011.
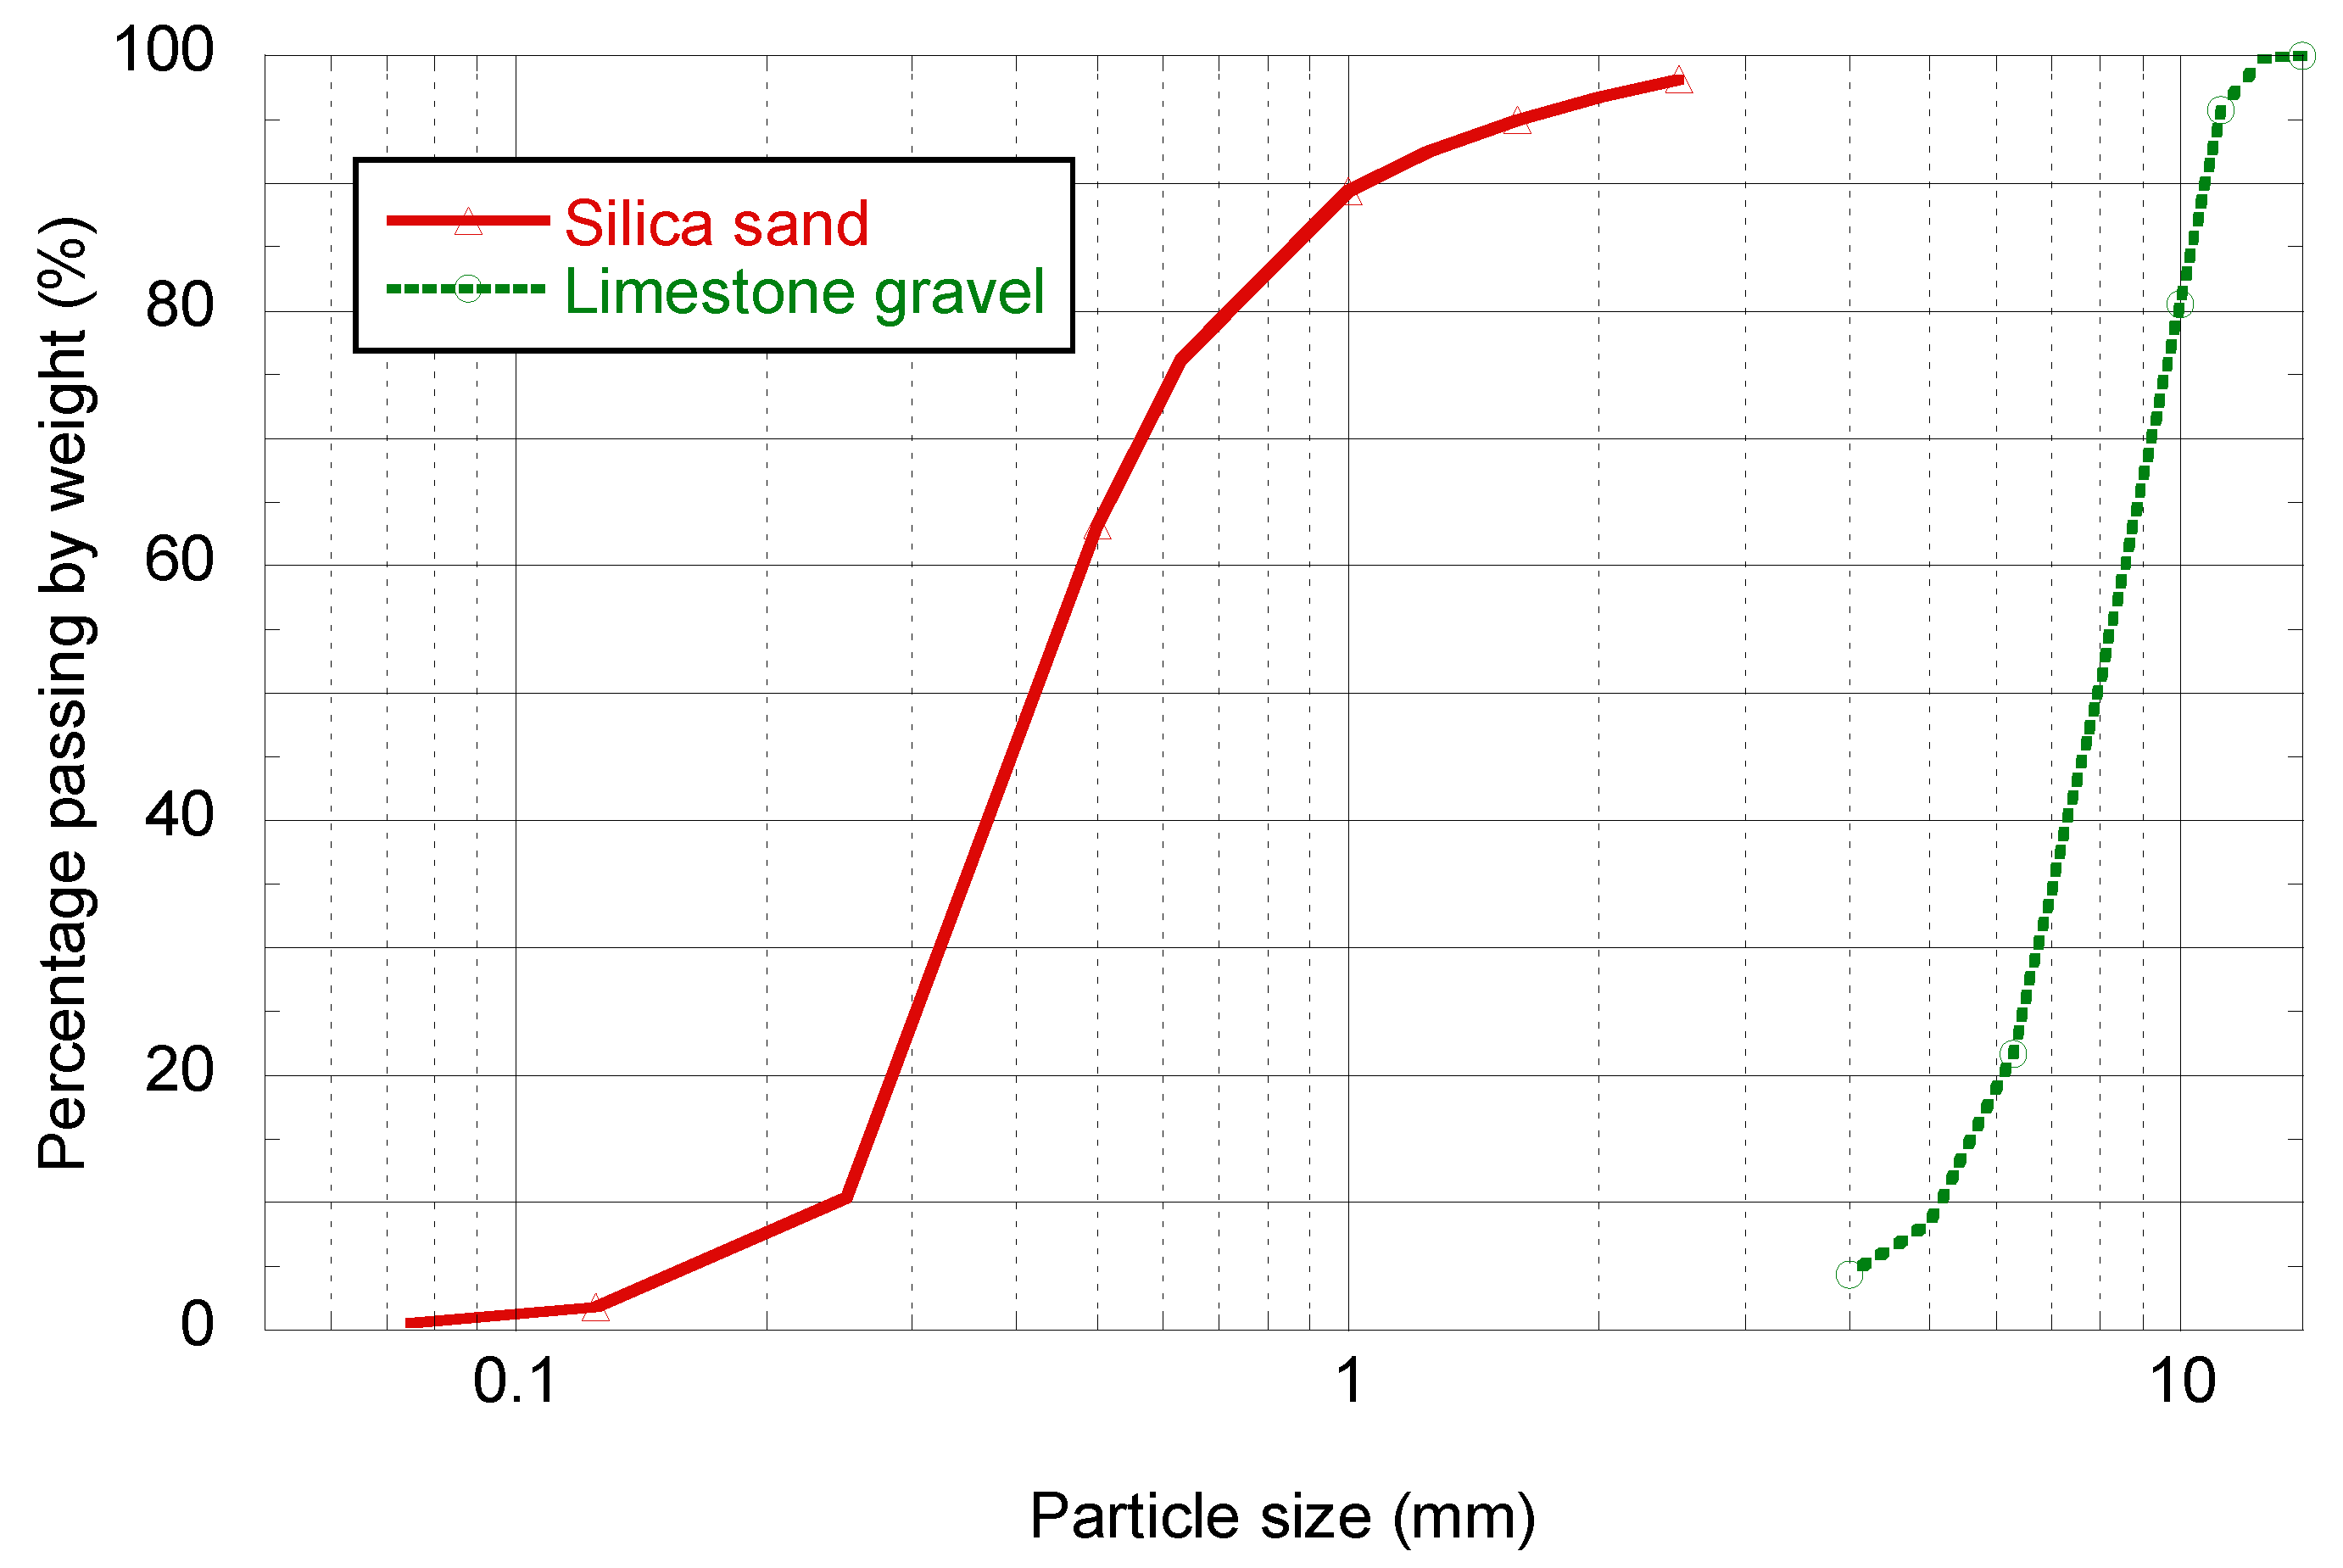
Figure 1. Aggregate grading curves.
Applsci 10 03096 g001
Figure 2. (a) Marsh cone test assembly; (b) Marsh cone test dimensions.
Applsci 10 03096 g002
Figure 3. Slump flow test diameter measurement example.
Applsci 10 03096 g003
Figure 4. Assembly for L-box test.
Applsci 10 03096 g004
Figure 5. (a) Assembly for V-funnel test; (b) V-funnel dimensions.
Applsci 10 03096 g005
Figure 6. Instrument-fitted concrete mixer.
Applsci 10 03096 g006
Figure 7. Marsh cone test for volumes of 200, 500, 750 and 1000 mL in case of w/c = 0.4 (a) and w/c = 0.38 (b).
Applsci 10 03096 g007
Figure 8. Volume of cement paste passing through the marsh cone as a function of the SPA/cement (SPA/C) ratio and the elapsed time with a w/c of 0.4.
Applsci 10 03096 g008
Figure 9. Slump flow test results.
Applsci 10 03096 g009
Figure 10. Detail of slump flow test.
Applsci 10 03096 g010
Figure 11. L-box tests results.
Applsci 10 03096 g011
Figure 12. V-funnel tests results.
Applsci 10 03096 g012
Figure 13. Evolution of the concrete mixer maximum power as a function of the SPA/C ratio.
Applsci 10 03096 g013
Table 1. Cement chemical composition (%wt.).
CaOSiO2Al2O3Fe2O3MgOK2OSO3Ignition Loss
CEMENT35.541.213.34.41.21.41.31.7
Table 2. Aggregate densities.
MaterialDensity (kg/dm3)
Silica sand2.64
Limestone gravel2.54
Table 3. Mix proportions.
MaterialMass (kg/m3)
Cement500
Water200
Silica sand (0–5)1000
Limestone gravel (5–12):650
Water/cement0.4
Table 4. Evolution of the amount of superplasticiser admixture (SPA) in the concrete.
Stept0 (min)t (min)SPA (mL)SPAa (mL)SPA/C (%)
003000
13350500.2
263501000.4
393501500.6
4123502000.8
5153502501.0
61831003501.4
72131004501.8
82431005502.2
92731006502.6
103031007503.0
113331008503.4