Abstract
An experimentally validated tribo-dynamic model has been developed to predict the gear teeth frictional losses considering the properties of the diamond-like-carbon (DLC)-coated and tungsten carbide carbon (WCC)-coated surface. The operating conditions used are snapshots of the Real Driving Emissions (RDE) driving cycle. The results demonstrate that the use of these coatings can improve the frictional losses up to 50%. The gear teeth boundary friction model is enriched by experimentally measured coefficients of the surface asperity boundary shear strength using an atomic force microscope (AFM). The computationally efficient model enables the efficiency prediction in a complete transmission. Such an approach, considering the contact mechanics of coated gear and their effect on the viscous and boundary friction, has not been hitherto reported.
1. Introduction
In order to improve the efficiency of transmission gear pairs, the use of diamond-like-carbon (DLC) coatings has been proposed in the literature. The application of DLC coatings reduces the coefficient of friction between the teeth surfaces, hence reducing frictional losses [1]. The different types of DLC coatings for automotive applications have variable effects on the generated frictional losses and wear [2].
DLC-type coatings possess advantageous properties, such as extreme hardness, high elastic modulus, excellent wear and corrosion resistance, high thermal and chemical stability, and low friction characteristics [3]. Additionally, they have the ability to perform reasonably well under dry sliding conditions. It should be noted that lubrication is essential for DLC coated components not only for better cooling and tribological performance, but also for the sensitivity that these coatings show to atmospheric conditions when lubricant is not present [3]. Additionally, it has been shown that the use of tungsten carbide carbon (WCC) coatings of gears with the use of the proper ester lubricant can increase the load carrying capacity up to 40% [1].
On the other hand, the use of coatings can also lead to adverse behaviour. Due to their extreme hardness, the local contact pressure could increase significantly considering more concentrated contact. Thus, the coating material could be transferred between the two contacting surfaces [2]. This not only minimises the effect of the coating on friction but also increases wear and, consequently, introduces further adverse effects on friction reduction. As a result, the hardness is one of the most important features when a coating is selected for an application [3]. Another factor affecting the coating performance for gear applications is the complex gear geometry, which may limit the performance of the coating since it is not easy to manufacture a perfectly coated gear [4].
Research on the effect of coatings on friction has shown that they can reduce it up to 50% [5]. The type of lubricant used in combination with the coating, especially if additives are present, can alter the effect intensity [6]. It should be noted that the concentration of the additive in the lubricant has a major effect on the performance of the coating [7]. Finally, another property that should be carefully considered is the coating thickness, especially when used for stainless-steel gears. It has been observed that thicker coatings are more effective in reducing friction (up to 41%), compared to thinner films, which may reduce friction only up to 29% [8].
Despite complications related to the properties of DLC coatings and sensitivity to specific operating conditions, their advantages can undoubtedly contribute to the reduction of gearbox power losses. Consequently, their use has been tested experimentally by various researchers [2,9,10]. However, there is a dearth of reported work on modelling the tribo-dynamics of DLC coated transmission gears compared to thorough research of helical gear performance [11] and dynamic contacts [12] in general. For most cases the models are based on computationally expensive numerical methods [13,14] which do not take into account the system dynamics [15] and only consider contact level behaviour.
In this work, a novel tribo-dynamic model of a manual transmission (sub-system level) has been developed, which incorporates the effect of using DLC coatings on gear teeth pairs. The model can predict the effect of coated teeth on contact mechanics and the generated friction analytically, which is a computationally economic way compared to the numerical models that can be found in the relevant literature. The prediction of boundary friction is based on the Greenwood and Tripp method [16], enriched with experimentally measured coefficients of the asperity boundary shear strength on DLC coated surfaces using AFM. The presented analytical model for friction calculations coupled with a numerical dynamic model, provide a computationally efficient tribo-dynamic tool to analyse the gearbox power losses. The validity of the model has been experimentally verified in the micro- scale via AFM measurements, as well as in macro- scale by conducting pin-on-disc measurements of several DLC-coated surfaces under conditions similar to the operating conditions of the examined transmission, which arise from the Real Driving Emissions (RDE) driving cycle in order to be representative of realistic driving conditions. Results show that different DLC-type coatings have a beneficial effect on the transmission power losses, with the larger gears having the greatest power loss improvement up to 50%, whereas the smaller gears have shown power loss improvement up to around 20%. Results confirm that the DLC-type coatings could be useful for efficiency improvement and that the model is able to predict their effects on manual transmissions efficiency.
2. Methodology
2.1. Model Overview
A tribo-dynamic model of a manual six-speed transmission is developed for calculating efficiency by utilizing coated gears. Gear teeth modifications have not been considered and are out of the scope of this work. The use of coatings was examined only for the loaded gear pair under conditions provided from the selected driving cycle. This was due to the fact that previous research [17] has indicated that the loaded gear pair is the highest contributor to transmission power losses.
The equations of motion describing the dynamics of the examined system are shown below. It has to be highlighted that Equation (1) refers to loose gears, while Equation (2) refers to loaded gears.
where i is the loose gear examined, j is the engaged gear examined, , is the load on the loose and engaged gear teeth, respectively, , is the viscous friction generated on the loose and engaged gear respectively, is the friction generated between the loose gear and the shaft, is the boundary friction generated on the loaded gear teeth, and , is the base radius of the loose and engaged wheel examined. As a result, there is a set of six equations of motion, i.e., five for the unloaded gears described by Equation (1) and one for the engaged gear described by Equation (2), which are solved simultaneously.
The dynamic model that has been developed, can identify throughout the simulated running time which of the six gears of the transmission is engaged based on data provided by the user that follow the chosen driving cycle.
Within the same model, the gear that has been coated is traced so that the effect on the frictional losses can be identified. The contact mechanics of the loaded gear at each instant of time is the main focus, if uncoated is considered to follow Hertzian theory. On the other hand, when the engaged gear is considered coated, the contact mechanics is tackled following a specific approach that will be described in detail in the following sections. At the boundary level, the friction model for coated gears is using measurements for the coefficient of boundary shear strength of asperities, taken using an atomic force microscope (AFM) in lateral mode. Thus, it utilises realistic values for their surface properties.
2.2. Loaded Gear Frictional Losses Considering Uncoated Surface
The loaded gears of a manual transmission are considered to operate under the mixed-elastohydrodynamic regime of lubrication due to the high loads they support. The specific operating conditions (especially kinematics) during meshing determine the thickness of the lubricant film, which is calculated by Equation (3) in order to estimate the generated viscous friction [18]:
where is the dynamic viscosity of the lubricant at atmospheric pressure, is the entraining speed of the lubricant, Er is the reduced elastic modulus of the contact, Rx is the radii of curvature along the direction that defines the transverse plane, is the pressure-viscosity coefficient, and W is the applied load. It should be noted that this equation represents line contact. For the helical gears used in the transmission examined, it is assumed that the radius of curvature perpendicular to the direction of entraining speed is much larger than that along the direction of entraining speed. Hence, the contact area of the gear mesh is approximated as a straight line [19]. For the uncoated elastohydrodynamic regime under which the gears operate, the coefficient of friction is given by [20]:
where is the pressure-viscosity coefficient, is the Eyring stress of lubricant, Pmean is the mean pressure in the apparent area, is the dimensionless central film thickness, is the conductivity of the lubricant, is the dynamic viscosity of the lubricant at atmospheric pressure, and ξ is given by [21]:
where is the radii of curvature along the direction of entraining motion and are the thermal conductivity, density, and specific heat capacity of the contacting solids, respectively. The reduced elastic modulus of the contact (Er) is given by [22]:
where , are the Poisson ratios of the two contacting surfaces and , are the Young moduli of elasticity, respectively. The viscous friction generated on the gear is then given by
The aforementioned parameters mainly affect the viscous friction generated on gear teeth during meshing. Yet, loaded gear teeth also suffer from boundary friction as a result of the asperity interactions [16]. Figure 1 presents the distribution of asperities of the uncoated gear teeth as was measured using the Alicona Infinite Focus microscope (Bruker Alicona, Gratz, Austria). As the figure shows the distribution of asperities approaches the Gaussian distribution, which is thereafter assumed.
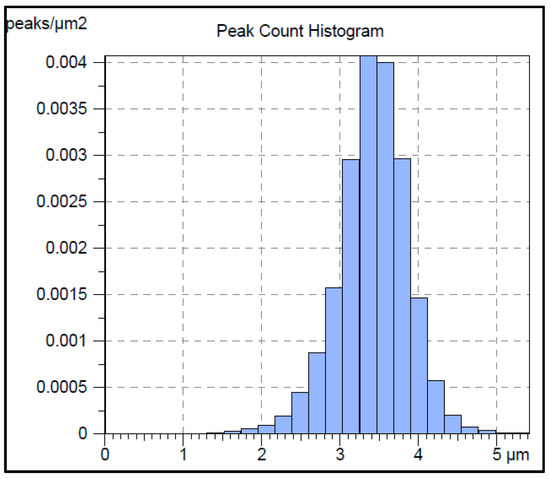
Figure 1.
Distribution of uncoated gear teeth asperities.
The load that can be carried by the asperities is described as follows, where mixed lubrication regime is assumed due to the high pressures on the loaded gear teeth [16]:
where β is the average asperity tip radius, σ is the composite RMS surface parameter, A is the apparent contact area, is the reduced elastic modulus of contact, as shown in Equation (9) and F5/2(λ) is a statistical function for Gaussian distribution of asperities affected by the Stribeck oil film parameter λ and is described by Equation (10).
For the case of boundary friction, similarly as in the case of viscous friction, the surface parameters of the gear teeth (ξ, β, σ) where experimentally measured. Figure 2 shows a view of the surface asperities of the gear teeth whereas Table 1 summarizes the parameters measured.
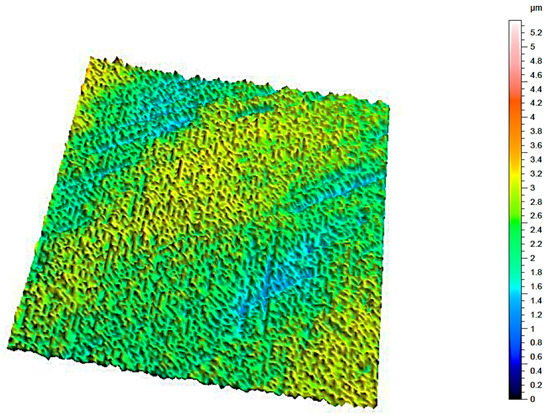
Figure 2.
Surface asperities of the gear teeth.

Table 1.
Surface parameters for the gear teeth.
The asperity contact area A is calculated by
where F2(λ) is a statistical function for Gaussian distribution of asperities as below.
The limiting shear stress is also required for calculating boundary friction and it is described by
where τ0 is the Eyring stress, ζ is the pressure coefficient of the boundary shear strength of asperities, measured by AFM, and Pm is the mean pressure in the asperity area of each roller at each instant of time during operation, as described by
Then, the value of boundary friction will be calculated as
2.3. Contact Mechanics of Coated Gear Teeth
Although it may sound reasonable to assume that there is no difference (when calculating friction) between coated and uncoated gear teeth, this is not the case in reality. There is necessity for a different approach of the contact mechanics between a coated and a non-coated surface, which will consequently change the viscous friction formulae as well as boundary friction by changing the apparent contact area. The equations described in Section 2.2 originate from the assumption of Hertzian contact. However, when a coating layer is used the contact conditions may differ from Hertzian. It has been observed that the characteristics of the coating and base materials can change the type of contact. In the literature, there are several models proposed for modelling the contact of coated gear teeth. In the majority of cases, numerical models at conjunction level are proposed, which are computationally expensive and thus not possible to be coupled with gear dynamics [23,24,25]. An analytical method is developed in this work to model coated gear teeth. The contact between the coated and non-coated gear teeth during meshing will be modelled by considering the uncoated gear as cylindrical elastic solid and the coated one as layered flat elastic solid. The use of an equivalent cylinder on plane contact model for modelling gear teeth contacts is a common approach, as proposed by various researchers [23]. Figure 3 illustrates this approach.
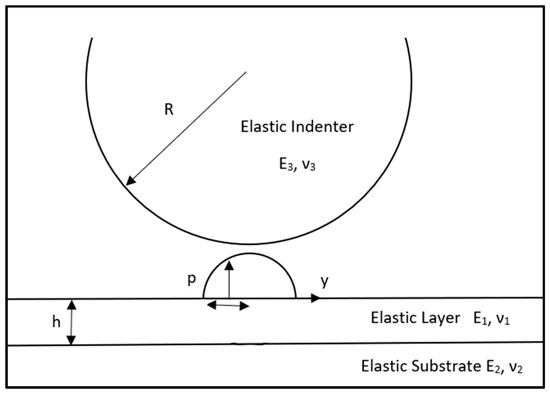
Figure 3.
Description of approach of coated and non-coated gear.
The layer of coating is considered to be perfectly adhered on the substrate. The main properties of the materials involved are the Poisson’s ratio (ν) and Young’s modulus of elasticity (E). In the formulation, “1” refers to the layer of the coating, “2” to the substrate, and “3” to the indenter (counterpart in this case). The approach followed can be mainly summarized as a method that will track the non-Hertzian type of contact generated due to the presence of the coating and altering the methodology for the non-coated case to allow the calculation of frictional losses. Two additional ratios need to be determined, which will be used to track the shape of the contact and the pressure applied on it. The first one is the ratio of Young’s modulus of elasticity of the layer and the indenter [26]:
The second ratio is γ, which is the ratio of the Young’s modulus of elasticity of the layer and the substrate [26], described by:
It should be highlighted that for the case of δ = 0, it is considered that the indenter is rigid whereas when δ = γ, the indenter is elastic. In addition, all materials involved share the same Poisson’s ratio, which helps us to avoid numerous calculations:
This assumption is generally applicable for many cases of coated gears, since the values of both steel and several types of coatings are comparable. Also, many methods to model the effect of coating (as found in the literature) are employing the same assumption [24,25].
The next step requires the calculation of the maximum pressure and contact half width for pure Hertzian contact of a material with the properties of the layer. These values will be used as a benchmark for the actual values of the contact later. The maximum Hertzian pressure is given by:
where W is the load and R is the equivalent radius of the two contacting bodies. The Hertzian contact half width is given by:
The above values refer to Hertzian contact and they are used as a scale factor to find the actual contact half width and pressure. Two new variables need to be introduced. The first one is , which represents the ratio of actual central pressure to Hertzian maximum pressure:
where is the actual central pressure. The second variable to be introduced in the model is , which represents the non-dimensional half width given by
where is the actual dimensional half width of the contact. The values of and can be obtained from the literature, based on experimentally measured or numerically calculated values. The ratios δ and γ, namely the relationship between the material characteristics of the layer, the substrate, and the indenter, have a major effect on the contact. For that reason, the values of and are considered with respect to the values of δ and γ. In Figure 4 and Figure 5, the variation of and is presented, as found in literature, for different values of γ and for elastic intender (δ = γ) [26].
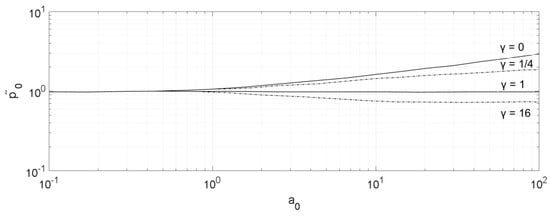
Figure 4.
Pressure as a function of (δ = γ) [26].
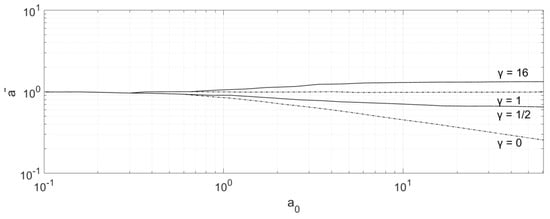
Figure 5.
Half width as a function of (δ = γ) [26].
Figure 4 and Figure 5 allow the calculation of both and by knowing only the Hertzian half width and the ratio γ. In the analytical model, the data of those figures have been used for the calculations. With Hertzian pressure () and Hertzian half width () the actual pressure () and the half width () for any case of coated gear can be then found by using Equations (21) and (22). The non-dimensional pressure distribution can be described by [26]:
where η is the coordinate relative to the half width with values between −1 and +1 for the total contact zone.
2.4. Coating Effect on Loaded Gear Teeth Contact Mechanics and Friction
The analytical equations of Section 2.2 are now modified to calculate friction of the coated gear pair. Considering that the teeth contact is a line contact, Equation (3) is assumed to be still applicable. Updates are required for the coefficient of friction of Equations (4) and (5) where the contact pressure should be updated for the coated gear:
where is the mean pressure of the coated gear pressure distribution. , and are the thermal conductivity, density, and specific heat capacity of the coating material, respectively. As Equations (24) and (25) state, it is expected for coated gears to have a significant effect on viscous friction. Additionally, the effect of coating on boundary friction is mainly to be shown due to the difference of the surface properties as well as the apparent contact area affecting the asperity area and force. The characteristics of coating asperities will be different than those of the substrate material, affecting the load carried by them (Equation (5)) and, consequently, the mean pressure value (Equation (8)). Finally, the value of the pressure coefficient of boundary shear strength is going to differ (Equation (14)). This was also experimentally obtained through the AFM measurements. However, for the case of the coating material, as for the material of the substrate, the distribution of asperities is shown in Figure 1, allowing for the use of the methodology described for boundary friction calculation.
Finally, it should be noted that for the modelling of coated gear teeth it was assumed that during gear meshing there is no transfer of the coating material to the uncoated surface nor interaction between the intender and the substrate layer.
2.5. Experimental Measurements
In order to have realistic input data for the numerical simulations, experimental measurements of the surface characteristics of DLC-type coatings, commonly used in automotive applications, were conducted. Two different coatings were chosen—DLC and WCC. The plain DLC coating consists of sp2 graphite and sp3 graphite, while the WCC coating also has layers of tungsten carbine (WC). For the measurement of the surface properties of both materials, steel discs with 58 mm radius and 10 mm thickness were manufactured while the coating was applied by using the Physical Vapor Deposition (PVD) method. The coating film thickness was 3μm. In order to obtain the coefficients of boundary shear strength of the asperities [27], an atomic force microscope (AFM) in lateral force microscopy (LFM) mode was used, as shown in Figure 6.
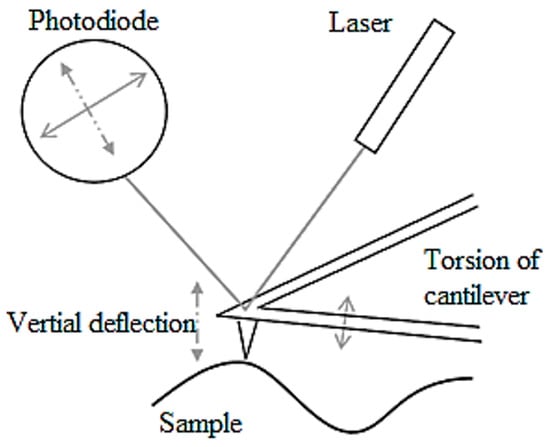
Figure 6.
Atomic force microscope (AFM).
Bruker DNP-10 probes with four tips were used for the AFM measurement. The tip is placed on a cantilever with spring constant of 0.350 Nm−1 and tip radius 20 nm. Prior to each measurement calibration was conducted. The pressure coefficient of boundary shear strength of the two examined coatings was measured under both dry and wet contact conditions for a range of applied loads with a scan area of 3 μm2, measuring 1024 data points. For the wet measurements, transmission oil was used. Figure 7 shows the normal load vs. friction variation obtained from the AFM for a DLC disc.
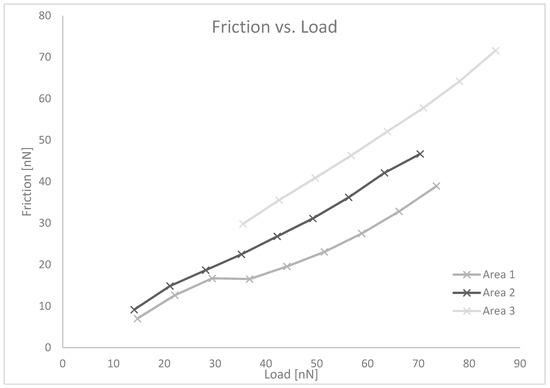
Figure 7.
AFM measurement of diamond-like-carbon (DLC)-coated disc dry.
Similar results were gathered for the rest of the discs and the WCC coated ones. Through these friction measurements, the pressure coefficient of boundary shear strength can be obtained. Table 2 summarizes the measurements taken for both coatings (wet and dry conditions).
Table 2.
Friction coefficient and ζ measurements of coatings.
The results presented show that the values measured under wet contacts are considerably lower than those in dry contacts. The results also show that the two coatings tend to have slightly different properties, and these might lead to different contribution on power loss since it also depends on the characteristics of the gears and their operating conditions.
Cronbach Alpha statistical method was applied to verify that the measurements taken are reliable. The method requires the calculation of the alpha (a) parameter for the sample of data examined, and any value above 0.7 is acceptable.
where n is the sample size, is the variance of disc i, and is the variance of the observed total test scores. For the measurements of the coating properties seven different discs were used. The DLC ones scored an alpha value of 0.80 while the WCC scored 0.70, making both sets of measurements reliable to use for simulating coated surfaces.
3. Results
3.1. Experimental Validation
The friction coefficient of the contacting surfaces, measured at asperity level using AFM measurements and expanded to conjunction level using the provided numerical methodology, was compared to experimental tests using a pin-on-disc machine which directly obtains the conjunction level friction. The test rig is presented in Figure 8. The purpose of this experiment is to validate the presented numerical model from asperity level to conjunction level by comparing the friction coefficient value, since the model will be used for friction calculation of conjunctions in loaded gear.
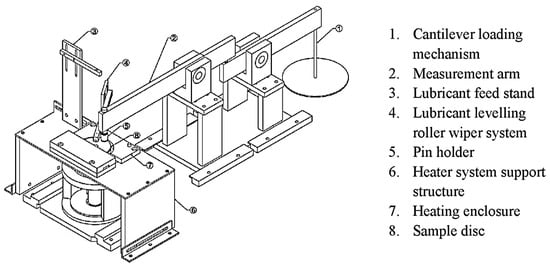
Figure 8.
Pin-on-disc tribometer.
The machine comprises a cantilever that applies the chosen contact force on the sample disc, which is rotating with a chosen speed so as to replicate the sliding speed of the gear teeth contact. Additionally, a strain gauge that is instrumented on the cantilever is used to measure the generated friction. Τhe presence of the lubricant in the contact should not be neglected either, since the contacts in an automotive transmission are not dry. It should be pointed that a lubricant level roller is also essential for the setup in order to allow for the creation of a full thin film on the contact. Finally, a heating device is placed under the rolling plane and a K-type thermocouple is positioned under the heating enclosure to verify the temperature of the lubricant so that the effect of the varying viscosity can also be taken into account [28].
Since the pin-on-disc measurements are destructive for the surface, it was decided that measurements are conducted taking into consideration that the range of operating conditions to be tested should be identified as the most common operating conditions of the RDE cycle (as well as some high load cases). Additionally, different temperatures were chosen for the six sets of measurements conducted with sliding distance of 999 m so that the effect of temperature is captured as well.
The setup of the pin-on-disc allows only for the control of the applied load on the surface, the radius on the sample disc were the load is applied and its rotational speed. Consequently, the next step prior to the actual measurement is to translate the pressure and sliding velocity that is assumed for the contact based on the operating conditions that were shown in Table 3 into representative load, speed and radius on the machine. To be more precise, the pressure in the contact as calculated by gear model simulations for the examined operating conditions, has to be transformed into load on the pin to experimentally capture the same pressure. Equation (27) was used to obtain the values of the pin load as shown in Table 4, employing the Hertzian theory for point contacts [23]:
Table 3.
Pin-on-disc measurement sets.
Table 4.
Pin-on-disc friction coefficient measurements.
Additionally, for verifying the simulation-calculated sliding speed in the gear teeth contact it is necessary to calculate the rotational speed of the disc based on the radius where the pin is touching the disc. This is achieved by Equation (28).
In Table 4, the results of the experiments in comparison with the model simulations are also presented. It has to be noted that the experiment was repeated six times for each test condition (1 to 6 as presented in Table 3). The results were post processed using the Cronbach Alpha statistical method (described in Section 2.5). The values of the alpha parameter are: 0.96 for test 1, 0.97 for test 2, 0.89 for test 3, 0.91 for test 4, 0.73 for test 5, and 0.76 for test 6. Due to all alpha values being higher than 0.7, the results are statistically meaningful in order to validate the proposed model.
Table 4 shows that the model can accurately calculate the friction coefficient of the contacting surfaces when the coating layer is taken into account, verifying that the numerical approach taken is representative of the performance of the coated contacts and can be used to calculate the generated friction in the contact of coated gear teeth.
3.2. Simulation Results
For this research project, a six-speed manual transmission was examined. This type of transmission is used in small to medium passenger cars. The characteristics and dimensions of the gear pairs of the transmission are presented in Table 5a whereas in Table 5b the main material characteristics for the coated and uncoated surfaces are shown.
Table 5.
Gear characteristics.
The properties of the lubricant used are provided in Table 6. The effect of temperature on the lubricant dynamic viscosity value has been considered for the temperature range that the examined gearbox operates. The change of the lubricant viscosity due to temperature change was experimentally measured. The lubricant was heated using a hot plate and a thermocouple was used for tracing the temperature. The temperature was traced in the whole volume of the lubricant to verify that the measurement is consistent. Then, with the use of a viscometer the dynamic viscosity was measured. Multiple measurements were conducted, and the mean value of the dynamic viscosity was used during the simulations.
Table 6.
(a) Lubricant properties and (b) dynamic viscosity for different temperatures.
The input conditions of the model simulations are obtained from the RDE driving cycle, which is presented in Figure 9. Snapshots of the cycle were used for the tests (represented by the red dots in the Figure). Two scenarios were examined for each gear as presented in Table 7. In order to track the effect of the coatings, it was decided to track the friction of engaged gears since they have the biggest contribution on frictional losses. For each case, it was also assumed that only the wheel of each gear pair was coated as is common practice in industry. The characteristics of the coatings are as presented in the previous section.
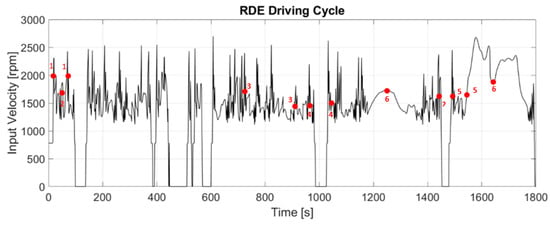
Figure 9.
Real Driving Emissions (RDE) driving cycle.
Table 7.
Scenarios of operating conditions examined.
The results are presented as power losses due to the direct relation with efficiency:
Figure 10 presents the results of the simulations for the operating conditions of scenario 1, when all gears are considered uncoated. It has to be noted that the uncoated gear model has been validated experimentally at system level, as presented in [29]. For each gear, as described in Table 7, different operating conditions apply. Hence, even though the results are presented on the same figure, for each gear they refer to different snapshot of the RDE cycle and the time shown on the x axis refers to the duration of the simulation at the corresponding RDE time snapshot. As mentioned before, the power gain by using coated gears is traced for the engaged gear pair of the transmission only due to the fact that engaged gears have the highest values of power losses. Consequently, for each gear that is shown in the following figures the gear is considered engaged and performing under the operating conditions of Table 7. In the following figures, the oscillation of power losses at each instant of time due to the varying meshing stiffness can also be observed. Similarly to Figure 10, the same rules apply for Figure 11, which shows the power losses of each gear for the same operating conditions of the first scenario considering DLC coating.
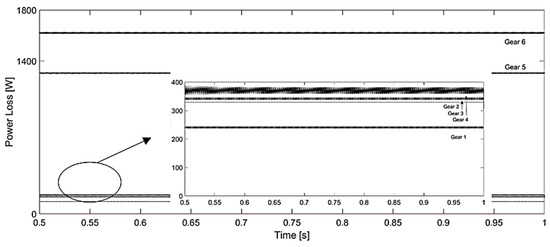
Figure 10.
Power losses for uncoated gears, scenario 1.
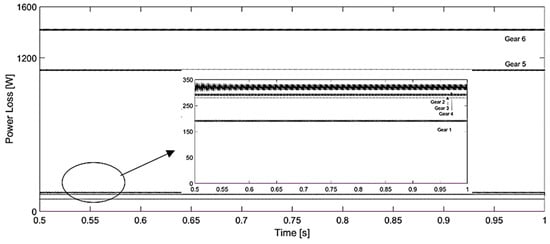
Figure 11.
Power losses for DLC-coated gears, scenario 1.
The results of Figure 11 reveal that the use of DLC coatings leads to power loss reduction for all gears under certain working conditions. Even though the coating type used for all gears is the same, the effect is different since the performance is affected by the operating conditions and the gear geometry, as discussed in the methodology section. For the operating conditions of scenario 1, the lesser effect on power loss is found on the first gear of the transmission where the power gain is around 6%. The power gain in the middle gear pairs is around 10–15%.
The use of WCC coating has a similar effect, as presented in Figure 12 for the same operating conditions of scenario 1. Since the surface properties of the two coatings differ as measured experimentally, a different effect on the power loss change was expected. However, it should be noted that the power loss was reduced in all coated gears. In order to further verify the effects of each coating type, both coatings were tested under different operating conditions, described as scenario 2 (see Table 7).
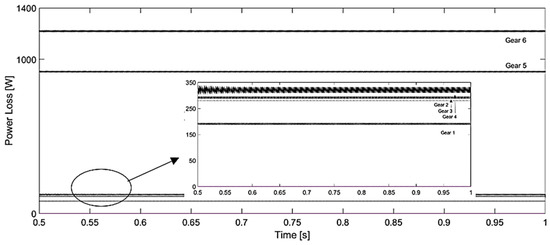
Figure 12.
Power losses for WCC coated gears, scenario 1.
For the case of uncoated gears operating under the conditions of scenario 2, the power losses are shown in Figure 13. The power losses when using DLC and WCC coatings are presented in Figure 14 and Figure 15, respectively, for the operating conditions of scenario 2.
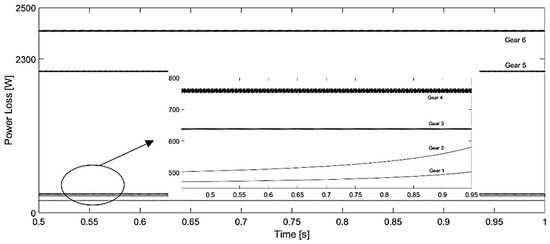
Figure 13.
Power losses for uncoated gears, scenario 2.
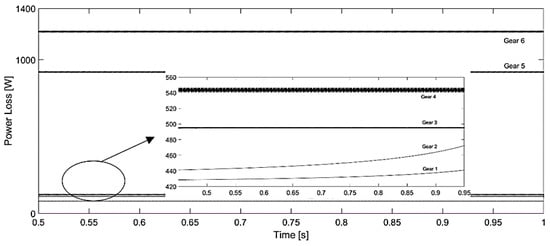
Figure 14.
Power losses for DLC-coated gears, scenario 2.
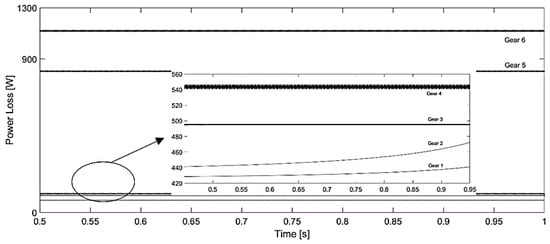
Figure 15.
Power losses for WCC-coated gears, scenario 2.
Based on the results obtained for scenario 2, it is obvious that for this case as well, the use of either type of coating can lead to improvement of the gearbox efficiency. Even though for this scenario the effect of each coating is similar as well, it is clear that the WCC shows a slightly better performance especially on the higher gear pair power losses. However, the range of power loss gain for all gears is between 12% and 60%. The change on total frictional losses on boundary friction especially is mostly influenced by the pressure coefficient of asperity contacts, which was experimentally measured using the AFM. For both coatings this value can be considered to be of similar magnitude. However, there are other parameters that indirectly can contribute to this difference. The topographical values obtained from Alicona measurement also contribute to the amount of asperity interaction at each film thickness, hence the boundary friction.
The operating conditions have a major effect on the thickness of the film in the contact. Due to the fact that the conditions of scenario 2 are characterized by higher torque and speed, the film becomes thinner due to the higher load and thicker due to the higher speed. Consequently, asperities interactions in contact will change.
Finally, the contact mechanics is also affected by application of coating as presented in this work. This leads to a different contact footprint, hence the different apparent contact area and contact pressure, affecting the asperity and viscous frictions respectively.
The average effect of both coatings examined is summarized in Table 8.
Table 8.
Effect of coating on gear power losses.
Finally, the difference achieved with the use of coatings for a bigger part of the RDE cycle is presented in Figure 16. To be more precise, the results show the power loss reduction with the use of DLC coating as the cycle proceeds taking into account any gear shift as well as the constantly changing input torque and velocity.
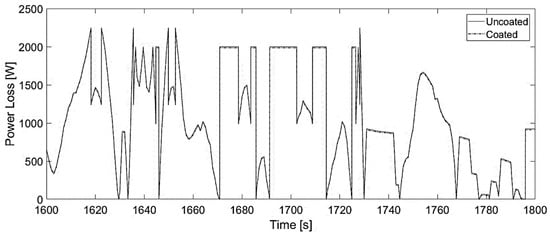
Figure 16.
Power losses for uncoated and coated gears, RDE cycle part.
Figure 16 showcases that the model developed is able to capture the effect of coating on transmission power losses at system level. Additionally, it is shown that the use of coatings can indeed reduce the total power losses of the transmission under various operating conditions, potentially reaching reduction up to 0.25%.
4. Conclusions
In this paper, a tribo-dynamic model has been developed to investigate the effect of DLC and WCC-type coatings on the frictional losses of gear pairs in manual automotive transmissions. RDE driving cycle conditions were used as input so that the results are representative of realistic OEM transmission testing. The contact mechanics of the coated gear teeth were considered using an analytical and computationally efficient frictional model, facilitating the coupling of tribology and dynamics models.
In the tribology model, AFM experimental measurements were conducted to obtain the coating characteristics at asperity level and then numerically expanded to the conjunction level. The accuracy of the developed model from the asperity level to the conjunction level was validated using a pin-on-disc experiment.
The numerical simulations using a tribo-dynamic model for two types of coatings, as well as various operating conditions, showcase that the application of coatings on manual transmission gears can be beneficial with respect to frictional losses. All the transmission gear pairs demonstrated improvements on power losses under all the operating conditions examined. It was noted that larger gears tend to achieve higher power loss reduction (around 40%) compared to smaller gears whose losses were reduced around 10–20%. Finally, even though the plain DLC and WCC coatings that were examined do present some surface properties differences and some changes on the percentage of power consumption of the gears, from an efficiency point of view, only the coatings can be considered equally beneficial for the efficiency improvement of automotive manual transmissions.
Author Contributions
Conceptualization, all authors; methodology, A.L., M.M. and S.T.; code development, A.L.; validation, A.L. and M.M.; analysis, A.L., M.M. and S.T.; writing—original draft preparation, A.L., M.M. and S.T; writing—review and editing, all authors; funding acquisition, R.D. and S.T. All authors have read and agreed to the published version of the manuscript.
Funding
This research was funded by Ford Motor Company.
Acknowledgments
The authors would like to express their gratitude to Ford Motor Company for its financial support under its University Research Programme.
Conflicts of Interest
The authors declare no conflict of interest.
Notation
| a | pressure-viscosity coefficient |
| A | apparent contact area |
| c′ | specific heat capacity of solid |
| Ε′ | reduced elastic modulus of contact |
| Ei | Young’s modulus of elasticity of solids |
| Er | reduced elastic modulus of contact |
| boundary friction | |
| viscous friction | |
| statistical function for a Gaussian distribution of asperities | |
| F5/2(λ) | statistical function for a Gaussian distribution of asperities |
| hc0 | dimensionless central film thickness |
| conductivity of the lubricant | |
| K′ | solid thermal conductivity |
| maximum Hertzian pressure | |
| ratio of true central pressure to Hertzian maximum pressure | |
| nondimensional pressure | |
| actual central pressure | |
| mean pressure in the asperity area | |
| mean pressure in the apparent area | |
| R | equivalent radius of contacting bodies |
| Rx | radii of curvature along x direction |
| U | Entraining speed of lubricant |
| W | load |
| fraction of load carried by asperities peaks | |
| dimensional half width of the contact | |
| nondimensional half width | |
| Hertzian type contact half width | |
| β | average asperity tip radius |
| the ratio of the Young’s modulus of elasticity of the layer and the substrate | |
| δ | ratio of Young’s modulus of elasticity of the layer and the indenter |
| pressure coefficient of boundary shear strength of asperities | |
| η | coordinate value relative to half width |
| η0 | dynamic viscosity of the lubricant at atmospheric pressure |
| λ | Stribeck oil film parameter |
| coefficient of friction | |
| Poisson ratio of contacting surfaces | |
| ρ′ | density of solid |
| σ | composite RMS surface parameter |
| Eyring stress | |
| limiting shear stress | |
| Subscripts | |
| 1 | layer of the coating |
| 2 | substrate |
| 3 | indenter |
References
- Kržan, B. Load-carrying capacity of WC/C-coated gears lubricated with a low-viscosity oil. Lubr. Sci. 2016, 28, 127–139. [Google Scholar] [CrossRef]
- Xiao, Y.; Shi, W.; Luo, J.; Liao, Y. The tribological performance of TiN, WC/C and DLC coatings measured by the four-ball test. Ceram. Int. 2014, 40, 6919–6925. [Google Scholar] [CrossRef]
- Martins, R.; Amaro, R.; Seabra, J. Influence of low friction coatings on the scuffing load capacity and efficiency of gears. Tribol. Int. 2008, 41, 234–243. [Google Scholar] [CrossRef]
- Podgornik, B.; Jacobson, S.; Hogmark, S. DLC coating of boundary lubricated components - Advantages of coating one of the contact surfaces rather than both or none. Tribol. Int. 2003, 36, 843–849. [Google Scholar] [CrossRef]
- Podgornik, B.; Sedlaček, M.; Vižintin, J. Compatibility of DLC coatings with formulated oils. Tribol. Int. 2008, 41, 564–570. [Google Scholar] [CrossRef]
- Podgornik, B.; Jacobson, S.; Hogmark, S. Influence of EP additive concentration on the tribological behaviour of DLC-coated steel surfaces. Surf. Coat. Technol. 2005, 191, 357–366. [Google Scholar] [CrossRef]
- Podgornik, B.; Hren, D.; Vižintin, J.; Jacobson, S.; Stavlid, N.; Hogmark, S. Combination of DLC coatings and EP additives for improved tribological behaviour of boundary lubricated surfaces. Wear 2006, 261, 32–40. [Google Scholar] [CrossRef]
- Fujii, M.; Ananth Kumar, M.; Yoshida, A. Influence of DLC coating thickness on tribological characteristics under sliding rolling contact condition. Tribol. Int. 2011, 44, 1289–1295. [Google Scholar] [CrossRef]
- Kim, D.W.; Kim, K.W. Effects of sliding velocity and ambient temperature on the friction and wear of a boundary-lubricated, multi-layered DLC coating. Wear 2014, 315, 95–102. [Google Scholar] [CrossRef]
- Tamura, Y.; Zhao, H.; Wang, C.; Morina, A.; Neville, A. Interaction of DLC and B4C coatings with fully formulated oils in boundary lubrication conditions. Tribol. Int. 2016, 93, 666–680. [Google Scholar] [CrossRef]
- Meneses, J.; García-Prada, J.C.; Castejón, C.; Rubio, H.; Corral, E. The kinematics of the rotary into helical gear transmission. Mech. Mach. Theory 2017, 108, 110–122. [Google Scholar] [CrossRef]
- Corral, E.; García, M.J.; Castejon, C.; Meneses, J.; Gismeros, R. Dynamic Modeling of the Dissipative Contact and Friction Forces of a Passive -Walking Robot. Appl. Sci. 2020, 10, 2342. [Google Scholar] [CrossRef]
- Wang, T.-J.; Wang, L.; Gu, L.Q.; Zhao, X.-L. Numerical analysis of elastic coated solids in line contact. J. Cent. South Univ. 2015, 22, 2470–2481. [Google Scholar] [CrossRef]
- Wang, Q.J.; Liu, S.; Wayne Chen, W.; Liu, Y.; Zhu, D. An Elastohydrodynamic Lubrication Model for Coated Surfaces in Point Contacts. J. Tribol. 2007, 129, 509. [Google Scholar]
- Lu, L.; Xu, F.; Jiang, T.; Zhang, Q.; Lyu, S. Characteristic evaluation of friction and wear in the C-N and TiN coated gear. Int. J. Precis. Eng. Manuf. 2010, 11, 107–111. [Google Scholar] [CrossRef]
- Greenwood, J.A.; Tripp, J.H. The Contact of Two Nominally Flat Rough Surfaces. Proc. Inst. Mech. Eng. 1970, 185, 625–633. [Google Scholar] [CrossRef]
- Michaelis, K.; Michaelis, K. Optimization of gearbox efficiency. Gomabn 2009, 48, 462–480. [Google Scholar]
- Mohammadpour, M.; Theodossiades, S.; Rahnejat, H.; Kell, P. Transmission efficiency and noise, vibration and harshness refinement of differential hypoid gear pairs. Proc. Inst. Mech. Eng. Part K J. Multi-body Dyn. 2014, 228, 19–33. [Google Scholar] [CrossRef]
- Xu, H.; Kahraman, A.; Anderson, N.E.; Maddock, D.G. Prediction of Mechanical Efficiency of Parallel-Axis Gear Pairs. J. Mech. Des. 2006, 129, 58. [Google Scholar] [CrossRef]
- De La Cruz, M.; Chong, W.W.F.; Teodorescu, M.; Theodossiades, S.; Rahnejat, H. Transient mixed thermo-elastohydrodynamic lubrication in multi-speed transmissions. Tribol. Int. 2012, 49, 17–29. [Google Scholar] [CrossRef]
- Evans, C.R.; Johnson, K.L. Regimes of Traction in Elastohydrodynamic Lubrication. Proc. Inst. Mech. Eng. Part C: J. Mech. Eng. Sci. 1986, 200, 313–324. [Google Scholar] [CrossRef]
- Chittenden, R.J.; Dowson, D.; Dunn, J.F.; Taylor, C.M. A Theoretical Analysis of the Isothermal Elastohydrodynamic Lubrication of Concentrated Contacts. I. Direction of Lubricant Entrainment Coincident with the Major Axis of the Hertzian Contact Ellipse. Proc. R. Soc. A Math. Phys. Eng. Sci. 2006, 397, 245–269. [Google Scholar]
- Li, S.; Kahraman, A. A transient mixed elastohydrodynamic lubrication model for spur gear pairs. J. Tribol. 2010, 132, 1–9. [Google Scholar] [CrossRef]
- Nowell, D.; Hills, D.A. Contact problems incorporating elastic layers. Int. J. Solids Struct. 1988, 24, 105–115. [Google Scholar] [CrossRef]
- Zhu, C.; Liu, H.; Liu, H.; Wei, P.; Tang, J. Tribological behavior of coated spur gear pairs with tooth surface roughness. Friction 2018, 7, 117–128. [Google Scholar]
- Gupta, P.K.; Walowit, J.A. Contact Stresses Between an Elastic Cylinder and a Layered Elastic Solid. J. Lubr. Technol. 2010, 96, 250. [Google Scholar] [CrossRef]
- Rahnejat, H.; Humphrey, E.; Rahmani, R.; Morris, N.; Leighton, M. Multiscale Friction in Lubricant-Surface Systems for High-Performance Transmissions Under Mild Wear. Tribol. Lett. 2018, 66, 1–13. [Google Scholar]
- Humphrey, E.; Gkinis, T.; Morris, N.; Leighton, M.; Rahmani, R.; Rahnejat, H. Clutch Lining Frictional Characteristics under Thermal Tribodynamic Conditions. PMC 2016, 1–12. [Google Scholar]
- Laderou, A.; Mohammadpour, M.; Theodossiades, S.; Wilson, A.; Daubney, R. Effect of bearing thermally induced preload on the efficiency of automotive manual transmission under RDE. Proc. Inst. Mech. Eng. Part C J. Mech. Eng. Sci. 2019, 233, 7423–7441. [Google Scholar] [CrossRef]


© 2020 by the authors. Licensee MDPI, Basel, Switzerland. This article is an open access article distributed under the terms and conditions of the Creative Commons Attribution (CC BY) license (http://creativecommons.org/licenses/by/4.0/).