Homodyne Spectroscopy with Broadband Terahertz Power Detector Based on 90-nm Silicon CMOS Transistor


Abstract
:1. Introduction
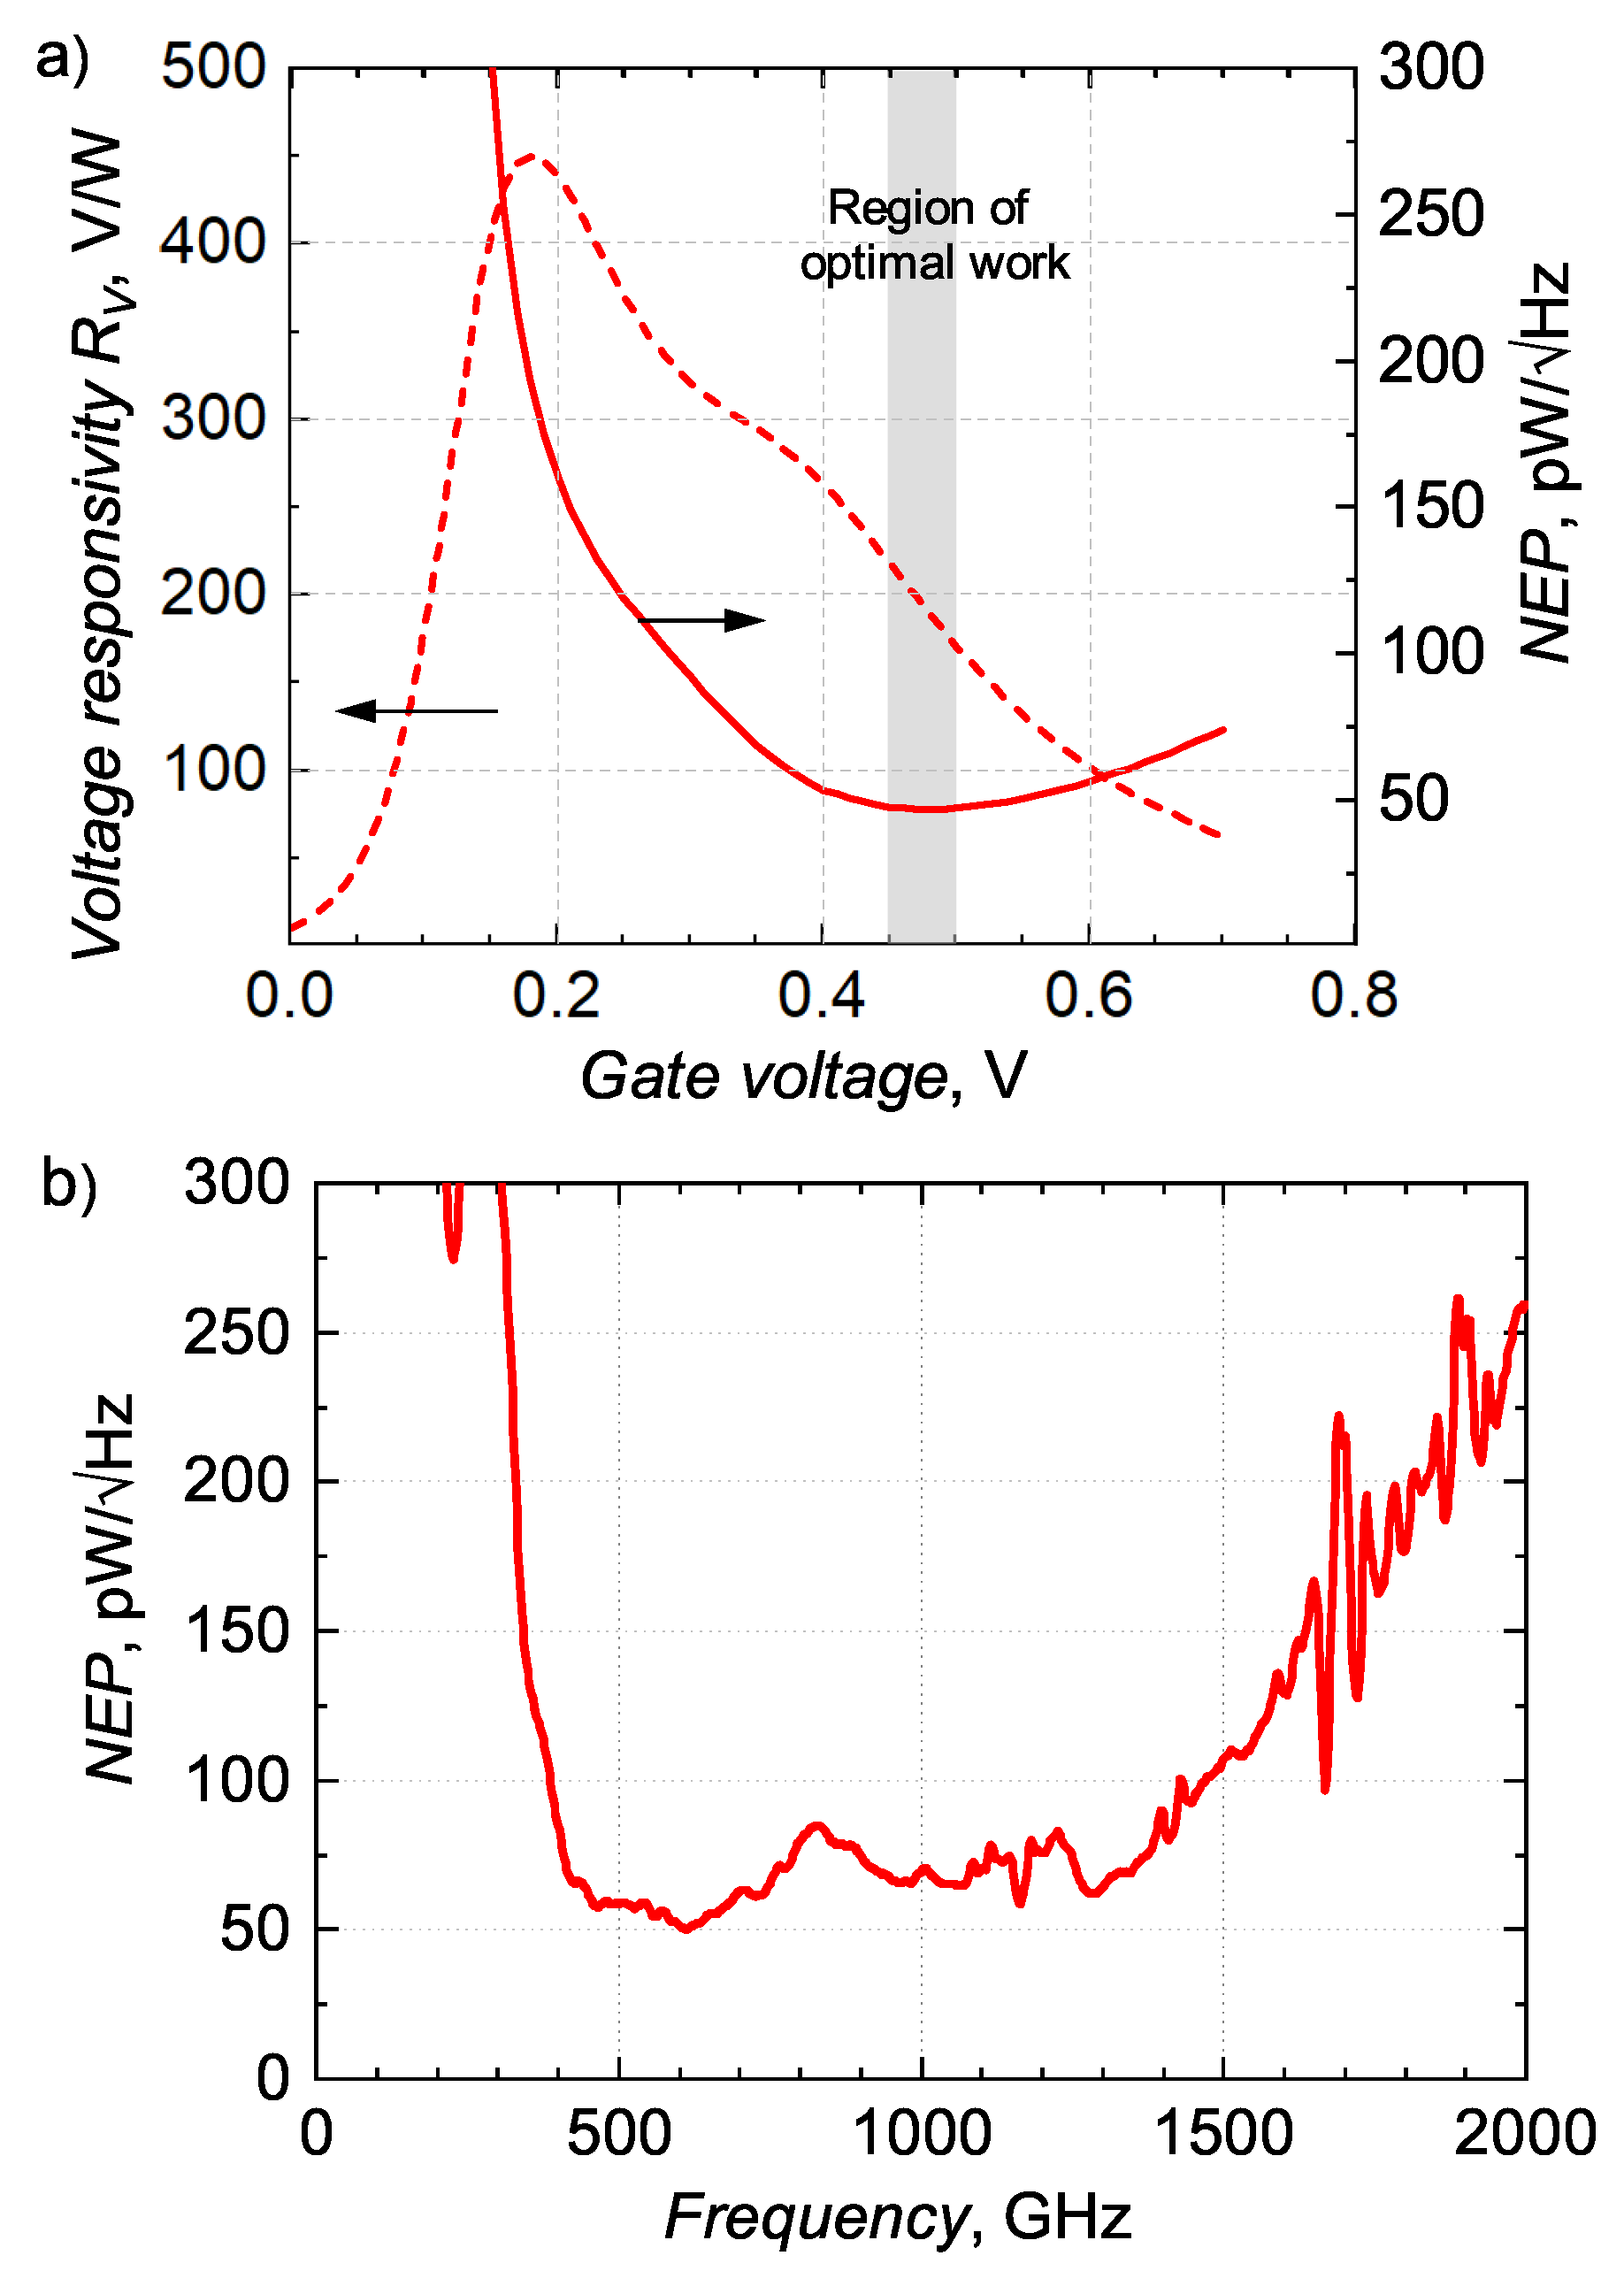
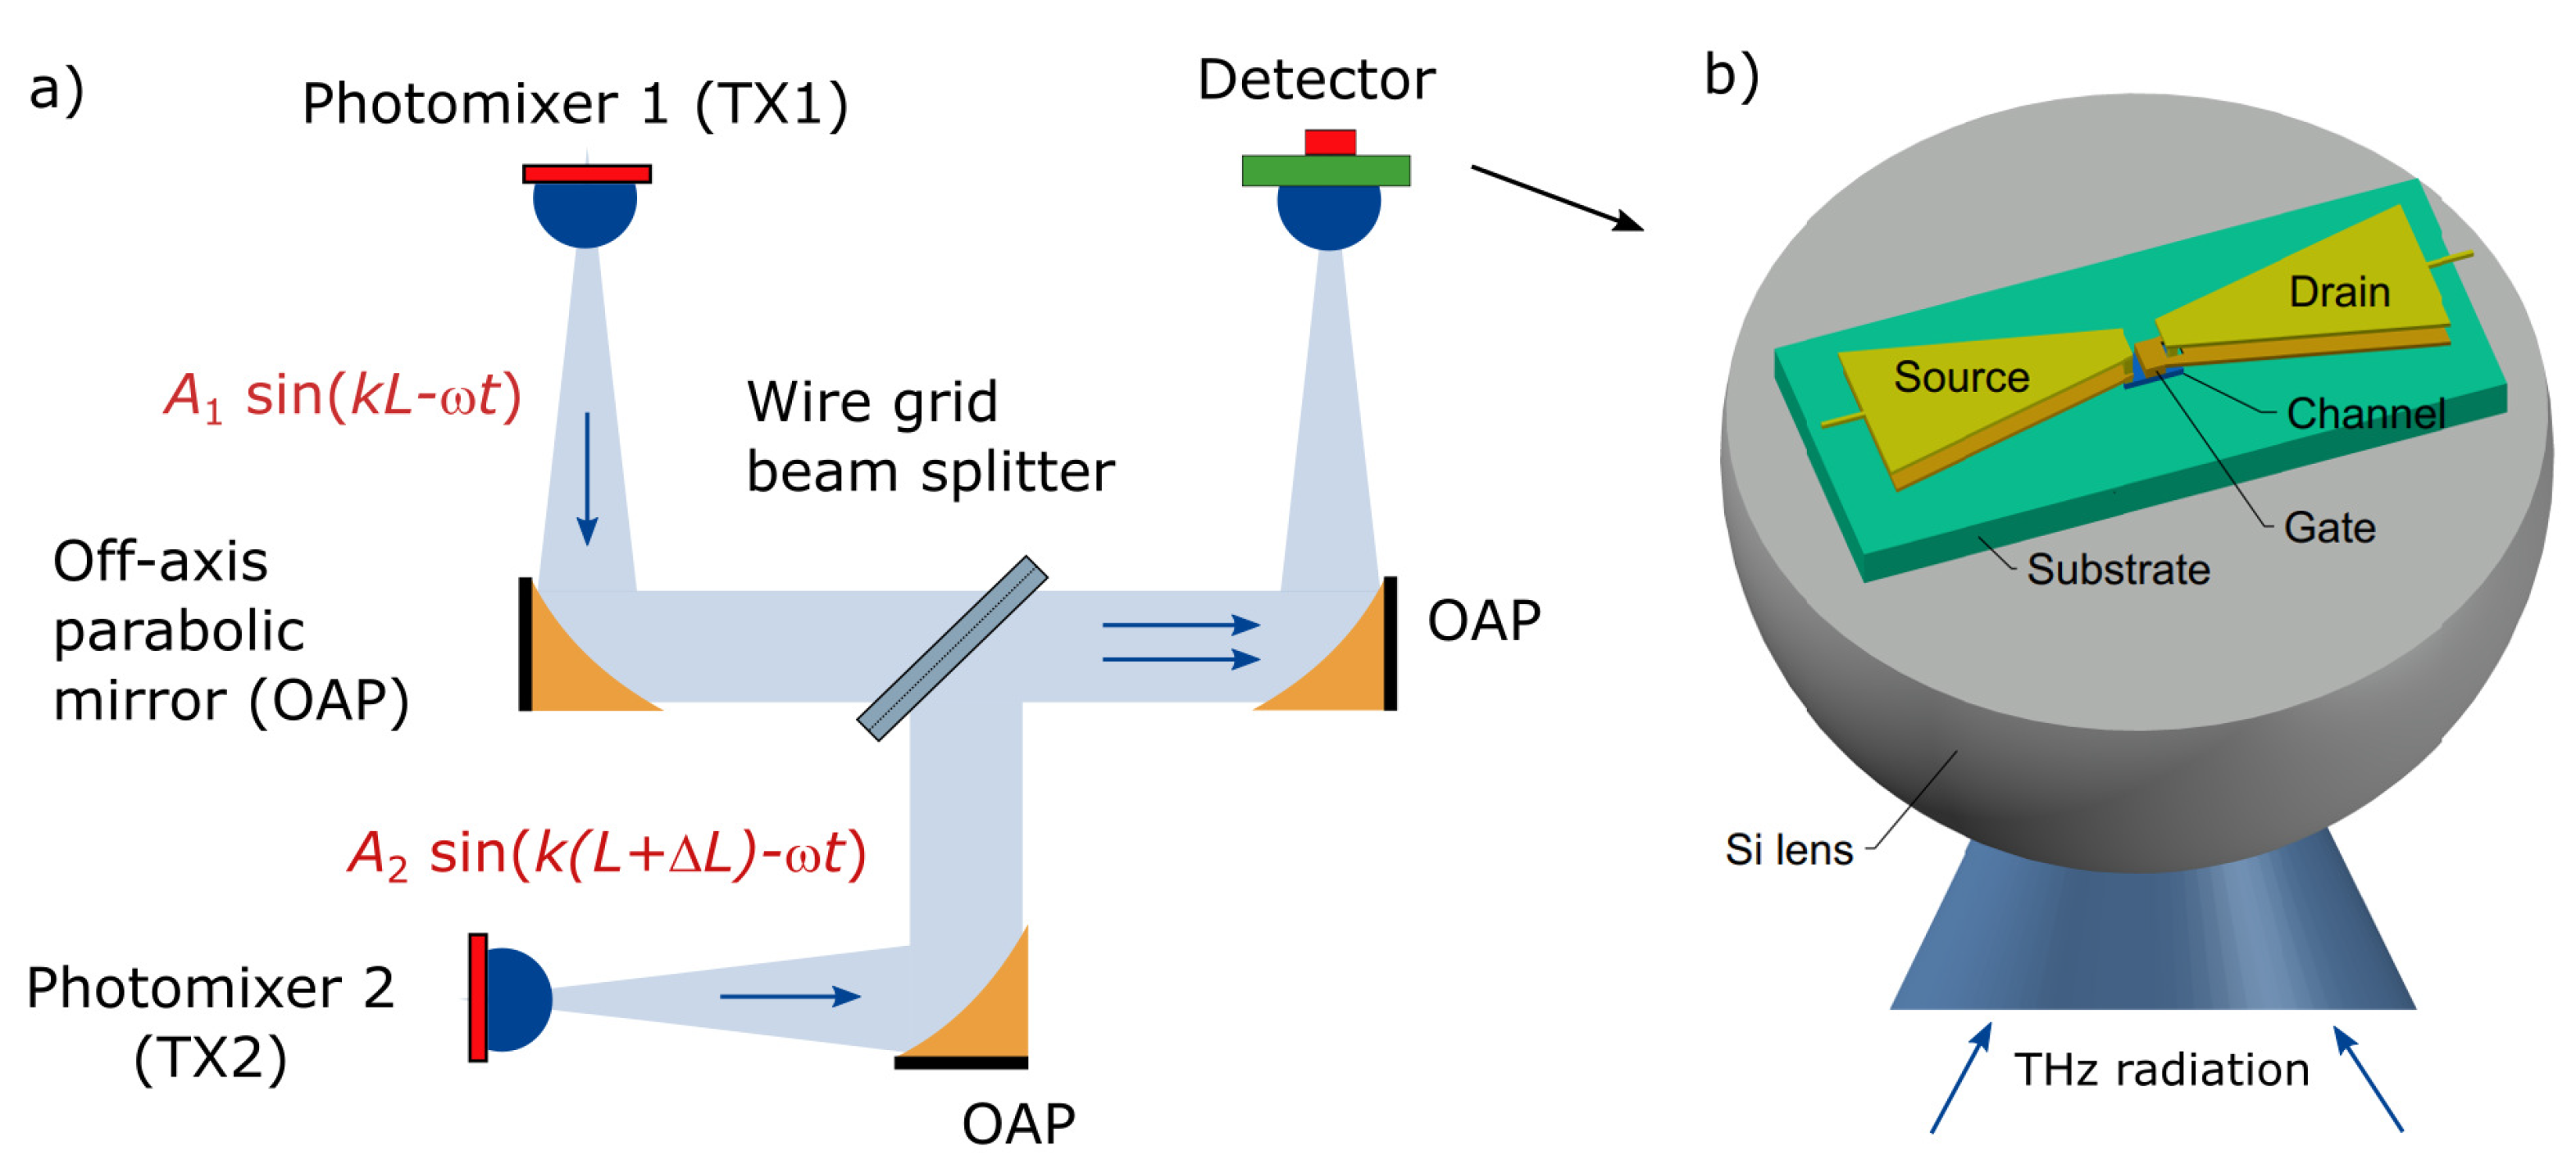
2. Si CMOS Detector
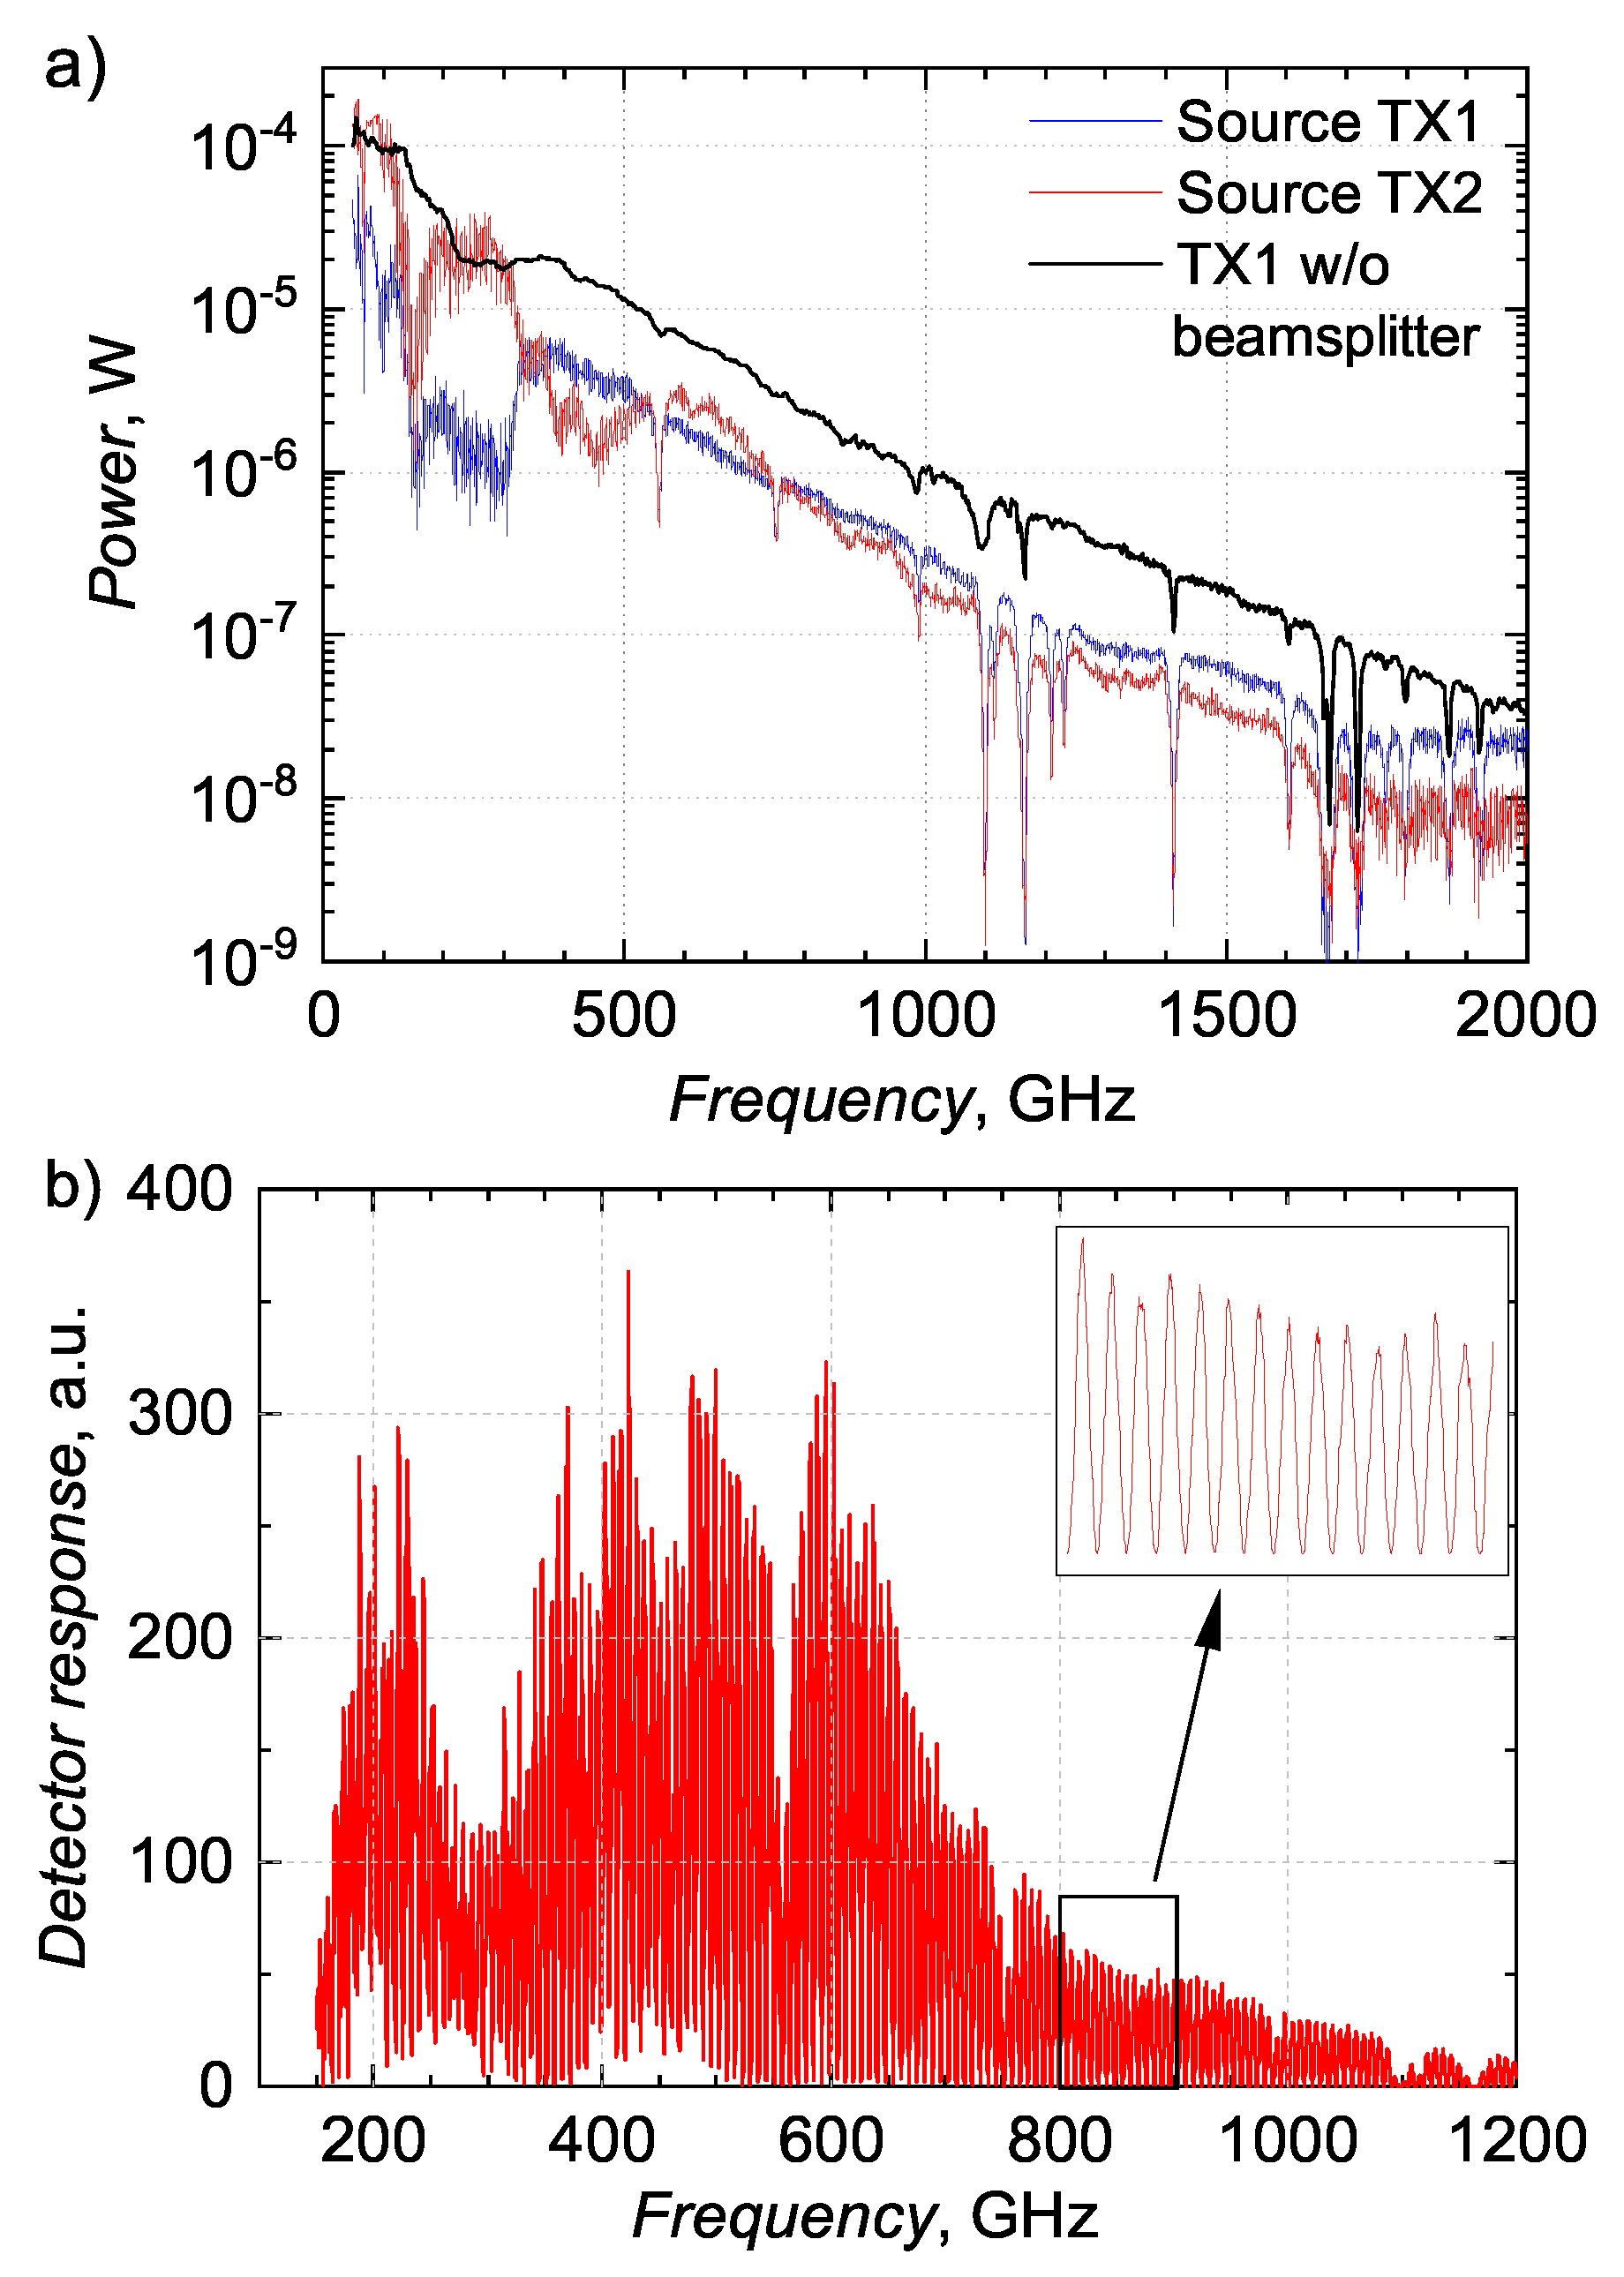
3. Experiment Setup for Homodyne Detection
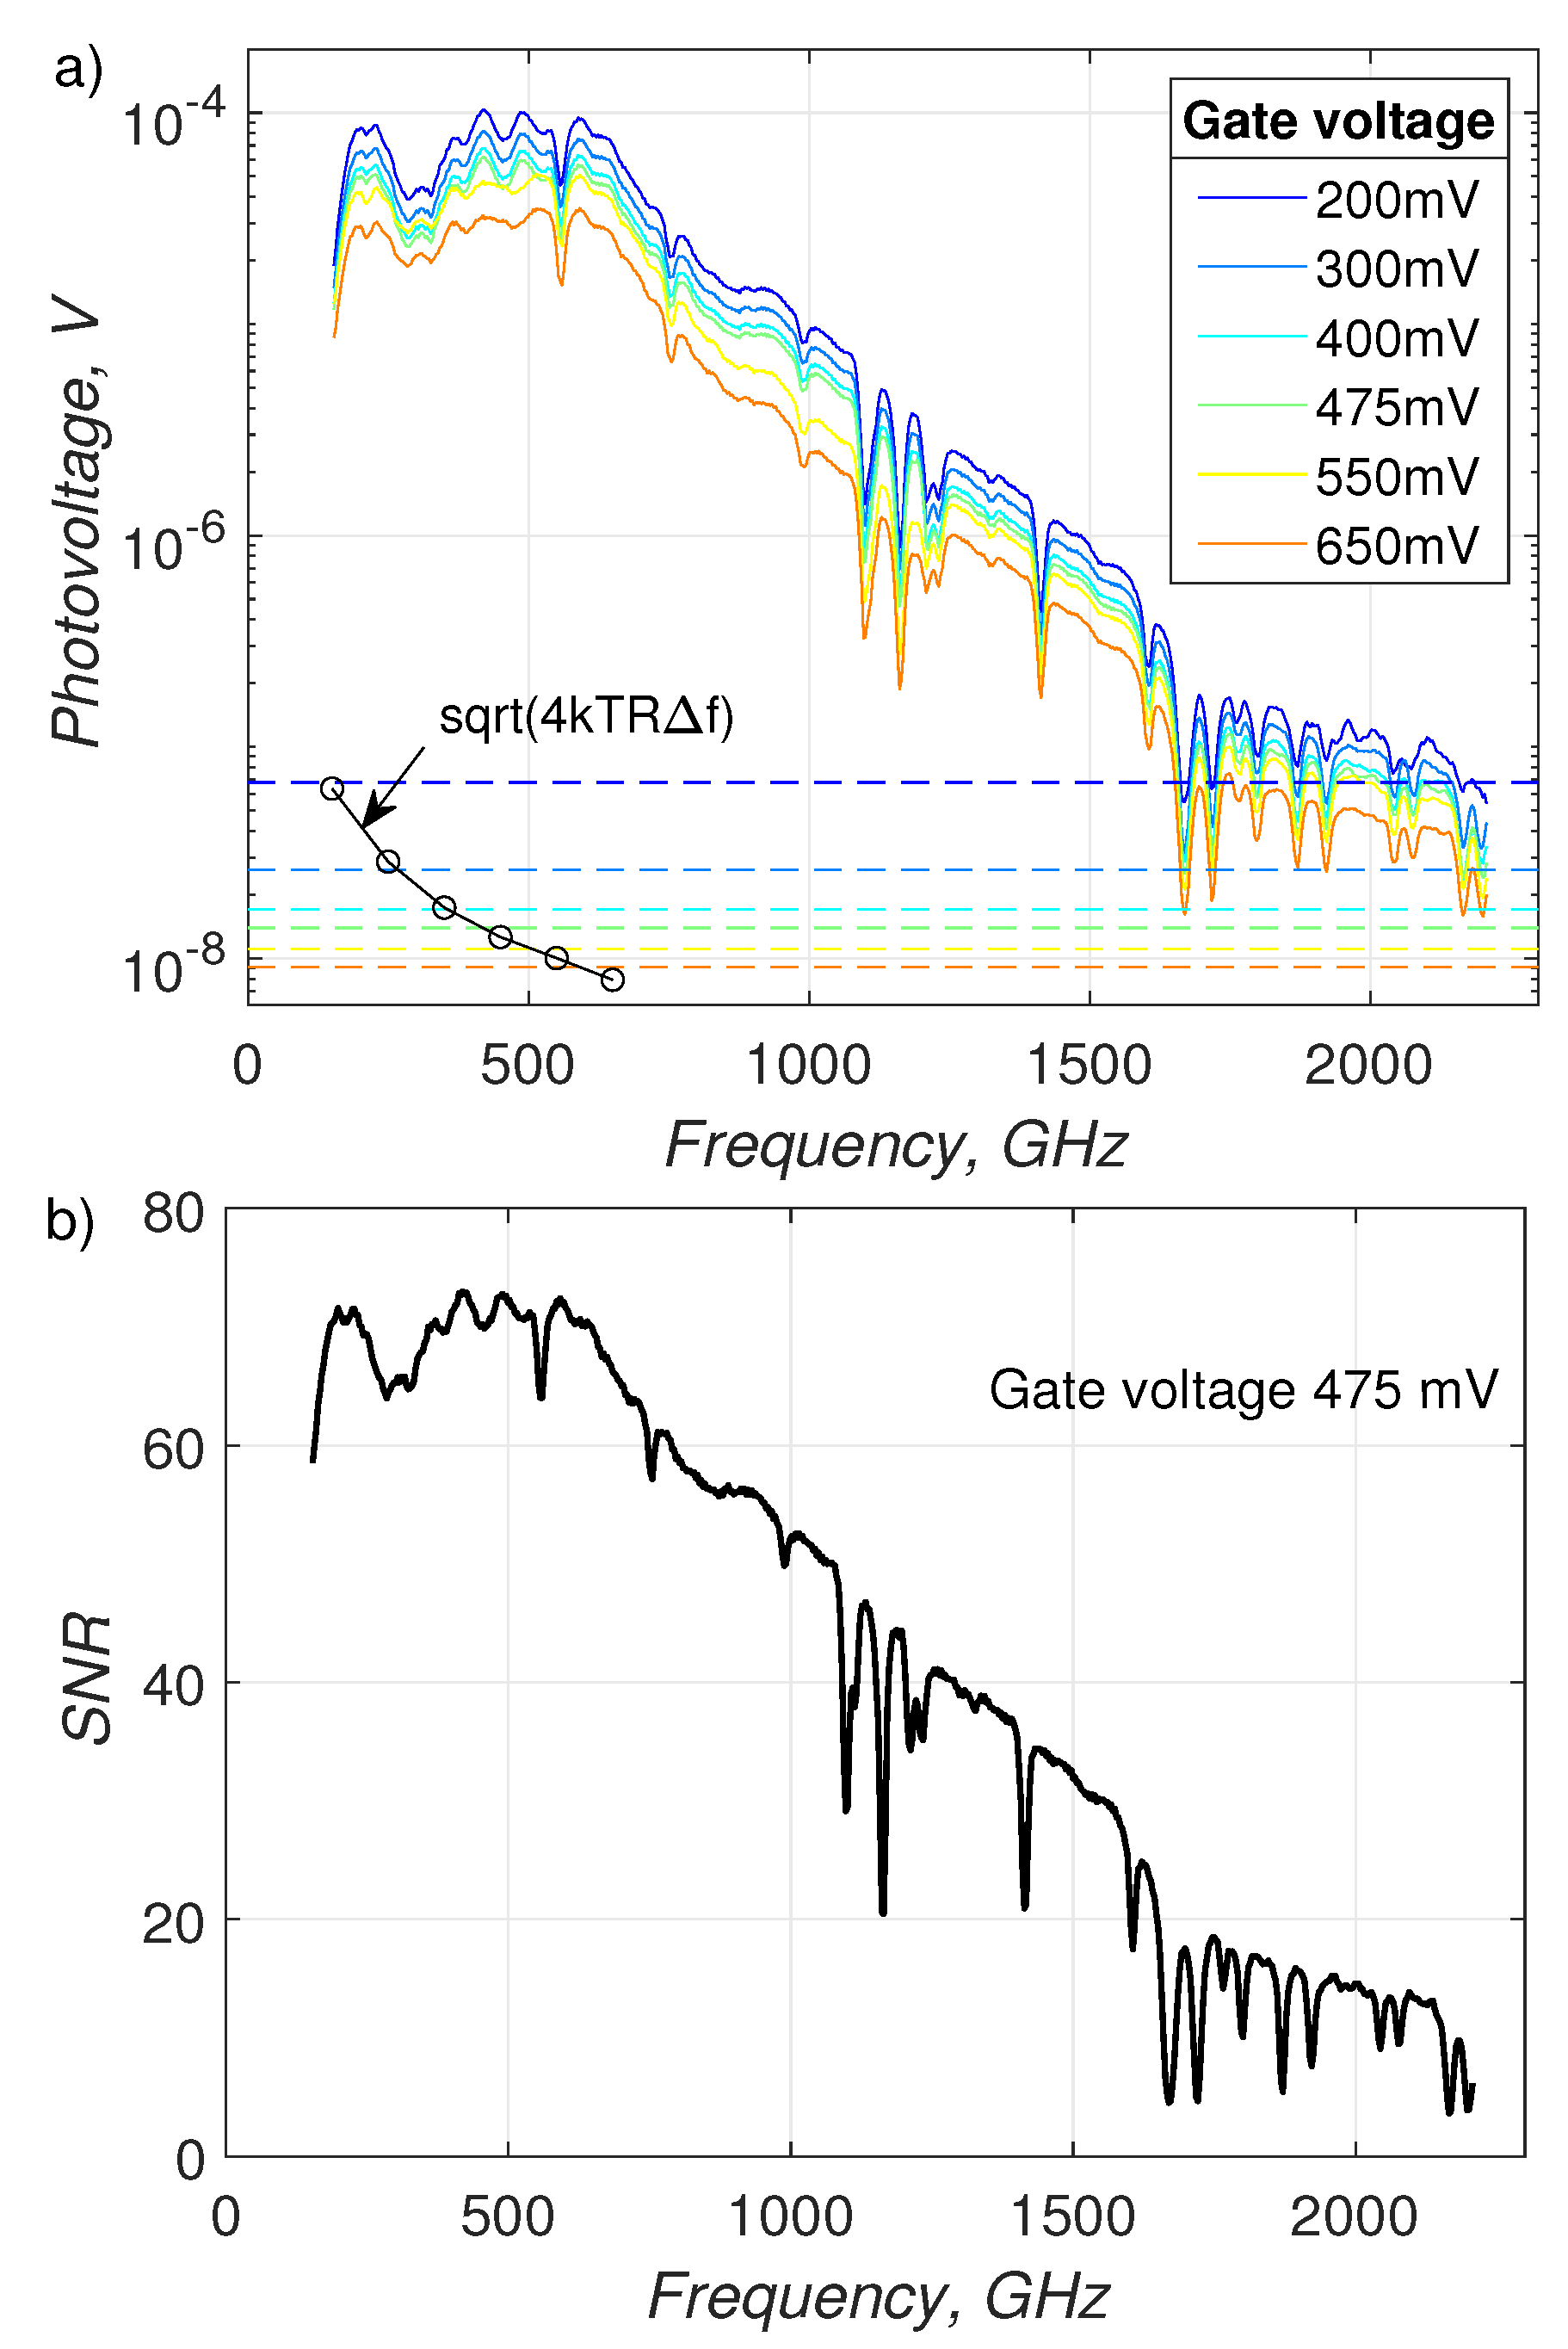
4. Results and Discussions
5. Conclusions
Author Contributions
Funding
Institutional Review Board Statement
Informed Consent Statement
Data Availability Statement
Acknowledgments
Conflicts of Interest
Abbreviations
| THz | terahertz |
| FET | field-effect transistor |
| TeraFET | field-effect transistor with integrated antennas for THz detection |
| CMOS | complementary metal-oxide-semiconductor |
| Si | silicon |
| NEP | noise-equivalent power |
| SNR | signal-to-noise ratio |
References
- Sasaki, T.; Sakamoto, T.; Otsuka, M. Detection of Impurities in Organic Crystals by High-Accuracy Terahertz Absorption Spectroscopy. Anal. Chem. 2018, 90, 1677–1682. [Google Scholar] [CrossRef] [PubMed]
- Palka, N.; Szala, M.; Czerwinska, E. Characterization of prospective explosive materials using terahertz time-domain spectroscopy. Appl. Opt. 2016, 55, 4575–4583. [Google Scholar] [CrossRef] [PubMed]
- Federici, J.; Schulkin, B.; Huang, F.; Gary, D.; Barat, R.; Oliveira, F.; Zimdars, D. THz imaging and sensing for security applications—Explosives, weapons and drugs. Semicond. Sci. Technol. 2005, 20, S266–S280. [Google Scholar] [CrossRef]
- Danciu, M.; Alexa-Stratulat, T.; Stefanescu, C.; Dodi, G.; Tamba, B.I.; Mihai, C.T.; Stanciu, G.D.; Luca, A.; Spiridon, I.A.; Ungureanu, L.B.; et al. Terahertz Spectroscopy and Imaging: A Cutting-Edge Method for Diagnosing Digestive Cancers. Materials 2019, 12, 1519. [Google Scholar] [CrossRef] [PubMed] [Green Version]
- Bauer, M.; Döring, M.; Degenhardt, U.; Friederich, F. Terahertz Inspection of the Joining Quality of Industrial Silicon Carbide Ceramics. In Proceedings of the 2019 44th International Conference on Infrared, Millimeter, and Terahertz Waves (IRMMW-THz), Paris, France, 1–6 September 2019; pp. 1–2. [Google Scholar]
- Lloyd-Hughes, J. Terahertz spectroscopy of quantum 2D electron systems. J. Phys. D Appl. Phys. 2014, 47, 374006. [Google Scholar] [CrossRef]
- Richter, H.; Wienold, M.; Schrottke, L.; Biermann, K.; Grahn, H.T.; Hübers, H.W. 4.7-THz Local Oscillator for the GREAT Heterodyne Spectrometer on SOFIA. IEEE Trans. Terahertz Sci. Technol. 2015, 5, 539–545. [Google Scholar] [CrossRef]
- Jackson, J.B.; Bowen, J.; Walker, G.; Labaune, J.; Mourou, G.; Menu, M.; Fukunaga, K. A Survey of Terahertz Applications in Cultural Heritage Conservation Science. IEEE Trans. Terahertz Sci. Technol. 2011, 1, 220–231. [Google Scholar] [CrossRef]
- Tonouchi, M. Cutting-edge terahertz technology. Nat. Photonics 2007, 1, 97–105. [Google Scholar] [CrossRef]
- Nagatsuma, T. Terahertz technologies: Present and future. IEICE Electron. Express 2011, 8, 1127–1142. [Google Scholar] [CrossRef] [Green Version]
- Jepsen, P.; Cooke, D.; Koch, M. Terahertz spectroscopy and imaging—Modern techniques and applications. Laser Photonics Rev. 2011, 5, 124–166. [Google Scholar] [CrossRef]
- Deninger, A.J.; Roggenbuck, A.; Schindler, S.; Preu, S. 2.75 THz tuning with a triple-DFB laser system at 1550 nm and InGaAs photomixers. J. Infrared Millim. Terahertz Waves 2015, 36, 269–277. [Google Scholar] [CrossRef] [Green Version]
- Rettich, F.; Vieweg, N.; Cojocari, O.; Deninger, A. Field Intensity Detection of Individual Terahertz Pulses at 80 MHz Repetition Rate. J. Infrared Millim. Terahertz Waves 2015, 36, 607–612. [Google Scholar] [CrossRef] [Green Version]
- Ikamas, K.; Lisauskas, A.; Massabeau, S.; Bauer, M.; Burakevič, M.; Vyšniauskas, J.; Čibiraitė, D.; Krozer, V.; Rämer, A.; Shevchenko, S.; et al. Sub-Picosecond Pulsed THz FET Detector Characterization in Plasmonic Detection Regime Based on Autocorrelation Technique. Semicond. Sci. Technol. 2018, 33, 124013. [Google Scholar] [CrossRef]
- Ikamas, K.; Nevinskas, I.; Krotkus, A.; Lisauskas, A. Silicon Field Effect Transistor as the Nonlinear Detector for Terahertz Autocorellators. Sensors 2018, 18, 3735. [Google Scholar] [CrossRef] [Green Version]
- Martín-Mateos, P.; Čibiraitė-Lukenskienė, D.; Barreiro, R.; de Dios, C.; Lisauskas, A.; Krozer, V.; Acedo, P. Hyperspectral Terahertz Imaging with Electro-Optic Dual Combs and a FET-Based Detector. Sci. Rep. 2020, 10, 14429. [Google Scholar] [CrossRef]
- Schoenherr, D.; Cojocari, O.; Sydlo, C.; Goebel, T.; Feiginov, M.; Hartnagel, H.L.; Meissner, P. Optical mixing in THz Schottky diodes. In Proceedings of the 2008 33rd International Conference on Infrared, Millimeter and Terahertz Waves, Pasadena, CA, USA, 15–19 September 2008; pp. 1–2. [Google Scholar]
- Jokubauskis, D.; Minkevičius, L.; Seliuta, D.; Kašalynas, I.; Valušis, G. Terahertz Homodyne Spectroscopic Imaging of Concealed Low-Absorbing Objects. Opt. Eng. 2019, 58, 023104. [Google Scholar] [CrossRef]
- Zdanevičius, J.; Čibiraitė, D.; Ikamas, K.; Bauer, M.; Matukas, J.; Lisauskas, A.; Richter, H.; Hagelschuer, T.; Krozer, V.; Hubers, H.W.; et al. Field-Effect Transistor Based Detectors for Power Monitoring of THz Quantum Cascade Lasers. IEEE Trans. Terahertz Sci. Technol. 2018, 8, 613–621. [Google Scholar] [CrossRef]
- Bauer, M.; Rämer, A.; Chevtchenko, S.A.; Osipov, K.Y.; Čibiraitė, D.; Pralgauskaitė, S.; Ikamas, K.; Lisauskas, A.; Heinrich, W.; Krozer, V.; et al. A high-sensitivity AlGaN/GaN HEMT Terahertz Detector with Integrated Broadband Bow-tie Antenna. IEEE Trans. Terahertz Sci. Technol. 2019, 9, 430–444. [Google Scholar] [CrossRef]
- Ikamas, K.; Čibiraitė, D.; Lisauskas, A.; Bauer, M.; Krozer, V.; Roskos, H.G. Broadband Terahertz Power Detectors Based on 90-Nm Silicon CMOS Transistors with Flat Responsivity up to 2.2 THz. IEEE Electron. Device Lett. 2018, 39, 1413–1416. [Google Scholar] [CrossRef]
- Veksler, D.; Muravjov, A.; Stillman, W.; Pala, N.; Shur, M. Detection and Homodyne Mixing of Terahertz Gas Laser Radiation by Submicron GaAs/AlGaAs FETs. In Proceedings of the SENSORS, 2007 IEEE, Atlanta, GA, USA, 28–31 October 2007; pp. 443–445. [Google Scholar] [CrossRef]
- Preu, S.; Kim, S.; Verma, R.; Burke, P.G.; Vinh, N.Q.; Sherwin, M.S.; Gossard, A.C. Terahertz Detection by a Homodyne Field Effect Transistor Multiplicative Mixer. IEEE Trans. Terahertz Sci. Technol. 2012, 2, 278–283. [Google Scholar] [CrossRef]
- Preu, S.; Regensburger, S.; Kim, S.; Mittendorff, M.; Winnerl, S.; Malzer, S.; Lu, H.; Burke, P.G.; Gossard, A.C.; Weber, H.B.; et al. Broadband THz detection and homodyne mixing using GaAs high-electron-mobility transistor rectifiers. In Millimetre Wave and Terahertz Sensors and Technology VI; Salmon, N.A., Jacobs, E.L., Eds.; International Society for Optics and Photonics, SPIE: Bellingham, WA, USA, 2013; Volume 8900, pp. 137–145. [Google Scholar] [CrossRef]
- Rumyantsev, S.; Liu, X.; Kachorovskii, V.; Shur, M. Homodyne phase sensitive terahertz spectrometer. Appl. Phys. Lett. 2017, 111, 121105. [Google Scholar] [CrossRef]
- Knap, W.; Dyakonov, M.; Coquillat, D.; Teppe, F.; Dyakonova, N.; Łusakowski, J.; Karpierz, K.; Sakowicz, M.; Valusis, G.; Seliuta, D.; et al. Field Effect Transistors for Terahertz Detection: Physics and First Imaging Applications. J. Infrared Millimeter Terahertz Waves 2009, 30, 1319–1337. [Google Scholar] [CrossRef] [Green Version]
- Dyakonov, M.; Shur, M. Detection, mixing, and frequency multiplication of terahertz radiation by two-dimensional electronic fluid. IEEE Trans. Electron. Dev. 1996, 43, 380–387. [Google Scholar] [CrossRef]
- Lisauskas, A.; Pfeiffer, U.; Öjefors, E.; Haring Bolìvar, P.; Glaab, D.; Roskos, H.G. Rational design of high-responsivity detectors of terahertz radiation based on distributed self-mixing in silicon field-effect transistors. J. Appl. Phys. 2009, 105, 114511. [Google Scholar] [CrossRef]
- Boppel, S.; Ragauskas, M.; Hajo, A.; Bauer, M.; Lisauskas, A.; Chevtchenko, S.; Rämer, A.; Kašalynas, I.; Valušis, G.; Würfl, H.J.; et al. 0.25-um GaN TeraFETs Optimized as THz Power Detectors and Intensity-Gradient Sensors. IEEE Trans. Terahertz Sci. Technol. 2016, 6, 348–350. [Google Scholar] [CrossRef]
- Bauer, M.; Rämer, A.; Boppel, S.; Chevtchenko, S.; Lisauskas, A.; Heinrich, W.; Krozer, V.; Roskos, H.G. High-sensitivity wideband THz detectors based on GaN HEMTs with integrated bow-tie antennas. In Proceedings of the 10th European Microwave Integrated Circuits Conference (EuMIC), Paris, France, 7–8 September 2015; pp. 1–4. [Google Scholar] [CrossRef]
- Nellen, S.; Ishibashi, T.; Deninger, A.; Kohlhaas, R.B.; Liebermeister, L.; Schell, M.; Globisch, B. Experimental Comparison of UTC- and PIN-Photodiodes for Continuous-Wave Terahertz Generation. J. Infrared Millimeter Terahertz Waves 2020, 41, 343–354. [Google Scholar] [CrossRef] [Green Version]
- Müller, R.; Bohmeyer, W.; Kehrt, M.; Lange, K.; Monte, C.; Steiger, A. Novel detectors for traceable THz power measurements. J. Infrared Millimeter Terahertz Waves 2014, 35, 659–670. [Google Scholar] [CrossRef] [Green Version]
- But, D.B.; Drexler, C.; Sakhno, M.V.; Dyakonova, N.; Drachenko, O.; Sizov, F.F.; Gutin, A.; Ganichev, S.D.; Knap, W. Nonlinear photoresponse of field effect transistors terahertz detectors at high irradiation intensities. J. Appl. Phys. 2014, 115, 164514. [Google Scholar] [CrossRef]
- Rudin, S.; Rupper, G.; Shur, M. Ultimate response time of high electron mobility transistors. J. Appl. Phys. 2015, 117, 174502. [Google Scholar] [CrossRef]
- Sun, J.D.; Sun, Y.F.; Wu, D.M.; Cai, Y.; Qin, H.; Zhang, B.S. High-responsivity, low-noise, room-temperature, self-mixing terahertz detector realized using floating antennas on a GaN-based field-effect transistor. Appl. Phys. Lett. 2012, 100, 013506. [Google Scholar] [CrossRef]
- Čibiraitė, D.; Bauer, M.; Lisauskas, A.; Krozer, V.; Roskos, H.G.; Ramer, A.; Krozer, V.; Heinrich, W.; Pralgauskaite, S.; Zdanevicius, J.; et al. Thermal Noise-Limited Sensitivity of FET-Based Terahertz Detectors. In Proceedings of the 2017 International Conference on Noise and Fluctuations (ICNF), Vilnius, Lithuania, 20–23 June 2017; pp. 1–4. [Google Scholar] [CrossRef]
- Qin, H.; Li, X.; Sun, J.; Zhang, Z.; Sun, Y.; Yu, Y.; Li, X.; Luo, M. Detection of incoherent terahertz light using antenna-coupled high-electron-mobility field-effect transistors. Appl. Phys. Lett. 2017, 110, 171109. [Google Scholar] [CrossRef] [Green Version]
- Čibiraitė-Lukenskienė, D.; Ikamas, K.; Lisauskas, T.; Krozer, V.; Roskos, H.G.; Lisauskas, A. Passive Detection and Imaging of Human Body Radiation Using an Uncooled Field-Effect Transistor-Based THz Detector. Sensors 2020, 20, 4087. [Google Scholar] [CrossRef] [PubMed]
- Yahyapour, M.; Vieweg, N.; Roggenbuck, A.; Rettich, F.; Cojocari, O.; Deninger, A. A Flexible Phase-Insensitive System for Broadband CW-Terahertz Spectroscopy and Imaging. IEEE Trans. Terahertz Sci. Technol. 2016, 6, 670–673. [Google Scholar] [CrossRef]


Publisher’s Note: MDPI stays neutral with regard to jurisdictional claims in published maps and institutional affiliations. |
© 2021 by the authors. Licensee MDPI, Basel, Switzerland. This article is an open access article distributed under the terms and conditions of the Creative Commons Attribution (CC BY) license (http://creativecommons.org/licenses/by/4.0/).
Share and Cite
Ikamas, K.; But, D.B.; Lisauskas, A. Homodyne Spectroscopy with Broadband Terahertz Power Detector Based on 90-nm Silicon CMOS Transistor. Appl. Sci. 2021, 11, 412. https://doi.org/10.3390/app11010412
Ikamas K, But DB, Lisauskas A. Homodyne Spectroscopy with Broadband Terahertz Power Detector Based on 90-nm Silicon CMOS Transistor. Applied Sciences. 2021; 11(1):412. https://doi.org/10.3390/app11010412
Chicago/Turabian StyleIkamas, Kęstutis, Dmytro B. But, and Alvydas Lisauskas. 2021. "Homodyne Spectroscopy with Broadband Terahertz Power Detector Based on 90-nm Silicon CMOS Transistor" Applied Sciences 11, no. 1: 412. https://doi.org/10.3390/app11010412