Article

Flow Stress Modelling and 3D Processing Maps of Al4.5Zn4.5Mg1Cu0.12Zr Alloy with Different Scandium Contents

by
Maxim G. Khomutov
*,
Andrey V. Pozdniakov
,
Alexander Yu. Churyumov
,
Ruslan Yu. Barkov
,
Alexey N. Solonin
and
Maria V. Glavatskikh
Department of Physical Metallurgy of Non-Ferrous Metals, National University of Science and Technology “MISiS”, Leninsky Prospekt 4, 119049 Moscow, Russia
*
Author to whom correspondence should be addressed.
Appl. Sci. 2021, 11(10), 4587; https://doi.org/10.3390/app11104587
Submission received: 29 April 2021 / Revised: 13 May 2021 / Accepted: 14 May 2021 / Published: 18 May 2021
(This article belongs to the Special Issue Metal Forming)

Abstract

:

Featured Application

The constructed models may have potential application for the development of optimal hot deformation technologies of Al-Zn-Mg-Cu alloys.

Abstract

The hot deformation behaviour of an Al4.5Zn4.5Mg1Cu0.12Zr based alloy with 0.05, 0.1 and 0.15% Sc was investigated at temperatures between 300–450 °C and a strain rate of 0.1–15 s−1. The materials constants of a flow stress model based on the Zener-Hollomon parameter were determined (AARE was 5.8%). Three-dimensional processing maps were established by combining power dissipation efficiency and flow stability diagrams. Based on processing maps analysis and microstructures investigations, the optimal deformation parameters were determined as a temperature range of 350–400 °C and strain rates of 0.1–1 s−1 for the alloys with 0.05% and 0.1% Sc, and 0.1 s−1 for the alloy with 0.15% Sc.

1. Introduction

High strength aluminium alloys of the 7XXX series (Al-Zn-Mg system) are widely used in aerospace, aircraft and automotive industries as structural materials [1,2,3]. The maximum strength of these alloys is achieved after quenching and ageing with a Zn/Mg concentration content of more than 1.0, but the corrosion resistance of this group of alloys is low [4,5]. A Zn/Mg ratio of ~1.0 or less [6] and a (Zn+Cu)/Mg ratio below 1.5 [7] provides a better combination of mechanical, corrosion and technological properties. Moreover, it is well known that minor additions of transition metals, such as Sc and Zr, to Al-Zn-Mg system-based alloys can improve mechanical and corrosion resistance properties [8,9,10,11,12]. Coherent Al3(Sc,Zr) dispersoids formed during ageing from an aluminium solid solution (after rapid solidification) with an L12-structure refine the microstructure and increase the recrystallisation temperature; therefore, the microstructure remains nonrecrystallised and mechanical properties remain strong up to elevated temperatures [13,14,15,16,17]. Due to the above, study of the hot deformation behaviour of aluminium alloys containing Al3(Sc,Zr) dispersoids is an urgent task.
Optimal technological parameters of hot deformation are important for the successful manufacture of the materials and the formation of a fine microstructure containing a minimum number of defects. Flow stress modelling and processing maps for different materials are widely used for selecting optimal parameters [18,19,20,21]. This approach was demonstrated for aluminium alloys over a wide range of strain rates and temperatures: 7075 [22], 6063 [23], 2014 [24], 5182 [25], 7085 [26], 5052 [27], and others. The models’ parameters are strictly dependent on the chemical composition of the different types of materials, such as steel [21,28], titanium [29] and aluminium alloys [30], which is why it is necessary to determine the parameters for each composition.
In this work, the influence of Sc content of an Al4.5Zn4.5Mg1Cu0.12Zr alloy on hot deformation behaviour in the range of 300–450 °C deformation temperatures and strain rates of 0.1–15 s−1 was studied and the optimal parameters of deformation were determined using 3D processing maps and microstructure analysis.

2. Materials and Methods

The chemical composition of the investigated Al4.5Zn4.5Mg1Cu0.12Zr alloys with different Sc contents is presented in Table 1. Alloys were prepared in a resistance furnace from pure Al (99.99%), Zn (99.9%), Mg (99.9%), Al-53Cu, Al-3.5Zr and Al-2Sc master alloys. The melt was poured into a water-cooled copper mould (solidification rate was about 15 K/s). Heat treatment of the ingots with a size of 20 × 40 × 120 mm3 was carried out in a Nabertherm N60/85HA furnace (Nabertherm GmbH, Lilienthal, Germany) at 450 °C for 3 h.
A light microscope (LM) Carl Zeiss Axiovert 200M MAT (Carl Zeiss AG, Oberkochen, Germany) and a scanning electron microscope (SEM) TESCAN VEGA 3LMH (Tescan, Brno-Kohoutovice, Czech Republic) equipped with X-ray energy dispersive microanalysis system (Oxford Instruments Advanced AZtecEnergy, High Wycombe, UK) were used for microstructure analysis. Transmission electron microscopy (TEM) images were made using a JEM2100 (Jeol Ltd., Tokyo, Japan) microscope operated at a high voltage of 200 kV.
Compression tests were carried out using a Gleeble 3800 (Dynamic Systems Inc., Poestenkill, NY, USA) thermomechanical simulator. Cylindrical specimens with a size of 10 mm in diameter and 15 mm in height were compressed at a temperature range of 300–450 °C and strain rates of 0.1–15 s−1 at a true strain value 1.0. After deformation, specimens were quenched by compressed air. Stress-strain curves were recalculated to consider friction and adiabatic heating during deformation [31,32]. Three-dimensional processing maps were constructed by B-spline interpolation using OriginLab Software.

3. Results and Discussion

3.1. Initial Microstructure Investigation

The aluminium solid solution and T-phase (AlZnMgCu) of eutectic origin were presented in an as-cast microstructure (Figure 1a). The microstructure after heat treatment consisted of an aluminum solid solution, particles of T-phase of crystallisation origin and secondary precipitates of T-phase and dispersoids of Al3(Sc, Zr) (Figure 1b).

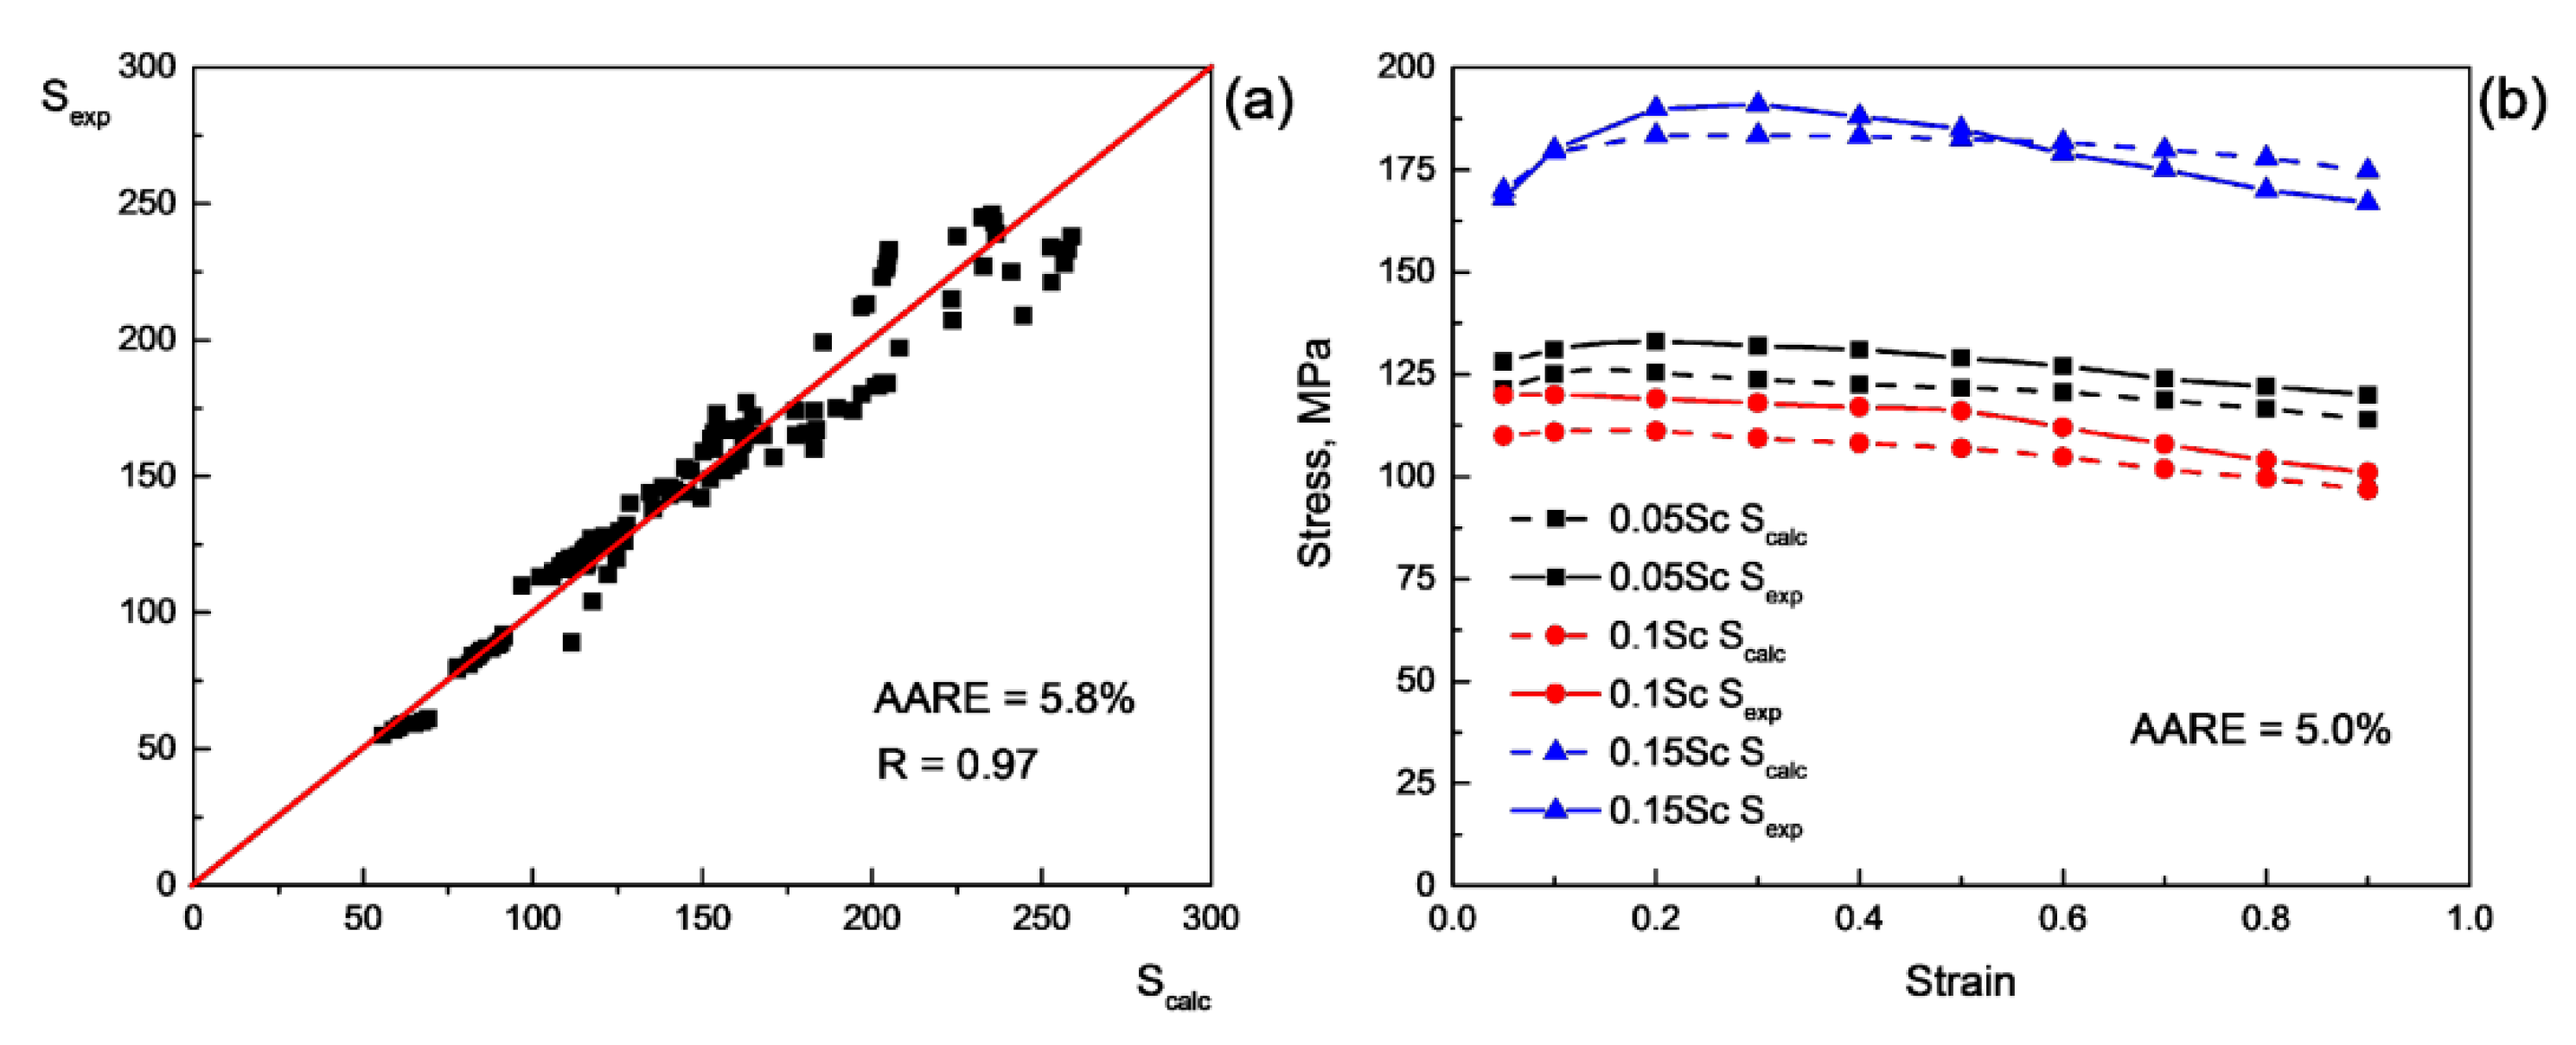
3.2. Hot Deformation Behaviour Modelling

The typical true stress true strain curves of the investigated alloys after compression under different conditions are presented in Figure 2. It can be observed that with an increase in temperature (Figure 2a,c,e), the level of flow stress decreased, and with an increase in strain rate, it increased. Nevertheless, with an increase in the deformation rate, the difference in the level of flow stress decreased (Figure 2b,c,f), which was caused by destruction of the specimens with the accumulation of the degree of strain at a strain rate of 15 s−1. Moreover, in addition to the characteristic stage of stress growth due to strain hardening (SH), the flow curves generally lacked the region characteristic for dynamic recrystallisation (DRX) with softening, and reached the steady-state stage of deformation. This means that the main controlling process of structural evolution during the growth of deformation was dynamic recovery (DRV).
The correlation between the flow stress, strain rate and temperature of hot plastic deformation is described by the Zener-Hollomon parameter Z [33]:
Z = ε ˙ e Q R T
where ε ˙ is the strain rate (s−1), Q is the effective activation energy of hot deformation (J∙mol−1) and R is the universal gas constant (8.314 J∙mol−1∙K−1). The relation between Z and flow stress is usually described by the power function (2) for low stresses, an exponential function (3) for high levels of stress, and a hyperbolic sinus function (4) for all ranges of stress [21,34,35]:
Z = A 1 σ n 1
Z = A 2 e β σ
Z = A 3 [ s i n h ( α σ ) ] n 2
where A1, A2, A3, n1, n2 and β are experimentally-determined parameters. The value of α can be determined as:
α β n 1
The materials constants are presented in Table 2 for the alloys with different Sc content and different strain values. The values of the effective activation energy were in the range of 161–192 kJ·mol−1 for all compositions, which is consistent with the values obtained previously for Al-5.8Zn-2.3Mg-1.5Cu-0.21Cr (168.08 kJ·mol−1) [36], Al-7.3Zn-2.3Mg-0.6Cu-0.3Mn-0.11Er-0.12Zr (189.67 kJ·mol−1) [37] and Al–6.2Zn–0.70Mg–0.30Mn–0.17Zr (181–189.5 kJ·mol−1) [38].
The comparison between experimental and calculated values of stress is shown in Figure 3a. As one can see, the dispersion of the stress values was significantly higher at high values. The accuracy of the strain-compensated model was quantified by additional experiments for the alloys with different Sc content at different temperature-strain rate conditions: 0.05Sc—375 °C and 0.05 s−1; 0.1Sc—425 °C and 1.5 s−1; 0.15Sc—325 °C and 0.8 s−1. The average absolute relative error (AARE) determined accordingly [39] was 5.0% (Figure 3b).

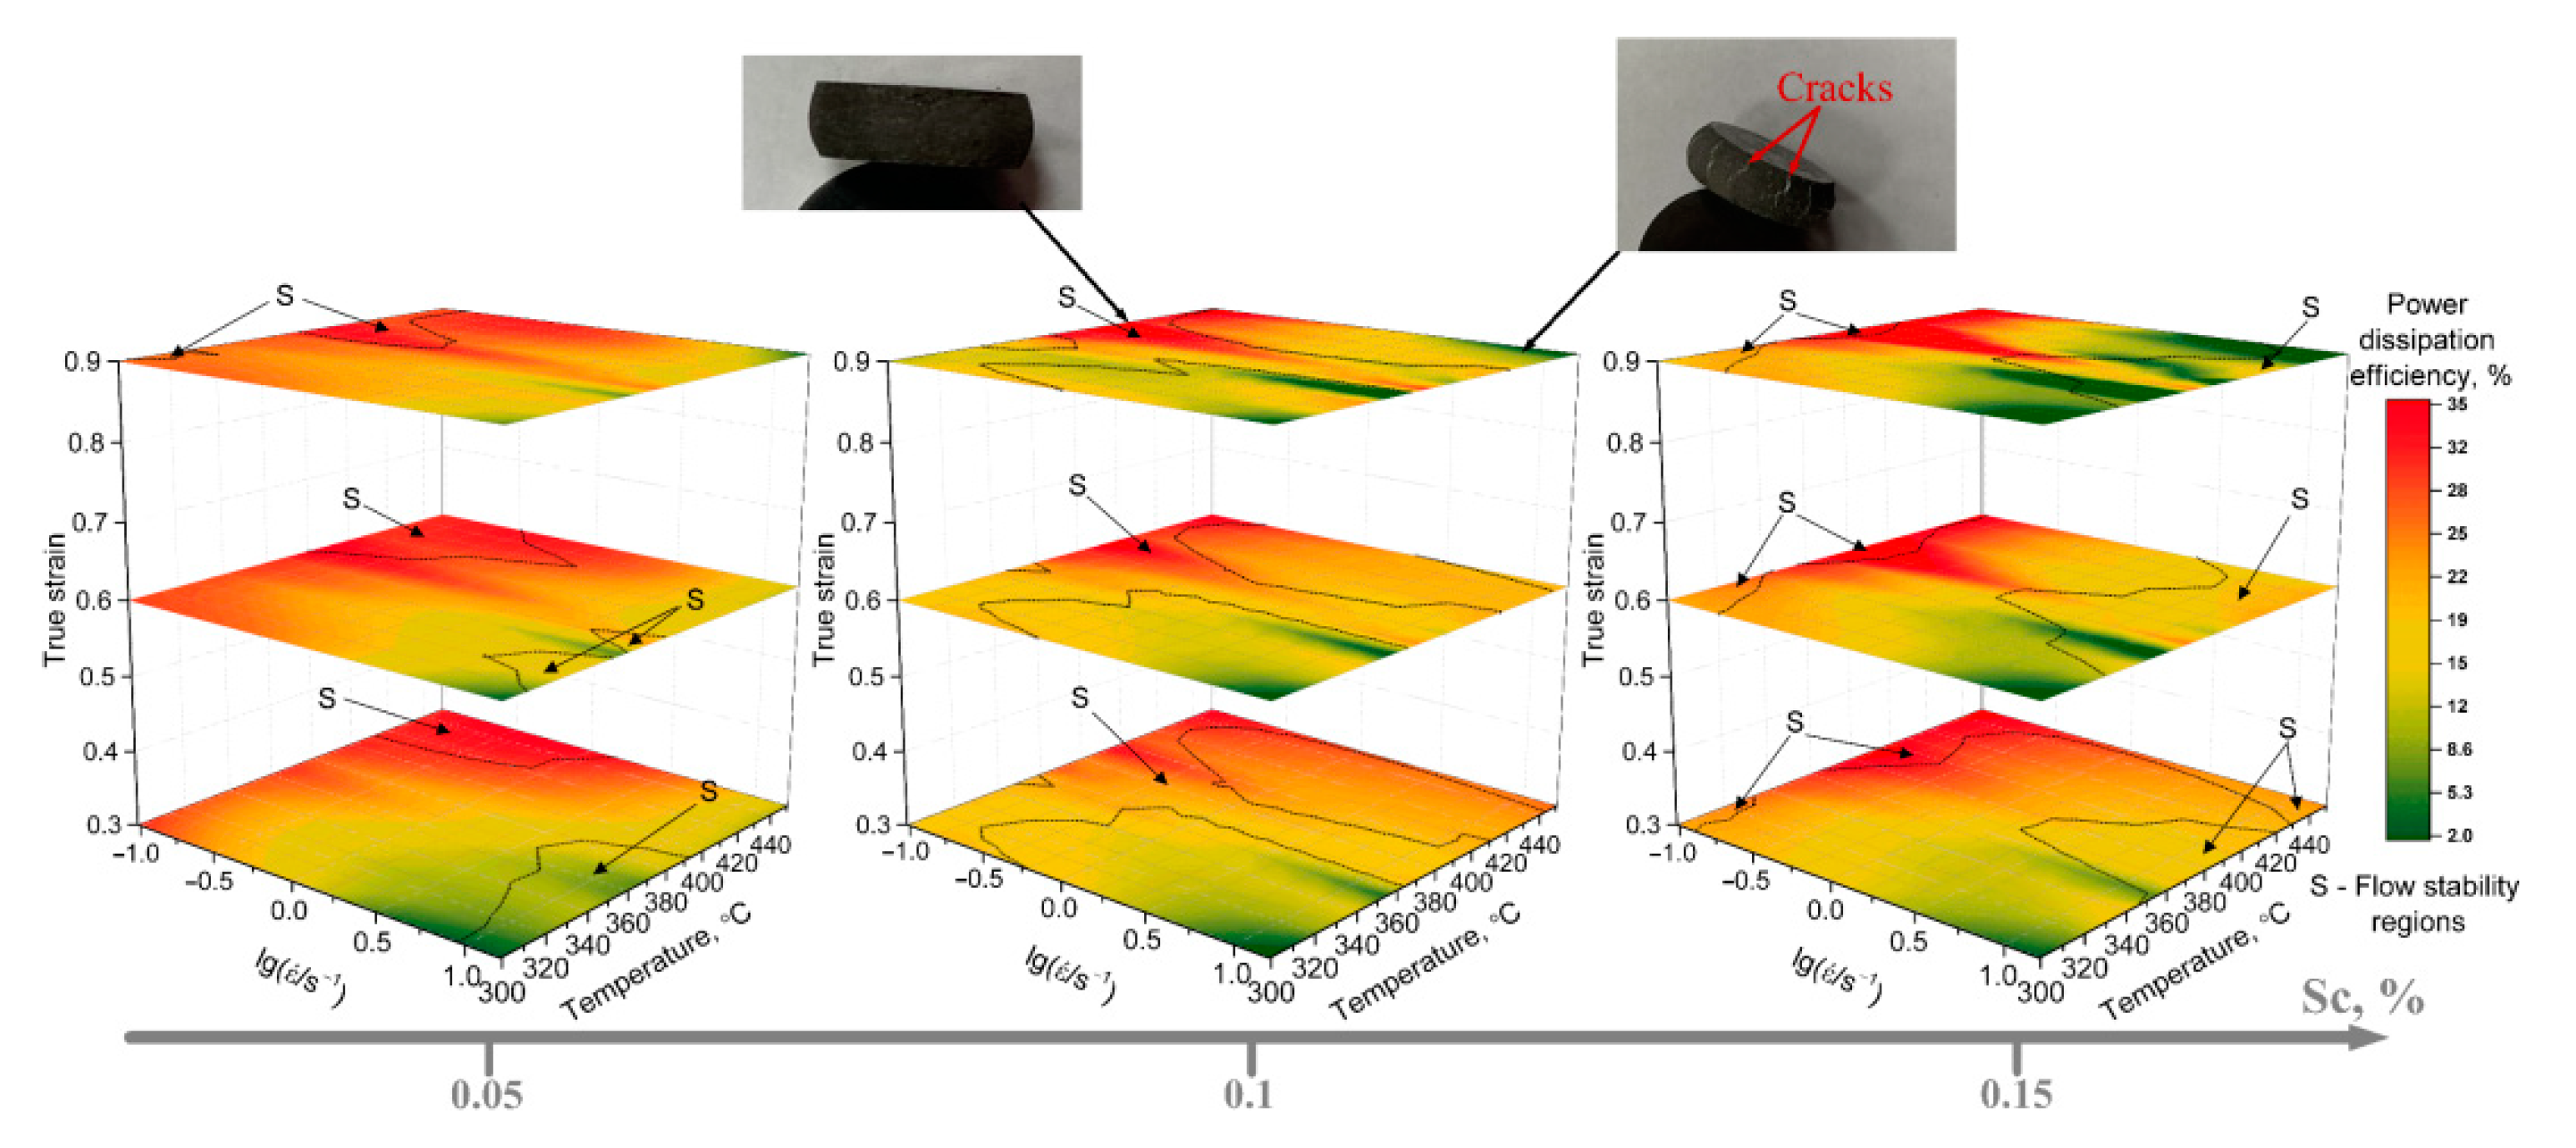
3.3. 3D Processing Maps Establishment

Processing maps are important tools for analysing hot deformation parameters. They are based on the dynamic material model (DMM) [40] and usually established by combining two diagrams: power dissipation and flow instability [18,23,41]. According to DMM, the power dissipated consists of the content term G representing the power dissipated by plastic work (most of it converted into heat), and the cocontent term J (consumed by the evolution of the material microstructure) [40]:
P = σ ε ˙ = G + J = 0 ε ˙ σ d ε ˙ + 0 σ ε ˙ d σ
If temperature and strain are constant, the flow stress is given by
σ = K ε ˙ m
where K is the material constant and m is the strain rate sensitivity factor, which is related to G content and J cocontent [19,42]:
m = J G = ε ˙ σ σ ε ˙ = l n σ l n ε ˙
J co-content can be written as
J = 0 σ ε ˙ d σ = m m + 1 σ ε ˙
The maximum possible dissipation is reached when m = 1, so the J co-content reaches a maximum, which implies Jmax = (σ ε ˙ )/2 = P/2.
The power dissipation efficiency η can be calculated by as [18]:
η = J J m a x = 2 m m + 1
Optimal hot deformation parameters are characterised by higher a dissipation efficiency η and a flow stability ξ P > 0, which is calculated by the following [42]:
ξ P = ln ( m m + 1 ) l n ε ˙ + m > 0
Areas with negative ξ P 0 are characterised by adiabatic shear bands, slip localisation [43] and crack formation based on grain boundary cavitation [32], dynamic strain ageing, kink bands, mechanical twinning and flow rotations [42].
Three-dimensional processing maps were established by combining power dissipation efficiency and flow stability diagrams at different strain values (Figure 4). As one can see, the optimal hot deformation parameter regions are in the field of red regions of power dissipation efficiency and the areas of flow stability (marked as S). For alloy 0.05Sc these optimal parameters were a temperature range of 400–450 °C and a strain rate of 0.1–1 s−1 at the beginning of deformation, and 380–420 °C and strain rates lower than 1 s−1—at high strain values. For the 0.1Sc alloy, the optimal temperature range primarily decreased up to 360–400 °C with the same strain rates (0.1–1 s−1) at all stages of deformation. Furthermore, for the alloy with 0.15% Sc, the optimal temperature range was 360–450 °C during the first stages and near 360 °C at the end of deformation, with the lowest strain rates (near 0.1 s−1) for all stages. The specimens deformed with parameters at the lowest power dissipation efficiency (green areas) and flow instability regions (450 °C and 15 s−1, for example) had cracks on the surface, as shown in Figure 4.
The typical microstructures of specimens after deformations at different conditions are shown in Figure 5. Primarily, the microstructures after all deformation conditions were nonrecrystallised, and elongated deformed grains were present. However, upon deformation at rates of 5 and 15 s−1 and temperatures of 450 °C, the microstructure was partially recrystallised, but there were also microcracks along the grain boundaries. Therefore, the main mechanism of energy dissipation during deformation was DRV. Under those deformation regimes, where DRV did not have time to occur, cracks formed and the specimens were destroyed. Thus, the optimal deformation parameters were a temperature range 350–400 °C and strain rates of 0.1–1 s−1 for the 0.05Sc and 0.1 Sc alloys, and 0.1 s−1 for the 0.15Sc.

4. Conclusions

The hot deformation behaviour of Al4.5Zn4.5Mg1Cu0.12Zr alloys with different scandium contents were investigated at a temperature range of 300–450 °C and strain rate intervals of 0.1–15 s−1. The materials constants of a flow stress model based on the Zener-Hollomon parameter were determined (AARE was no more 5.8%). Three-dimensional processing maps were established by combining the power dissipation efficiency and flow stability diagrams. Based on processing maps analysis and the microstructures investigations, the optimal deformation parameters were determined as a temperature range of 350–400 °C and strain rates of 0.1–1 s−1 for the alloys with 0.05% and 0.1% Sc, and 0.1 s−1 for the alloy with 0.15% Sc. These ranges were characterised by the highest dissipation efficiency in the range of 30–35% and a positive flow stability value.

Author Contributions

Conceptualisation, M.G.K. and A.V.P.; methodology, A.Y.C.; validation, M.G.K.; investigation, R.Y.B. and M.V.G.; writing—original draft preparation, M.G.K. and A.Y.C.; writing—review and editing, M.G.K.; supervision, A.N.S. All authors have read and agreed to the published version of the manuscript.

Funding

This research was funded by the Russian Science Foundation (Project №20-79-00305).

Institutional Review Board Statement

Not applicable.

Informed Consent Statement

Not applicable.

Data Availability Statement

Data is contained within the article.

Conflicts of Interest

The authors declare no conflict of interest.

References

  1. Xie, P.; Chen, S.; Chen, K.; Jiao, H.; Huang, L.; Zhang, Z.; Yang, Z. Enhancing the stress corrosion cracking resistance of a low-Cu containing Al-Zn-Mg-Cu aluminum alloy by step-quench and aging heat treatment. Corros. Sci. 2019, 161, 108184. [Google Scholar] [CrossRef]
  2. Wang, P.; Li, H.C.; Prashanth, K.G.; Eckert, J.; Scudino, S. Selective laser melting of Al-Zn-Mg-Cu: Heat treatment, microstructure and mechanical properties. J. Alloys Compd. 2017, 707, 287–290. [Google Scholar] [CrossRef]
  3. Peng, X.; Guo, Q.; Liang, X.; Deng, Y.; Gu, Y.; Xu, G.; Yin, Z. Mechanical properties, corrosion behavior and microstructures of a non-isothermal ageing treated Al-Zn-Mg-Cu alloy. Mater. Sci. Eng. A 2017, 688, 146–154. [Google Scholar] [CrossRef]
  4. Chen, S.; Li, J.; Hu, G.Y.; Chen, K.; Huang, L. Effect of Zn/Mg ratios on SCC, electrochemical corrosion properties and microstructure of Al-Zn-Mg alloy. J. Alloys Compd. 2018, 757, 259–264. [Google Scholar] [CrossRef]
  5. Liu, J.; Hu, R.; Zheng, J.; Zhang, Y.; Ding, Z.; Liu, W.; Zhu, Y.; Sha, G. Formation of solute nanostructures in an Al–Zn–Mg alloy during long-term natural aging. J. Alloys Compd. 2020, 821, 153572. [Google Scholar] [CrossRef]
  6. Zolotorevskii, V.S.; Pozdnyakov, A.V.; Churyumov, A.Y. Search for promising compositions for developing new multiphase casting alloys based on Al-Zn-Mg matrix using thermodynamic calculations and mathematic simulation. Phys. Met. Metallogr. 2014, 115, 286–294. [Google Scholar] [CrossRef]
  7. Pan, Y.; Zhang, D.; Liu, H.; Zhuang, L.; Zhang, J. Precipitation hardening and intergranular corrosion behavior of novel Al–Mg–Zn(-Cu) alloys. J. Alloys Compd. 2021, 853, 157199. [Google Scholar] [CrossRef]
  8. Vlach, M.; Kodetova, V.; Cizek, J.; Leibner, M.; Kekule, T.; Lukáč, F.; Cieslar, M.; Bajtošová, L.; Kudrnová, H.; Sima, V.; et al. Role of Small Addition of Sc and Zr in Clustering and Precipitation Phenomena Induced in AA7075. Metals 2020, 11, 8. [Google Scholar] [CrossRef]
  9. Zhang, M.; Liu, T.; He, C.; Ding, J.; Liu, E.; Shi, C.; Li, J.; Zhao, N. Evolution of microstructure and properties of Al-Zn-Mg-Cu-Sc-Zr alloy during aging treatment. J. Alloys Compd. 2016, 658, 946–951. [Google Scholar] [CrossRef]
  10. Li, B.; Pan, Q.; Zhang, Z.; Li, C. Characterization of flow behavior and microstructural evolution of Al-Zn-Mg-Sc-Zr alloy using processing maps. Mater. Sci. Eng. A 2012, 556, 844–848. [Google Scholar] [CrossRef]
  11. Xiao, Q.F.; Huang, J.W.; Jiang, Y.G.; Jiang, F.Q.; Wu, Y.F.; Xu, G.F. Effects of minor Sc and Zr additions on mechanical properties and microstructure evolution of Al−Zn−Mg−Cu alloys. Trans. Nonferrous Met. Soc. China 2020, 30, 1429–1438. [Google Scholar] [CrossRef]
  12. Li, H.; Cao, F.; Guo, S.; Ning, Z.; Liu, Z.; Jia, Y.; Scudino, S.; Gemming, T.; Sun, J. Microstructures and properties evolution of spray-deposited Al-Zn-Mg-Cu-Zr alloys with scandium addition. J. Alloys Compd. 2017, 691, 482–488. [Google Scholar] [CrossRef]
  13. Khomutov, M.; Chereshneva, A.; Petrovskiy, P.; Daubarayte, D.; Cheverikin, V.; Sova, A.; Travyanov, A.; Smurov, I. Microstructure of Al–Mg-Sc-Zr alloy cold spray deposits after heat treatment and hot isostatic pressing. J. Alloys Compd. 2020, 858, 157644. [Google Scholar] [CrossRef]
  14. Hou, Y.F.; Xiao, J.J.; Liu, C.Y.; Zhang, B. Effect of Heat Treatment on the Microstructure, Mechanical Properties, and Corrosion Resistance of Friction Stir Processed Al-Zn-Mg-Cu-Sc-Zr Alloy. J. Mater. Eng. Perform. 2021, 1–8. [Google Scholar] [CrossRef]
  15. Liu, Y.; Zhang, C.C.; Zhang, X.Y.; Huang, Y.C. Understanding grain refinement of Sc addition in a Zr containing Al-Zn-Mg-Cu aluminum alloy from experiments and first-principles. Intermetallics 2020, 123, 106823. [Google Scholar] [CrossRef]
  16. Wang, Y.; Xiong, B.; Li, Z.; Zhang, Y.; Teng, H. Precipitation Behavior of Al3(Sc,Zr) Particles in High-Alloyed Al–Zn–Mg–Cu–Zr–Sc Alloy During Homogenization. Arab. J. Sci. Eng. 2021, 1–11. [Google Scholar] [CrossRef]
  17. Wang, Y.; Li, Z.; Xiong, B.; Wen, K.; Huang, S.; Li, X.; Zhang, Y. Microstructure Evolution of High-Alloyed Al–Zn–Mg–Cu–Zr Alloy Containing Trace Amount of Sc During Homogenization. Met. Mater. Int. 2019, 25, 697–704. [Google Scholar] [CrossRef]
  18. Ke, B.; Ye, L.; Tang, J.; Zhang, Y.; Liu, S.; Lin, H.; Dong, Y.; Liu, X. Hot deformation behavior and 3D processing maps of AA7020 aluminum alloy. J. Alloys Compd. 2020, 845, 156113. [Google Scholar] [CrossRef]
  19. Sun, Y.; Cao, Z.; Wan, Z.; Hu, L.; Ye, W.; Li, N.; Fan, C. 3D processing map and hot deformation behavior of 6A02 aluminum alloy. J. Alloys Compd. 2018, 742, 356–368. [Google Scholar] [CrossRef]
  20. Shang, X.; Zhou, J.; Wang, X.; Luo, Y. Optimizing and identifying the process parameters of AZ31 magnesium alloy in hot compression on the base of processing maps. J. Alloys Compd. 2015, 629, 155–161. [Google Scholar] [CrossRef]
  21. Churyumov, A.Y.; Medvedeva, S.V.; Mamzurina, O.I.; Kazakova, A.A.; Churyumova, T.A. United Approach to Modelling of the Hot Deformation Behavior, Fracture, and Microstructure Evolution of Austenitic Stainless AISI 316Ti Steel. Appl. Sci. 2021, 11, 3204. [Google Scholar] [CrossRef]
  22. Lu, J.; Song, Y.; Hua, L.; Zheng, K.; Dai, D. Thermal deformation behavior and processing maps of 7075 aluminum alloy sheet based on isothermal uniaxial tensile tests. J. Alloys Compd. 2018, 767, 856–869. [Google Scholar] [CrossRef]
  23. Liu, Y.; Geng, C.; Lin, Q.; Xiao, Y.; Xu, J.; Kang, W. Study on hot deformation behavior and intrinsic workability of 6063 aluminum alloys using 3D processing map. J. Alloys Compd. 2017, 713, 212–221. [Google Scholar] [CrossRef]
  24. Li, P.W.; Li, H.Z.; Huang, L.; Liang, X.P.; Zhu, Z.X. Characterisation of hot deformation behavior of AA2014 forging aluminum alloy using processing map. Trans. Nonferrous Met. Soc. China 2017, 27, 1677–1688. [Google Scholar] [CrossRef]
  25. Jang, D.H.; Kim, W.J. Warm Temperature Deformation Behavior and Processing Maps of 5182 and 7075 Aluminum Alloy Sheets with Fine Grains. Met. Mater. Int. 2018, 24, 455–463. [Google Scholar] [CrossRef]
  26. Yang, Q.; Liu, W.; Zhang, Z.; Huang, G.; Liu, X. Hot Deformation Behavior and Processing Maps of AA7085 Aluminum Alloy. Xiyou Jinshu Cailiao Yu Gongcheng/Rare Met. Mater. Eng. 2018, 47, 409–415. [Google Scholar] [CrossRef]
  27. Zhou, P.; Deng, L.; Zhang, M.; Gong, P.; Wang, X.Y. Characterization of Hot Workability of 5052 Aluminum Alloy Based on Activation Energy-Processing Map. J. Mater. Eng. Perform. 2019, 28, 6209–6218. [Google Scholar] [CrossRef]
  28. Opěla, P.; Schindler, I.; Kawulok, P.; Kawulok, R.; Rusz, S.; Navrátil, H.; Jurča, R. Correlation among the power dissipation efficiency, flow stress course, and activation energy evolution in Cr-Mo low-alloyed steel. Materials 2020, 13, 3480. [Google Scholar] [CrossRef]
  29. Zhao, J.; Ding, H.; Zhao, W.; Huang, M.; Wei, D.; Jiang, Z. Modelling of the hot deformation behaviour of a titanium alloy using constitutive equations and artificial neural network. Comput. Mater. Sci. 2014, 92, 47–56. [Google Scholar] [CrossRef]
  30. El Mehtedi, M.; Spigarelli, S.; Gabrielli, F.; Donati, L. Comparison Study of Constitutive Models in Predicting the Hot Deformation Behavior of AA6060 and AA6063 Aluminium Alloys. Mater. Today Proc. 2015, 2, 4732–4739. [Google Scholar] [CrossRef]
  31. Churyumov, A.Y.; Khomutov, M.G.; Tsar’Kov, A.A.; Pozdnyakov, A.V.; Solonin, A.N.; Efimov, V.M.; Mukhanov, E.L. Study of the structure and mechanical properties of corrosion-resistant steel with a high concentration of boron at elevated temperatures. Phys. Met. Metallogr. 2014, 115, 809–813. [Google Scholar] [CrossRef]
  32. Wan, Z.; Hu, L.; Sun, Y.; Wang, T.; Li, Z. Hot deformation behavior and processing workability of a Ni-based alloy. J. Alloys Compd. 2018, 769, 367–375. [Google Scholar] [CrossRef]
  33. Zener, C.; Hollomon, J.H. Effect of strain rate upon plastic flow of steel. J. Appl. Phys. 1944, 15, 22–32. [Google Scholar] [CrossRef]
  34. Zhang, H.; Chen, G.; Chen, Q.; Han, F.; Zhao, Z. A physically-based constitutive modelling of a high strength aluminum alloy at hot working conditions. J. Alloys Compd. 2018, 743, 283–293. [Google Scholar] [CrossRef]
  35. Bodunrin, M.O. Flow stress prediction using hyperbolic-sine Arrhenius constants optimised by simple generalised reduced gradient refinement. J. Mater. Res. Technol. 2020, 9, 2376–2386. [Google Scholar] [CrossRef]
  36. Lin, Y.C.; Dong, W.Y.; Zhou, M.; Wen, D.X.; Chen, D.D. A unified constitutive model based on dislocation density for an Al-Zn-Mg-Cu alloy at time-variant hot deformation conditions. Mater. Sci. Eng. A 2018, 718, 165–172. [Google Scholar] [CrossRef]
  37. Wu, H.; Wen, S.P.; Huang, H.; Wu, X.L.; Gao, K.Y.; Wang, W.; Nie, Z.R. Hot deformation behavior and constitutive equation of a new type Al-Zn-Mg-Er-Zr alloy during isothermal compression. Mater. Sci. Eng. A 2016, 651, 415–424. [Google Scholar] [CrossRef]
  38. Yan, J.; Pan, Q.L.; Li, A.D.; Song, W.B. Flow behavior of Al–6.2Zn–0.70Mg–0.30Mn–0.17Zr alloy during hot compressive deformation based on Arrhenius and ANN models. Trans. Nonferrous Met. Soc. China 2017, 27, 638–647. [Google Scholar] [CrossRef]
  39. Churyumov, A.Y.; Khomutov, M.G.; Solonin, A.N.; Pozdniakov, A.V.; Churyumova, T.A.; Minyaylo, B.F. Hot deformation behaviour and fracture of 10CrMoWNb ferritic-martensitic steel. Mater. Des. 2015, 74, 44–54. [Google Scholar] [CrossRef]
  40. Prasad, Y.V.R.K.; Gegel, H.L.; Doraivelu, S.M.; Malas, J.C.; Morgan, J.T.; Lark, K.A.; Barker, D.R. Modeling of dynamic material behavior in hot deformation: Forging of Ti-6242. Metall. Trans. A 1984, 15, 1883–1892. [Google Scholar] [CrossRef]
  41. Narayana Murty, S.V.S.; Sarkar, A.; Narayanan, P.R.; Venkitakrishnan, P.V.; Mukhopadhyay, J. Development of Processing Maps and Constitutive Relationship for Thermomechanical Processing of Aluminum Alloy AA2219. J. Mater. Eng. Perform. 2017, 26, 2190–2203. [Google Scholar] [CrossRef]
  42. Prasad, Y.V.R.K.; Rao, K.P.; Sasidhara, S. Hot Working Guide: A Compendium of Processing Maps, 2nd ed.; ASM International: Geauga County, OH, USA, 2015; ISBN 978-1-62708-091-0. [Google Scholar]
  43. Kim, Y.; Song, Y.B.; Lee, S.H.; Kwon, Y.S. Characterisation of the hot deformation behavior and microstructural evolution of Ti-6Al-4V sintered preforms using materials modeling techniques. J. Alloys Compd. 2016, 676, 15–25. [Google Scholar] [CrossRef]
Figure 1. SEM-image of the alloy 0.15Sc as cast (a) and after the heat treatment (b). The images show the characteristic emissions of the alloying elements into the selected zone (the red rectangle on the microstructure) and TEM-image with secondary phases of T and Al3(Sc,Zr).
Applsci 11 04587 g001
Figure 2. True stress true strain curves of the alloys 0.05Sc (a,b), 0.1Sc (c,d) and 0.15Sc (e,f) at different temperatures and a strain rate of 1 s−1 (a,c,e), and different strain rates and a temperature of 400 °C (b,d,f).
Applsci 11 04587 g002
Figure 3. The comparison between experimental and calculated values of stress (a) and model validations using additional experiments at different temperature and strain rate conditions (b): alloy 0.05Sc—375 °C and 0.05 s−1; alloy 0.1Sc—425 °C and 1.5 s−1; alloy 0.15Sc—325 °C and 0.8 s−1.
Applsci 11 04587 g003
Figure 4. 3D processing maps for Al4.5Zn4.5Mg1Cu0.12Zr alloys with different Sc contents, and images of 0.1Sc alloy specimens after deformations at 450 °C/15 s−1 (with cracks) and 400 °C/0.1 s−1 (without cracks).
Applsci 11 04587 g004
Figure 5. LM-images of the microstructures of the alloy 0.1Sc after deformation at different conditions.
Applsci 11 04587 g005
Table 1. Chemical composition of the investigated alloys (wt. %).
AlloyAlZnMgCuZrSc
0.05Scbal.4.54.51.00.120.05
0.1Scbal.4.54.51.00.120.1
0.15Scbal.4.54.51.00.120.15
Table 2. The materials constants for the alloy Al4.5Zn4.5Mg1Cu0.12Zr with different Sc contents.
ε0.05Sc0.1Sc0.15Sc
Q, kJ·mol−1ln(A)n2αQ, kJ·mol−1ln(A)n2αQ, kJ·mol−1ln(A)n2α
0.0517228.16.80.01017128.06.70.01016127.16.10.009
0.117529.36.40.01017629.46.40.00916928.96.00.009
0.216928.86.10.00917129.36.20.00916428.45.60.008
0.316528.76.00.00817230.16.20.00816428.75.50.008
0.416228.66.00.00817130.26.00.00816629.25.50.008
0.516729.56.10.00817430.96.10.00816929.95.50.008
0.617230.46.10.00817932.06.20.00817330.95.60.008
0.718031.96.20.00818633.66.30.00717932.35.60.008
0.818432.56.20.00918934.56.40.00718533.55.60.008
0.918632.86.20.00919235.16.40.00718333.05.30.008
Publisher’s Note: MDPI stays neutral with regard to jurisdictional claims in published maps and institutional affiliations.

