Article

Investigation of Magnetic Anisotropy and Barkhausen Noise Asymmetry Resulting from Uniaxial Plastic Deformation of Steel S235

1
University of Žilina, Univerzitná 1, 01026 Žilina, Slovakia
2
Faculty of Mathematics and Physics, Charles University, Ke Karlovu 5, 12116 Praha 2, Czech Republic
3
Faculty of Nuclear Sciences and Physical Engineering, ČVUT Praha, Trojanova 13, 12000 Praha 2, Czech Republic
*
Author to whom correspondence should be addressed.
Appl. Sci. 2021, 11(8), 3600; https://doi.org/10.3390/app11083600
Submission received: 16 March 2021 / Revised: 14 April 2021 / Accepted: 15 April 2021 / Published: 16 April 2021
(This article belongs to the Special Issue Metal Forming)

Abstract

:
This study investigates alterations in magnetic anisotropy and the marked asymmetry in Barkhausen noise (MBN) signals after the uniaxial plastic straining of steel S235 obtained from a shipyard and used as standard structural steel in shipbuilding. It was found that the initial easy axis of magnetisation in the direction of previous rolling, and also in the direction of loading, becomes the hard axis of magnetisation as soon as the plastic strain attains the critical threshold. This behaviour is due to the preferential matrix orientation and the corresponding realignment of the magneto-crystalline anisotropy. Apart from the angular dependence of MBN, the asymmetry in the consecutive MBN bursts at the lower plastic strains is also analysed and explained as a result of magnetic coupling between the grains plastically strained and those unaffected by the tensile test. It was found that, by increasing the degree of plastic strain, the marked asymmetry in MBN tends to vanish. Moreover, the asymmetry in MBN bursts occurs in the direction of uniaxial tension and disappears in the perpendicular direction. Besides the MBN technique, XRD and EBSD techniques were also employed in order to provide a deeper insight into the investigated aspects.

1. Introduction

Domain wall (DW) motion under the alteration of a magnetic field near the coercivity usually occurs in the form of irreversible and discontinuous jumps due to interference of DWs with lattice imperfections [1,2,3]. These jumps produce acoustic as well as electromagnetic pulses which can be detected on the free surface in the form of bursts, known as Barkhausen noise [1,2,3]. Electromagnetic components of these pulses are referred to as magnetic Barkhausen noise (MBN). The main reason for discontinuous DW motion can be viewed in their interference with the pinning sites such as dislocation tangles [4,5], grain boundaries [6], surface irregularities [7], precipitates [8], and non-ferromagnetic phases [9], etc. For this reason, MBN signals contain information about the interfering microstructure features as well as the stress state [10,11,12,13].
Plastic straining usually increases dislocation density [12,14], alters grain size and the corresponding grain boundaries, and initiates phase transformations [15], etc. For this reason, MBN is widely employed for monitoring of bodies exposed to the variable degrees of plastic strains under the various regimes of loading (uniaxial, biaxial, bending, etc.) [12,16,17]. Sensitivity of MBN against dislocation density and phase transformations has been investigated and explained in a satisfactory manner. On the other hand, such aspects as the alteration of magnetic anisotropy or/and the asymmetry in MBN bursts have been reported [12,18], but their origin has not been satisfactorily discussed and explained yet. It is considered that the alterations of magnetic anisotropy are due to realignment of DWs due to the preferential crystallographic orientation [18,19,20,21]. On the other hand, remarkable asymmetry in the consecutive MBN bursts in many cases is due to residual magnetism. This effect diminishes when the surface is demagnetised. However, despite demagnitisation, in some cases, this asymmetry remains in the components as a result of magnetic coupling between the phases of the different magnetic (and the corresponding mechanical) hardness. Rivas et al. [22] investigated monolithic amorphous bilayer ribbons (Fe73.5Nb3Si13.5B9Cu1/Fe74.5Nb3Si13.5B9) consisting of two layers of different magnetic hardness. The authors separated the individual contributions of each layer into the global magnetic behaviour and analysed the magneto-coupling between them. The findings of this study match well with the magnetic behaviour of the hard-milled surface when the magnetic coupling can be found between the surface hard white layer and the subsurface soft heat-affected region [18]. The marked MBN asymmetry was also reported during uniaxial plastic straining [12]. It was found that this asymmetry is sensitive to the magnetic anisotropy and the degree of plastic straining. However, its origin has not been investigated and explained yet. Remarkable asymmetry in the consecutive MBN bursts can be detected as a results of insufficient samples demagnetization. However, this asymmetry can be found in some cases after components processing despite their demagnetization due to heterogeneity in magnetic hardness of the neighboring regions. This asymmetry remarkably increases standard deviations of MBN expressed in term of the effective (rms) values as well as the positions of MBN envelopes and the corresponding Peak Positions. This aspect limits reliability of MBN technique employed for monitoring of components in the real industry. For these reasons, the asymmetry in the consecutive MBN bursts should be investigated, explained, and considered when a suitable concept for monitoring of real components is proposed. Therefore, this study provides a deeper insight and explanation of the MBN asymmetry after the uniaxial plastic straining and the superimposing magnetic anisotropy. This manuscript is a part of a pilot study in which the potential of the MBN technique is investigated for monitoring of elastic and plastic straining of the steels employed in the building of bridges, civil construction, and applications in road as well as water transport.

2. Materials and Methods

S235 steel samples (hardness of 182 ± 11 HV0.5, tensile yield strength 305 MPa, ultimate tensile strength 390 MPa, and elongation at break 41%, hot-rolled) were used as-received [12]. The matrix of the S235 steel is composed of predominant ferrite and minor pearlite islands. Chemical composition, and metallographic images of the microstructure, shape, and size of the samples can be found in a previous study [12]. The samples were deformed in tension by an Instron 5985 with the deformation direction parallel with the rolling direction (RD). The transverse direction is referred to as TD. The samples were investigated post-mortem in the unloaded state. Samples were subjected to the elastic strain ε = 2.5%, homogenous plastic straining ε = 5, 10, 15, 20, and 25%, and finally the non-homogenous plastic straining (necking) ε = 30, 35, and 40% (for the stress-strain curves, check [12]).
The true interpretation of MBN signals is associated with the investigation of the interrelation between the MBN, residual stresses, and microstructure. For this reason, the non-destructive XRD and EBSD measurements were carried out as well (in the normal direction plane in the sample’s centre with respect to both length and width). The samples for EBSD observations and XRD measurements were cut from the central part of the deformed samples and electrochemically polished using Struers Lectropol and AC2 solution.
Crystallite size t (the size of coherently diffracted domains) and micro-deformation were determined from the XRD patterns obtained by an X’Pert PRO diffractometer using the Co-Kα radiation, and the subsequent Rietveld refinement performed in MStruct software [23,24,25,26] (used for the fitting of the measured XRD patterns). The effective penetration depth of the XRD measurements was in this case 1–5 µm. Using the XRD data, crystallite size t was calculated via the Scherrer formula (Equation (1))
t = (K.λ)/(B.cosθ)
where K, λ, B, θ are the shape factor, X-ray wavelength, peak broadening and half of the diffraction angle, and the Bragg angle, respectively.
EBSD analysis was performed by a Zeiss Auriga Compact equipped with an EDAX EBSD camera. An area of 400 × 400 µm was selected for the EBSD measurement with a step size of 0.4 µm. The data were analysed by OIM TSL 7.3. The raw data were partially cleaned using one step of confidence index (CI) standardisation, and one step of grain dilatation, and only points with a confidence index of CI > 0.1 were used.
MBN was measured by the use of a RollScan 350. The angular dependence of MBN against RD was analysed with the step 22.5° (RD corresponds to the angle 0° whereas TD 90°). The angular dependence was investigated by the samples’ rotation (via the self-made positioning system) and usage of the bipolar surface sensor S1-18-12-01 (produced by StressTech, further details about the shape of the sensor in [9]). MBN signals were processed using MicroScan 600 software (nominal mag. voltage 5V and frequency 175 Hz, frequency range of MBN emission from 20 up to 700 kHz). MBN asymmetry was also investigated as a function of magnetising voltage in the range 2–16 V. MBN represents the effective (rms) value of the MBN emission. The MBN envelopes and the corresponding PP (Peak Position) were extracted from the raw MBN signal. PP refers to the strength of the magnetic field in which the MBN envelope attains the maximum. Note that the samples were fully demagnetised before the tensile test, and MBN signals in this condition did not exhibit asymmetry. The significant asymmetry of MBN which occurred after the tensile test also prevailed in the samples after subsequent demagnetisation.

3. Results of Experiments and Their Discussion

3.1. XRD Measurements

Figure 1 shows that the crystallite size t drops down abruptly when the plastic deformation takes place instead of the elastic one, and the local stresses expressed in terms of micro-deformation grow, followed by the region of plastic strain up to 15% when the alterations of these parameters become quite negligible. As soon as the ε becomes more developed and exceeds 15%, a significant decrease of t and the corresponding growth of micro-deformation can be seen. In this particular case, the crystallite size is mainly affected by the increasing dislocation density and the corresponding hardness [27,28] (check also the previous study [12]).
The increasing density of lattice imperfections makes the size of the coherently diffracted domains lower and increases the degree of local micro-stresses since the strain hardening in S235 steel is mainly driven by the dislocation motion and its increasing density.
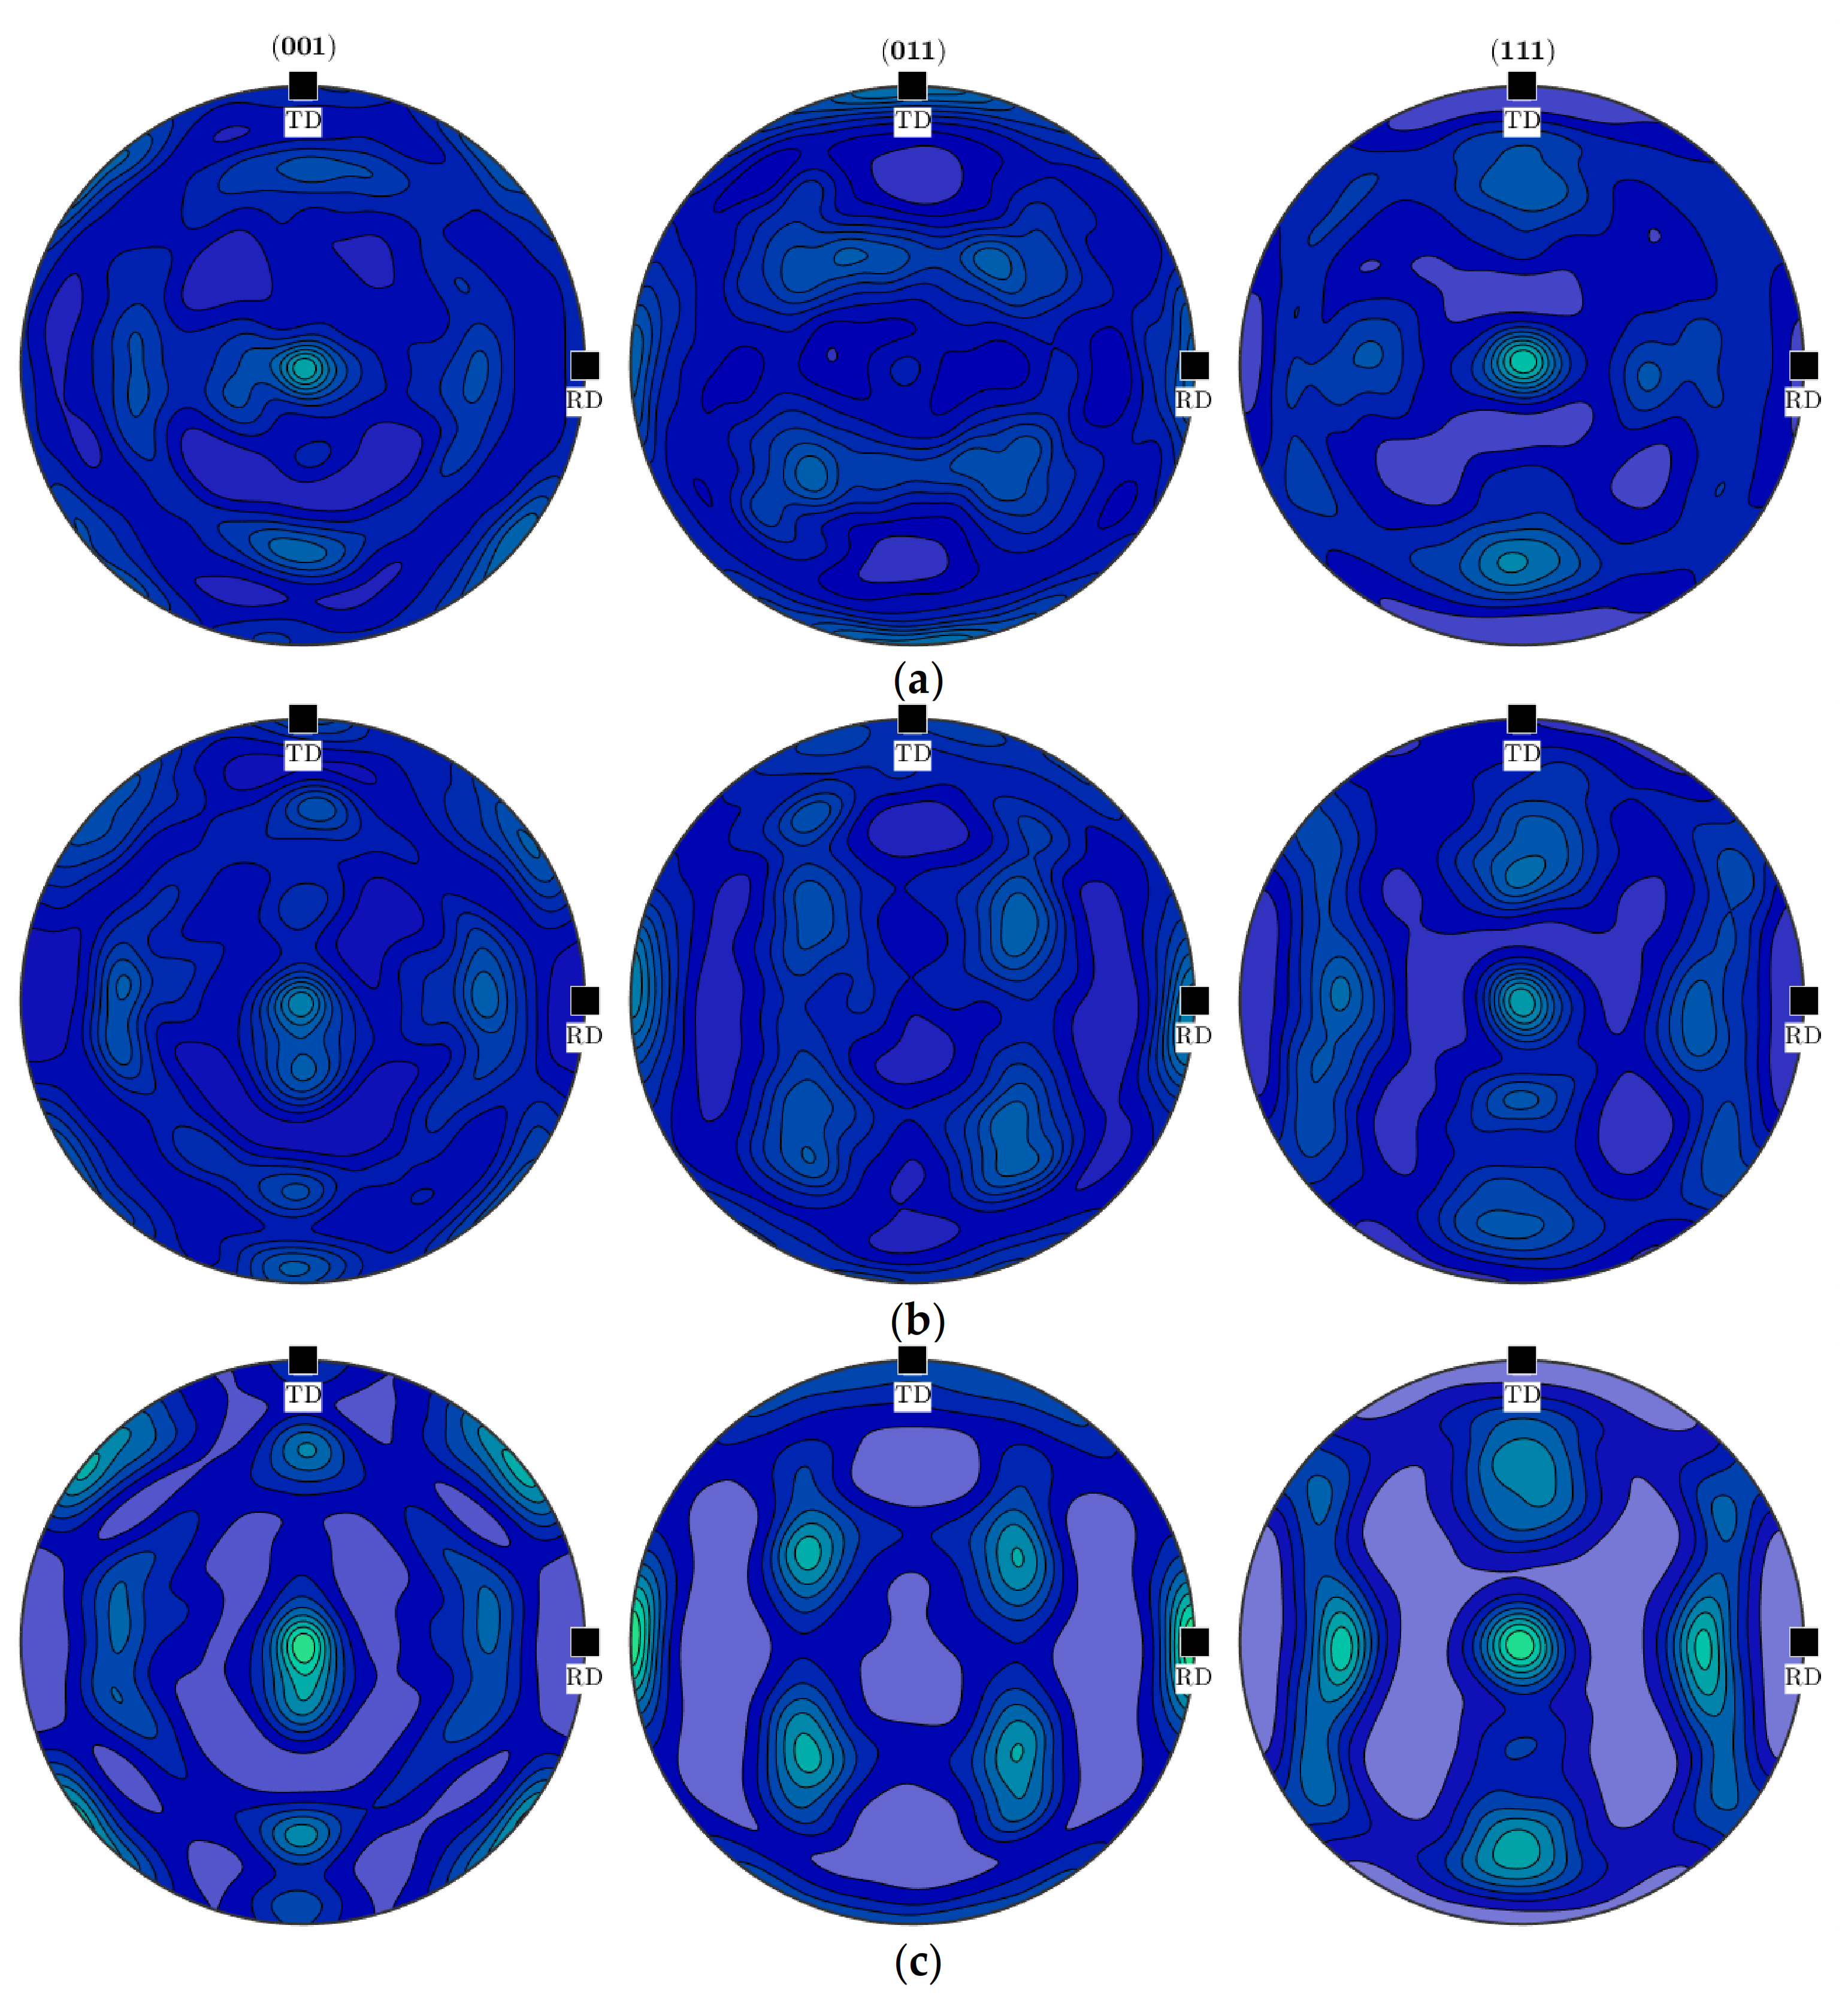
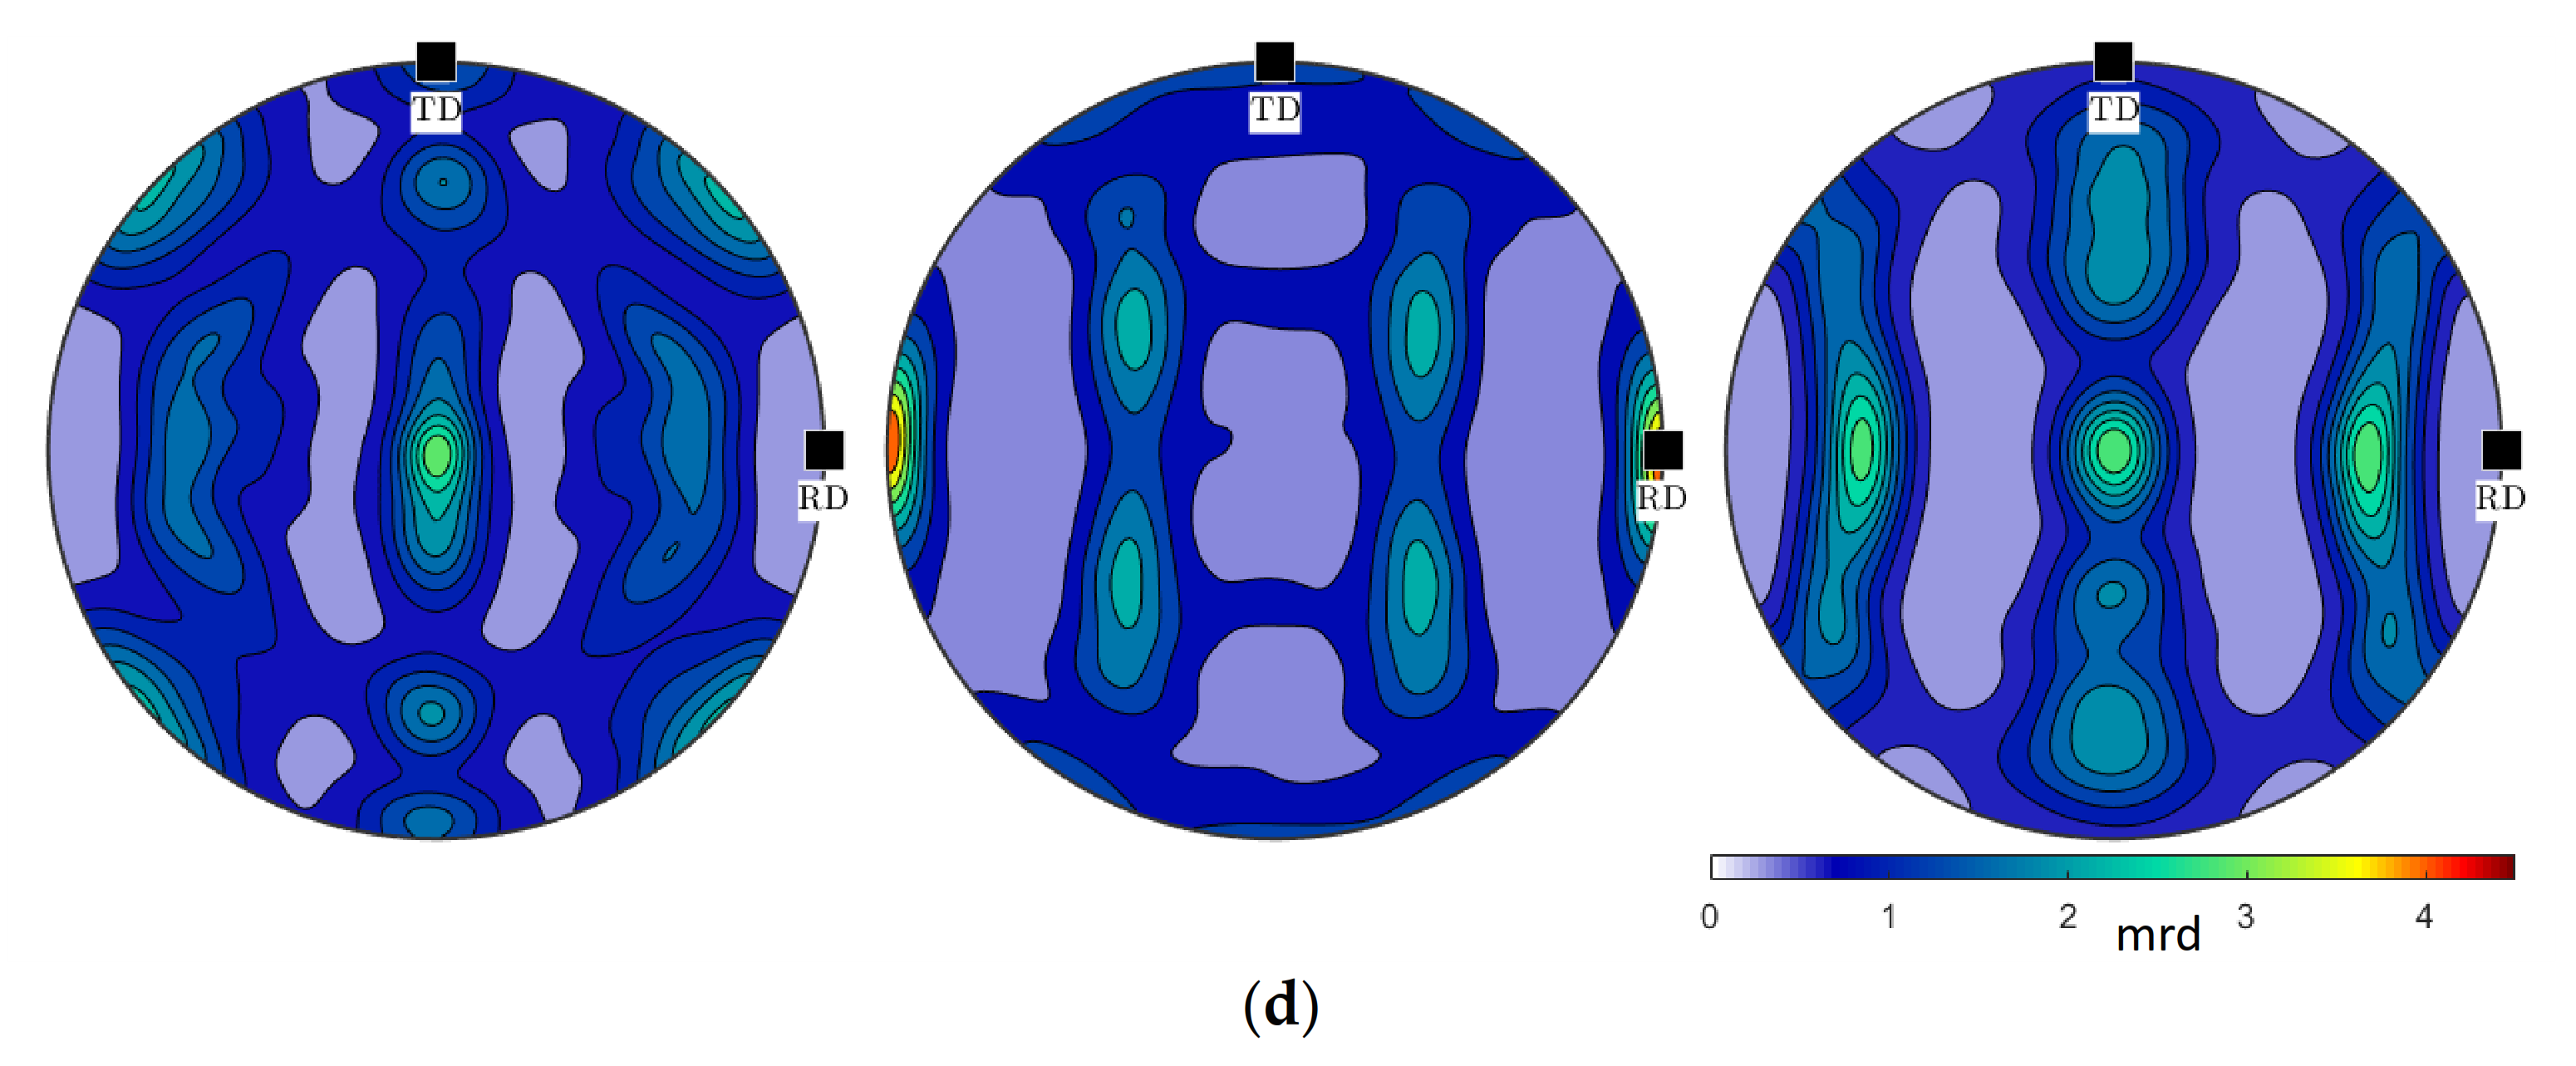
Pole figures in Figure 2 demonstrate the growing preferential crystallographic orientation of the matrix in the TD direction along with more developed plastic straining.
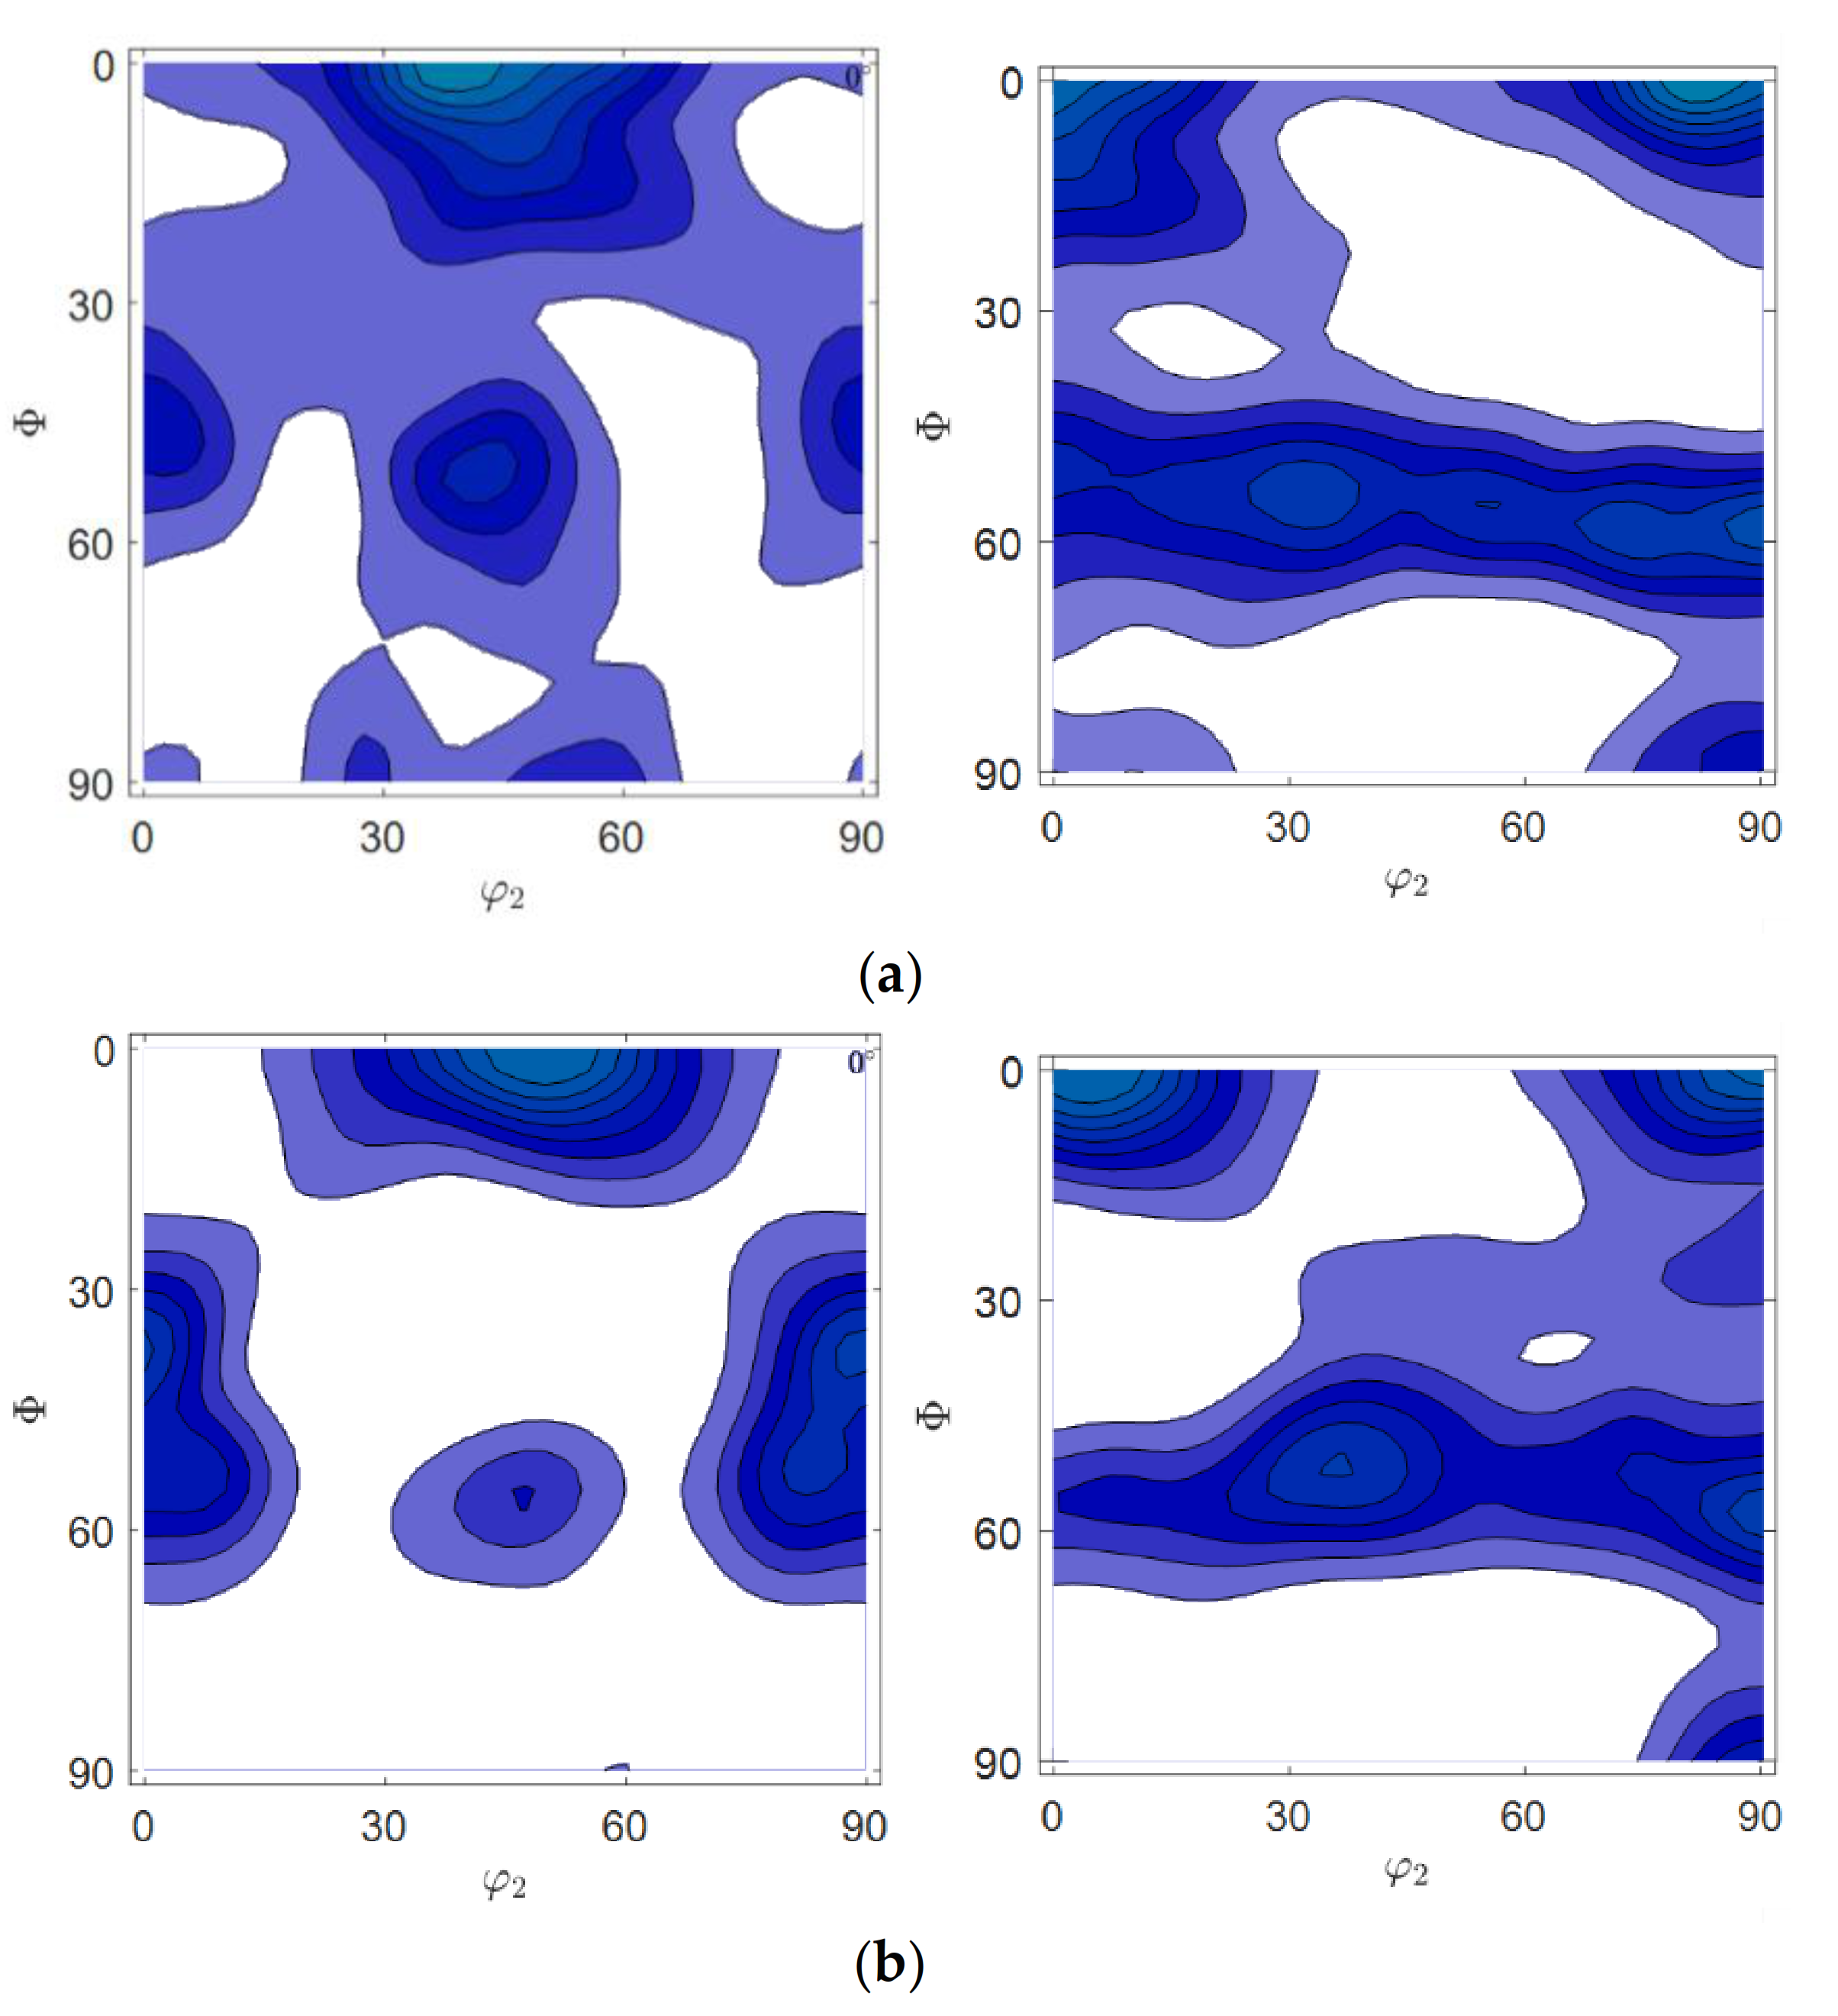
For small plastic straining of 2.5%, the weak texture γ-fibre was found. Conversely, strengthening of the {111}<123>, {001}<110> rotational cubic, and {110}<001> Goss texture components were found with increasing plastic strain (see also Figure 3). This effect is typical for deformed materials [21]. The typical {111}<112> texture component was shifted by approximately 15° from its ideal location to {111}<123>, for all samples. The strengthening of the rotational cubic and {111}<123> texture components, which is evident from the pole figures {110}, results in the easy magnetisation axis perpendicular to the RD.

3.2. EBSD Observations

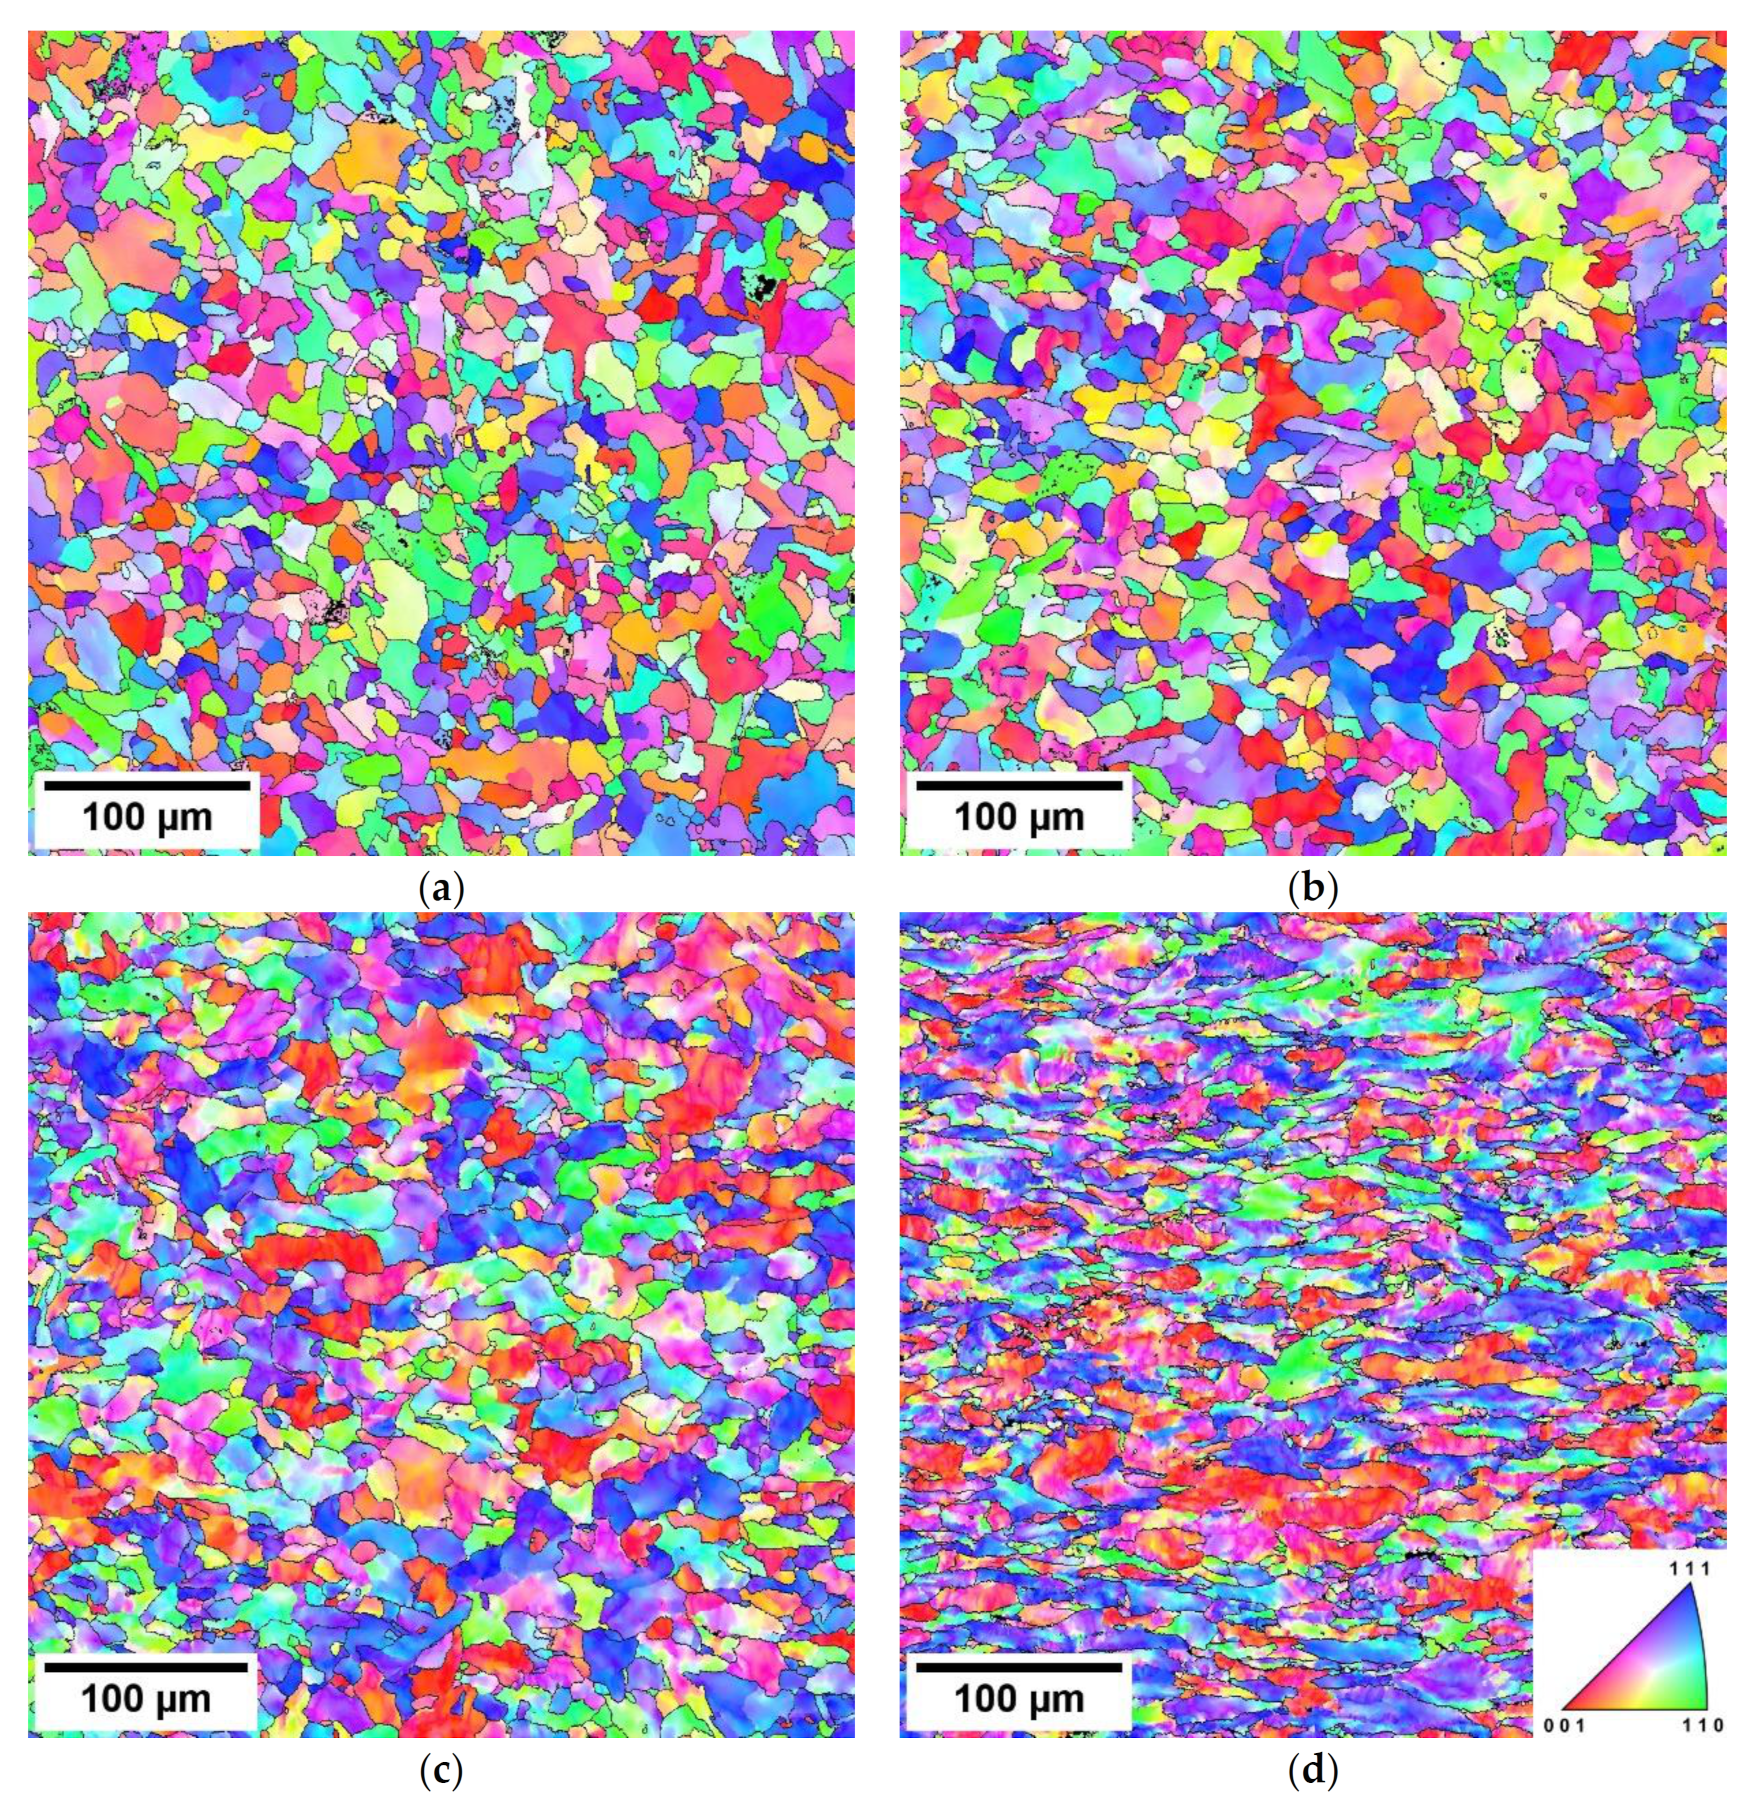
Figure 4 shows EBSD orientation maps of the selected samples and Figure 5 presents the calculated grain size distributions and evolution of the average grain size (area-based) on ε. Note that as grains, only areas separated by high-angle grain boundaries (HAGB) (misorientation > 15°) were considered. The 15° misorientation threshold between low-angle and high-angle grain boundaries (LAGB, HAGB) is a typical value frequently used in the literature. The individual dislocations may be identified in LAGB but they cannot be in HAGB. The grains are discontinuously separated by HAGB. HAGB are entirely composed of lattice defects and DWs in motion usually cannot move through them. DWs can usually move (excluding a strongly textured matrix) in the grain interior only and LAGB in the form of dislocations only slow down their motion or/and reduce their free path of motion, which in turn makes lower magnitudes of the corresponding MBN pulses.
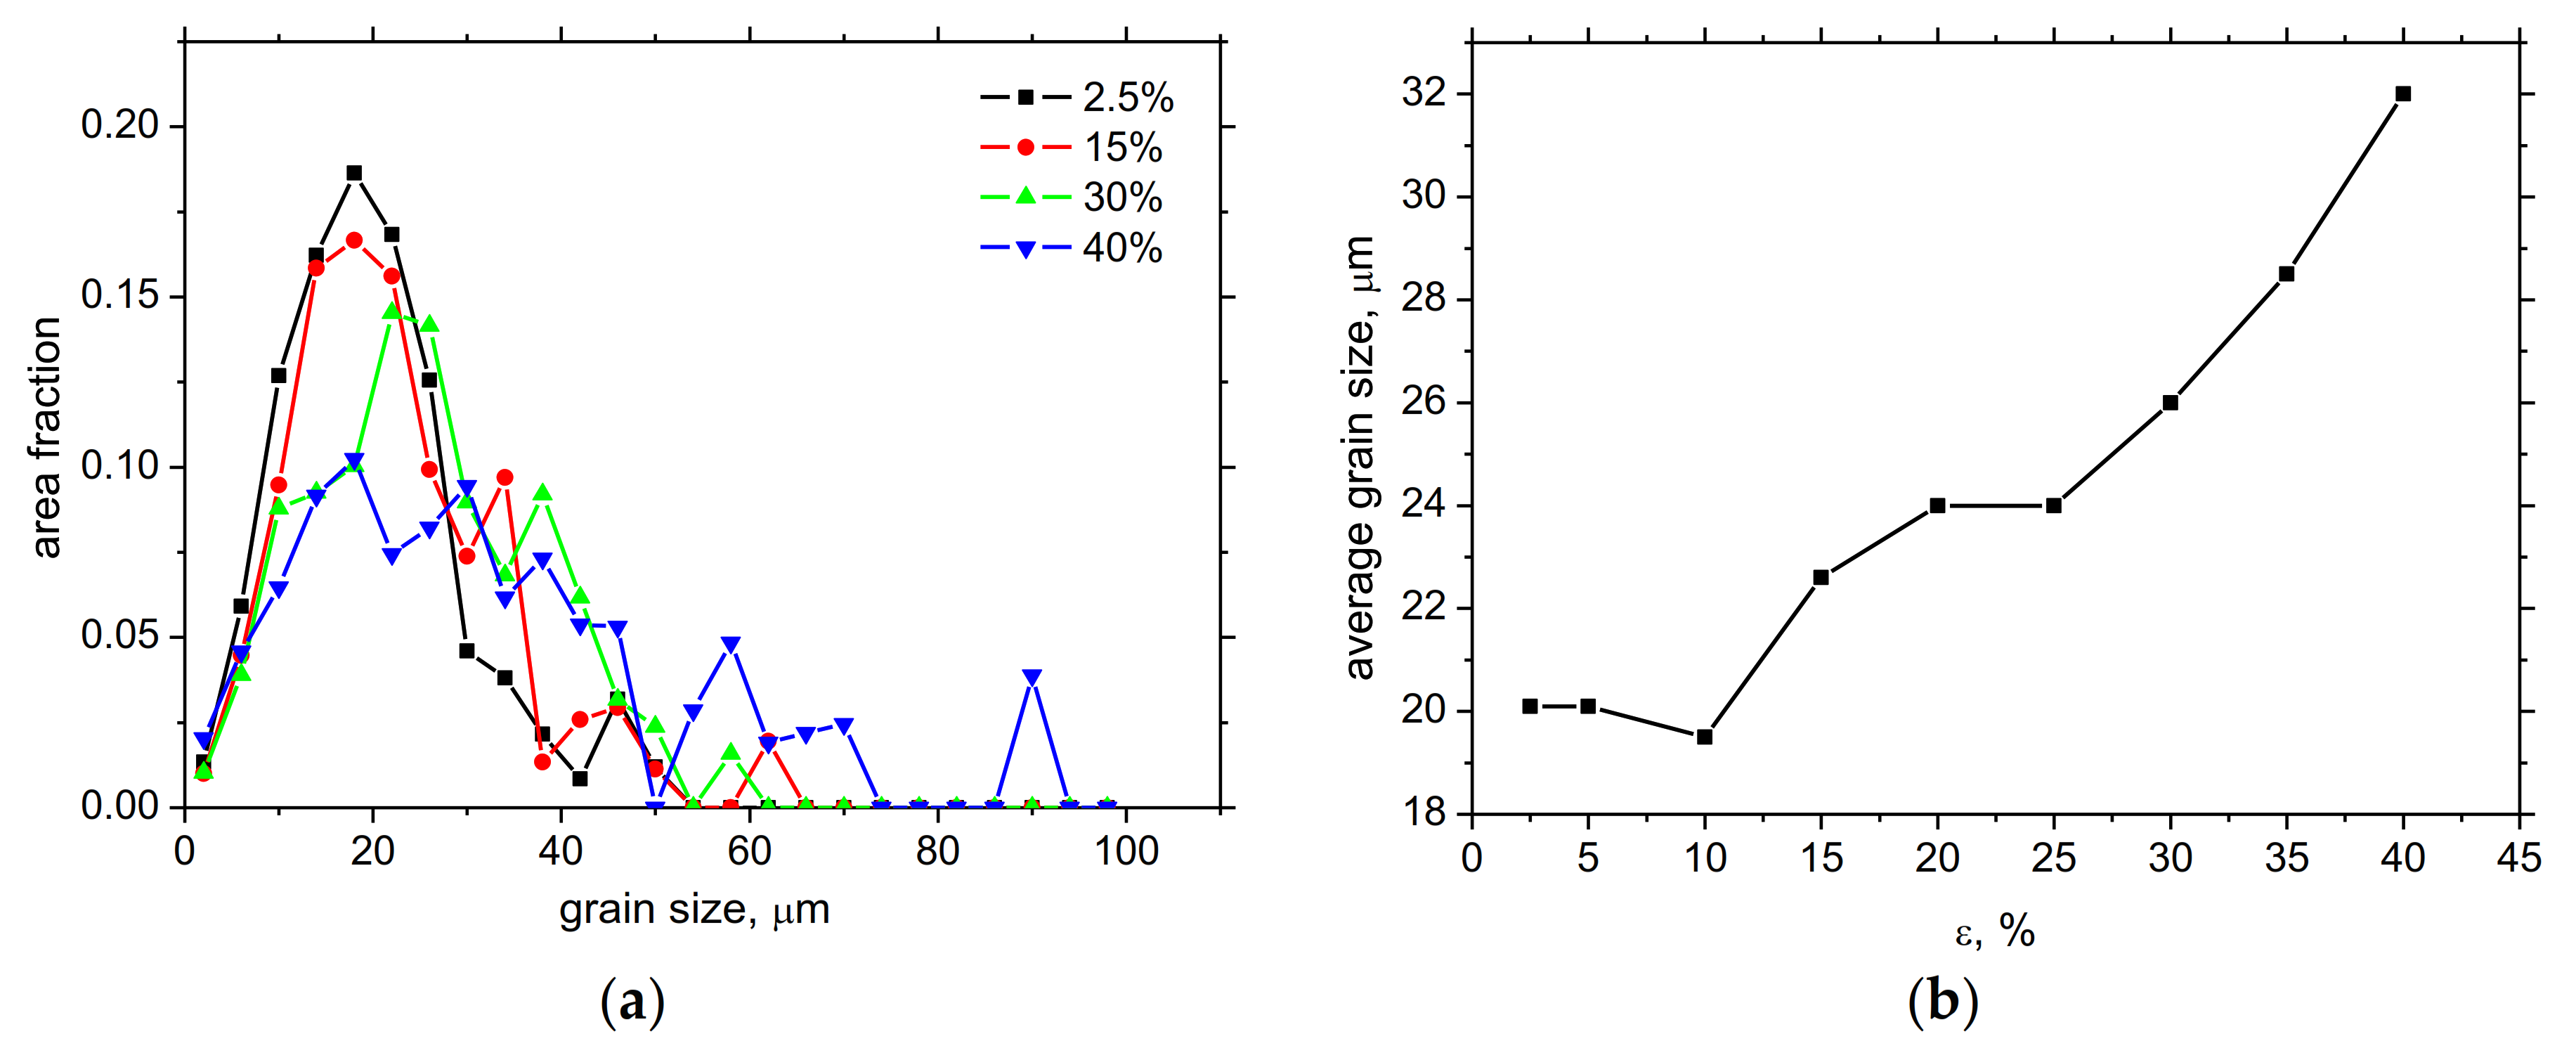
The sample deformed only elastically (ε = 2.5%) consists of grains without any specific relation between their shape and the sample reference frame. An increase in deformation caused a gradual stretching of the grains in the direction of load. Consequently, the projection of some grains in the EBSD measurement plane increased and caused an apparent broadening of the grain size distribution (Figure 5a) and an increase in the average grain size (Figure 5b).
Note that this increase is only related to the significant change in the grain shape, and real grain growth was not observed. The most pronounced increase in the average grain size occurred primarily above ε = 25%, when the plastic flow turned from a homogenous one into a non-homogeneous one, see Reference [12]. This significant change in the grain shape is important for MBN anisotropy, as discussed later.
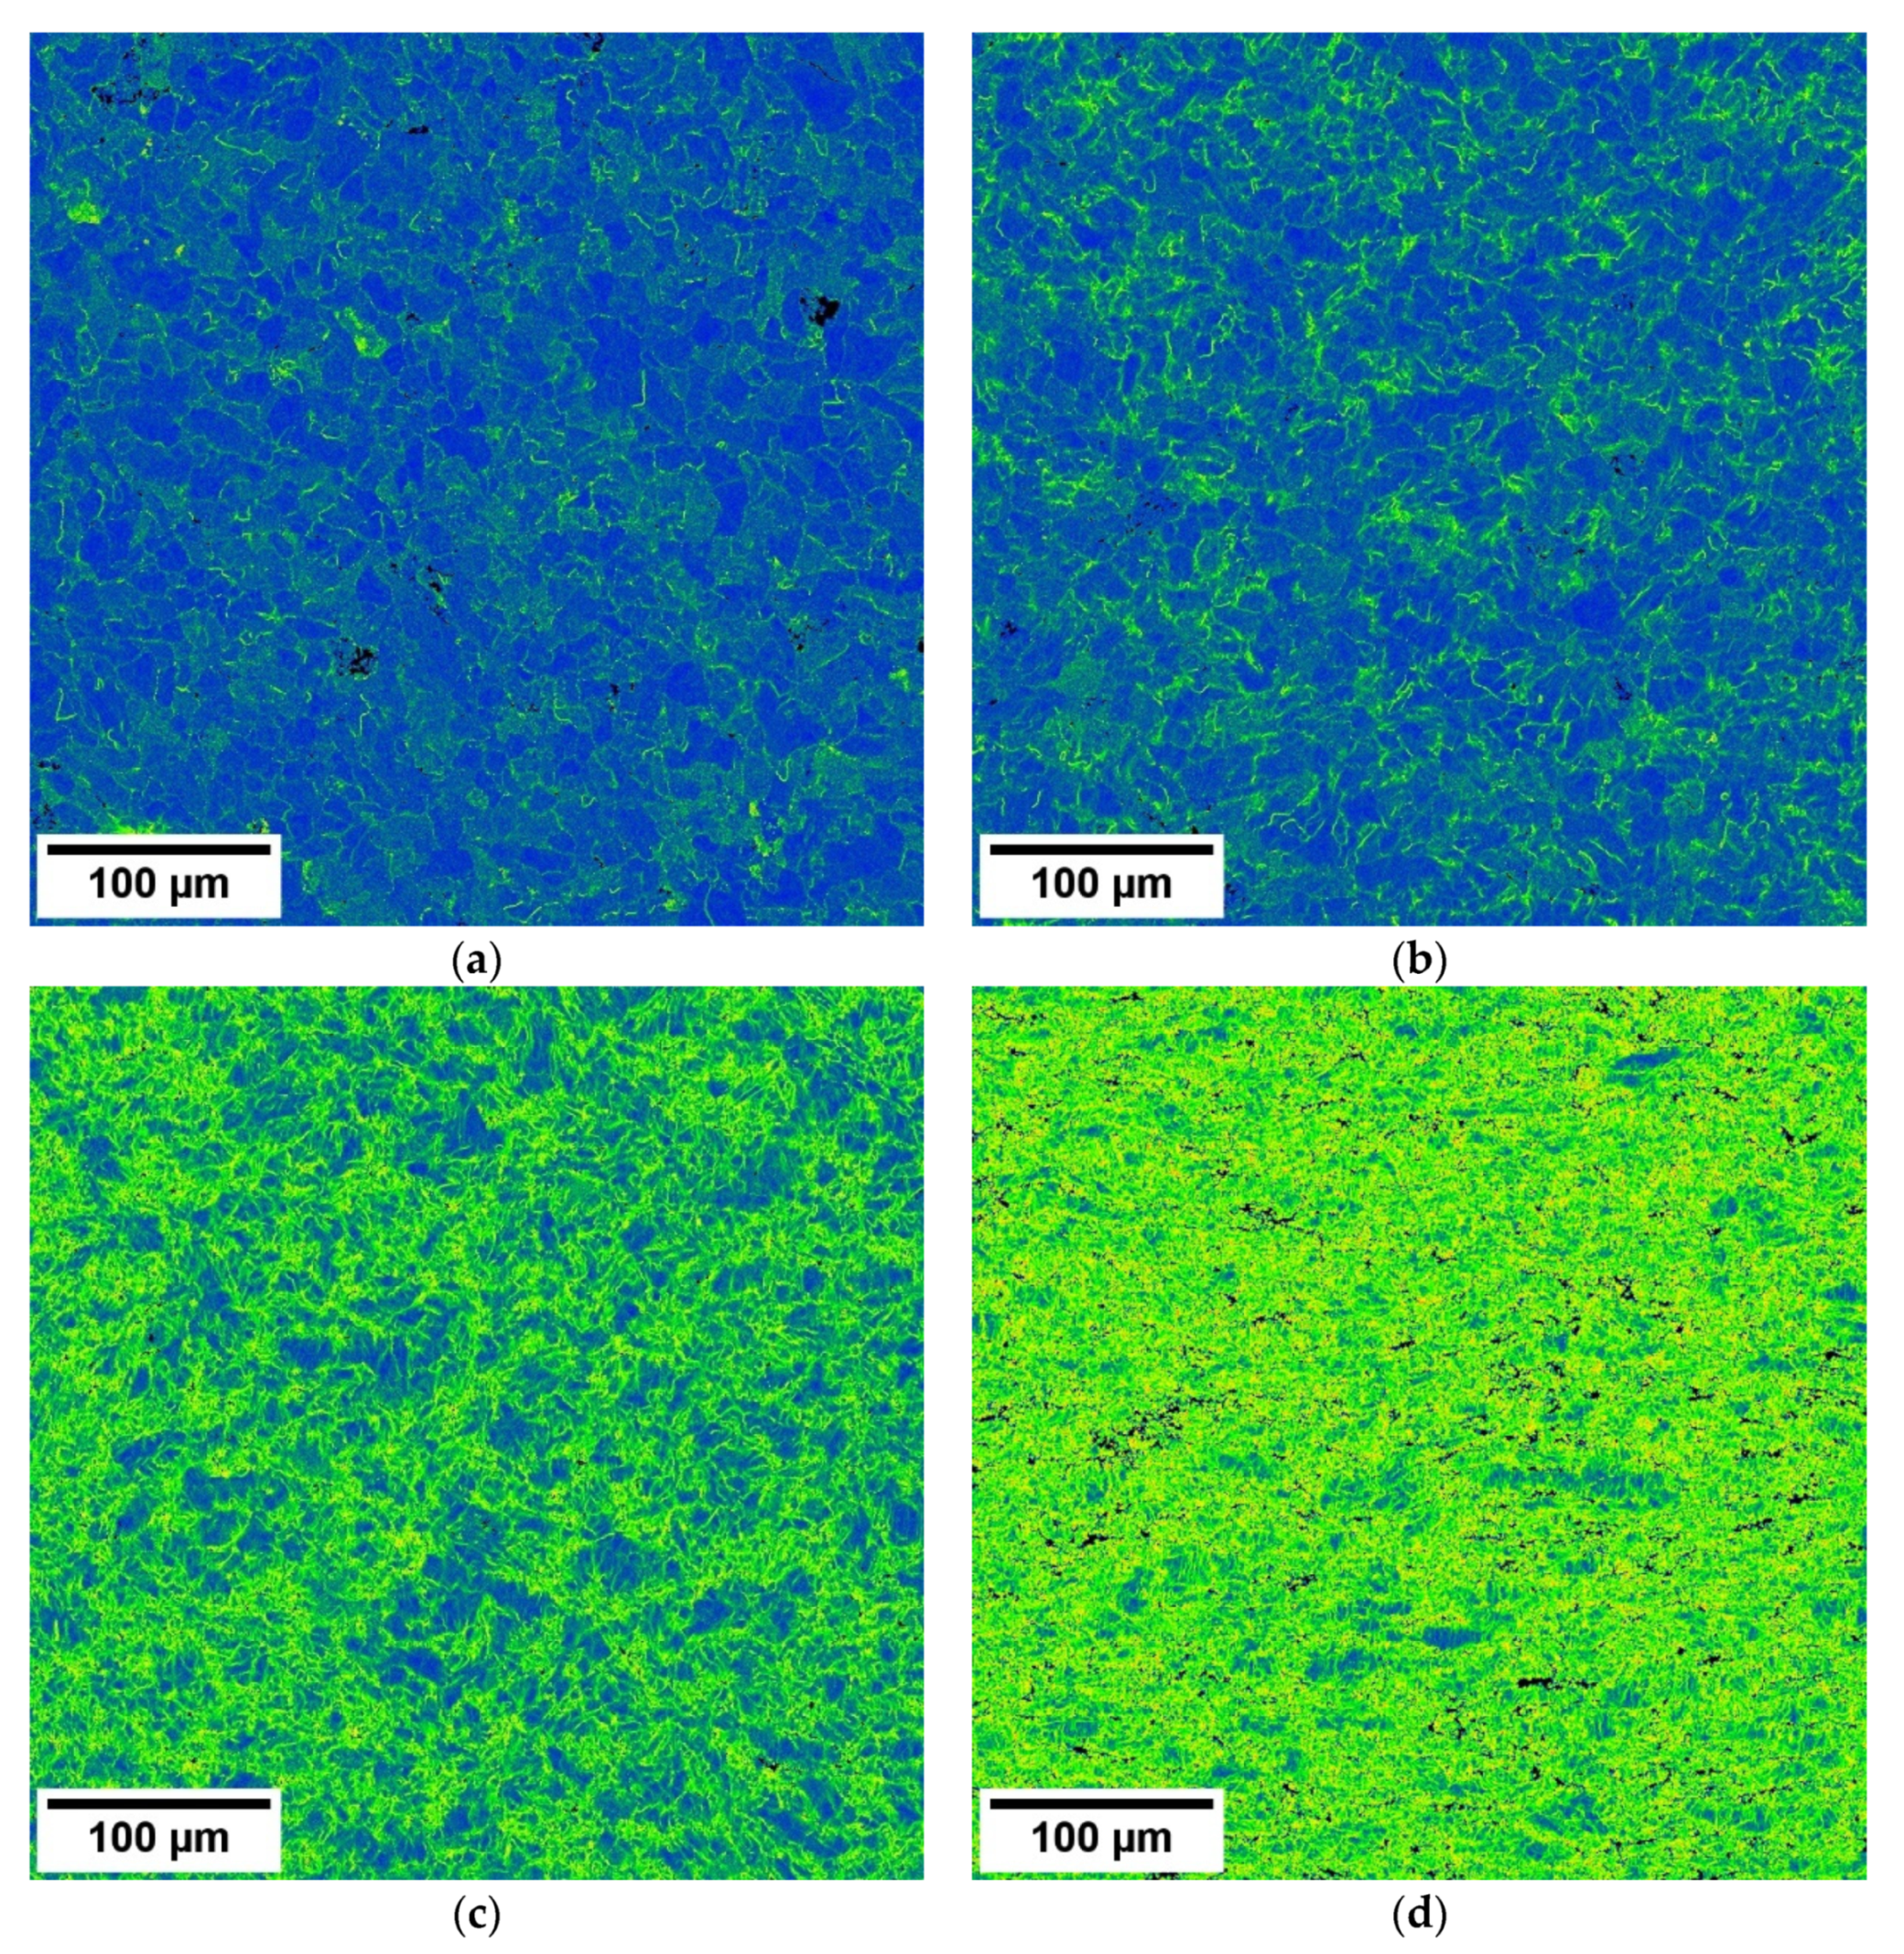
EBSD orientation maps shown in Figure 4 exhibit a gradual increase in colour variation inside grains with the increasing deformation. This is a manifestation of a growing amount of strain, which causes local rotation of the crystal orientation. Qualitative analysis of the EBSD data, focused mainly on the strain, can be performed using Kernel average misorientation (KAM). KAM expresses the average misorientation between a point and a ring of neighbouring points, in this study, 1st neighbours. The misorientation limit is 5°; therefore, only strain inside the grains and sub-grains is analysed, and KAM can be directly associated with the geometrically necessary dislocations which cause the corresponding lattice rotation. The resulting KAM maps of the selected samples are shown in Figure 6. A small and spatially limited increase in KAM has already been observed in the ε = 2.5% sample. A higher KAM angle was usually present in the vicinity of certain grain boundaries, which indicates the occurrence of microplasticity already in the elastic region. An increase in deformation to ε = 15% and, subsequently, to ε = 30%, resulted in a distinct increase in KAM, which qualitatively corresponds to an increase in area fraction of green/yellow pixels. From the macroscopic point of view, the increase in KAM was uniform, but significant local variation in KAM indicates that some areas were deformed more than others. A further increase in strain to ε = 40% resulted in a totally deformed microstructure with a negligible area fraction of unaffected regions.
A significant increase in matrix deformation with increasing strain can also be revealed by point-to-point misorientation analysis. Figure 7a shows the evolution of boundaries representing intergranular strain (misorientation 2–5°), low-angle grain boundaries (LAGBs, misorientation 5–15°), and HAGBs (misorientation > 15°). Figure 7b shows the normalised distribution of misorientation in the range of 0–5°. The HAGBs length fraction was initially relatively high and started to rapidly decrease only after the deformation exceeded 10%. At the same time, a rapid increase in boundaries representing intergranular strain (2–5°) occurred. On the other hand, the evolution of LAGBs was initially unaffected and gradually increased only for ε > 15%. The distribution of misorientations representing intergranular strain shown in Figure 7b is consistent with the KAM analysis and presents some degree of quantification of data shown in Figure 6. An increase in strain caused a significant broadening of the distribution and its shift towards the higher values of misorientation. A substantial change in the distribution shape occurred when the strain exceeded 10%, which corresponds with the rapid increase in the 2–5° boundaries length fraction, depicted in Figure 7a. Note that the distributions in Figure 7b are normalised and, therefore, a change in their height does not reflect the change in the overall fraction of misorientations < 5°, with respect to all points. However, this can be estimated when the data shown in Figure 7a are considered.

3.3. MBN Measurements

Angular dependence of MBN illustrated in Figure 8 depicts the magnetic anisotropy when the RD is the easy axis of magnetisation, whereas the TD is the hard one in the elastic region of straining (this anisotropy corresponds to that after hot-rolling before the uniaxial tensile test). Such character of magnetic anisotropy can be found for ε = 2.5%. On the other hand, the 10% plastic straining is linked with the near isotropic state followed by the marked predomination of MBN in the TD at the higher strains.
Figure 8 also illustrates that the intensity of magnetic anisotropy grows with ε (check MBN ratios between RD and transverse direction (TD) in [12]). Such behaviour is due to grain elongation when the marked crystallographic texture in TD becomes developed at higher strains, as Figure 2 demonstrates. Plastic straining reorganises the DWs’ alignment into the TD direction at the expense of the RD, and especially the direction (001) as the magneto-crystalline easy direction in the bcc lattice [2,3,29] takes the prevailing role. However, Figure 8 demonstrates that MBN in the RD, as well as the TD direction, decreases along with ε due to the increasing dislocation density, expressed in terms of the crystallite size t, as the opposition against DWs motion. Increasing dislocation density which increases the pinning strength of the matrix [4,5,8], expressed in terms of PP (as Figure 9 depicts), should also be considered as well as the superimposing reduction of the free path of DWs in motion. Decrease of MBN in the TD is slowed down since the increasing dislocation density and corresponding magnetic hardness is compensated by the aforementioned alignment of DWs into the TD.
The evolution of MBN corresponds with the evolution of PP as the quantity correlated with the magnetic hardness of the body and therefore, the opposition of the matrix against DWs motion [4,30,31]. Figure 9 depicts that the higher MBN can be linked with lower PP, and vice versa. A more developed ε produces a higher PP in the RD as compared with the TD and grows continuously with ε.
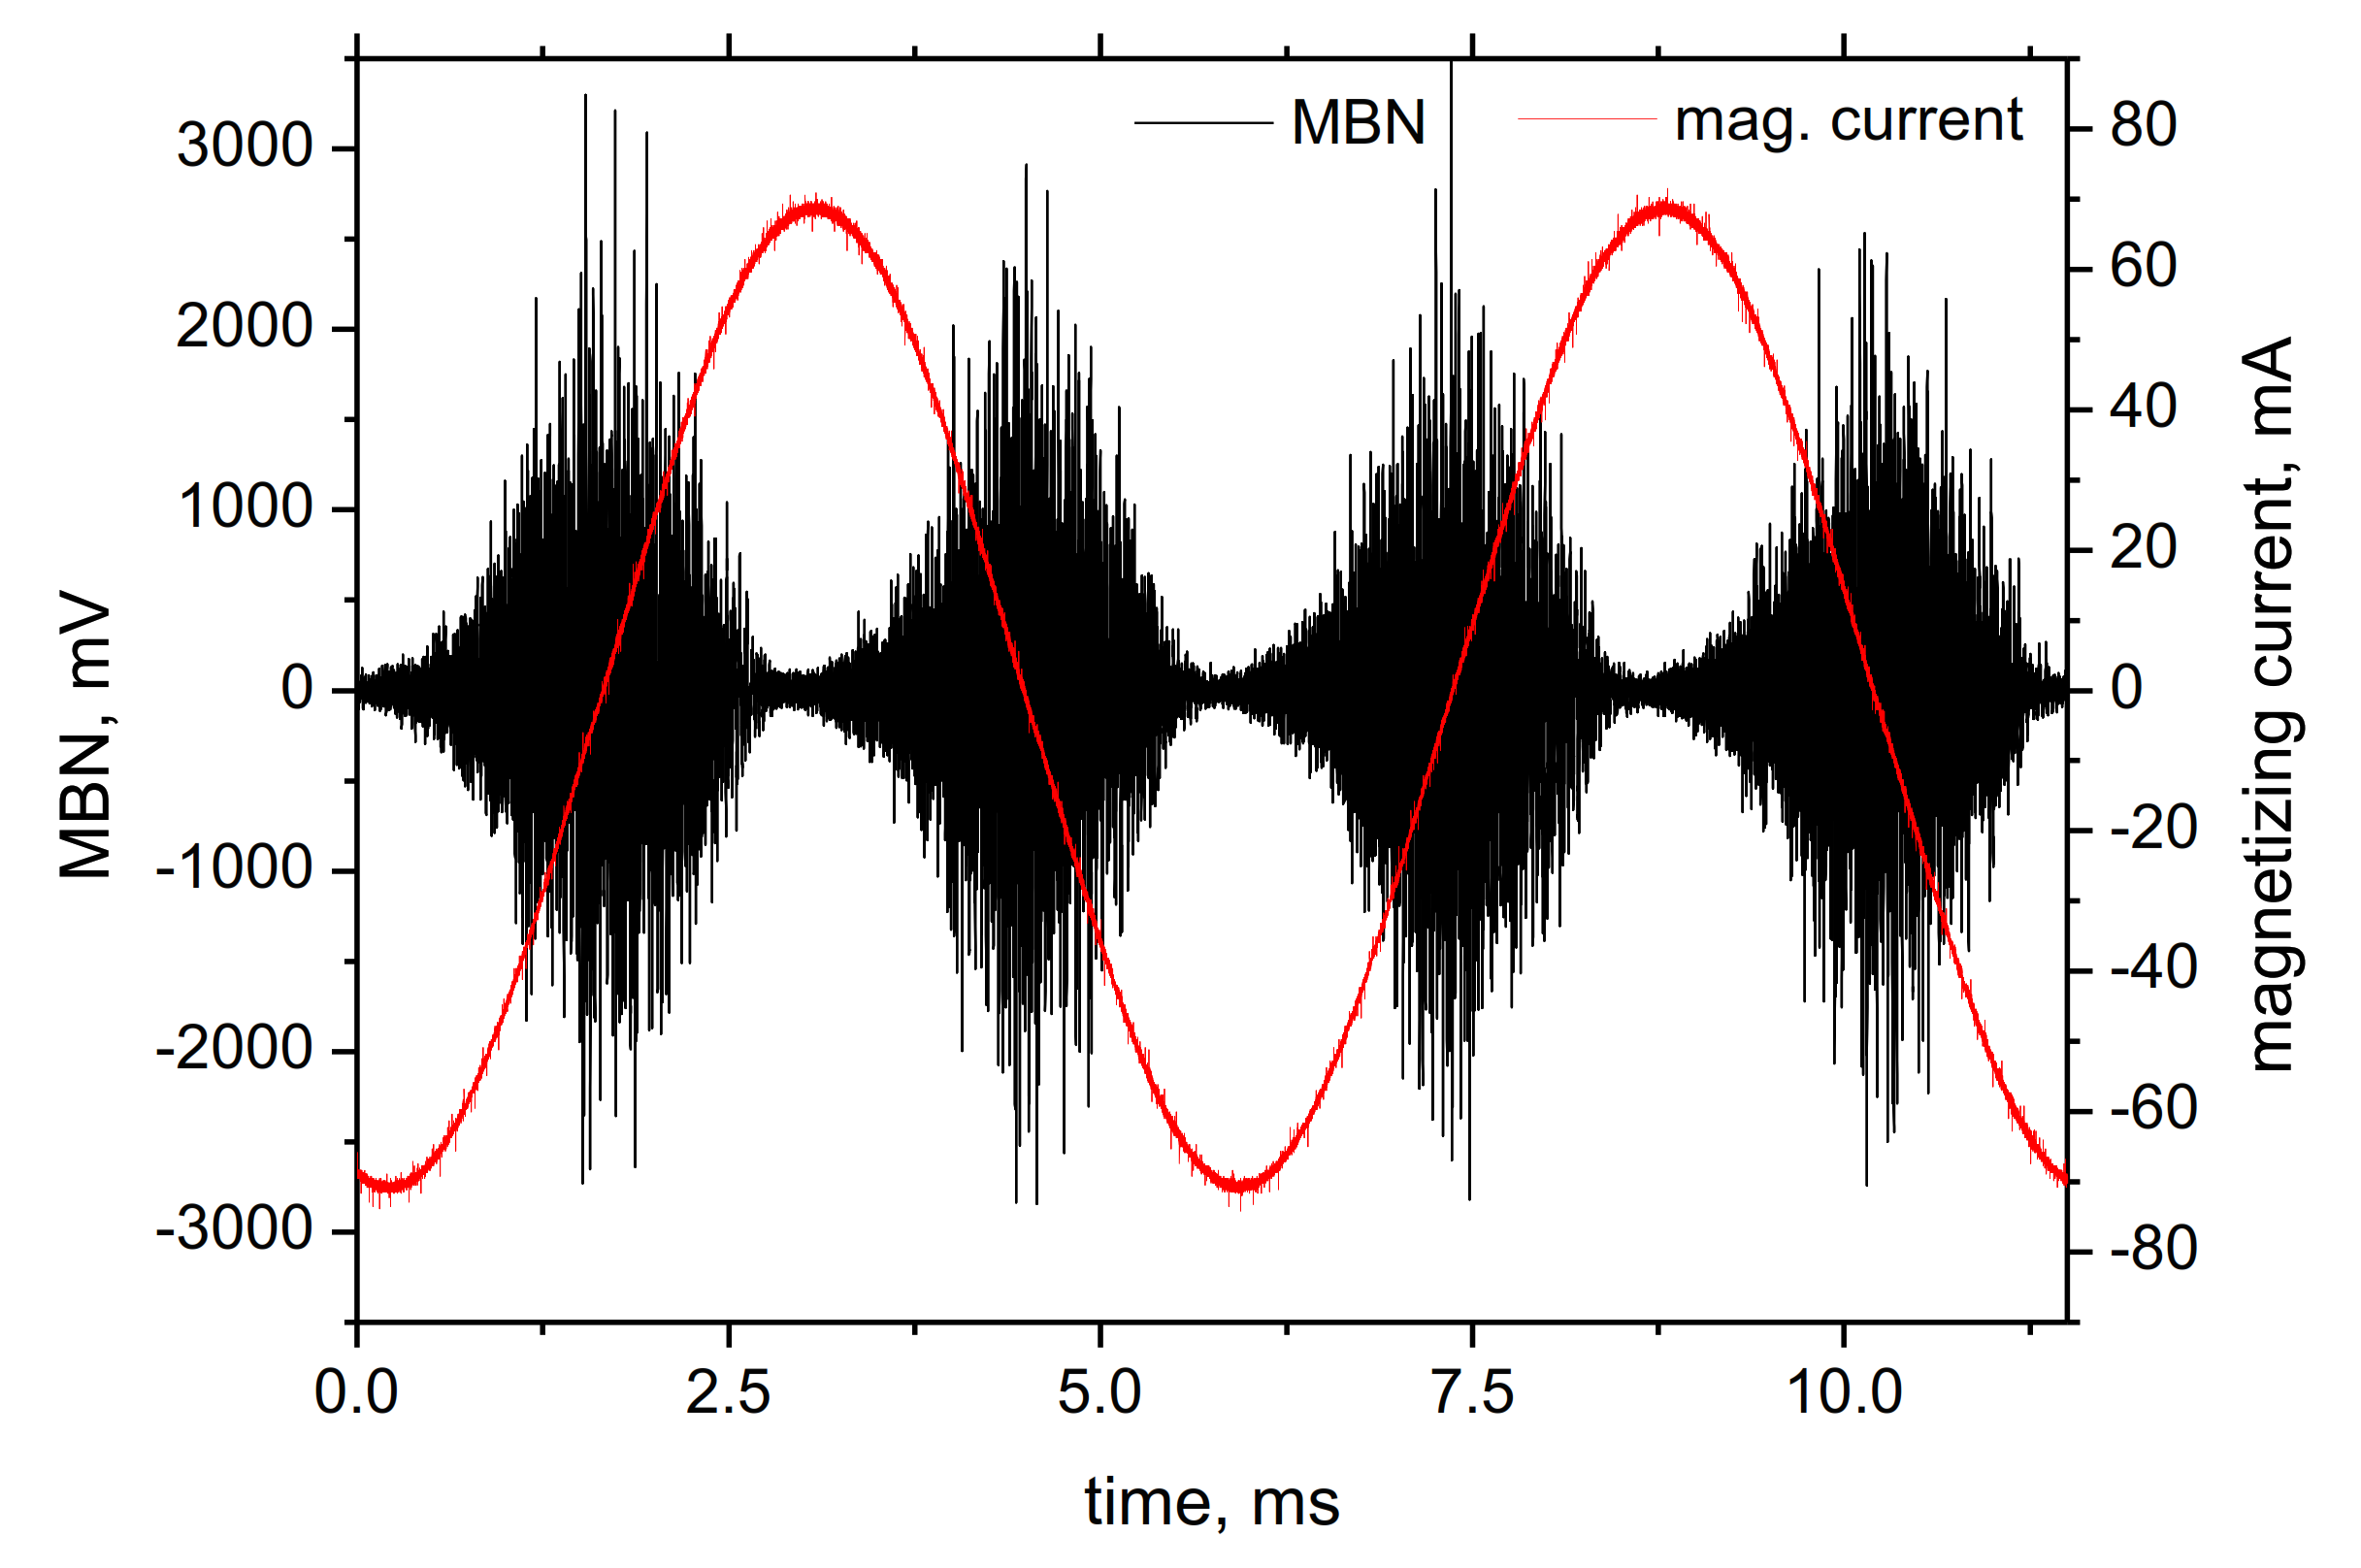
Figure 10 illustrates the conventional symmetric MBN bursts for ε = 2.5% when the shape, position in magnetising current, and the magnitude of the consecutive pulses are very similar (more or less the same)—no matter the ascending (referred to as positive) or descending (negative) phase of the magnetising current (two consecutive bursts represent one magnetising cycle through the hysteresis loop). However, Figure 11 shows the marked asymmetry in the shape as well as the magnitude of MBN pulses for ε = 15% in RD and magnetising voltage 5V. The different magnitudes of MBN pulses result in the different rms values of the MBN signal in the RD at lower ε, as Figure 12a shows (the errors bars in this figure indicate the difference between two consecutive bursts). Figure 12b shows the pure difference between the rms value of positive and negative bursts. It can be clearly seen that the asymmetry in MBN (rms) vanishes at higher ε as well as along with the increasing magnetising angle. The TD direction exhibits nearly zero asymmetry, and this effect dominates in the RD.
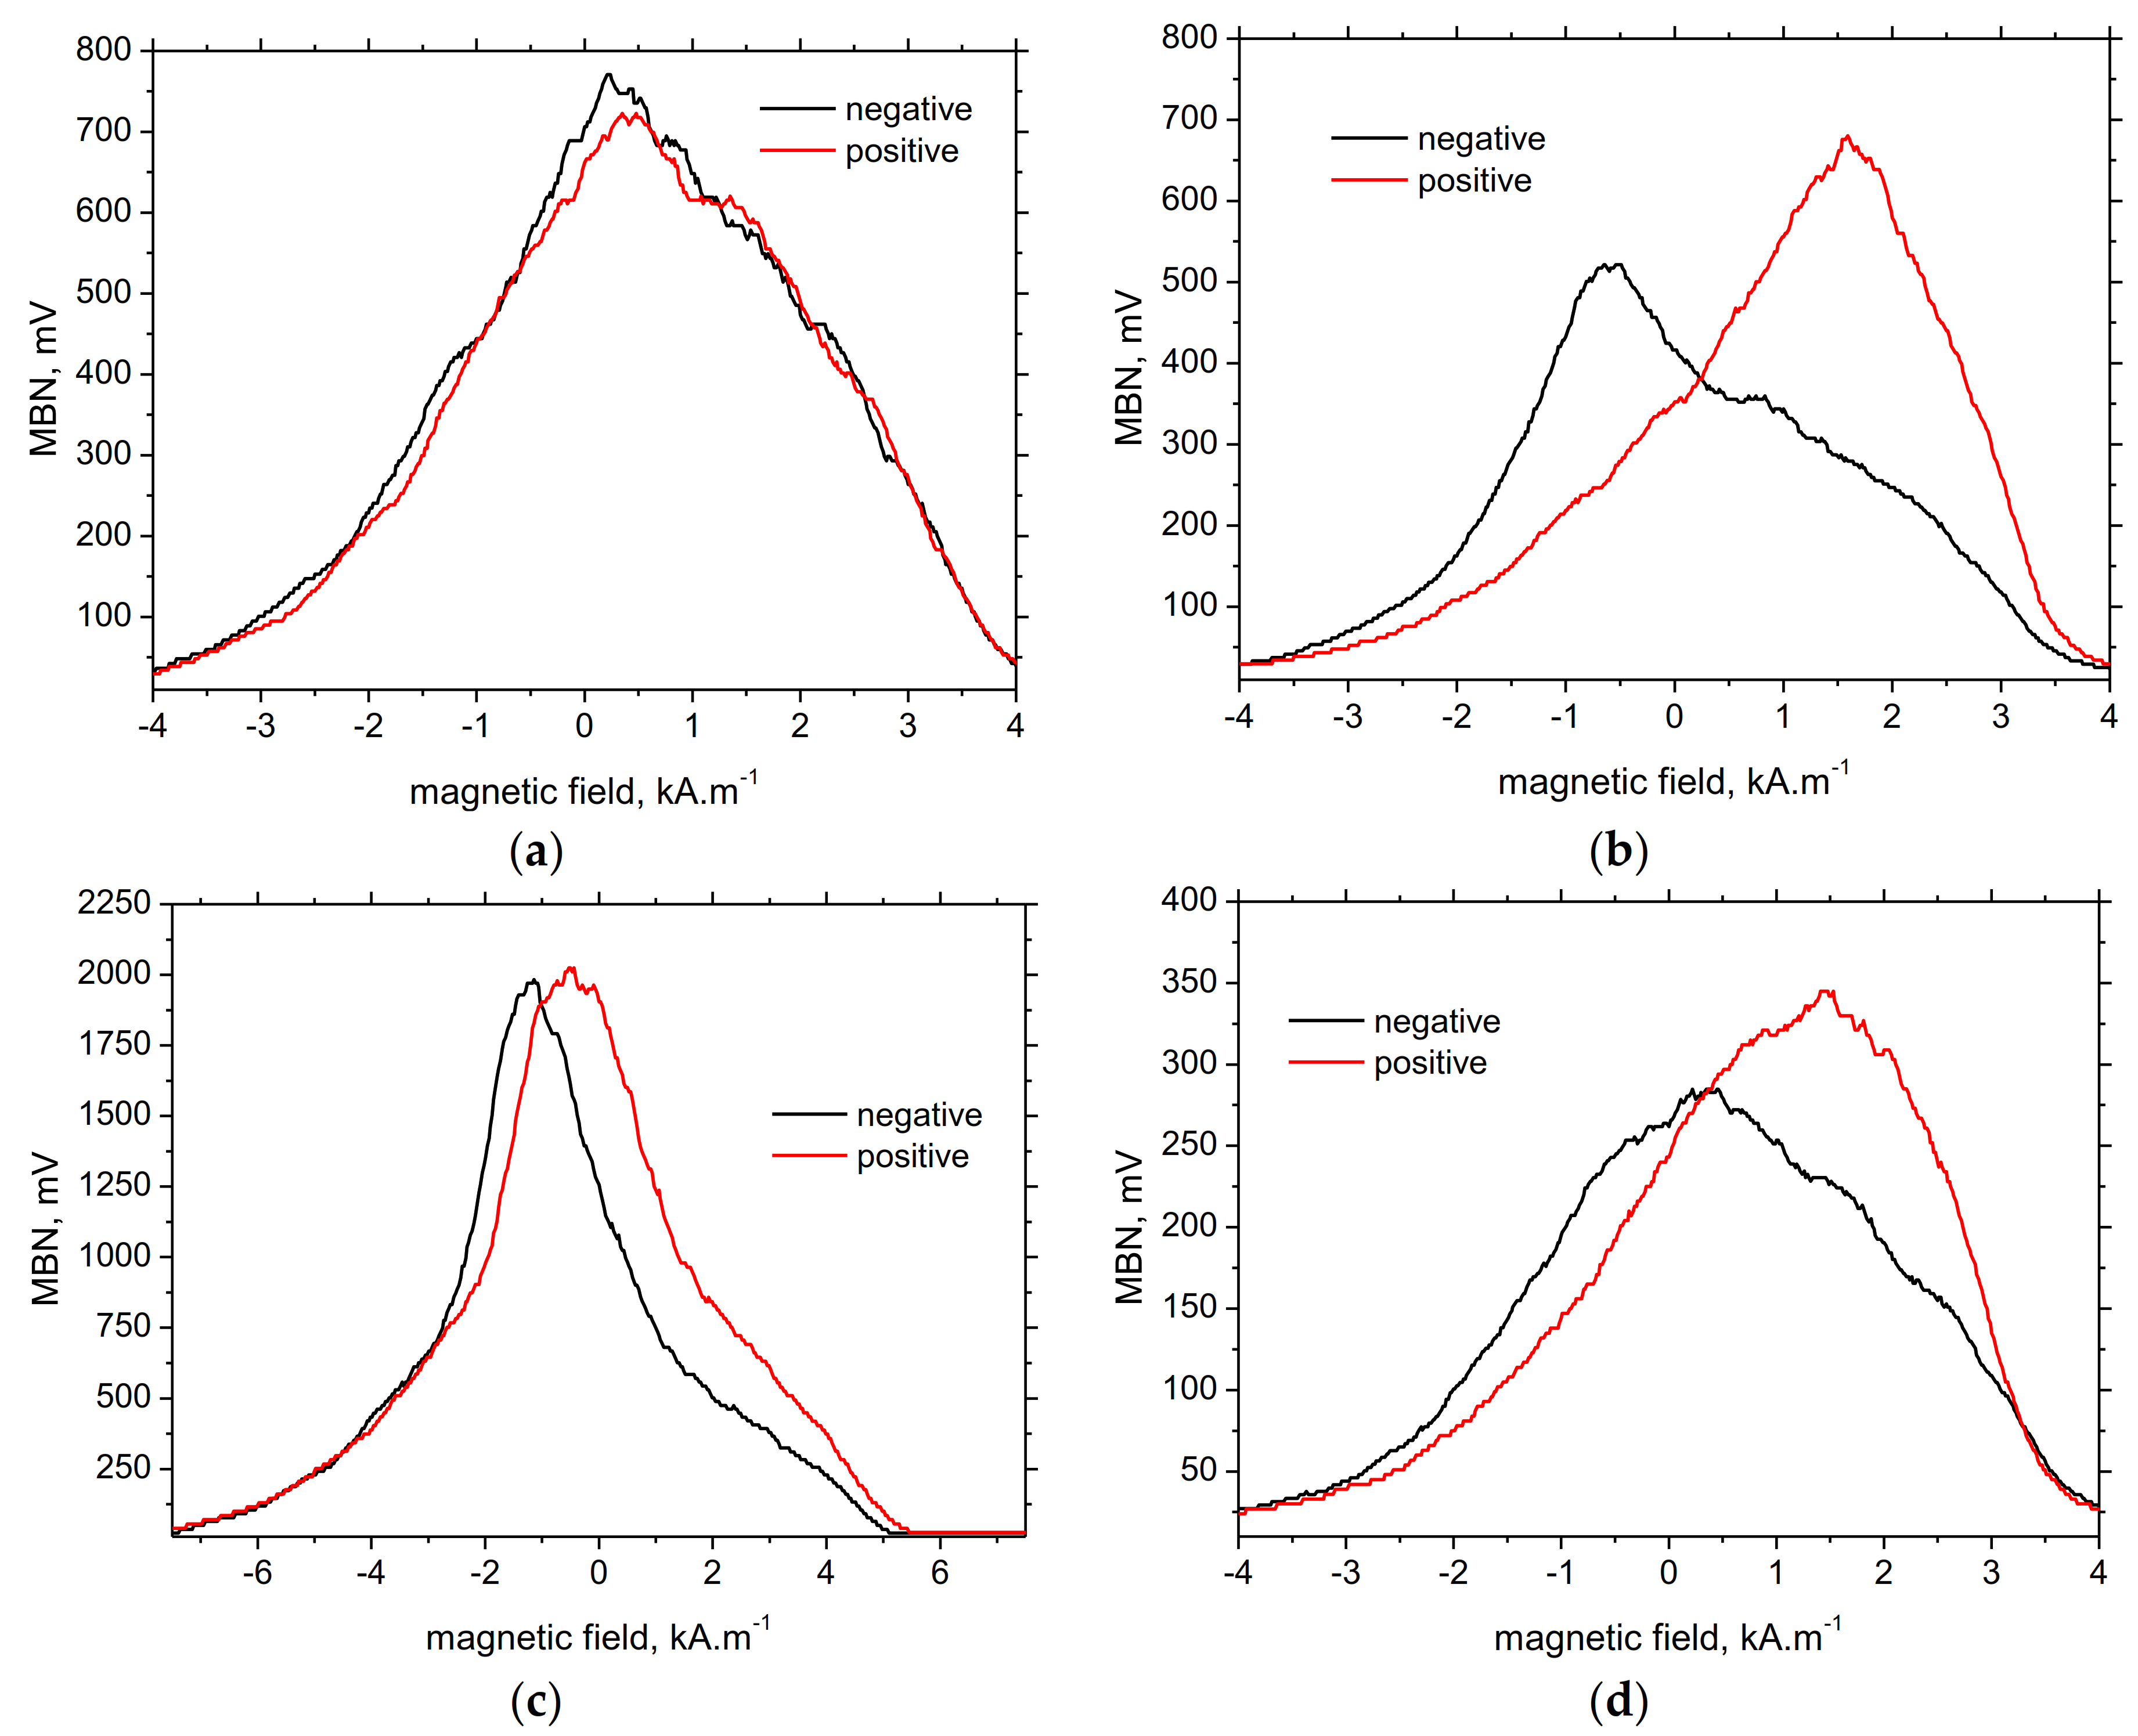
Much pronounced asymmetry in MBN can be found with respect to PP, as Figure 13 and Figure 14 illustrate. The height and position of the MBN envelopes is nearly the same for ε = 2.5%, whereas the positive envelope for ε = 15% is shifted to the markedly higher magnetic field, as opposed to the negative one. Moreover, the height of the negative envelopes is lower, which is quite surprising since the shift of the MBN envelope to the stronger magnetic fields is usually linked with its lower height, and vice versa [4,29].
Figure 13d and Figure 14 depict that the asymmetry in the MBN envelope’s positions and the corresponding PP drops down along with ε (as well as with the magnetising angle). Moreover, Figure 14 illustrates a quite interesting phenomenon when PP for the positive magnetisation grows abruptly as soon as the elastic straining is replaced by the plastic one, and remains untouched with further plastic straining ε. On the other hand, PP for the negative magnetisation is shifted to the lower magnetic fields at lower ε, and grows progressively with ε.
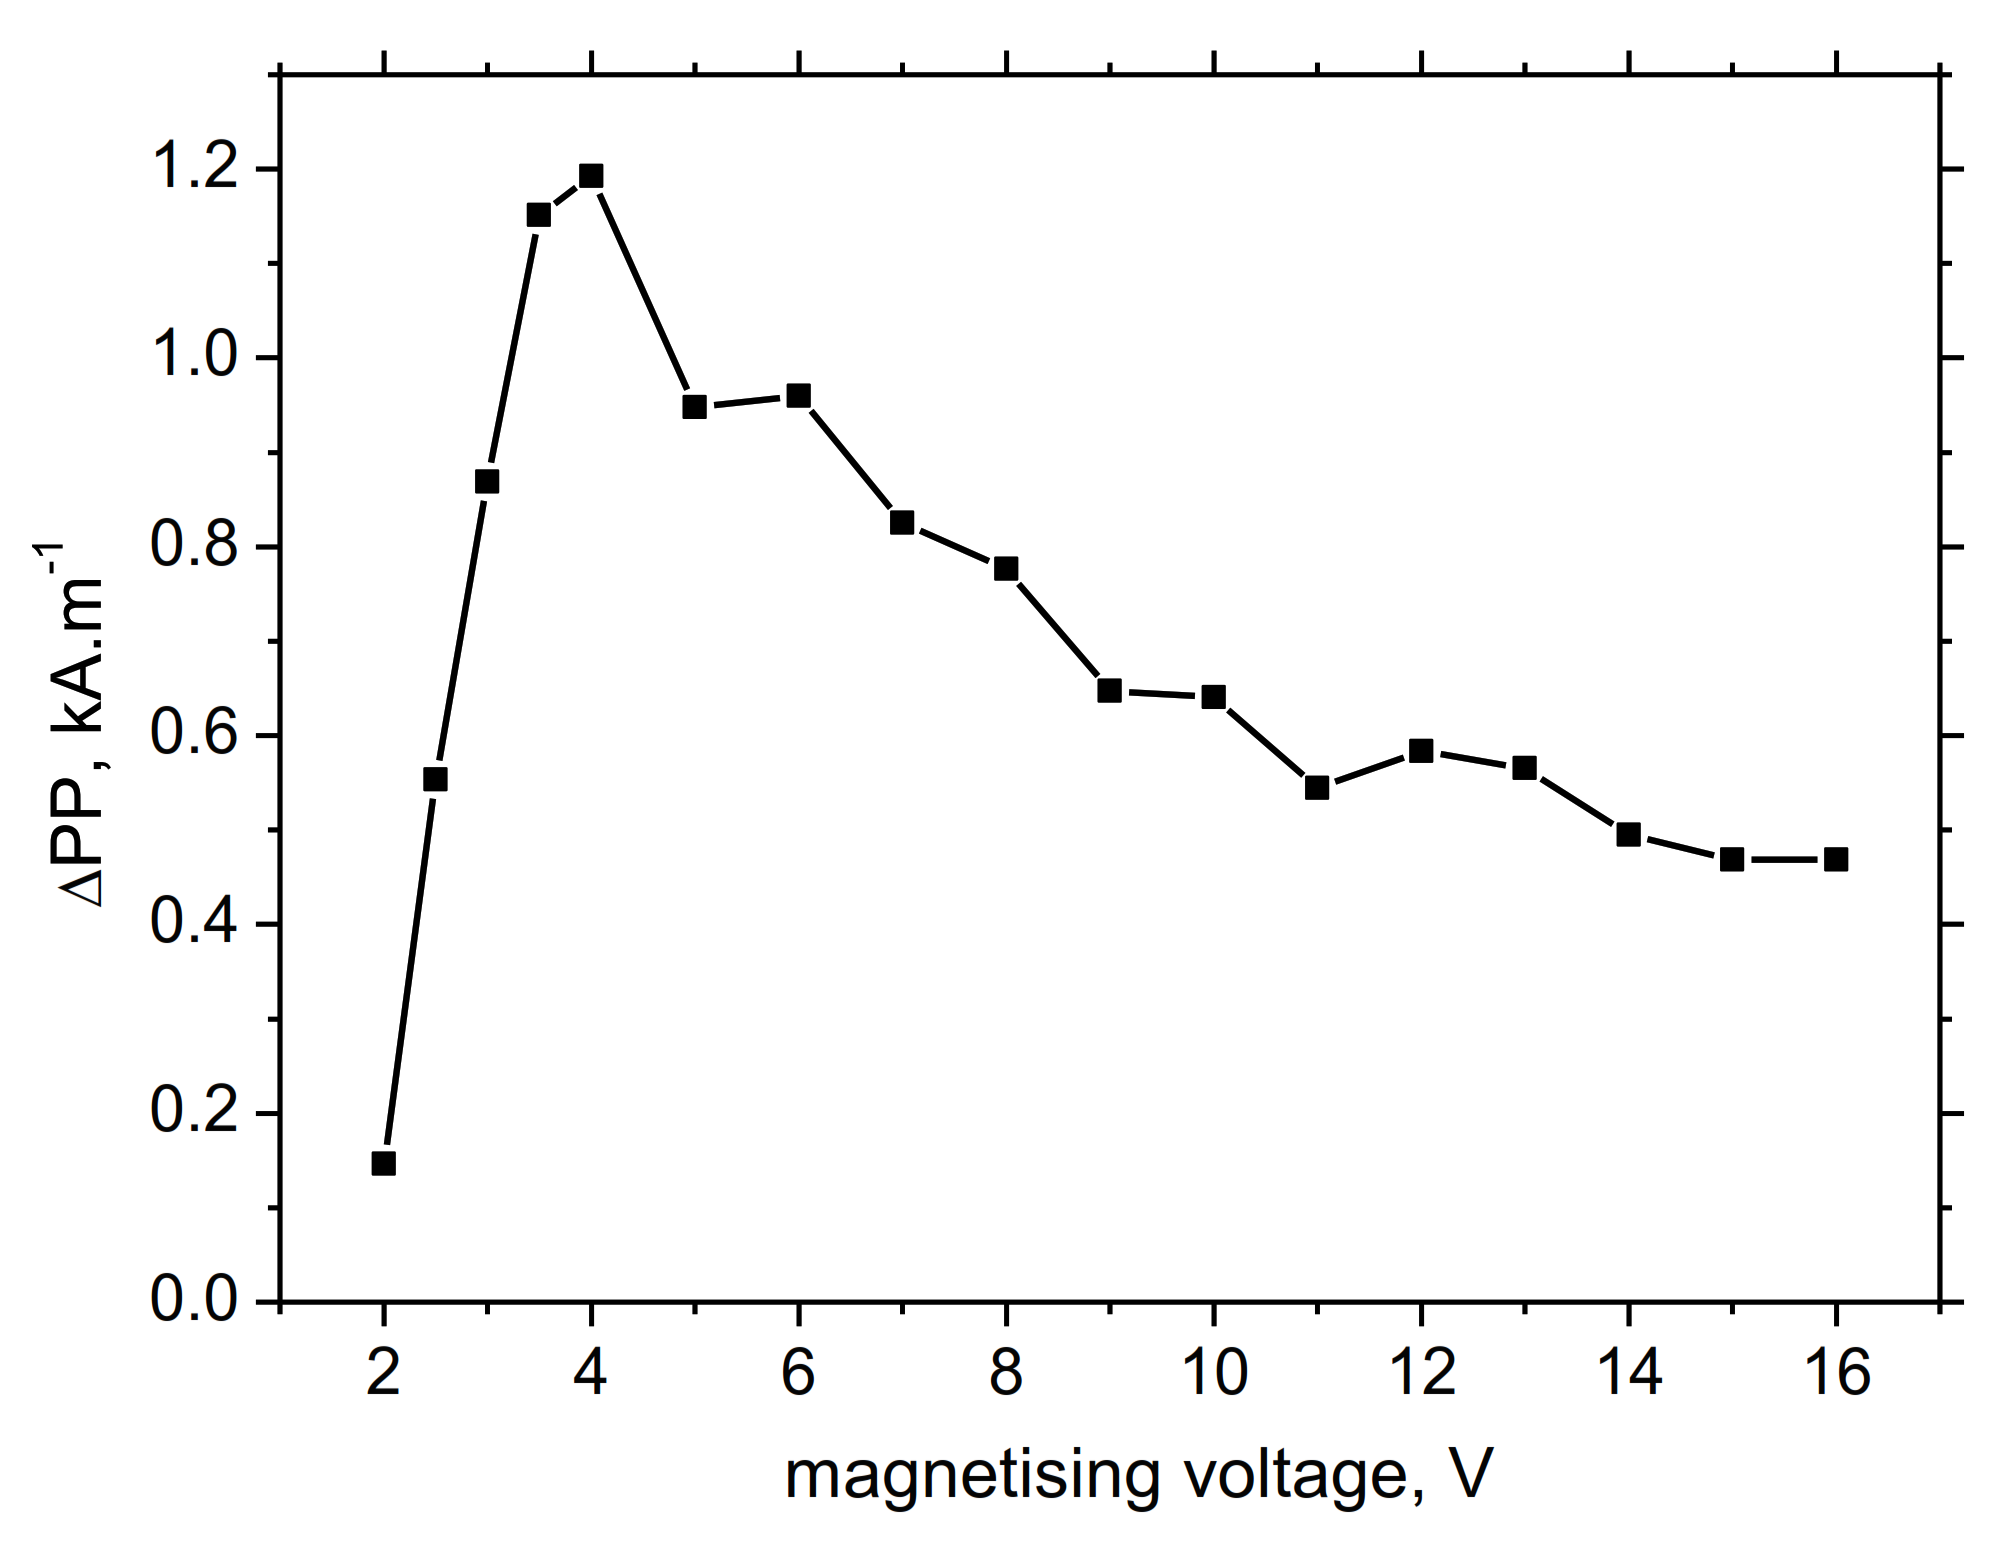
Figure 13b,c and Figure 15 demonstrate that the degree of MBN asymmetry, expressed as the difference in PP between the positive and negative magnetisation ΔPP, is also a function of magnetising voltage and the corresponding dH/dτ. Magnetising voltage as well as frequency were optimised in the preliminary phase of experiments by the use of voltage and frequency sweeps [32,33]. On the one hand, these magnetising conditions provide maximum sensitivity of MBN technique with respect of the investigated body. However, the remarkable asymmetry in MBN can be obtained just at these optimised conditions (see Figure 15) at a magnetising voltage near 4V, followed by a decrease along with increasing magnetising voltage. It is also worth to mention that the aforementioned asymmetry does not vanish entirely, but noticeably remains even at the strongest magnetic fields produced by the sensor.
The origin of the MBN asymmetry is driven by the non-homogenous character of plastic straining with respect of the neighbouring grains. Dislocation shearing at lower ε is initiated in those grains having suitable orientation against the direction of the load, according to the Schmid law (the shear stress attains a maximum when the angle between the direction of loading and crystallographic orientation is about 45° [34]). Figure 4 illustrates that the crystallographic orientation inside the grains varies. However, the dislocation straining is non-homogenous, as Figure 6b,c indicate. Therefore, the heavily strained grains of high dislocation density and the corresponding magnetic hardness are neighbours with the unaffected ones of low dislocation density and lower magnetic hardness. MBN asymmetry is therefore a product of magnetic coupling between the grains of variable magnetic hardness.
Asymmetry in MBN under the weaker magnetising fields is due to magneto-coupling between the heavily strained and softer unaffected grains. Applying the theory of Rivas et al. [22] about magnetic coupling, it can be reported that the heavily strained grains produce the magnetostatic field in the unaffected ones, for instance, negative (no matter whether the applied field is positive or negative). This hinders the positive saturation and favours the negative one. A graphical illustration further explaining the aforementioned effect can be found in [18,22]. The sample history with respect to its magnetic anisotropy in the RD plays a significant role since the aforementioned effect occurs in the RD only, and vanishes towards the TD.
Figure 12 and Figure 13 illustrate that the maximum degree of MBN asymmetry expressed in ΔMBN or/and ΔPP can be found for ε = 5–15%, followed by a progressive decrease. The extent of the plastic straining for ε = 5–15% is limited to those grains having suitable crystallographic orientation, grains shape, and misorientation angle, and the grains’ average misorientation alterations are quite limited and a marked non-homogeneity in dislocation density among the grains is considered. As soon as ε exceeds 15%, dislocation straining in the plastically strained grains is more or less fully consumed, dislocation motion is transferred into grains of less suitable crystallographic orientation (unaffected by the previous tension), and the MBN asymmetry tends to vanish due to the decreasing degree in the grain straining non-homogeneity. Expressed in other words, the higher degree of MBN asymmetry can be found when the character of plastic deformation (with respect of the neighbouring grains) is only local, and the average degree of plastic straining is low. This statement proves that the evolution of the specific aspects obtained from the XRD and EBSD techniques when the region of ε = 5–15% strongly coincides with:
-
medium or nearly no alterations of the crystallite size and micro-deformation (see Figure 1),
-
nearly untouched grain size distribution (no valuable grains elongation) and the average grain size (see Figure 4 and Figure 5),
-
and finally, the less-affected grains misorientation (see Figure 7).
Finally, the influence of magnetising voltage and the corresponding dH/dτ should be explained. Figure 13b,c and Figure 15 depict that the degree of MBN asymmetry attains a maximum near the magnetising voltage 4V. The MBN asymmetry tends to vanish at lower voltages since the weaker magnetic field is not capable of unpinning DWs in either the heavily strained or the unaffected grains. For this reason, the MBN signal is quite weak and the MBN asymmetry is lost. The medium voltages (4–5 V) provide a strong contrast between the easily unpinned DWs in non-strained grains and DWs strongly pinned due to high dislocation density in the heavily strained grains (discussed above). Finally, the high voltages and stronger dH/dτ tend to unpin the more homogenous DWs across the whole matrix. Therefore, the degree of MBN asymmetry drops down along with the magnetising voltage; however, it does not vanish entirely (see Figure 15).

4. Conclusions

The main findings of this study can be summarised as follows:
-
progressively developed ε markedly alters the magnetic anisotropy of S235 steel and makes the TD the easy axis of magnetisation due to the preferential crystallographic orientation in the TD,
-
MBN asymmetry becomes more apparent at the lower ε in the RD direction only, due to magnetic coupling between the heavily strained and the unaffected grains,
-
MBN asymmetry is more pronounced with respect to the PP of MBN envelopes as compared with the rms values of the MBN signal,
-
the degree of MBN asymmetry vanishes towards the TD as well as at higher ε,
-
the highest degree of MBN asymmetry can be found at the medium magnetising voltages as a result of good contrast between DWs unpinning in the different grains.
The MBN method may also be considered for the non-destructive diagnosis of structural failures in long-life vehicles, especially ships. As soon as the asymmetry in the consecutive bursts occurs, it is necessary to distinguish between the ascending and descending magnetisation when a suitable concept for monitoring of components is proposed (by the use of MBN technique).

Author Contributions

Conceptualization, M.P. and M.N.; methodology, M.N., P.M., and J.Č.; software, K.Z., M.J., and T.K.; validation, M.P. and K.Z.; formal analysis, M.J. and T.K.; investigation, M.P., M.N., P.M., and J.Č.; resources, M.P. and K.Z.; data curation, M.N. and P.M.; writing—original draft preparation, M.P., M.N., and K.Z.; writing—review and editing, M.P. and K.Z.; visualization, P.M. and J.Č.; supervision, M.P. and K.Z.; project administration, M.P. and K.Z.; funding acquisition, M.J. and J.Č. All authors have read and agreed to the published version of the manuscript.

Funding

This work was supported by the grant system of the University of Zilina no. 7905. This work was also supported by the project CZ.02.1.01/0.0/0.0/16_019/0000778 “Center for advanced applied science” within the Operational Program Research, Development and Education supervised by the Ministry of Education, Youth and Sports of the Czech Republic.

Institutional Review Board Statement

Not applicable.

Informed Consent Statement

Informed consent was obtained from all subjects involved in the study.

Data Availability Statement

The raw data required to reproduce these findings cannot be shared easily due to technical limitations (especially MBN raw signals are too large due to very high sampling frequency). However, authors can share the data on any individual request (please contact the corresponding author by the use of its mailing address.

Conflicts of Interest

The authors declare no conflict of interest.

References

  1. Jiles, D. Introduction to Magnetism and Magnetic Materials, 3rd ed.; Taylor & Francis Group: New York, NY, USA, 2016. [Google Scholar]
  2. Varga, R. Domain Walls and Their Dynamics, 1st ed.; Pavol Jozef Šafárik University: Košice, Slovakia, 2014. [Google Scholar]
  3. Chikazumi, S. Physics of Ferromagnetism, 2nd ed.; Oxford University Press: Oxford, UK, 2005. [Google Scholar]
  4. Čížek, J.; Neslušan, M.; Čilliková, M.; Mičietová, A.; Melikhova, O. Modification of steel surfaces induced by turning: Non-destructive characterization using Barkhausen noise and positron annihilation. J. Phys. D Appl. Phys. 2014, 47, 1–17. [Google Scholar] [CrossRef]
  5. Bayramoglu, S.; Gür, C.H.; Alexandrov, I.V.; Abramova, M.M. Characterization of ultra-fine grained steel samples produced by high pressure torsion via magnetic Barkhausen noise analysis. Mater. Sci. Eng. A 2010, 527, 927–933. [Google Scholar] [CrossRef]
  6. Vértesy, G.; Gasparics, A.; Griffin, J.M.; Mathew, J.; Fitzpatrick, M.E.; Uytdenhouwen, I. Analysis of Surface Roughness Influence in Non-Destructive Magnetic Measurements Applied to Reactor Pressure Vessel Steels. Appl. Sci. 2020, 10, 8938. [Google Scholar] [CrossRef]
  7. Yamaura, S.; Furuya, Y.; Watanabe, T. The effect of grain boundary microstructure on Barkhausen noise in ferromagnetic materials. Acta Mater. 2001, 49, 3019–3027. [Google Scholar] [CrossRef]
  8. Neslušan, M.; Čížek, J.; Kolařík, K.; Minárik, P.; Čilliková, M.; Melikhová, O. Monitoring of grinding burn via Barkhausen noise emission in case-hardened steel in large-bearing production. J. Mater. Process. Technol. 2017, 240, 104–117. [Google Scholar] [CrossRef]
  9. Neslušan, M.; Bahleda, F.; Minárik, P.; Zgútová, K.; Jambor, M. Non-destructive monitoring of corrosion extent in steel rope wires via Barkhausen noise emission. J. Magn. Mater. 2019, 484, 179–187. [Google Scholar] [CrossRef]
  10. Sorsa, A.; Santa-Aho, S.; Wartiainen, J.; Souminen, L.; Vippola, M.; Leviskä, K. Effect of shot peening parameters to residual stress profiles and Barkhausen noise. J. Non-Destruct. Eval. 2018, 37, 1–11. [Google Scholar] [CrossRef] [Green Version]
  11. Hang, C.; Liu, W.; Wang, P. A Method of Barkhausen Noise Feature Extraction Based on an Adaptive Threshold. Appl. Sci. 2019, 9, 2964. [Google Scholar] [CrossRef] [Green Version]
  12. Neslušan, M.; Jurkovič, M.; Kalina, T.; Pitoňák, M.; Zgútová, K. Monitoring of S235 steel over-stressing by the use of Barkhausen noise technique. Eng. Fail. Anal. 2020, 117, 104843. [Google Scholar] [CrossRef]
  13. White, S.A. A Barkhausen Noise Testing System for CANDU® Feeder Pipes. Ph.D. Thesis, Queen’s University, Kingston, ON, Canada, 2009. [Google Scholar]
  14. Neslušan, M.; Trško, L.; Minárik, P.; Čapek, J.; Bronček, J.; Pastorek, F.; Čížek, J.; Moravec, J. Non-destructive evaluation of steel surface after severe plastic deformation via Barkhausen noise technique. Metals 2018, 8, 1029. [Google Scholar] [CrossRef] [Green Version]
  15. Kleber, X.; Vincent, A. On the role of residual internal stresses and dislocations on Barkhausen noise in plastically deformed steel. NDTE Int. 2004, 37, 439–445. [Google Scholar] [CrossRef]
  16. Šrámek, J.; Neslušan, M.; Bahleda, F.; Zgútová, K.; Schenk, P. Influence of sample size and magnetizing voltage on Barkhausen noise during bending and uniaxial tensile test. Acta Phys. Pol. A 2020, 137, 640–643. [Google Scholar] [CrossRef]
  17. Haušild, P.; Kolařík, K.; Karlík, M. Characterization of strain-induced martensitic transformation in A301 stainless steel by Barkhausen noise measurement. Mater. Des. 2013, 44, 548–554. [Google Scholar] [CrossRef]
  18. Čilliková, M.; Mičietová, A.; Čep, R.; Neslušan, M.; Kejzlar, P. Asymmetrical Barkhausen noise of a hard milled surface. Materials 2021, 14, 1293. [Google Scholar] [CrossRef]
  19. Manh, T.L.; Caleyo, F.; Hallen, J.M.; Espina-Hernández, J.H.; Pérez-Benitez, J.A. Model for the correlation between magnetocrystalline energy and Barkhausen noise in ferromagnetic materials. J. Magn. Magn. Mater. 2018, 454, 155–164. [Google Scholar] [CrossRef]
  20. Ducharne, B.; Tene Deffo, Y.A.; Tsafack, P.; Nguedjang Kouakeuo, S.H. Directional magnetic Barkhausen noise measurement using the magnetic needle probe method. J. Magn. Magn. Mater. 2021, 519, 167453. [Google Scholar] [CrossRef]
  21. Neslušan, M.; Trojan, K.; Haušild, P.; Minárik, P.; Mičietová, A.; Čapek, J. Monitoring of components made of duplex steel after turning as a function of flank wear by the use of Barkhausen noise emission. Mater. Charact. 2020, 169, 110587. [Google Scholar] [CrossRef]
  22. Rivas, M.; Martinéz-García, J.C.; Škorvánek, I.; Švec, P.; Gorria, P. Magnetostatic interaction in soft magnetic bilayer ribbons unambiguously identified by first-order reversal curve analysis. Appl. Phys. Lett. 2015, 107, 132240. [Google Scholar] [CrossRef] [Green Version]
  23. Ribárik, G.; Ungár, T.; Gubicza, J. MWP-fit: A program for multiple whole-profile fitting of diffraction peak profiles by ab initio theoretical functions. J. Appl. Crystallogr. 2001, 34, 669–676. [Google Scholar] [CrossRef] [Green Version]
  24. Ribárik, G.; Ungár, T. Characterization of the microstructure in random and textured polycrystals and single crystals by diffraction line profile analysis. Mater. Sci. Eng. A 2010, 528, 112–121. [Google Scholar] [CrossRef]
  25. Scardi, P.; Leoni, M. Whole powder pattern modeling. Acta Crystallogr. A 2002, 58, 190–200. [Google Scholar] [CrossRef] [PubMed]
  26. Matěj, Z.; Kužel, R.; Nichtová, L. XRD total pattern fitting applied to study of microstructure of TiO2 films. Powder Diffr. 2010, 25, 125–131. [Google Scholar] [CrossRef]
  27. Ayers, J.E. The measurement of threading dislocation densities in semiconductor crystals by X-ray diffraction. J. Cryst. Growth 1994, 135, 71–77. [Google Scholar] [CrossRef]
  28. Ungár, T.; Borbély, A. The effect of dislocation contrast on x-ray line broadening: A new approach to line profile analysis. Appl. Phys. Lett. 1996, 69, 21. [Google Scholar] [CrossRef]
  29. Cullity, B.D.; Graham, C.D. Introduction to the Magnetic Materials, 2nd ed.; IEEE Press: Piscataway, NJ, USA, 2009. [Google Scholar]
  30. Čilliková, M.; Uríček, J.; Neslušan, M.; Ballo, V.; Mičietová, A. Monitoring of thermal damage after deposition of coatings via Barkhausen noise technique. Acta Phys. Polonica A 2020, 137, 637–640. [Google Scholar] [CrossRef]
  31. Neslušan, M.; Minárik, P.; Grenčík, J.; Trojan, K.; Zgútová, K. Non-destructive evaluation of the railway wheel surface damage after long-term operation via Barkhausen noise technique. Wear 2019, 420–421, 195–206. [Google Scholar] [CrossRef]
  32. Santa-Aho, S.; Vippola, M.; Sorsa, A.; Leiviskä, K.; Lindgren, M.; Lepistö, T. Utilization of Barkhausen noise magnetizing sweeps for case-depth detection from hardened steel. NDT&E Int. 2012, 52, 95–102. [Google Scholar] [CrossRef]
  33. MicroScan 600 Operating Instructions Manual V.5.4b (2015-0-06); Stresstech Group: Jyväskylä, Finland.
  34. Smallman, R.E. Modern Physical Metallurgy, 4th ed.; Butterworth-Heinemann: Oxford, UK, 1985. [Google Scholar] [CrossRef]
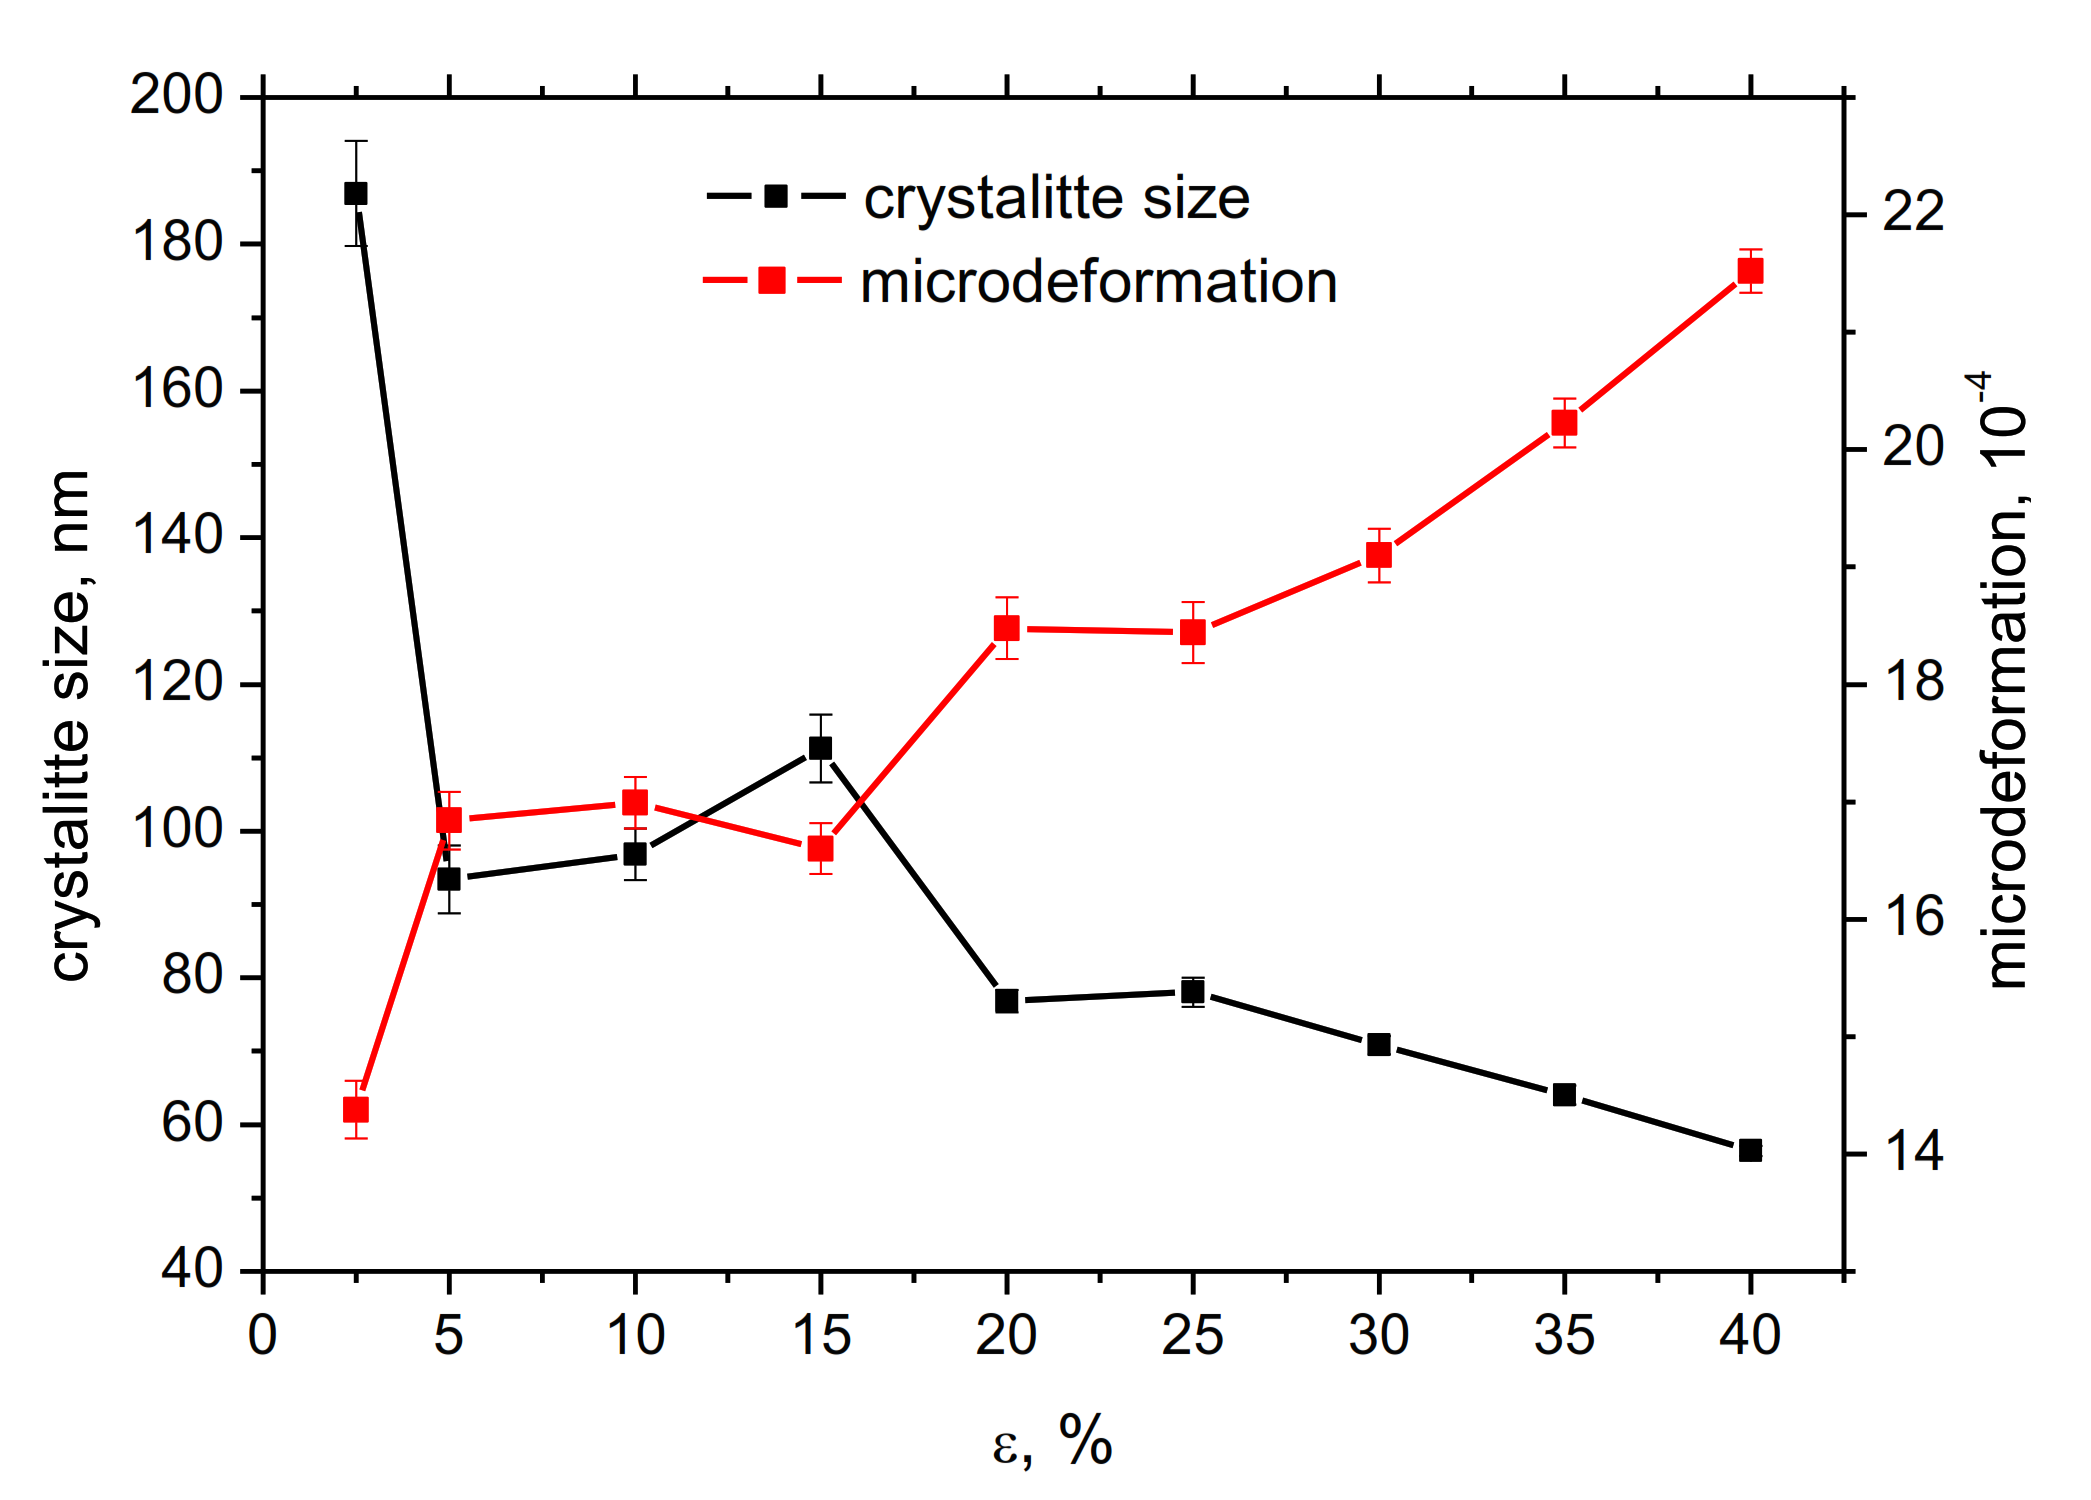
Figure 1. Crystallite size and micro-deformation as a function of ε.
Applsci 11 03600 g001
Figure 2. XRD pole figures. (a) ε = 2.5%, (b) ε = 15%, (c) ε = 30%, (d) ε = 40%.
Applsci 11 03600 g002aApplsci 11 03600 g002b
Figure 3. Orientation distribution functions in the φ1 = 0° (left) and φ2 = 45° (right), where □: rotation cubic, ◊: {111}<123> and ●: Goss texture components. (a) ε = 2.5%, (b) ε = 15%, (c) ε = 30%, (d) ε = 40%.
Applsci 11 03600 g003aApplsci 11 03600 g003b
Figure 4. EBSD orientation maps. Tensile direction is horizontal. (a) ε = 2.5% (b) ε = 15%, (c) ε = 30%, and (d) ε = 40% samples.
Applsci 11 03600 g004
Figure 5. (a) Grain size distribution and (b) evolution of average grain size as a function of ε.
Applsci 11 03600 g005
Figure 6. Kernel average misorientation (KAM) maps calculated from EBSD data. (a) ε = 2.5%, (b) ε = 15%, (c) ε = 30%, and (d) ε = 40% samples.
Applsci 11 03600 g006
Figure 7. (a) Length fraction evolution of different boundary types as a function of ε and (b) normalised distribution of misorientation in the range of 0–5°.
Applsci 11 03600 g007
Figure 8. Angular dependence of magnetic Barkhausen noise (MBN) as a function of ε. (a) ε = 2.5 ÷ 15%, (b) ε = 20 ÷ 40%; 0° corresponds to the rolling direction (RD).
Applsci 11 03600 g008
Figure 9. Angular dependence of Peak Position (PP) as a function of ε. (a) ε = 2.5 ÷ 15%, (b) ε = 20 ÷ 40%; 0° corresponds to RD.
Applsci 11 03600 g009
Figure 10. MBN signal, ε = 2.5%, magnetising voltage 5V, magnetising angle 0° (RD).
Applsci 11 03600 g010
Figure 11. MBN signal, ε = 15%, magnetising voltage 5V, magnetising angle 0° (RD).
Applsci 11 03600 g011
Figure 12. Asymmetry in MBN (rms values) between the positive and negative bursts. (a) Angular evolution of MBN with indicated error bars, (b) difference in MBN between the positive and negative bursts.
Applsci 11 03600 g012
Figure 13. MBN envelopes in RD. (a) ε = 2.5%, 5V, (b) ε = 15%, 5V, (c) ε = 15%, 10V, (d) ε = 40%, 5V.
Applsci 11 03600 g013
Figure 14. PP for the positive and negative bursts as a function of ε, 5V. (a) ε = 2.5%, (b) ε = 15%, (c) ε = 30%, (d) ε = 40%.
Applsci 11 03600 g014
Figure 15. Difference in PP between the positive and negative bursts as a function of magnetising voltage.
Applsci 11 03600 g015
Publisher’s Note: MDPI stays neutral with regard to jurisdictional claims in published maps and institutional affiliations.