Abstract
Accurate liver vessel segmentation is of crucial importance for the clinical diagnosis and treatment of many hepatic diseases. Recent state-of-the-art methods for liver vessel reconstruction mostly utilize deep learning methods, namely, the U-Net model and its variants. However, to the best of our knowledge, no comparative evaluation has been proposed to compare these approaches in the liver vessel segmentation task. Moreover, most research works do not consider the liver volume segmentation as a preprocessing step, in order to keep only inner hepatic vessels, for Couinaud representation for instance. For these reasons, in this work, we propose using accurate Dense U-Net liver segmentation and conducting a comparison between 3D U-Net models inside the obtained volumes. More precisely, 3D U-Net, Dense U-Net, and MultiRes U-Net are pitted against each other in the vessel segmentation task on the IRCAD dataset. For each model, three alternative setups that allow adapting the selected CNN architectures to volumetric data are tested, namely, full 3D, slab-based, and box-based setups are considered. The results showed that the most accurate setup is the full 3D process, providing the highest Dice for most of the considered models. However, concerning the particular models, the slab-based MultiRes U-Net provided the best score. With our accurate vessel segmentations, several medical applications can be investigated, such as automatic and personalized Couinaud zoning of the liver.
1. Introduction
Hepatic blood vessel disorders usually result from inadequate blood flow, whether into or out of the liver, induced by cirrhosis and other liver diseases (hepatocellular carcinoma—HCC, for instance). To help experts with diagnosis and treatment planning related to these diseases, accurate segmentation methods of the liver and inner vessels are in high demand in the clinical practice, whatever the image modalities used, such as CT (Computerized Tomography), MRI (Magnetic Resonance Imaging), or ultrasound imaging (US). The Couinaud representation of the liver is another important feature of clinicians’ interest for locating tumors or surgical planning. The evolution of computer science in research on image segmentation has revealed interest in the reconstruction and interpretation of these complex organic structures [1,2]. Their robust extraction from biomedical images requires good acquisition during an imaging examination and advanced image analysis developments.
In recent years, Deep Learning (DL) has been increasingly applied in different areas [3,4,5,6]. In particular, deep neural models have been proposed in order to segment the hepatic anatomy [2,7,8]. From this literature, the U-Net model [9] and its extensions stand out as the most relevant for this task. In particular, 3D U-Net captures the volumetric features of organs within medical images. This model is an extension of the 3D FCN [10] (Fully Convolutional Neural network), which suffers from high computational cost and GPU memory consumption. To address these issues, the 3D U-Net architecture was proposed, and is effective even with a limited image dataset.
To the best of our knowledge, no comparative evaluation has been proposed to develop the best 3D U-Net-based approaches for segmenting the liver volume and hepatic vessels. In general, authors focus either on the liver for future diagnosis analysis (e.g., tumor detection) or on the vessels, without taking the parenchymal volume as a region of interest. However, this question is of high importance for several computer-aided medical applications, involving the Couinaud representation of the liver for instance [11,12]. As a consequence, we first use an efficient Dense U-Net algorithm in order to segment the liver, so we can then calculate inner vascular extraction. Hence, our study proposes constructing the optimal segmentation pipeline for liver anatomy by comparing the accuracy of three 3D DL architectures: 3D U-Net, 3D Dense U-Net, and 3D MultiRes U-Net [13].
The paper is organized as follows. First, state-of-the-art works on liver and vessel segmentation are briefly reviewed in Section 2. Then, the description of the 3D setups considered when training/testing the CNN models and the description of the models themselves are given in Section 3 and Section 4, respectively. The results of testing the CNN models in the considered setups are presented in Section 5 and discussed in Section 6. Finally, Section 7 concludes the paper.
2. Related Works
2.1. Liver Volume Segmentation
Liver segmentation has attracted many algorithms with various approaches [8], such as graph-cuts, region growing, variational approaches (level-sets, etc.), or model-based techniques [11,14,15]. In recent years, many researchers developed DL methods to solve liver segmentation problems. Among the most widely used methods, various Convolutional Neural Networks (CNNs) have been proposed to learn feature representations for liver or liver lesion segmentation. Ben-Cohen et al. [16] proposed using Fully Convolutional Neural networks (FCN) for liver segmentation and liver-metastasis detection. They used three adjacent CT image slices to form a three-channel image to serve as input. Zhang et al. [17] trained an FCN for liver segmentation, then made a comparative study on the postprocessing step to refine their results. Christ et al. [18] proposed two cascaded FCNs to segment liver and tumors simultaneously. The final output was refined using a 3D conditional random field. Sun et al. [19] designed a multichannel FCN to segment liver tumors, the probability maps were generated by the feature fusion from different channels. Lu et al. [20] used a 3D CNN and a graph cut to refine their results. Qin et al. [21] proposed a superpixel-based CNN, which divides the CT-image into superpixels by aggregating pixels according to their intensity. They classify them into three classes—interior liver, liver boundary, and nonliver background—and utilized the CNN to predict the liver boundary. Kushnure et al. [22] proposed introducing multiscale features in the CNN that extract global and local features at a more granular level. Chlebus et al. [23] used a U-Net (architecture based on a FCN) in two models and filtered the false positives of tumor segmentation results by a random forest classifier. In [24], the authors proposed an improved U-Net model with a graph cutting. Jin et al. [25] presented a basic architecture as U-Net with the extraction of contextual information, which combine low-level feature maps with high-level ones. A hybrid method, namely, H-DenseUNet, presented by [26], combined 2D and 3D models to segment livers and liver tumors. Rafiei et al. [27] also used a 3D and 2D U-Net network to segment livers. The 3D encoding phase is for capturing 3D surfaces, while the 2D decoding phase reduces the complexity of the process.
2.2. Liver Vessels Segmentation
In order to perform blood vessel segmentation, as well as for liver segmentation, common methods exist such as region growing, thresholding, edge detection, pixel-based clustering, variational algorithms, or morphological approaches such as in [12,28,29,30].
Furthermore, methods for vessel segmentation have been developed with DL networks based on different imaging techniques (e.g., see the reviews [2,7]). Thomson et al. [31] introduced a reduced 3D U-Net for hepatic vessel reconstruction from US data, and obtained accurate vessel segmentation in true 3D and stacked 2D US images. Xu et al. [32] proposed a method for training liver vessel segmentation on noisy labels from contrast CT imaging. The authors of [33] developed a TopNet architecture, which is a multitask DL architecture for vessel tree reconstruction. The network architecture simultaneously solves the task of detecting voxels on vascular centerlines (i.e., nodes) and estimates connectivity between centervoxels (edges) in the tree structure to be reconstructed. Kitrungrotsakul et al. [34] proposed an automatic vessel segmentation approach that uses a multipathway DL network. The proposed framework learns a network for binary classification based on extracted training patches in three planes (sagittal, coronal, and transverse planes) of MRI images. Huang et al. [35] used U-Net with variant Dice loss functions for robust liver vessel extraction. In [36], the authors introduced an improved fuzzy connectedness method for automatic 3D liver vessel segmentation in CT scans. Mishra et al. [37] proposed a pipeline network comprising a convolutional neural network (CNN) followed by unsupervised clustering to perform vessel segmentation in hepatic US images. The authors of [38] segmented vessels from abdominal MRI images using an adaptive and reconstructive approach. Ibragimov et al. [39] proposed combining DL with anatomical analysis for automatic segmentation of the liver portal vein. They applied CNN to learn the consistent appearance patterns of the portal veins using a training set with reference annotations. Finally, Zeng et al. [40] proposed a solution for liver vessel segmentation based on an extreme learning machine tested on CT images.
3. Experimental Setup
3.1. Liver Segmentation
In our study, only the liver region was considered for the vessel segmentation task. To handle the segmentation of liver volume, we employed a Dense U-Net architecture similar to the one exposed in the next section. We followed a full 3D approach (see Figure 1a) and optimized the model through cross-validation by training with 19 volumes and testing on the remaining one from the IRCAD dataset. It should be noted that the 20 volumes have been resized as 512 × 512 × 120 voxels.
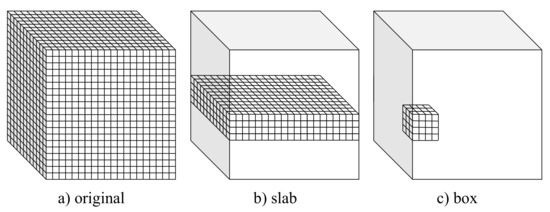
Figure 1.
Volumetric setups used for training and testing the considered U-Net-based CNN models.
3.2. Liver Vessel Segmentation
This study considered three alternative setups that allow adapting popular encoder–decoder CNN architectures to volumetric data. These setups, referred to as full 3D, slab-based, and box-based, are depicted in Figure 1 and described in detail in the following subsections. In all the considered setups, leave-one-out cross-validation was used to assess the model. Particularly, the models were trained on 19 volumes (with 3 volumes used for validation) and tested on the remaining one from the IRCAD dataset. The training–testing procedure was repeated 20 times, with different volumes used for testing. Finally, the results of all 20 experiments were averaged.
3.2.1. Full 3D Approach
In the full 3D setup, the models were trained using complete 3D liver volumes (cf., Figure 1a) to predict a vessel probability map for each input image. Each time, 19 volumes of size 512 × 512 × 120 voxels were used for training (with three volumes used for validation). Volumes with a number of slices smaller than 120 were extended to fix this size by adding zeros (zero padding).
A full 3D approach allows taking advantage of complete spatial information contained in a volume. However, it also results in limited train data and requires the heaviest computational workload. Both the slab-based setup and the box-based setup diminish these limitations at the cost of limiting spatial information to selected subvolumes.
3.2.2. Slab-Based Approach
In the slab-based setup, the models were trained with slabs, i.e., subvolumes comprising neighboring slices (cf., Figure 1b). At the prediction stage, the trained models were applied to consecutive overlapping slabs. The resulting model outputs in the overlapping regions were next averaged to produce the seamless vessel probability map.
In the experiments, we used 240 slabs in total. The slab size was 512 × 512 × 10 voxels. Slabs for training were sampled equally from the 19 train volumes, resulting in 120 slabs per train volume on average. For prediction, slabs overlapping by 2 slices were considered.
3.2.3. Box-Based Approach
The box-based setup is somewhat similar to a slab-based one. However, the subvolumes used for training the model comprise neighboring and connected voxels composing a box (cf., Figure 1c). The trained models were next applied to consecutive overlapping boxes at the prediction stage to produce a continuous edge probability map by averaging the model’s output in the overlapping regions.
In our experiments, we used 320,000 train boxes of size 32 × 32 × 32 voxels. The boxes for training were sampled randomly from the 19 train volumes, resulting in 17,000 boxes per volume on average. For prediction, boxes overlapping by 8 voxels in each direction were considered.
4. Models
In this study, we compared three popular U-Net-based architectures, namely, the basic U-Net proposed by [9], MultiRes U-Net [41], and Dense U-Net [30]. The original models, after extending them to the third dimension (see Figure 2), were used in the full 3D and slab-based setup. The details of the models are given in the following subsections, and the models’ hyperparameters are summarized in Table 1. Particularly, depth relates to the number of resolutions (poolings) implemented in the model, while dropout refers to the dropout rate in each dropout layer. The remaining parameters relate to the model training stage, and their names are self-explanatory.
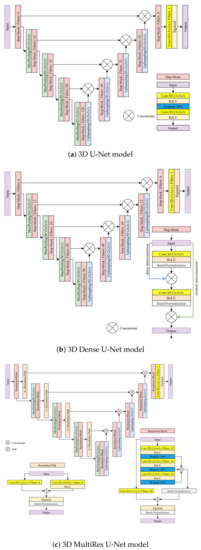
Figure 2.
The U-Net-based models considered in this study for full 3D and slab-based setups.

Table 1.
Model parameters on slabs and full volume.
For the box-based setup, the considered models needed to be reduced in terms of both depth and the number of filters in each layer. Such a change was imposed by the reduced input size. All amendments made to the considered U-Net-based models are also detailed in the following subsections. The models’ hyperparameters used in the box-based setup for each of the considered models are summarized in Table 2.
Table 2.
Model parameters on boxes.
4.1. 3D U-Net Model
The 3D U-Net model used for the full 3D and the slab-based setup comprises nine convolutional step blocks (see Figure 2a). Each convolutional step block contains two 3D convolutions of size 3 × 3 × 3 followed by the ReLU activation and a dropout layer with a rate of 20% between them to reduce overfitting. The contracting path consists of four convolutional step blocks, each followed by max-pooling 3D of size 2 × 2 × 1. The expanding path also consists of four step blocks, each followed by 3D upsampling of size 2 × 2 × 1. The feature maps outputted by upsampling operation are concatenated with the corresponding ones from the contracting path. Finally, the last convolutional step block is applied, followed by a 3D convolution of size 1 × 1 × 1. A sigmoid activation function is used to produce a final probability map.
To adapt the model to the box-based setup, the size of max-pooling and upsampling operations was changed from 2 × 2 × 1 to 2 × 2 × 2 to adapt the model to smaller input resolutions. Additionally, in the expanding path, the number of filters was reduced by half. Finally, the dropout rate was set to 25% to facilitate training.
4.2. 3D Dense U-Net Model
3D Dense U-Net is based on the original U-Net and 3D U-Net version. The architecture adds residual and dense interconnections between layers processed in convolutional step blocks (see Figure 2b). A single step block contains the 3D convolution of size 3 × 3 × 3 followed by the ReLU activation and the batch normalization layer with a momentum of 0.99. The output of this operation is concatenated with an input. Then, the process is repeated for the result of the previous concatenation. The contracting and expanding paths look the same as in the 3D U-Net model. The contracting path consists of four convolutional step blocks, each followed by 3D max-pooling of size 2 × 2 × 1. The expanding path also consists of four step blocks, each followed by 3D upsampling of size 2 × 2 × 1. The outputted feature maps by upsampling operation are concatenated with the corresponding ones from the contracting path. Finally, the last convolutional step block is applied, followed by a 3D convolution of size 1 × 1 × 1. A sigmoid activation is used to produce a final probability map.
To reiterate, the model above was used for two setups—the full 3D and the slab-based setups. Further, it was used for liver volume segmentation in the preprocessing step.
In the box-based set-up, a shallow version of the Dense U-Net was used to adapt the model to the smaller resolution of inputs. Particularly, both the number of filters and the depth of the model were reduced. The latter was reduced from four to three. The number of filters for the contracting and the expanding path was reduced from (6; 12; 24; 48; 96; 48; 24; 12; 6) to (2; 4; 8; 16; 8; 4; 2), respectively.
4.3. 3D MultiRes U-Net Model
3D MultiRes U-Net is based on the original U-Net and 3D U-Net version. However, the architecture is more complex. The model consists of nine resolution blocks and ten resolution paths.
The resolution path consists of two 3D convolutions with eight filters each. The first is of size 1 × 1 × 1, the second has a size of 3 × 3 × 3 and is followed by the ReLU activation. Then, the result of both operations is added and sigmoid activation followed by batch normalization is performed. The resolution block consists of three connected 3D convolutions, each of size 3 × 3 × 3, followed by the ReLU and dropout with a rate of 20% to reduce overfitting. The first convolution has 32 filters, and the next two have 16. Then, the result of those three operations is concatenated and, after batch normalization, is added to the 3D convolution of 1 × 1 × 1 with 64 filters, which are performed on the original input of the resolution block. Finally, sigmoid activation followed by batch normalization is performed. The contracting path consists of four resolution blocks, each followed by max-pooling of size 2 × 2 × 1 and resolution paths. The expansion also consists of four resolution blocks, each followed by upsampling of size 2 × 2 × 1. The outputted feature maps by upsampling operation are concatenated with the corresponding results of the resolution path from the contracting one. Finally, the last resolution block is applied, followed by a convolution 3D of size 1 × 1 × 1. A sigmoid activation is used to produce final probability maps (zero padding).
Similar to previous architectures, 3D MultiRes U-Net model as described above was also used in the full 3D and slab-based setup but needed to be adapted to the box-based setup. Particularly, the number of filters in a resolution block was reduced to a quarter from (32; 16; 16; 64) to (8; 4; 4; 16).
5. Results
5.1. Data
The performance of the studied U-Net-based models in the three considered setups were tested on the IRCAD dataset [42], a popular and publicly available benchmark for liver vessel segmentation.
The IRCAD dataset is composed of 20 CT scans (10 women and 10 men) in DICOM format with a variable number of slices ( voxels) and with hepatic tumors in 75% of cases. Binary masks of the venous system ground truth, performed by radiologists, are available within a dataset.
For training, Z was set to 120, which relates to the maximum number of slices within the considered liver volumes. Volumes with a number of slices smaller than 120 were extended to fix this size by zero padding.
5.2. Training Convergence
In Figure 3, we depict the learning behavior of the models tested by considering the Dice coefficient that we obtained for slab-based approaches, and the binary–cross-entropy loss for box-based ones (with a different sliding window averaging). For the sake of clarity, we chose these configurations to expose the accuracy and loss curves, but the following observations concern the other volumetric setups.
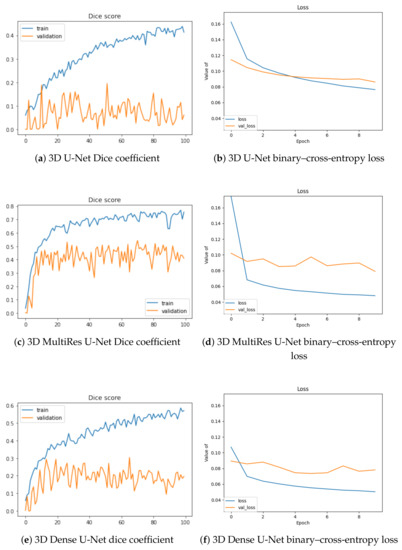
Figure 3.
Training and validation Dice values per epoch for slab-based models (a,c,e) and loss optimization for box-based models with sliding-window averaging (b,d,f).
The 3D U-Net stands as the least efficient architecture of our study, with the lowest Dice increase during training (approximately 0.4) and the highest loss (0.08) at the end of the training process. Moreover, its validation is the worst, without any significant increase during the optimization. The two other architectures lead to similar outcomes, with a better performance for the MultiRes U-Net, which reaches a Dice accuracy at 0.8 and loss value lower than 0.05. Validation accuracy is also optimized in a better way for this model.
5.3. Segmentation Results
For liver segmentation, we visualize the results obtained by the Dense U-Net model for several patients of the IRCAD dataset in Figure 4. Our comparative evaluation has led to the superiority of this architecture, compared to the two others, with an average Dice value of 0.903 for the whole dataset (and about 0.838 for the 3D U-Net for instance).
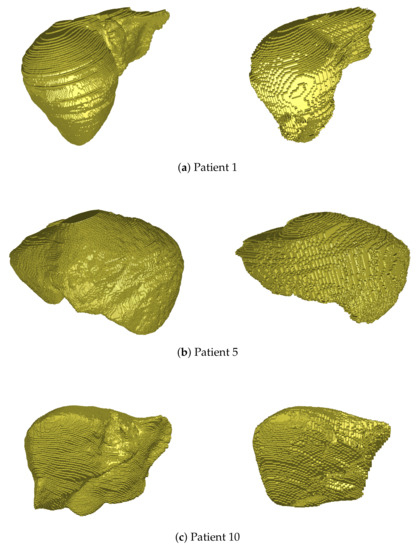
Figure 4.
3D views of liver volume segmentations obtained from several patients of the IRCAD dataset (right). For each case, the ground truth is also depicted (left).
As depicted in Figure 4, the hepatic volume is globally respected thanks to this segmentation, which permits then to consider only vessel extraction within the organ. Some geometrical details may not be detected during this process (see Patient 5, left part of the liver, or Patient 10, right part), but the accuracy of segmentation (90% Dice) is close to the best methods of the literature, and is sufficient to handle the rest of our pipeline.
The assessment of the vessel segmentation results was performed by means of the Dice score. The vessel probability maps output by the considered models were binarized with a global threshold of 0.5, cropped to the liver region, and then compared to the ground truth results provided within the IRCAD dataset. The average Dice scores resulting from the leave-one-out cross-validation are summarized in Table 3. The considered 3D setup is mentioned in the first column. The consecutive columns refer to the results of U-Net-based models considered in the experiments. Best scores (greater than 70%) are highlighted in bold face.
Table 3.
Dice score results on slabs and full volumes.
Sample visual results are shown in Figure 5. Presented results were obtained from the first patient of the IRCAD dataset using the full 3D setup. The latter setup was selected for presentation, since it performed best.
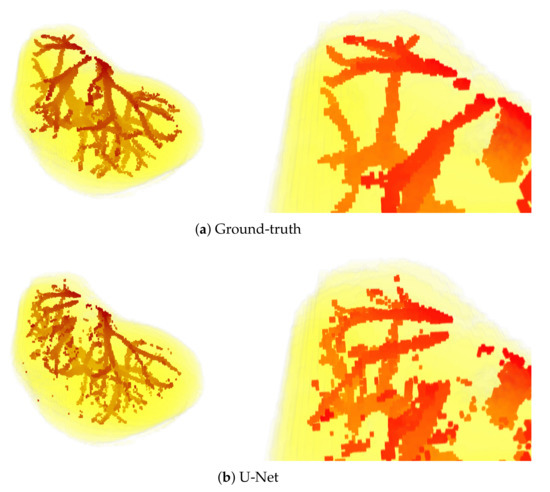
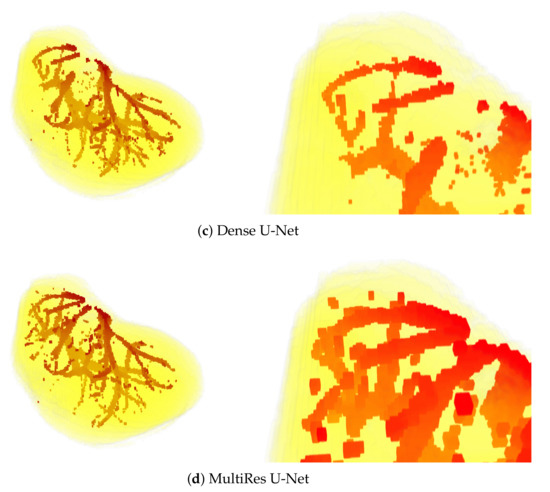
Figure 5.
3D views of segmentations obtained from the first patient of IRCAD dataset, with the full 3D volume approach. The upper part of the visualization is also zoomed in (bottom).
6. Discussion
The experimental results clearly show the differences between the performance of the considered models and the setups in which they were applied. The numerical results presented in Table 3 show that the most accurate results were obtained when using a full 3D setup. This manifests itself by the highest Dice scores obtained for each of the considered models. On the other hand, the box-based setup seems to be less accurate, with the lowest Dice scores. It is somehow surprising since the amount of training data was largest in the box-based setup. However, these experiments show that the completeness of the information contained in the smaller amount of the whole volumes is more beneficial to the model than a large number of pieces of information sliced in the boxes. Probably for these reasons, the full 3D setup performed visibly better than the competitive frameworks.
When the U-Net-based models are considered, MultiRes U-Net is the leader. This model performed best for all the considered setups, resulting in the most accurate segmentation for the slab-based approach. On the other hand, the original U-Net model performs worst, with the lowest Dice scores obtained for each of the considered frameworks. The training behavior observed in Figure 3 confirm the best performance of MultiRes U-Net.
The above observations are also confirmed by the visual results presented in Figure 5. Mainly, the results of the U-Net model are visibly most noisy, with many small regions distant and not connected to the main vessels (see Figure 5b). On the other hand, the best visual representation of the liver vessels is obtained from MultiRes U-Net. From Figure 5d, one can see that that the resulting vessels are larger and more continuous, with the lowest amount of noise. Further, MultiRes U-Net provides the best segmentation of the largest branches. This latter fact is a significant advantage to automatically build the Couinaud representation of the liver, which is commonly used by clinicians of various specialties to describe the locations of hepatic lesions.
However, MultiRes U-Net is the most expensive to train in terms of computer resources. In all considered setups, the time per epoch for this model was about twice as much as that of the U-Net model, and slightly longer than the time required by Dense U-Net.
7. Conclusions
This paper presented a comparative analysis of the three U-Net-based models in the liver vessel segmentation task. The analysis results clearly show that the leader in the considered task is a MultiRes U-Net, which provides the most accurate results in terms of the Dice coefficient.
When the 3D setups used for liver vessel segmentation are considered, the best performer is the full 3D approach, which provided the highest Dice scores for two of the three considered U-Net-based models. However, in our experiments, the slab-based setup used with the MultiRes U-Net performed the best.
The accurate vessel segmentations obtained in our work has several medical applications. For example, we could investigate the automatic and personalized Couinaud zoning of the liver. This process requires precise extraction of the first branches of hepatic vasculatures (portal vein and hepatic veins), which are very well reconstructed, as the visual inspections have shown in this article.
The results of liver vessel segmentation using the MultiRes U-Net are significant and promising. However, they could probably still be improved. The possible ways of improvement include adaptive thresholding applied for postprocessing of the predicted vessel probability maps. Additionally, instead of segmenting liver volume and liver vessels separately, as we did in this study, one model could be used for three-class segmentation to detect liver and vessels jointly. These issues will be considered in our future works.
Author Contributions
Conceptualization, A.V. and A.F.; Data curation, A.A. and A.K.; Formal analysis, A.A., A.K., A.V. and A.F.; Funding acquisition, A.V. and A.F.; Investigation, A.A., A.K., P.C., S.F. and M.-A.L.; Methodology, A.A., A.K., P.C. and S.F.; Project administration, A.V. and A.F.; Resources, A.A. and A.K.; Software, A.A., A.K., P.C. and S.F.; Supervision, A.V. and A.F.; Validation, A.A., A.K., P.C. and S.F.; Visualization, A.V.; Writing—original draft, M.-A.L., A.V. and A.F.; Writing—review & editing, A.V. and A.F. All authors have read and agreed to the published version of the manuscript.
Funding
This work was first financially supported by the “PHC Polonium” program of the French Ministry of Foreign Affairs and the Ministry of Higher Education and Research and the Polish National Agency for Academic Exchange (NAWA) with the Campus France Code 44833NE and NAWA code PPN/BFR/2019/1/00006/U/00001. This work was also funded by the French Agence Nationale de la Recherche (R-Vessel-X, grant ANR-18-CE45-0018).
Institutional Review Board Statement
Not applicable.
Informed Consent Statement
Not applicable.
Conflicts of Interest
The authors declare no conflict of interest.
References
- Zhang, H.; Bai, P.; Min, X.; Liu, Q.; Ren, Y.; Li, H.; Li, Y. Hepatic vessel segmentation based on animproved 3D region growing algorithm. J. Phys. Conf. Ser. 2020, 1486, 032038. [Google Scholar] [CrossRef]
- Ciecholewski, M.; Kassjański, M. Computational Methods for Liver Vessel Segmentation in Medical Imaging: A Review. Sensors 2021, 21, 2027. [Google Scholar] [CrossRef] [PubMed]
- Kwon, H.; Yoon, H.; Choi, D. Restricted Evasion Attack: Generation of Restricted-Area Adversarial Example. IEEE Access 2019, 7, 60908–60919. [Google Scholar] [CrossRef]
- Kwon, H.; Yoon, H.; Park, K.W. Acoustic-decoy: Detection of adversarial examples through audio modification on speech recognition system. Neurocomputing 2020, 417, 357–370. [Google Scholar] [CrossRef]
- Singh, N.K.; Raza, K. Medical Image Generation using Generative Adversarial Networks. arXiv 2020, arXiv:2005.10687. [Google Scholar]
- Zhao, Z.Q.; Zheng, P.; Xu, S.T.; Wu, X. Object Detection with Deep Learning: A Review. IEEE Trans. Neural Netw. Learn. Syst. 2019, 30, 3212–3232. [Google Scholar] [CrossRef] [PubMed]
- Affane, A.; Lebre, M.A.; Mittal, U.; Vacavant, A. Literature Review of Deep Learning Models for Liver Vessels Reconstruction. In Proceedings of the 2020 Tenth International Conference on Image Processing Theory, Tools and Applications (IPTA), Paris, France, 9–12 November 2020; pp. 1–6. [Google Scholar]
- Moghbel, M.; Mashohor, S.; Mahmud, R.; Saripan, M.I. Review of Liver Segmentation and Computer Assisted Detection/Diagnosis Methods in Computed Tomography. Artif. Intell. Rev. 2018, 50, 497–537. [Google Scholar] [CrossRef]
- Ronneberger, O.; Fischer, P.; Brox, T. U-Net: Convolutional Networks for biomedical image segmentation. In MICCAI; Springer: Cham, Swtizerland, 2015. [Google Scholar]
- Long, J.; Shelhamer, E.; Darrell, T. Fully convolutional networks for semantic segmentation. In Proceedings of the IEEE Conference on Computer Vision and Pattern Recognition (CVPR), Boston, MA, USA, 7–12 June 2015; pp. 3431–3440. [Google Scholar]
- Lebre, M.A.; Vacavant, A.; Grand-Brochier, M.; Strand, R.; Rosier, H.; Abergel, A.; Chabrot, P.; Magnin, B. A robust multi-variability model based liver segmentation algorithm for CT-scan and MRI modalities. Comput. Med. Imaging Graph. 2019, 76, 101635. [Google Scholar] [CrossRef]
- Lebre, M.A.; Vacavant, A.; Grand-Brochier, M.; Rositi, H.; Abergel, A.; Chabrot, P.; Magnin, B. Automatic segmentation methods for liver and hepatic vessels from CT and MRI volumes, applied to the Couinaud scheme. Comput. Biol. Med. 2019, 110, 42–51. [Google Scholar] [CrossRef]
- Müller, D.; Kramer, F. MIScnn: A framework for medical image segmentation with convolutional neural networks and deep learning. BMC Med. Imaging 2021, 21, 1–11. [Google Scholar] [CrossRef]
- Lu, X.; Xie, Q.; Zha, Y.; Wang, D. Fully automatic liver segmentation combining multi-dimensional graph cut with shape information in 3D CT images. Nat. Sci. Rep. 2018, 8, 10700. [Google Scholar] [CrossRef]
- Zeng, Y.; Zhao, Y.; Tang, P.; Liao, M.; Liang, Y.; Liao, S.; Zou, B. Liver vessel segmentation and identification based on oriented flux symmetry and graph cuts. Comput. Methods Prog. Biomed. 2017, 150, 31–39. [Google Scholar] [CrossRef]
- Ben-Cohen, A.; Diamant, I.; Klang, E.; Amitai, M.; Greenspan, H. Fully Convolutional Network for Liver Segmentation and Lesions Detection. In Deep Learning and Data Labeling for Medical Applications; Springer: Cham, Swtizerland, 2016. [Google Scholar]
- Zhang, Y.; He, Z.; Zhong, C.; Zhang, Y.; Shi, Z. Fully convolutional neural network with post-processing methods for automatic liver segmentation from CT. In Proceedings of the 2017 Chinese Automation Congress (CAC), Jinan, China, 20–22 October 2017; pp. 3864–3869. [Google Scholar]
- Christ, P.F.; Ettlinger, F.; Grün, F.; Elshaera, M.E.A.; Lipkova, J.; Schlecht, S.; Ahmaddy, F.; Tatavarty, S.; Bickel, M.; Bilic, P.; et al. Automatic liver and tumor segmentation of CT and MRI volumes using cascaded fully convolutional neural networks. arXiv 2017, arXiv:1702.05970. [Google Scholar]
- Sun, C.; Guo, S.; Zhang, H.; Li, J.; Chen, M.; Ma, S.; Jin, L.; Liu, X.; Li, X.; Qian, X. Automatic segmentation of liver tumors from multiphase contrast-enhanced CT images based on FCNs. Artif. Intell. Med. 2017, 83, 58–66. [Google Scholar] [CrossRef]
- Lu, F.; Wu, F.; Hu, P.; Peng, Z.; Kong, D. Automatic 3D liver location and segmentation via convolutional neural network and graph cut. Int. J. Comput. Assist. Radiol. Surg. 2017, 12, 171–182. [Google Scholar] [CrossRef]
- Qin, W.; Wu, J.; Han, F.; Yuan, Y.; Zhao, W.; Ibragimov, B.; Gu, J.; Xing, L. Superpixel-based and boundary-sensitive convolutional neural network for automated liver segmentation. Phys. Med. Biol. 2018, 63, 095017. [Google Scholar] [CrossRef]
- Kushnure, D.T.; Talbar, S.N. MS-UNet: A multi-scale UNet with feature recalibration approach for automatic liver and tumor segmentation in CT images. Comput. Med. Imaging Graph. 2021, 89, 101885. [Google Scholar] [CrossRef] [PubMed]
- Chlebus, G.; Schenk, A.; Moltz, J.; van Ginneken, B.; Hahn, H.; Meine, H. Automatic liver tumor segmentation in CT with fully convolutional neural networks and object-based postprocessing. Nat. Sci. Rep. 2018, 8, 15497. [Google Scholar] [CrossRef] [PubMed]
- Liu, Z.; Song, Y.Q.; Sheng, V.S.; Wang, L.; Jiang, R.; Zhang, X.; Yuan, D. Liver CT sequence segmentation based with improved U-Net and graph cut. Expert Syst. Appl. 2019, 126, 54–63. [Google Scholar] [CrossRef]
- Jin, Q.; Meng, Z.; Sun, C.; Cui, H.; Su, R. RA-UNet: A hybrid deep attention-aware network to extract liver and tumor in CT scans. Front. Bioeng. Biotechnol. 2020, 8, 1471. [Google Scholar] [CrossRef] [PubMed]
- Li, X.; Chen, H.; Qi, X.; Dou, Q.; Fu, C.W.; Heng, P.A. H-DenseUNet: Hybrid densely connected UNet for liver and tumor segmentation from CT volumes. IEEE Trans. Med. Imaging 2018, 37, 2663–2674. [Google Scholar] [CrossRef]
- Rafiei, S.; Nasr-Esfahani, E.; Najarian, K.; Karimi, N.; Samavi, S.; Soroushmehr, S.R. Liver segmentation in CT images using three dimensional to two dimensional fully convolutional network. In Proceedings of the 2018 25th IEEE International Conference on Image Processing (ICIP), Athens, Greece, 7–10 October 2018; pp. 2067–2071. [Google Scholar]
- Chung, M.; Lee, J.; Chung, J.W.; Shin, Y.G. Accurate liver vessel segmentation via active contour model with dense vessel candidates. Comput. Methods Prog. Biomed. 2018, 166, 61–75. [Google Scholar] [CrossRef]
- Lu, S.; Huang, H.; Liang, P.; Chen, G.; Xiao, L. Hepatic vessel segmentation using variational level set combined with non-local robust statistics. Magn. Reson. Imaging 2017, 36, 180–186. [Google Scholar] [CrossRef]
- Zeng, Y.Z.; Liao, S.H.; Tang, P.; Zhao, Y.Q.; Liao, M.; Chen, Y.; Liang, Y.X. Automatic liver vessel segmentation using 3D region growing and hybrid active contour model. Comput. Biol. Med. 2018, 97, 63–73. [Google Scholar] [CrossRef] [PubMed]
- Thomson, B.R.; Nijkamp, J.; Ivashchenko, O.; van der Heijden, F.; Smit, J.N.; Kok, N.F.; Kuhlmann, K.F.; Ruers, T.J.; Fusaglia, M. Hepatic vessel segmentation using a reduced filter 3D U-Net in ultrasound imaging. arXiv 2019, arXiv:1907.12109. [Google Scholar]
- Xu, M.; Wang, Y.; Chi, Y.; Hua, X. Training liver vessel segmentation deep neural networks on noisy labels from contrast CT imaging. In Proceedings of the 2020 IEEE 17th International Symposium on Biomedical Imaging (ISBI), Iowa City, IA, USA, 3–7 April 2020; pp. 1552–1555. [Google Scholar]
- Keshwani, D.; Kitamura, Y.; Ihara, S.; Iizuka, S.; Simo-Serra, E. TopNet: Topology Preserving Metric Learning for Vessel Tree Reconstruction and Labelling. In MICCAI; Springer: Cham, Swtizerland, 2020; pp. 14–23. [Google Scholar]
- Kitrungrotsakul, T.; Han, X.H.; Iwamoto, Y.; Lin, L.; Foruzan, A.H.; Xiong, W.; Chen, Y.W. VesselNet: A deep convolutional neural network with multi pathways for robust hepatic vessel segmentation. Comput. Med. Imaging Graph. 2019, 75, 74–83. [Google Scholar] [CrossRef]
- Huang, Q.; Sun, J.; Ding, H.; Wang, X.; Wang, G. Robust liver vessel extraction using 3D U-Net with variant dice loss function. Comput. Biol. Med. 2018, 101, 153–162. [Google Scholar] [CrossRef]
- Zhang, R.; Zhou, Z.; Wu, W.; Lin, C.C.; Tsui, P.H.; Wu, S. An improved fuzzy connectedness method for automatic three-dimensional liver vessel segmentation in CT images. J. Healthc. Eng. 2018, 2018, 2376317. [Google Scholar] [CrossRef]
- Mishra, D.; Chaudhury, S.; Sarkar, M.; Manohar, S.; Soin, A.S. Segmentation of vascular regions in ultrasound images: A deep learning approach. In Proceedings of the 2018 IEEE International Symposium on Circuits and Systems (ISCAS), Florence, Italy, 27–30 May 2018; pp. 1–5. [Google Scholar]
- Goceri, E.; Shah, Z.K.; Gurcan, M.N. Vessel segmentation from abdominal magnetic resonance images: Adaptive and reconstructive approach. Int. J. Numer. Methods Biomed. Eng. 2017, 33, e2811. [Google Scholar] [CrossRef] [PubMed]
- Ibragimov, B.; Toesca, D.; Chang, D.; Koong, A.; Xing, L. Combining deep learning with anatomical analysis for segmentation of the portal vein for liver SBRT planning. Phys. Med. Biol. 2017, 62, 8943. [Google Scholar] [CrossRef]
- Zeng, Y.Z.; Zhao, Y.Q.; Liao, M.; Zou, B.J.; Wang, X.F.; Wang, W. Liver vessel segmentation based on extreme learning machine. Phys. Med. 2016, 32, 709–716. [Google Scholar] [CrossRef] [PubMed]
- Ibtehaz, N.; Rahman, M.S. MultiResUNet: Rethinking the U-Net architecture for multimodal biomedical image segmentation. Neural Netw. 2020, 121, 74–87. [Google Scholar] [CrossRef] [PubMed]
- IRCAD. 3D Image Reconstruction for Comparison of Algorithm Database. Available online: https://www.ircad.fr/research/3dircadb/ (accessed on 24 May 2021).


Publisher’s Note: MDPI stays neutral with regard to jurisdictional claims in published maps and institutional affiliations. |
© 2021 by the authors. Licensee MDPI, Basel, Switzerland. This article is an open access article distributed under the terms and conditions of the Creative Commons Attribution (CC BY) license (https://creativecommons.org/licenses/by/4.0/).