Article

Static and Dynamic Response of Micropiles Used for Reinforcing Slopes

1
School of Geological Engineering and Geomatics, Chang’an University, 126 Yanta Road, Xi’an 710054, China
2
Department of Civil, Construction and Environmental Engineering, Iowa State University, 813 Bissell Road, Ames, IA 50011-1066, USA
3
Department of Civil and Environmental Engineering, University of Wisconsin-Madison, Madison, WI 53706, USA
*
Author to whom correspondence should be addressed.
Appl. Sci. 2021, 11(14), 6341; https://doi.org/10.3390/app11146341
Submission received: 26 May 2021 / Revised: 4 July 2021 / Accepted: 5 July 2021 / Published: 8 July 2021
(This article belongs to the Section Civil Engineering)

Abstract

:

Featured Application

This paper investigated the reinforcement and stabilization effects of micropile on slopes by carrying out static and dynamic model tests. Through systematic research and comparison, the reinforcing mechanism, seismic response mechanism, and failure modes of the micropiles are discussed to provide a more reliable basis for the micropile design in landslide prevention and slope stabilization design.

Abstract

To study the static and dynamic response of micropile-reinforced slopes, static model tests and shaking table tests were performed. The failure modes, the pile-slope interaction, the displacement, and the static/dynamic earth pressure distributions were analyzed based on static and dynamic model tests with a prescribed sliding surface. The test results indicated: (1) The micropile failure mode is mainly bending failure under both loading conditions. As far as the damage to the pile body is concerned, under static loading, the rear row piles showed more damage than the middle row piles followed by the front row piles. Under dynamic loading, the damage of the rear row piles was approximately the same as the middle row piles, which was greater than the front row piles; (2) The earth pressures in front of and behind each row of micropiles and the axial force of the pile body distributed triangularly for both loading conditions, with the bending moment of the pile body distributed in an “S” shape; (3) The landslide thrust experienced by the micropiles has a relatively large group effect. The group effect or shear ratio parameters are recommended for each loading case; (4) The interaction between the micropiles and the soil landslide presents evident progressive failure and load transfer between the rows.

1. Introduction

Catastrophic landslides are considered to be environmental disasters around the world due to the tremendous economic losses and casualties that they cause every year [1,2,3,4]. Landslides are one of the most serious and widespread natural hazards, and they can seriously endanger the lives and properties of residents living in the effected area [5]. For instance, from 1998–2017, landslides affected an estimated 4.8 million people and caused more than 18,000 deaths, with poor populations in developing or low-income countries being the most affected [6]. Therefore, conducting research on the stabilization technology of landslide disasters is of great significance for improving the prevention and treatment of regional landslide geological disasters, ensuring the safety of people’s lives and property, and building a harmonious social and economic development. Regarding landslide stabilization technology, there are currently anti-slide piles, retaining walls, anchor cable frames, etc. Among all kinds of anti-slide supporting structures, micropile is a new type of supporting structure and is favored by scholars. Generally, micropiles refer to a small-diameter, strong-reinforced cast-in-place pile with a diameter of less than 300 mm and a slenderness ratio greater than 30 and is created using drilling and pressure grouting [7]. In the early stages of its development, most researchers mainly studied its performance in stabilizing slopes under static force [8]. Recent research in China supported by the Water and Environmental Department of China Geological Survey used a 1:2 large-scale physical model to conduct static model testing on micropiles [9,10,11]. The models consisted of single pile, row piles, and group piles, and they were tested and studied, respectively. The results proved that micropiles can significantly improve the stability of slopes. Richards et al. [12] conducted a study on the performance of micropile groups and confirmed that they have immense working potential under horizontal loading. Andrew et al. [13] studied the load transfer law of the micropile groups used in a slope through physical model tests and further confirmed the importance of the connecting beam for the micropile reinforcement of the slope. Bruce et al. [14] has shown that micropile groups subjected to horizontal loads will produce pile group effects. The group effect refers to the phenomenon where the pile–soil interaction causes pile-side resistance, pile-tip resistance, and other properties that change after the pile group is subjected to a horizontal load, resulting in the unequal bearing capacity of each row of the micropile. [15] The horizontal bearing capacity of pile groups is less than the sum of the load capacities of its individual bearings. However, with the increased research on micropiles, the response of micropiles under seismic dynamics has become important to understand. As we all know, the direct action of seismic load on the landslide body will reduce the shear strength of the landslide body, and then trigger the landslide. Wolter et al. [16] emphasized the importance of the seismic process in regulating the failure of slopes. The results show that the occurrence of landslides is due to the significant reduction of slope material strength caused by past seismic activities and indicate that repeated seismic loading is a critical process for catastrophic failure. In this regard, many researchers have conducted related experiments and simulation. Moayed et al. [17] simulated a micropile-reinforcemed landslide under an earthquake via FEA and proved that micropile can greatly reduce the displacement of the pile top and the damage of the pile body caused by the earthquake. Komak et al. [18] studied the dynamic characteristics of using inclined micropiles to reinforce landslides through shaking table tests and showed that dynamic amplifications of acceleration on micropiles and the soil surface can be reduced by inclining the micropiles. Capatti et al. [19] researched the dynamic behavior of micropile under horizontal load in a seismic area, and the results of ambient vibration tests and horizontal impact load tests on the two micropiles reveal that high pressure injections visibly modify the dynamic response at small strain, influencing the fundamental frequencies and the directional behavior of the system. Rollins et al. [20] conducted research on the performance of micropiles under earthquake loading and determined the relationship between the average resistance of micropiles and the pile spacing under different conditions through experiments. The pile group effect on pile side resistance was studied. Zhuang et al. [21] designed a pile–soil dynamic interaction shaking table test in order to study the influence of the input wave frequency on the vibration response characteristics of micropiles. The study found that the deformation of the micropile and the stress distribution of the pile body are closely related to the relative magnitude of the input wave frequency and the natural frequency of the system. Niu [22] used “herringbone”-shaped micropiles in large-scale shaking table tests to study the deformation and internal force distribution characteristics of this system under earthquakes. The results showed that this kind of micropile system has a better seismic bearing capacity. Wang et al. [23] utilized dynamic centrifuge tests to study the dynamic response characteristics of the lateral deformation and acceleration of micropiles and the bending moment of the pile at different depths. The researchers provided insights for the seismic design of micropiles in liquefiable sites.
Although the previous researchers have advanced the understanding of the micropile behavior under loading, the research focused on the performance of micropiles under static or dynamic action alone. Few researchers have compared the reinforcing performance of micropile-reinforced slopes under static and dynamic loading. Therefore, this research conducted a static model test and a shaking table test to investigate the interaction between micropiles and landslides. Through systematic research and comparison, the reinforcing mechanism, seismic response mechanism, and failure modes of the micropiles are discussed to provide a more reliable basis for the design of the micropiles in landslide prevention and slope stabilization design.

2. Model Test

The data collection for the static model test used static acquisition instruments and a displacement meter (KTR2-100 resistance displacement meter), as shown in Figure 1a,b, respectively. The shaking table testing was achieved with the help of the large-scale shaking table established at Xi’an University of Architecture and Technology, China. The dimensions of the table are 4.1 m × 4.1 m. (length × width), the carrying capacity of the table is 20 t, and the input frequency range is 0.1–50 Hz. The maximum input acceleration amplitudes at full load are ±1.5, ±1.0, and ±1.0 g in the X, Y, and Z directions. The maximum displacements at full load are ±15, ±25, and ±10 cm in the X, Y, and Z directions, respectively. The BX120-5AA resistance strain gauges and miniature earth pressure cells were used (Figure 1c,d).

2.1. Scaling Law

The model slope has three parts: Slope #1 (slope height: 0.68 m, slope ratio: 1:0.59 (height: width), inclination about 58°), platform (width: 0.38 m), and Slope #2 (slope height: 0.52 m, slope ratio: 1:0.75 (height: width) inclination around 53°). The micropiles were installed vertically into the platform and in a crossed layout. The length and diameter of the model micropiles were 1.12 m and 3.5 cm, respectively. The spacing of the micropiles and the row spacing were designed to be 24 cm and 14 cm, respectively. In addition, to improve the integrity of the supporting structure of the micropiles, the tops of each micropile were connected by a top slab. The side facing the slope top was defined as the back of the pile, and the other side was defined as the front of the pile. The plan and section view of the landslide model are shown in Figure 2.
According to the dimensions and carrying capacity of the shaking table apparatus as well as the geometry size of the prototype micropile, in the experiment, the geometric size L ( C L = 8), mass density ρ ( C ρ = 0.75), and elastic modulus E ( C E = 3) were selected as the control variables. The similitude relationships between the other physical quantities were derived according to Bukingham theory. The main similitude relationships and similitude constants are shown in Table 1.

2.2. Test Materials and Preparation Process
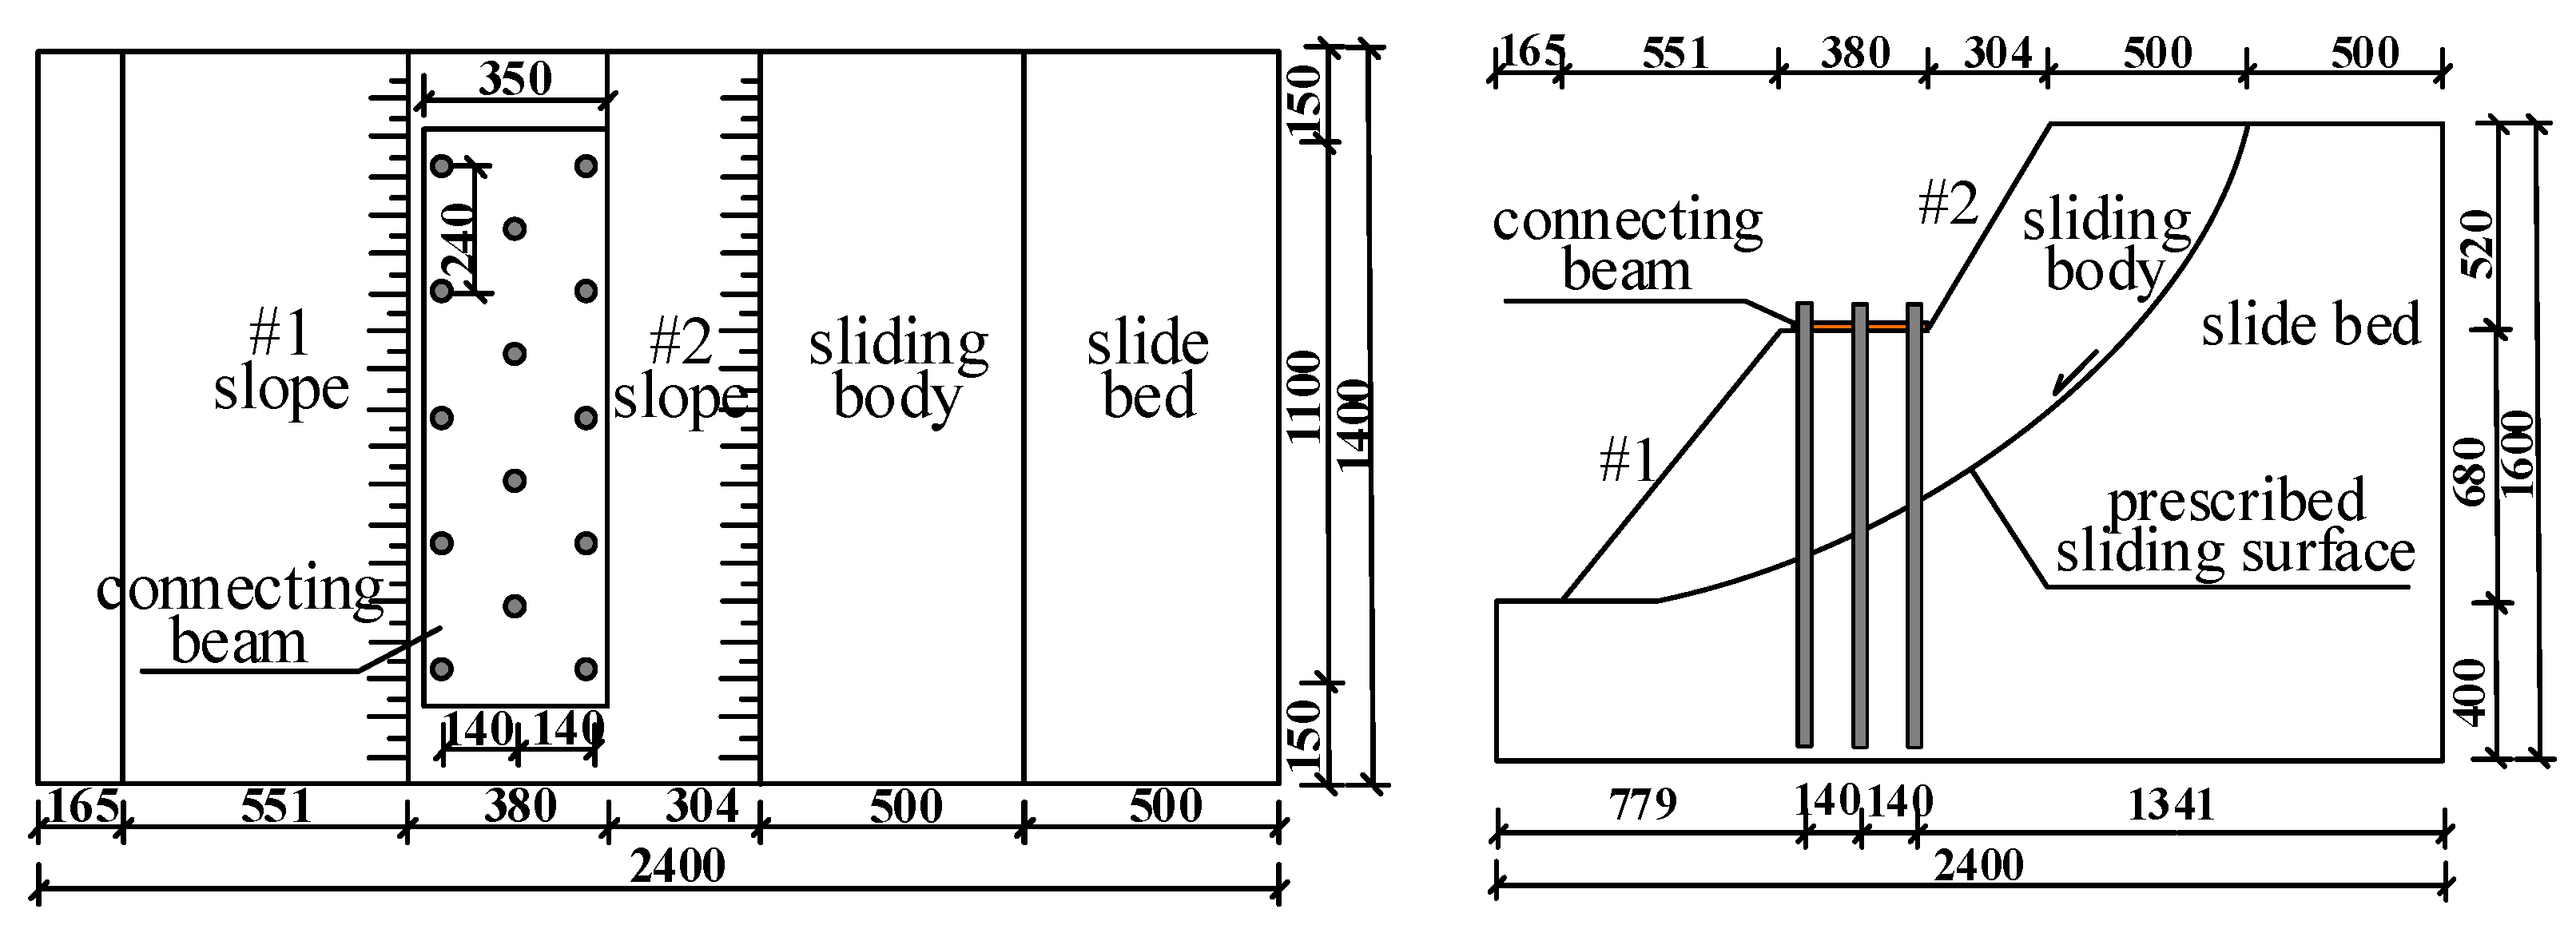
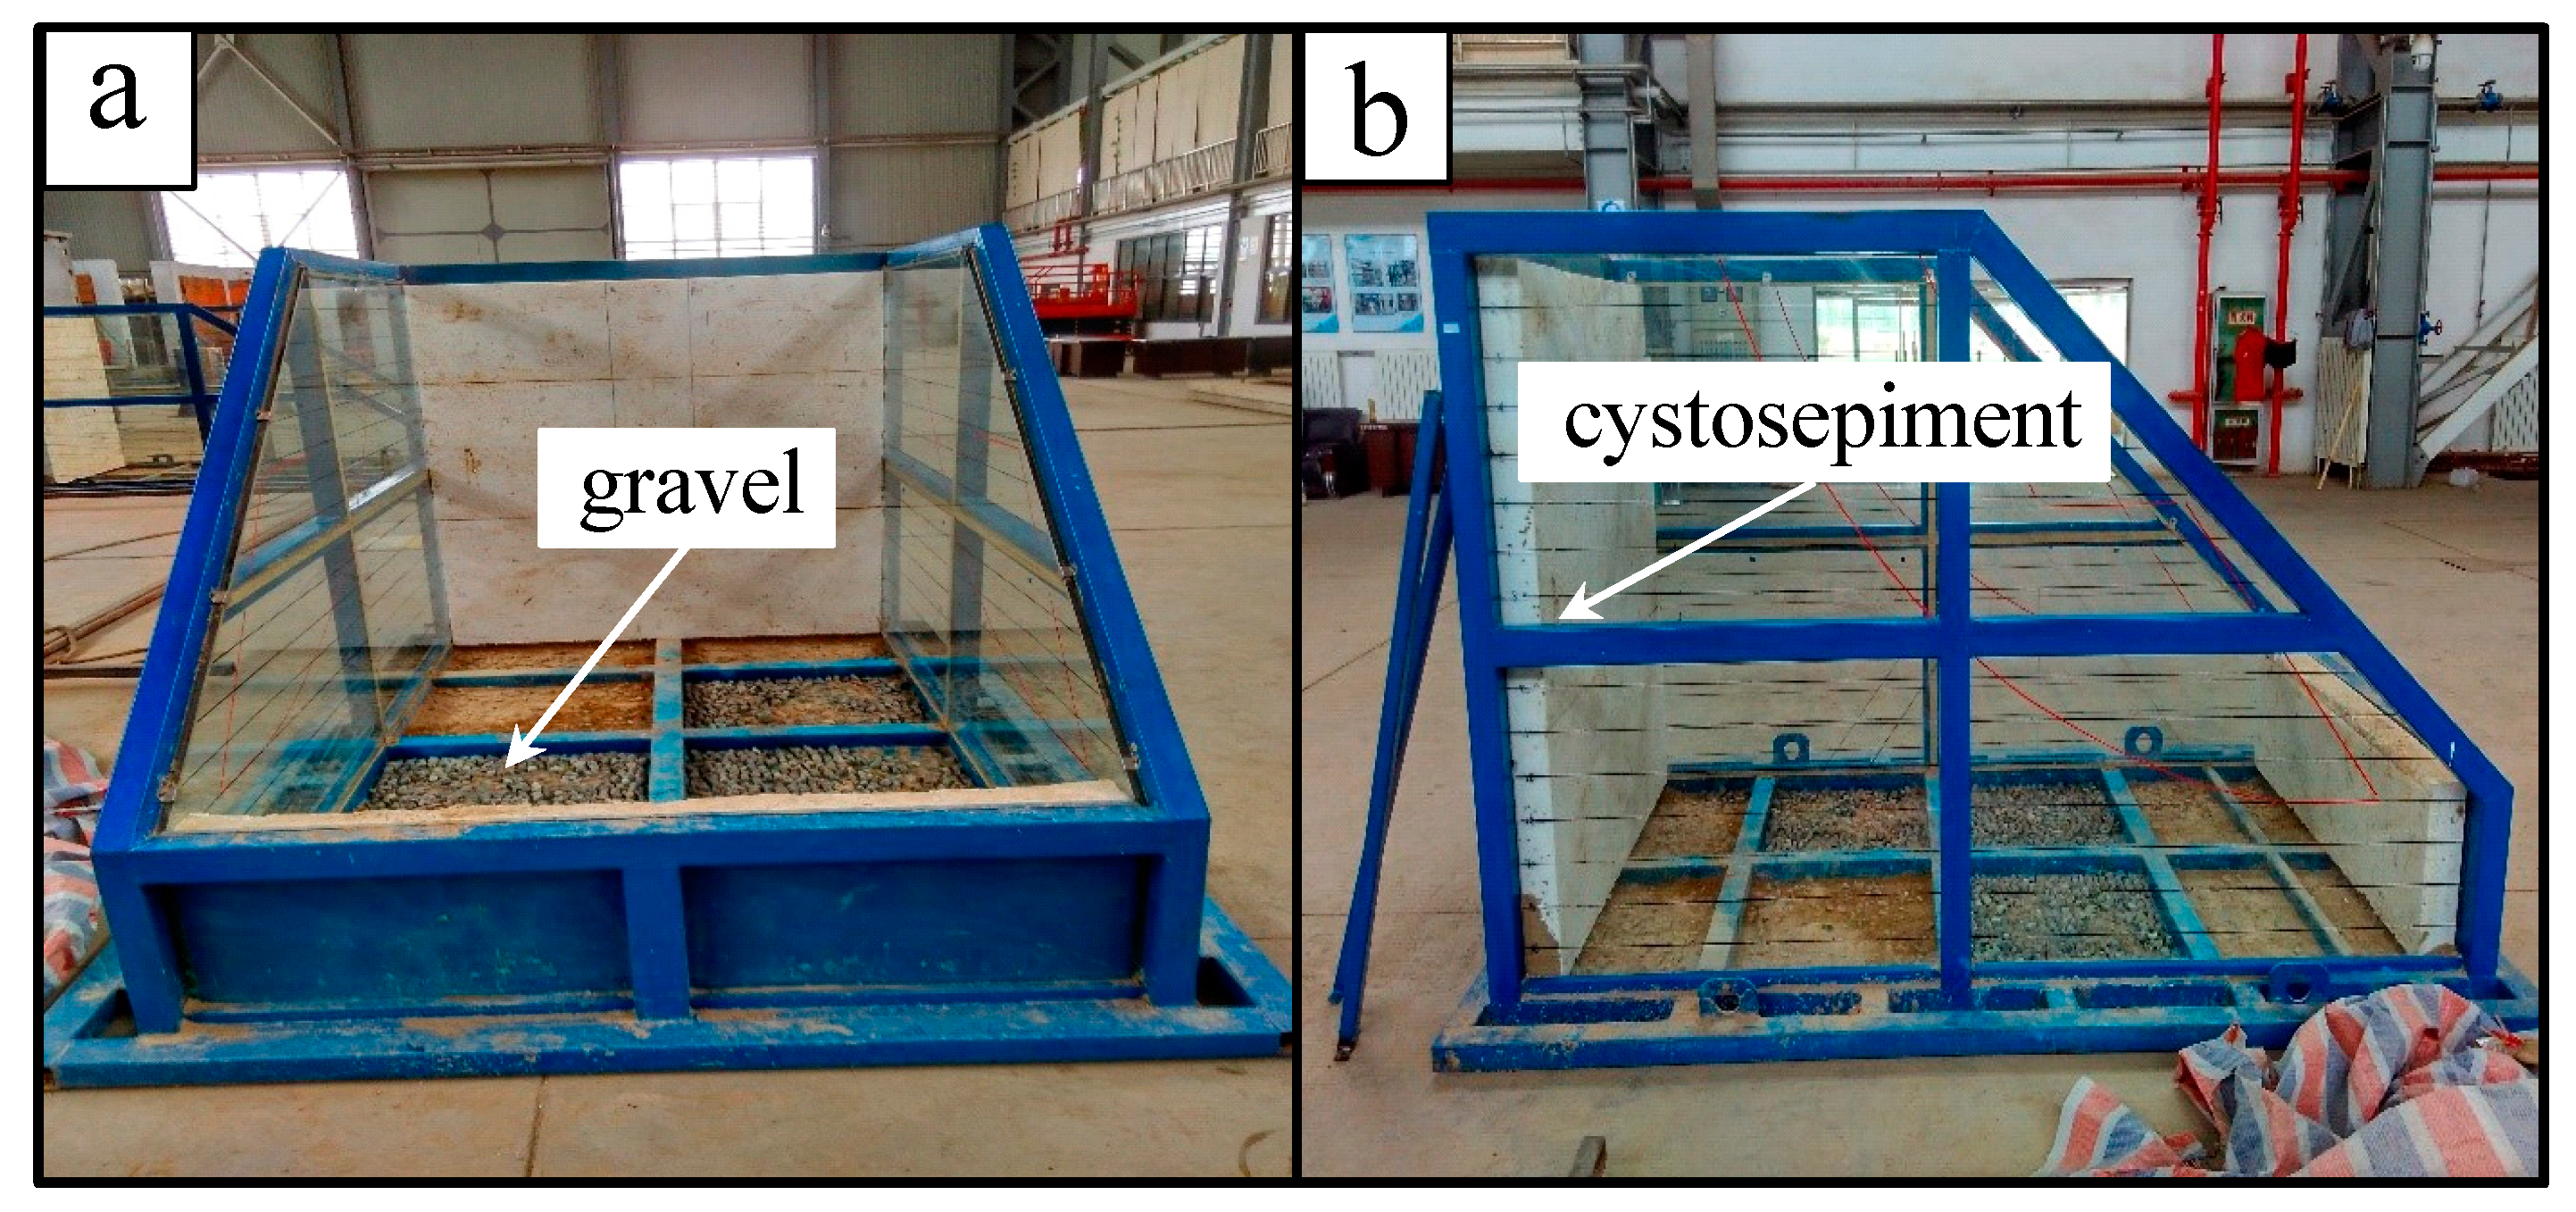
2.2.1. Model Box

The two models were constructed independently in two identical rigid model boxes (the inner size of the model box was 2.6 m long, 1.4 m wide and 1.67 m high). The model box was supported by a steel frame to improve the stiffness. To observe the damage within the model, a transparent tempered glass was installed on two lateral sides. Before preparation of the model slopes, a layer of gravel (maximum particle size 2.3 cm) was glued on the inside bottom of the box to reduce the relative displacement between the box bottom and the soil. In addition, the front and rear ends of the box wall in the direction of seismic wave excitation are lined with 10 cm polystyrene foam panels to act as shock absorption layers to reduce boundary effects. The completed model box is shown in Figure 3.

2.2.2. Model Soil

The test is based on existing research results [24], using loess as the main material, and then mixing it with barite powder, standard sand, and bentonite as well as other auxiliary materials to perform multiple ratio tests to determine the density, cohesion, internal friction angle, and other parameters. Finally, it is determined that the material mixture is loess: barite powder: standard sand: bentonite with the following respective ratios: 0.5: 0.3: 0.06: 0.14. Subsequently, the sliding bed and sliding body were made by means of manual tamping. Samples were taken during the process, and geotechnical tests such as a drying test and a direct shear test were used to determine the attributes in Table 2. The shape of the prescribed sliding surface is a classic arc, and the curvature of the arc is determined by the Swedish arc method. The sliding surface is simulated by a double-layer polyethylene plastic film. The cohesive force of the sliding belt is 3.5 kPa, and the internal friction angle is 20°, determined through the inverse calculation of the pile-free test.

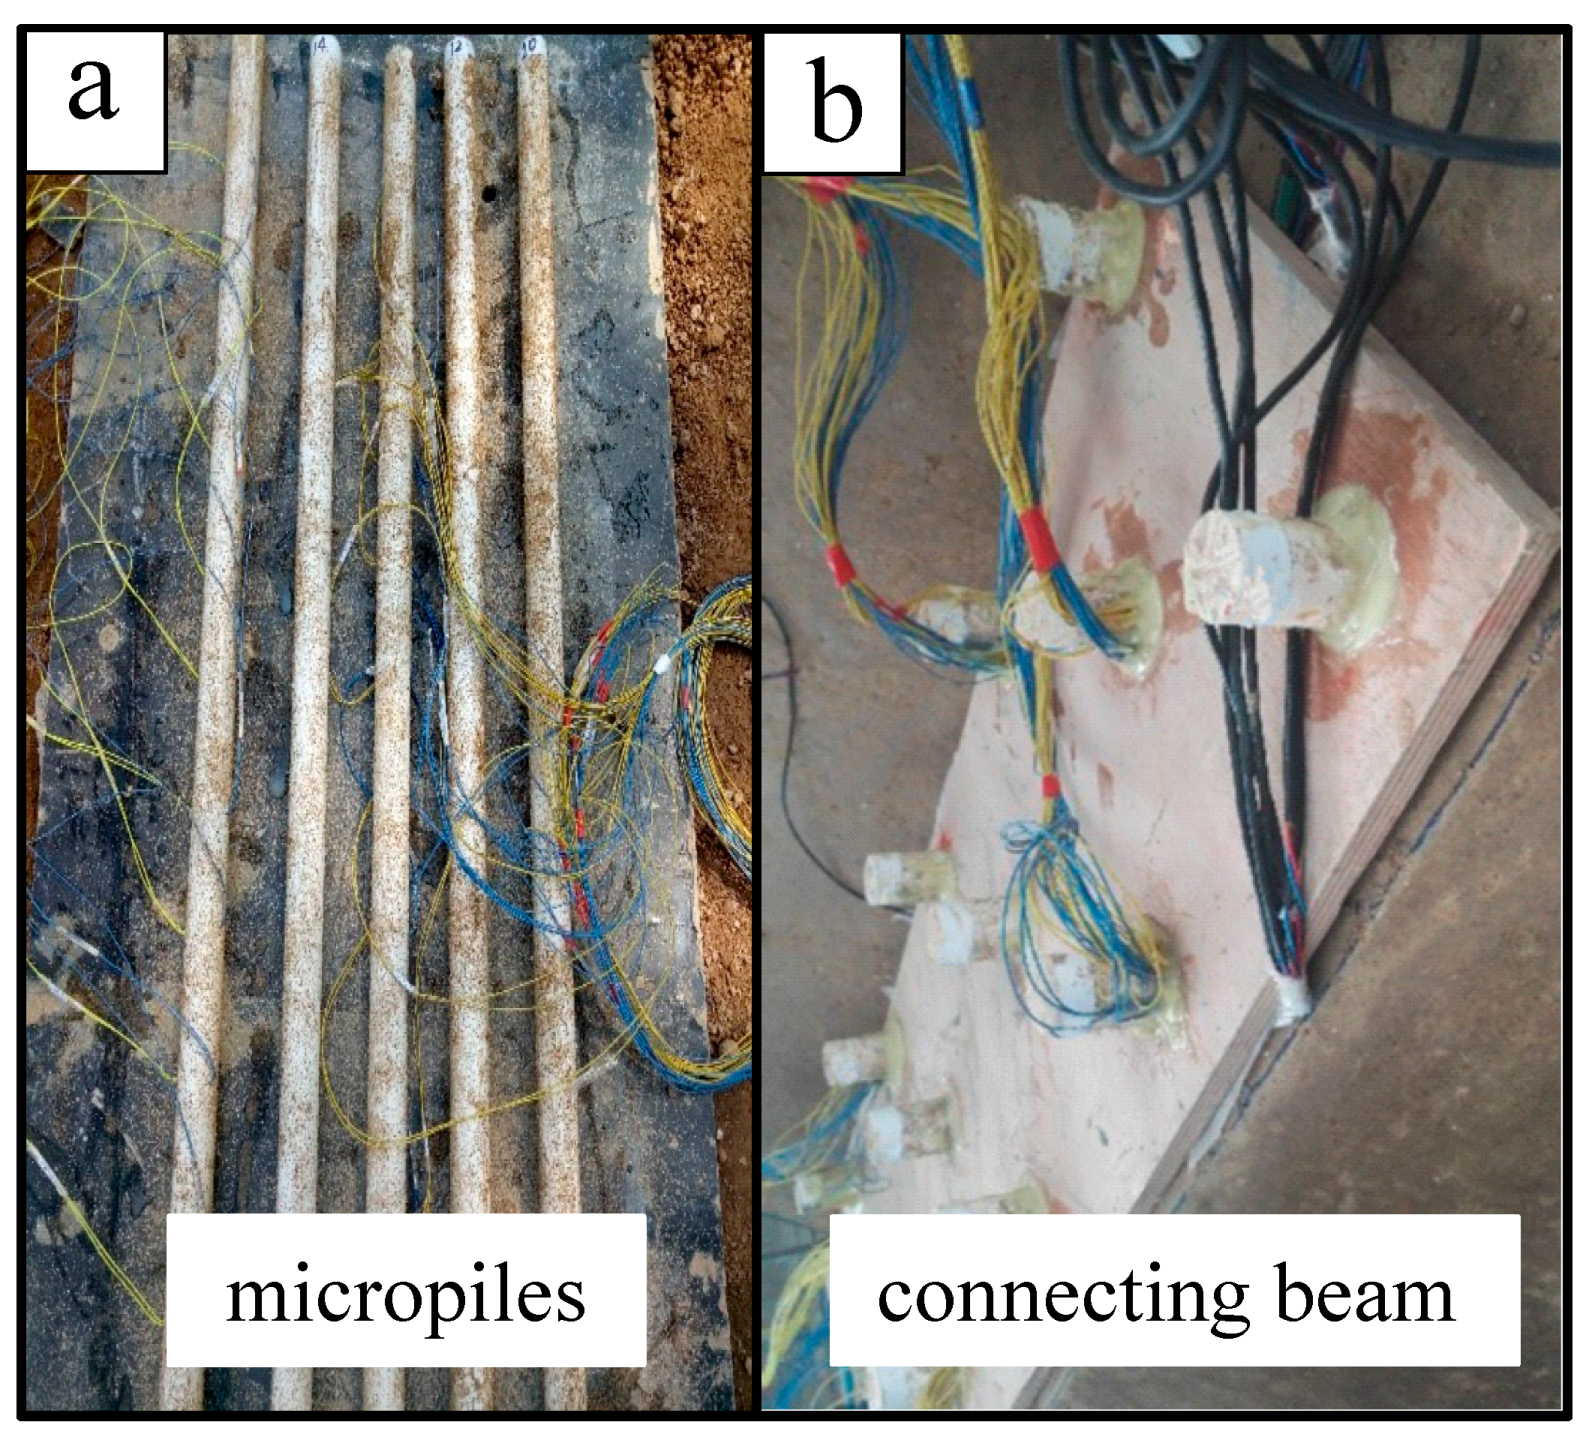
2.2.3. Micropiles and Top Slab

The micropile protype was reinforced concrete piles with a diameter of less than 300 mm made of C30 concrete and HRB335 steel bars. The model micropile was a prefabricated pile made before the test, which was composed of aluminum rod and gypsum. The water cement ratio of gypsum is 1:0.7 ( m g y p s u m : m w a t e r ), and its elastic modulus is about 4.5 × 10⁹ Pa. Moreover, the model micropiles had a length and diameter of 1.12 m and 3.5 cm, respectively. The spacing of the microphiles and the spacing of the rows were designed to be 24 cm and 14 cm, respectively. The composite elastic modulus of the micropiles was roughly 1.167 × 10¹⁰ Pa. The top slab of micropiles was simulated by the wood board with a thickness of 1.8 cm, and epoxy resin was used to connect it to the top of the micropiles. The manufactured micropiles and top slab are shown in Figure 4a,b.

2.2.4. Preparation Process

The model was prepared using the following steps: 1. Filling the bottom of the sliding bed; 2. Placing the micropiles; 3. Filling the sliding bed and leveling the sliding surface; 4. Placing duplex plastic paper on the sliding surface; 5. Filling the sliding mass; 6. Creating the slope surface; 7. Installing the measuring devices; 8. The model is completed. The slope model is displayed in Figure 5.

2.3. Loading Scheme and Measuring Scheme

2.3.1. Loading Scheme

The loading of the static model test was carried out in a step-by-step manner of sandbag loading, with a load of 2 kPa per level. After each level of loading was complete, the load was maintained for 4 h. After the deformation was stable, the data were recorded. The static model test allowed the model to generate large deformations, and the failure of the micropiles was used to terminate the test and to determine the final loading. The loading of the shaking table test was scaled based on the dimensions of the model on the shaking table. The EI-Centro wave was input horizontally and unidirectionally into the model via the shaking table control system. Before each peak acceleration was loaded, a white noise sweep with an acceleration peak of 0.03 g was performed on the model to obtain the model’s natural frequency. The schematic diagram of loading is shown in Figure 6, and the specific loading conditions are shown in Table 3.

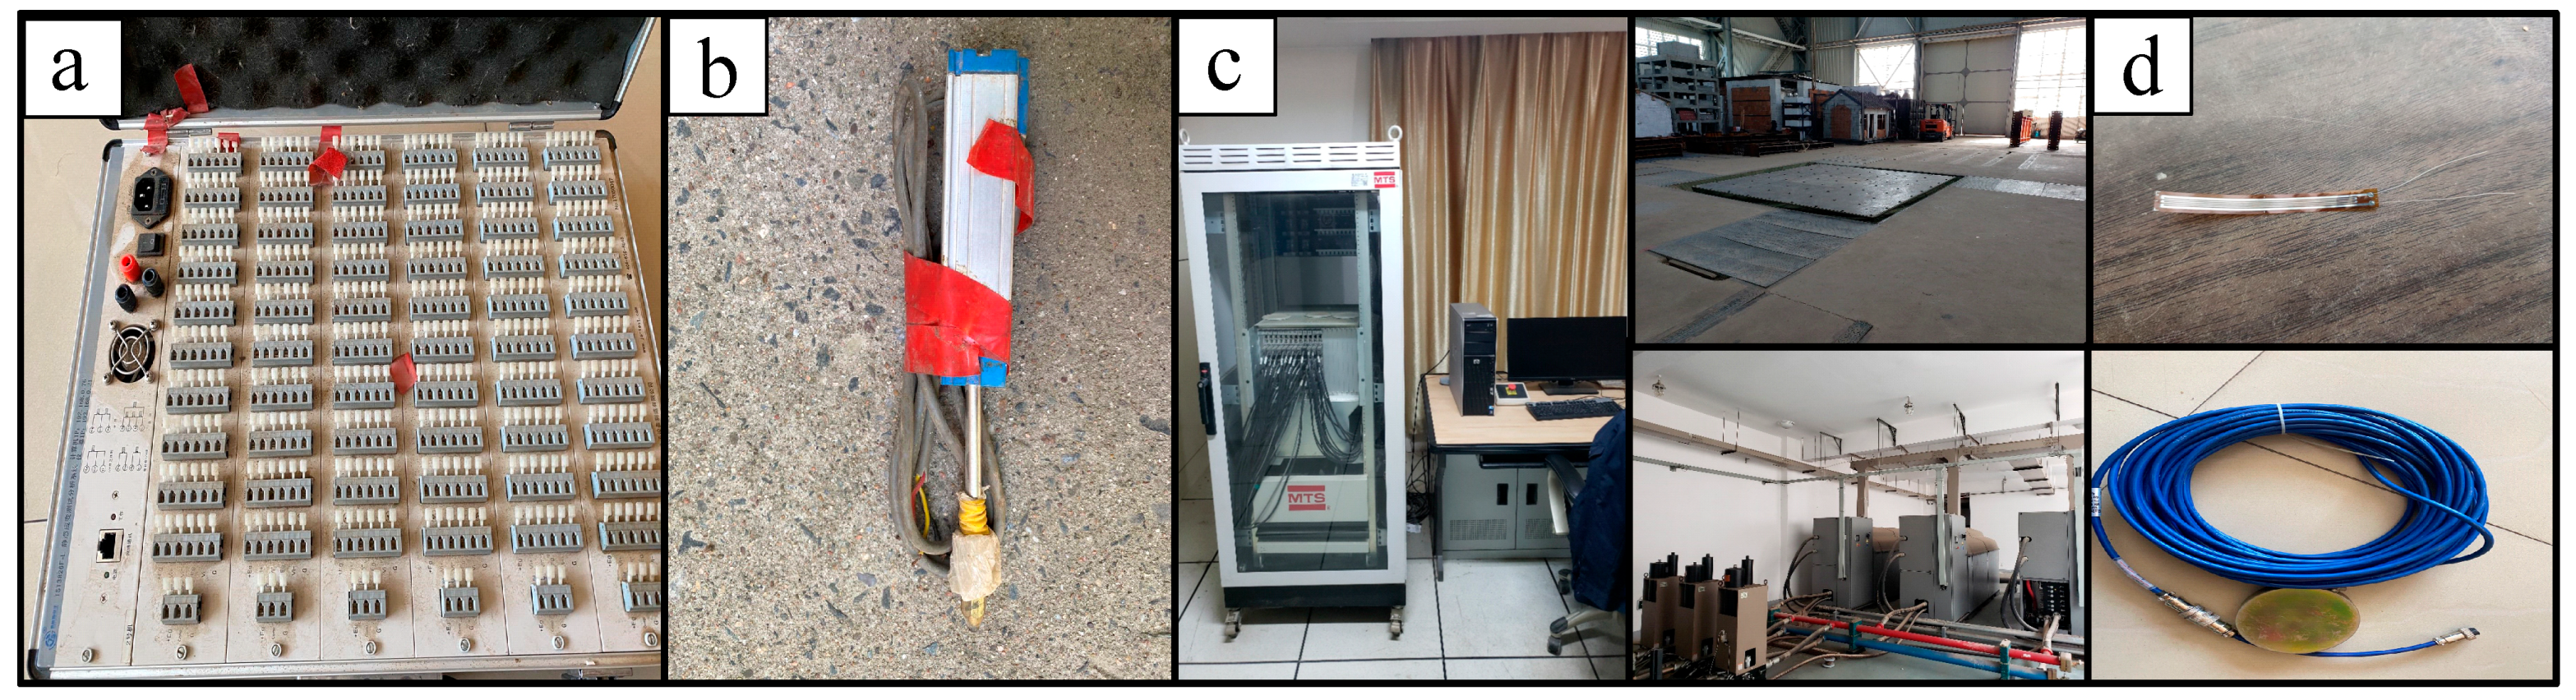
2.3.2. Measuring Scheme

The data collected in the static model test and the shaking table test mainly include the force on the micropiles, the bending moment of the micropiles, the deformation of the landslide mass, and the distribution of the earth pressure on the front and the back of the micropiles. The force of the micropiles includes both the axial force and landslide thrust on the micropiles. In this paper, piles #2, #4, #6, #9, #11, #13 (see Figure 7) were selected as test piles. 8 pairs of BX120-5AA resistance strain gauges were attached on the outside of the test piles. During the test, the strain gauges generated strain (it was prescribed that the back side of the pile is tensioned as positive). According to material mechanics [25], the bending moment and axial force at the corresponding measuring point can be obtained by Equations (1) and (2), respectively.
E I ( ε 1 ε 2 ) y
where M is the bending moment of the pile body (N·m), EI is the bending stiffness of the pile body (N·m2), y is the distance from the strain measuring point to the neutral axis (m), and ε 1 , ε 2 are the strains at the measuring points at the front and the back of the pile, respectively.
E A ( ε 1 + ε 2 ) 2
where N is the axial force of the pile body (N), EA is the compressive stiffness of the pile (N), and ε 1 , ε 2 are the strains at the measuring points at the front and the back of the pile, respectively. In addition, the miniature earth pressure cells were arranged in a symmetrical position along the test column to measure the distribution of landslide thrust on the pile. The layout of the test components is shown in Figure 8.

3. Results

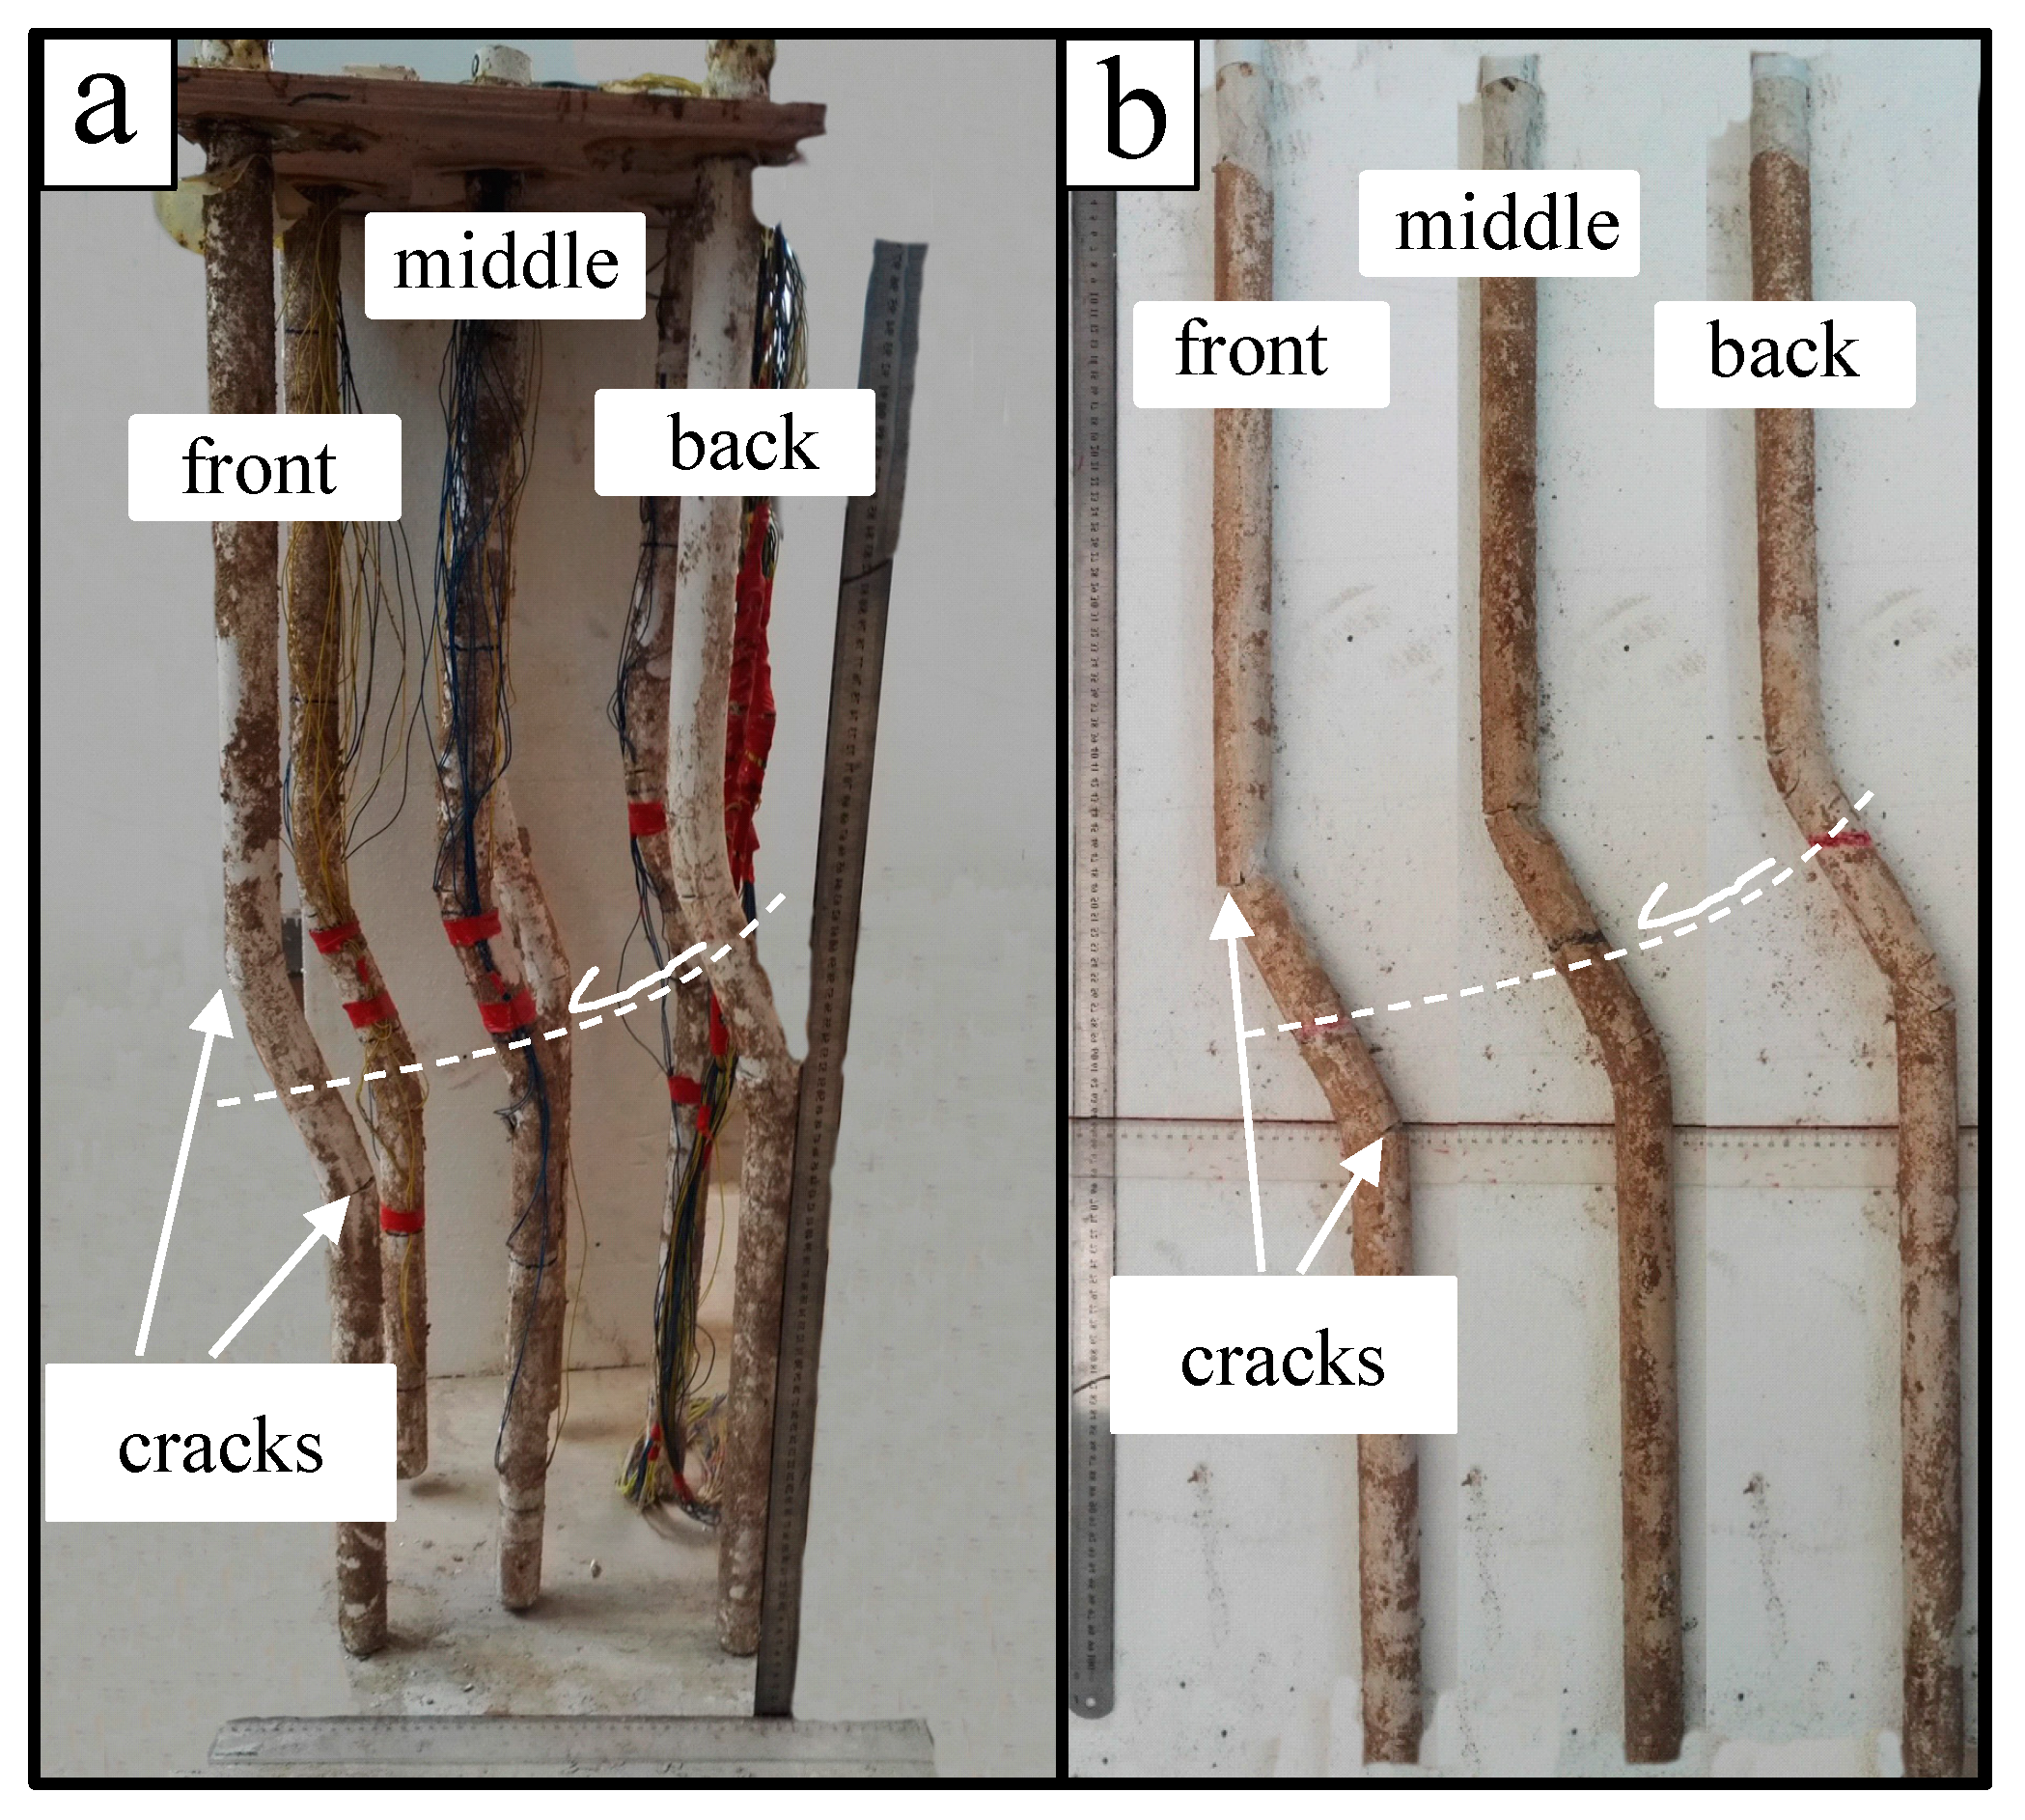
3.1. Test Phenomenon

The slope movement and crack propagation in the static model test and shaking table test are shown in Figure 9. The static model test was incrementally increased from 2 kPa, and when it was finally loaded to 28 kPa, the model had high deformation, and both the sliding bed and the sliding mass were misaligned, which caused the toe of the slope to move forward by 8.25 cm, and the top of the slope to subside by 7.8 cm. At this time, it was determined that the pile had entered the plastic failure stage, and the test was terminated.
It can be seen from Figure 9a that under the static load, the landslide body produced a circular arc rotation along the sliding surface, and the micropiles generated bending deformation near the sliding surface because of the landslide thrust. On the other hand, there was a void between the trailing edge of the connecting beam and the landslide body with cracks appearing at the toe of the slope. After the test, the micropiles were dug out from the model (Figure 10a). It was observed that the deformation occurred approximately 10 cm above and below the sliding surface (about three times the pile diameter). In terms of the degree of damage, the rear row piles were greater than the middle row piles, followed by the front row piles. In other words, the failure mode of the micropiles was mainly a bending failure under static loading due to the dislocation movement of the sliding mass and the sliding bed. The closer the piles were to the trailing edge of the landslide, the more serious the plastic failure.
In the shaking table test, the landslide had no obvious change after being excited by an El-Centro wave with a peak acceleration of 0.1–0.4 g. After a peak acceleration of 0.6 g, a tension crack AB began to occur in the soil between the front row and the middle row of piles. The crack AB then extended downwards to point C with a width of around 0.8 cm. After the input of an El-Centro wave with a peak acceleration of 0.8 g, the slope started to slide, and the toe of the slope slid forward by 3.5 cm while the top of the slope settled 3.0 cm. At the same time, the crack ABC expanded to point D. The sliding mass continued to move, the toe of the slope moved forward by 8.45 cm cumulatively, and the cumulative settlement of the slope top was 7.93 cm. Finally, the crack penetrated to point E, cracks also appeared on the front side of the slope toe and the rear pile, the slope toe moved forward 11.7 cm horizontally, and the slope top settled at 9.0 cm when the test was terminated, as shown in Figure 9b. After the test, the micropiles were also dug out from the model (Figure 10b). In terms of damage degree, the rear row piles were approximately the same as the middle row piles followed by the front row piles.
Comparing the static model test and shaking table test, the deformation of the model was relatively similar. The landslide body produced circular arc rotation damage along the preset sliding surface, and the micropiles generated a bent deformation near the sliding surface caused by the landslide thrust. There was a void between the trailing edge of the connecting beam and the landslide body. Compared to the static model test, the micropiles produced more serious damage under dynamic loading, but the failure mode was similar, all of which were a bending deformation about 10 cm above and below the sliding surface (about three times the pile diameter), as shown by corresponding tensile cracking and crushing of the plaster body. It can be seen that the damage to the pile mass under dynamic loading was more significant, so it is recommended to enhance the design requirements for micropile in a high-intensity field. For example, measures can be taken to enlarge the pile diameter to improve the bending resistance as well as to reduce the pile spacing to enhance the overall stability of the micropiles, etc.

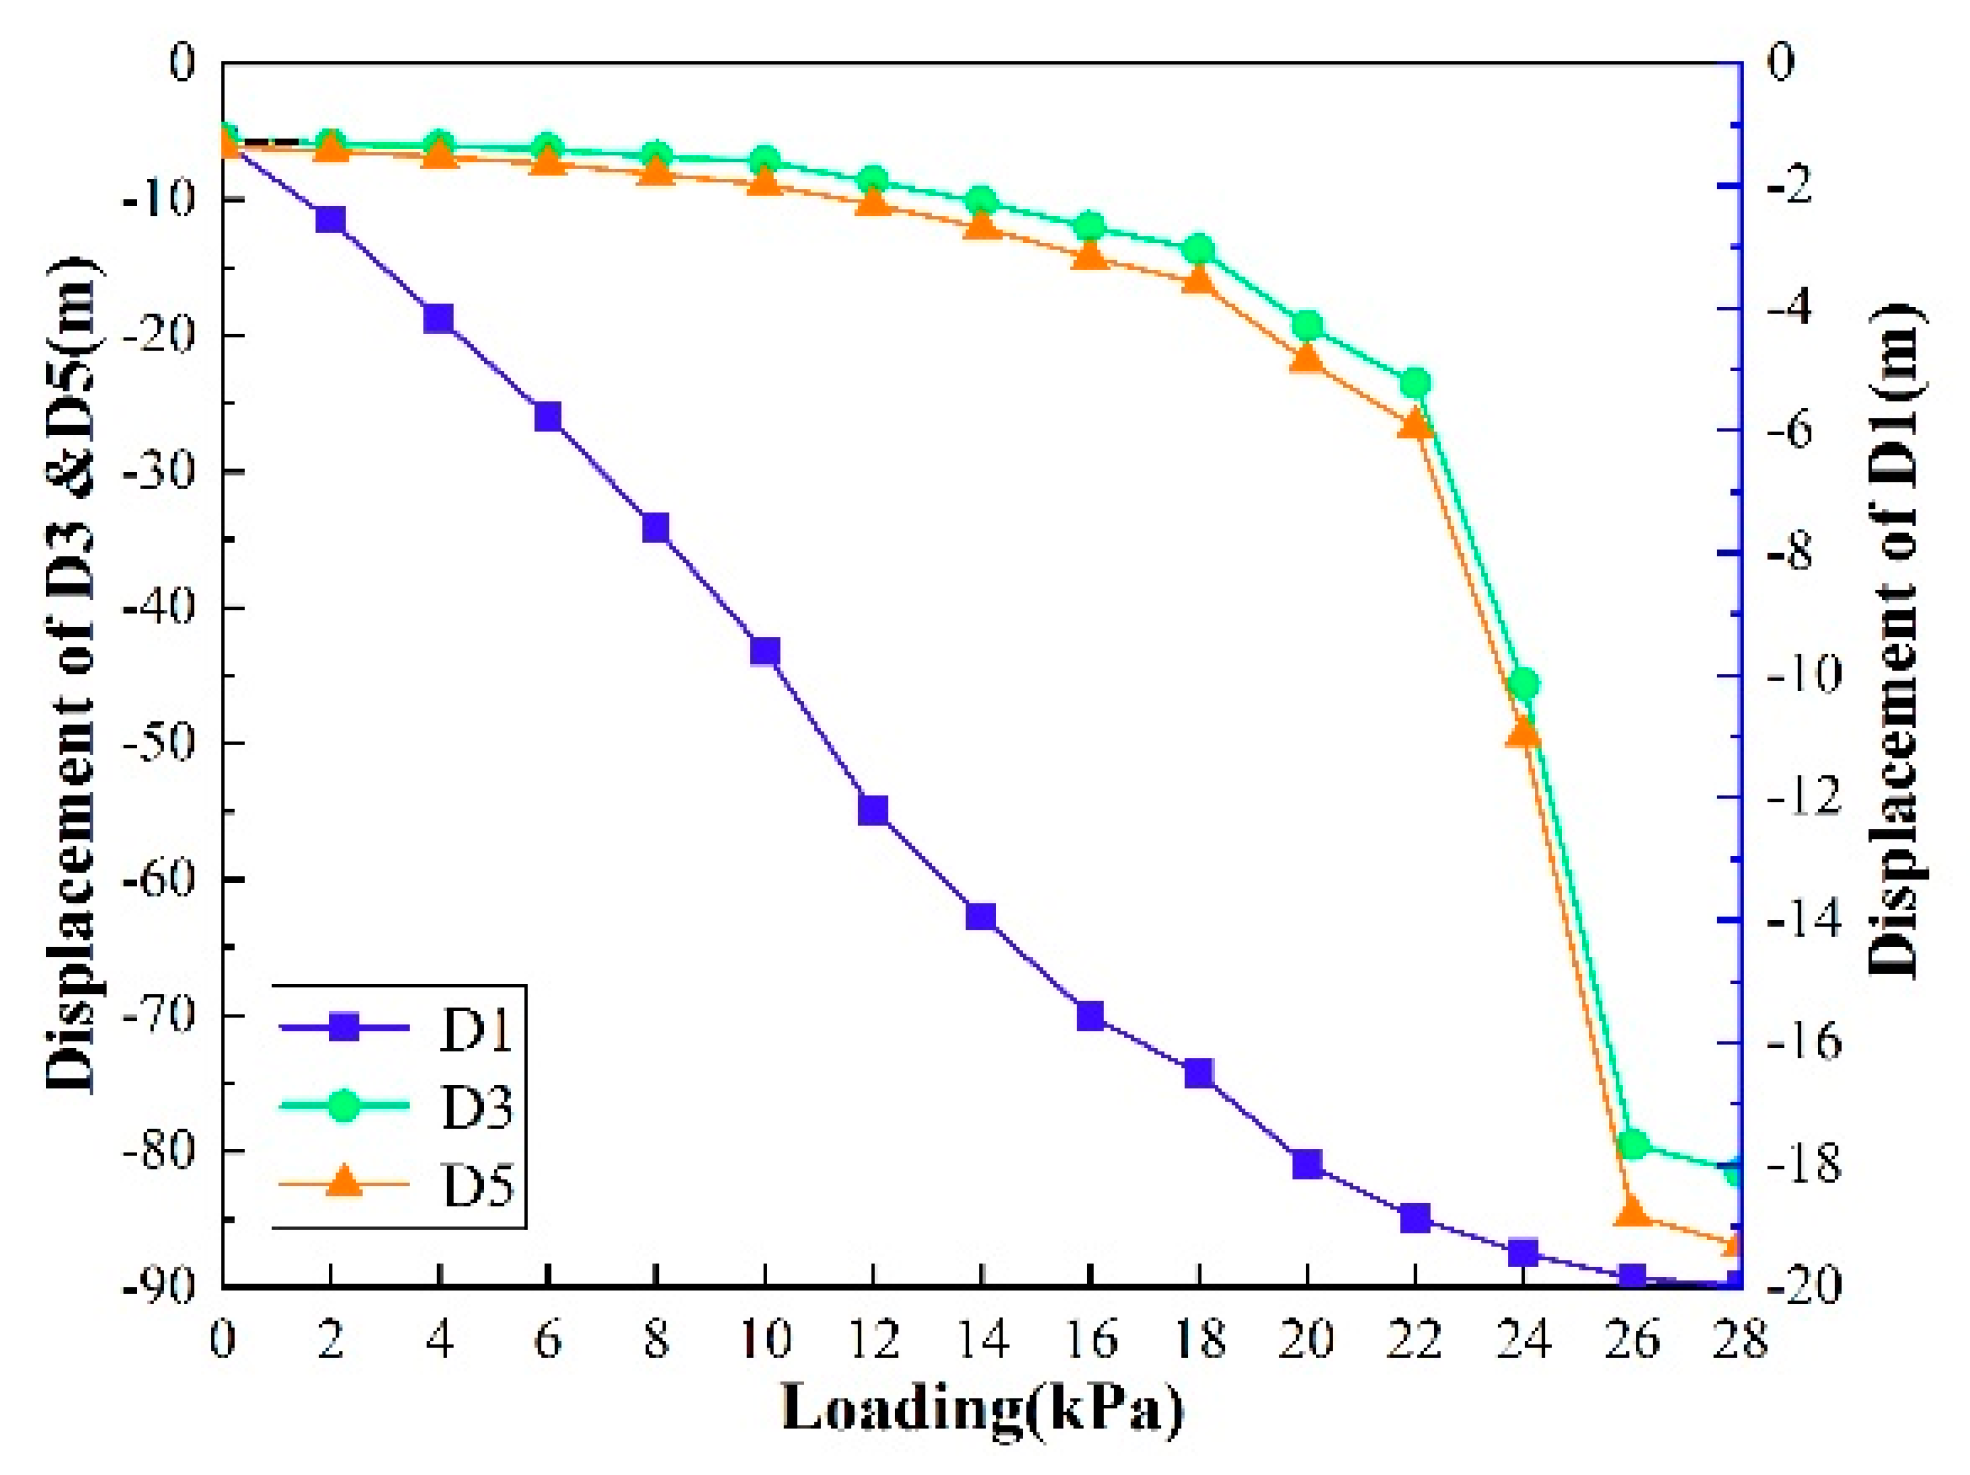
3.2. Displacement Response Analysis

The displacement variations of D1, D3, and D5 are in Figure 11. It can be seen from the figure that the settlement of D1 (inside of platform) gradually increases with the load, but the rate of the settlement deformation speed is relatively constant, with no sudden change. At the end of the loading, the maximum vertical deformation is approximately 20 mm. Additionally, the deformation at the D3measuring point (located on the top of the #2 pile in the front row) is more consistent with that of measuring point D5 (located at the foot of the front edge of the landslide mass). Prior to the load of 22 kPa, the displacement of D3 and D5 change slowly with the accumulation of the load, however, the micropiles gradually fail as the load increases. The landslide mass had a large degree of sliding deformation. At the end of loading, the final displacement of D3 and D5 are 80.23 mm and 87.12 mm, respectively. It can be inferred from the test results that a critical load exists. Beyond it, the displacement of the pile top and the slope toe will increase quickly. At this critical load, it was determined that the micropiles have completely entered the plastic deformation stage. In this paper, this load is called the critical failure load. In the static model test, the critical failure load of the model is around 22 kPa.
By comparing Figure 9a,b, it can be seen that after the shake table test, the displacement of the landslide model under the dynamic loading (slope toe, slope top, platform) is greater than the static, which illustrates that dynamic loading causes more damage to the piles than the static loading case.

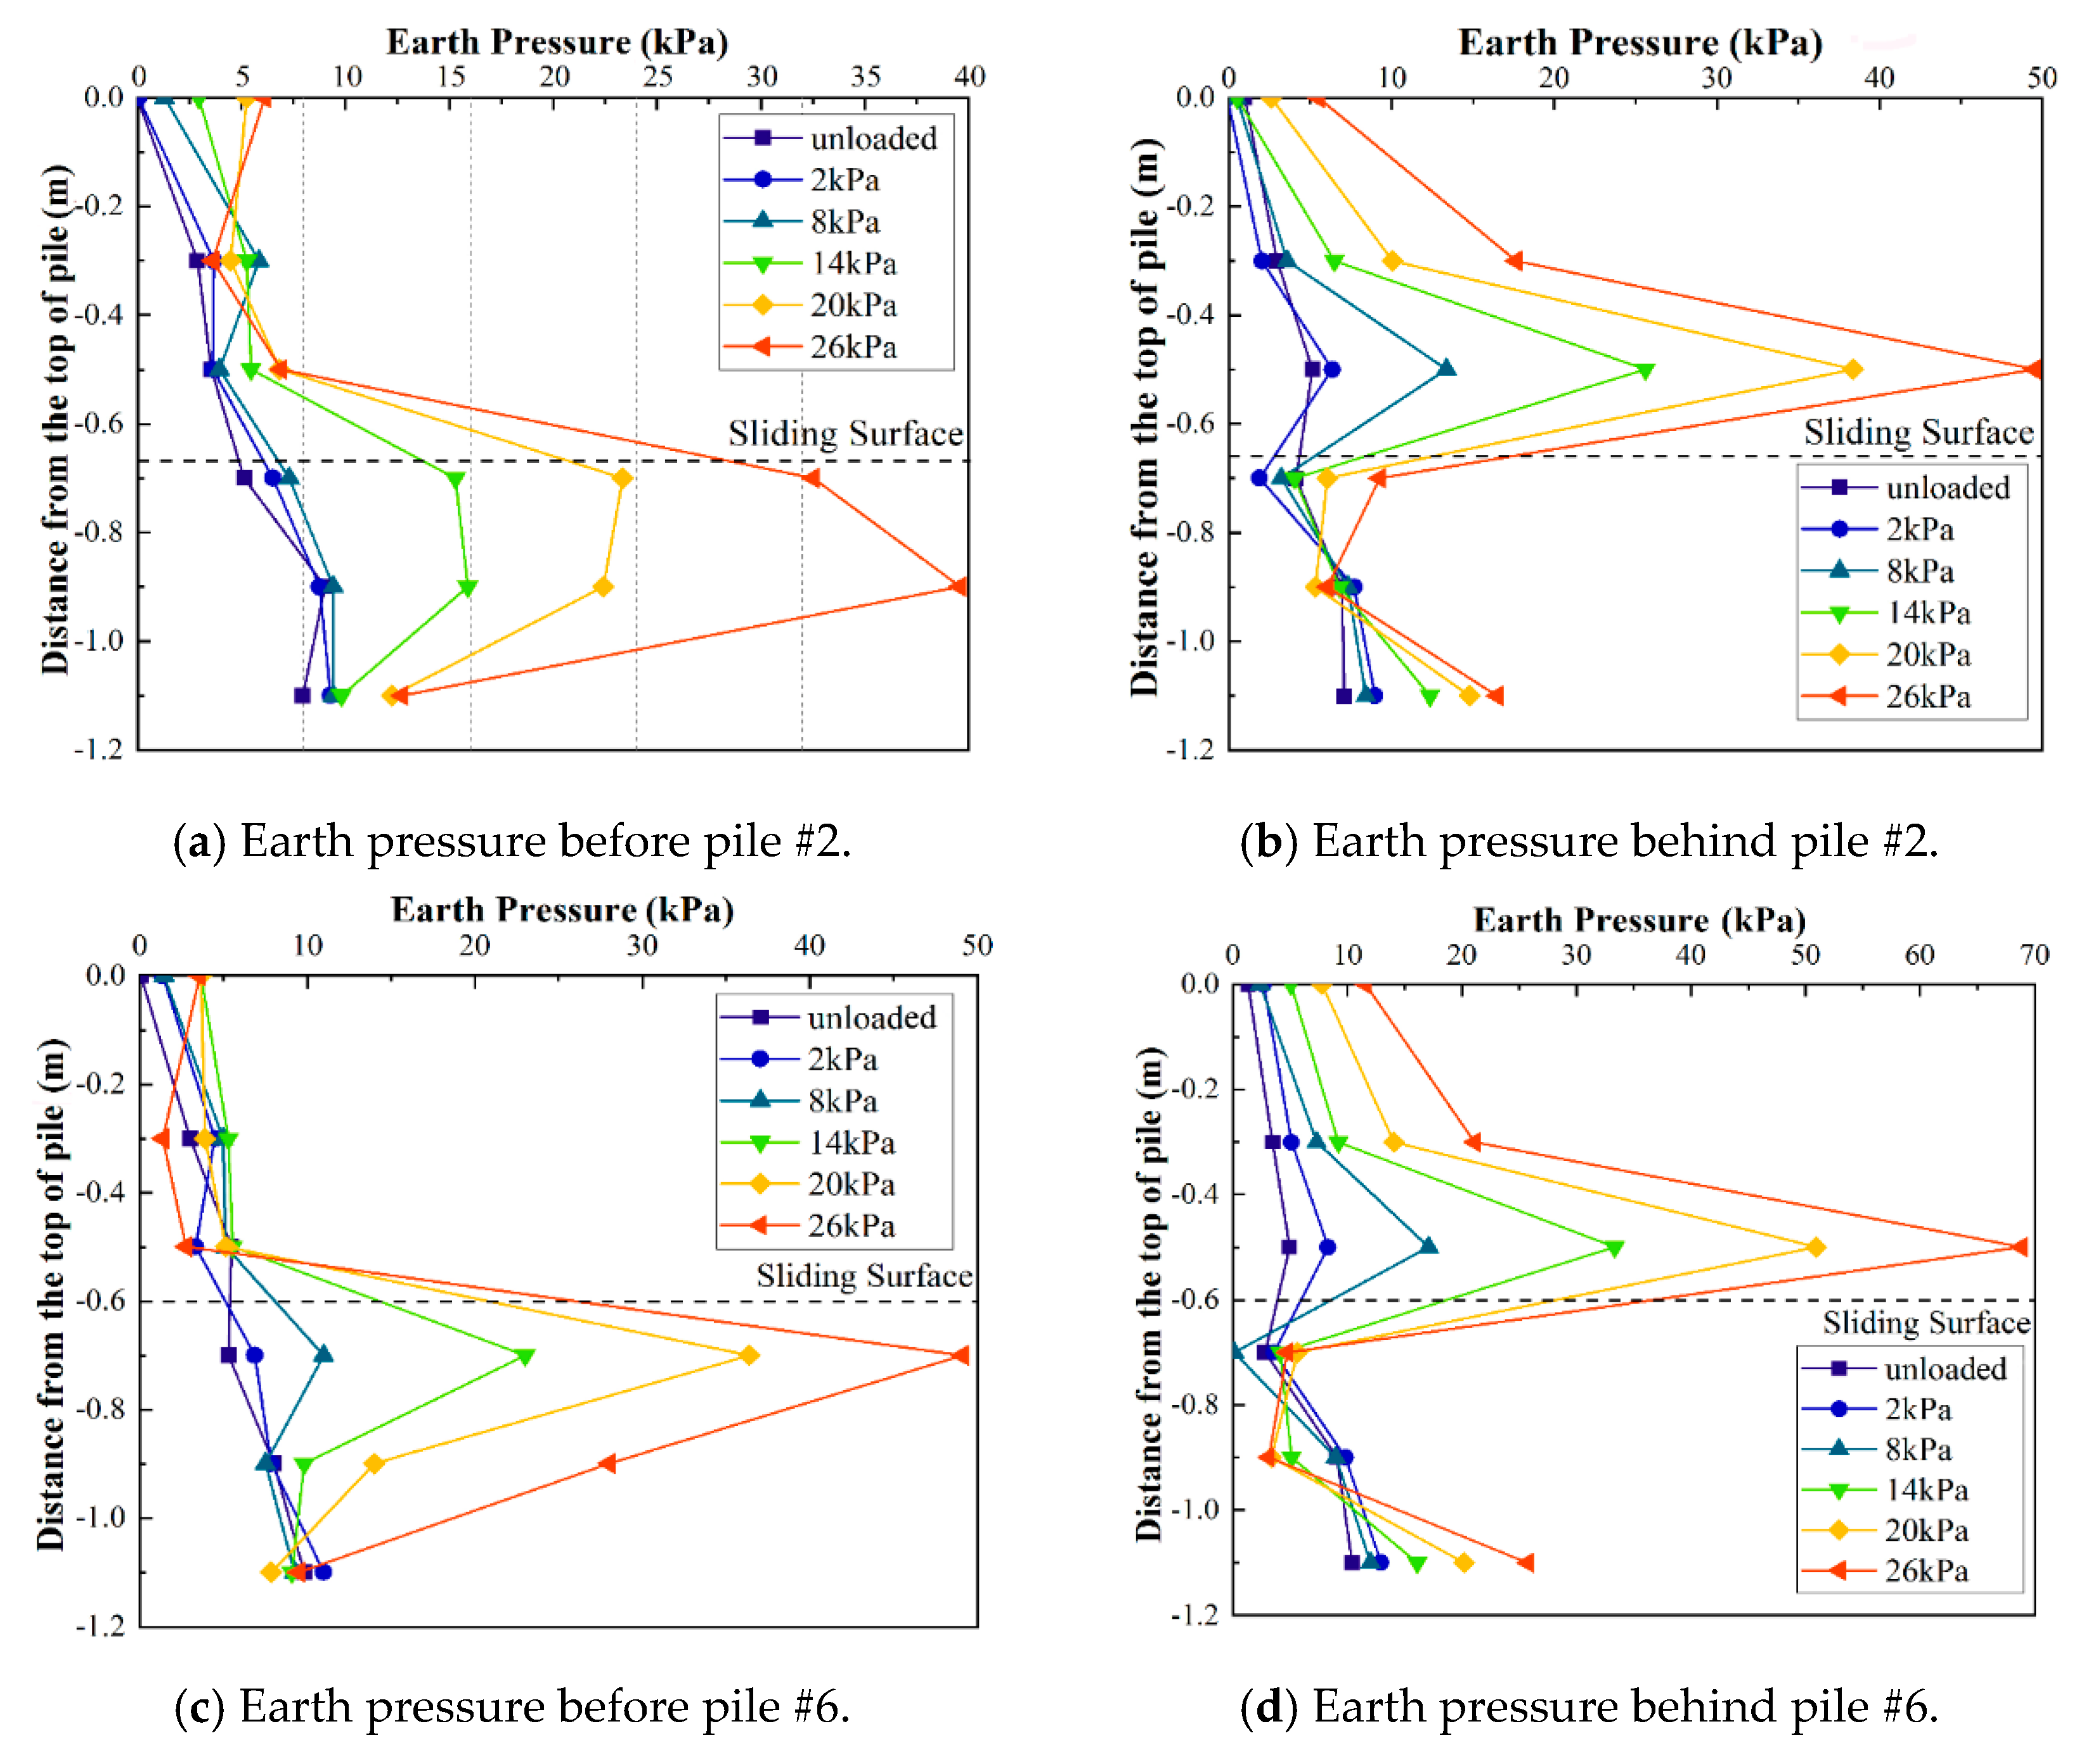
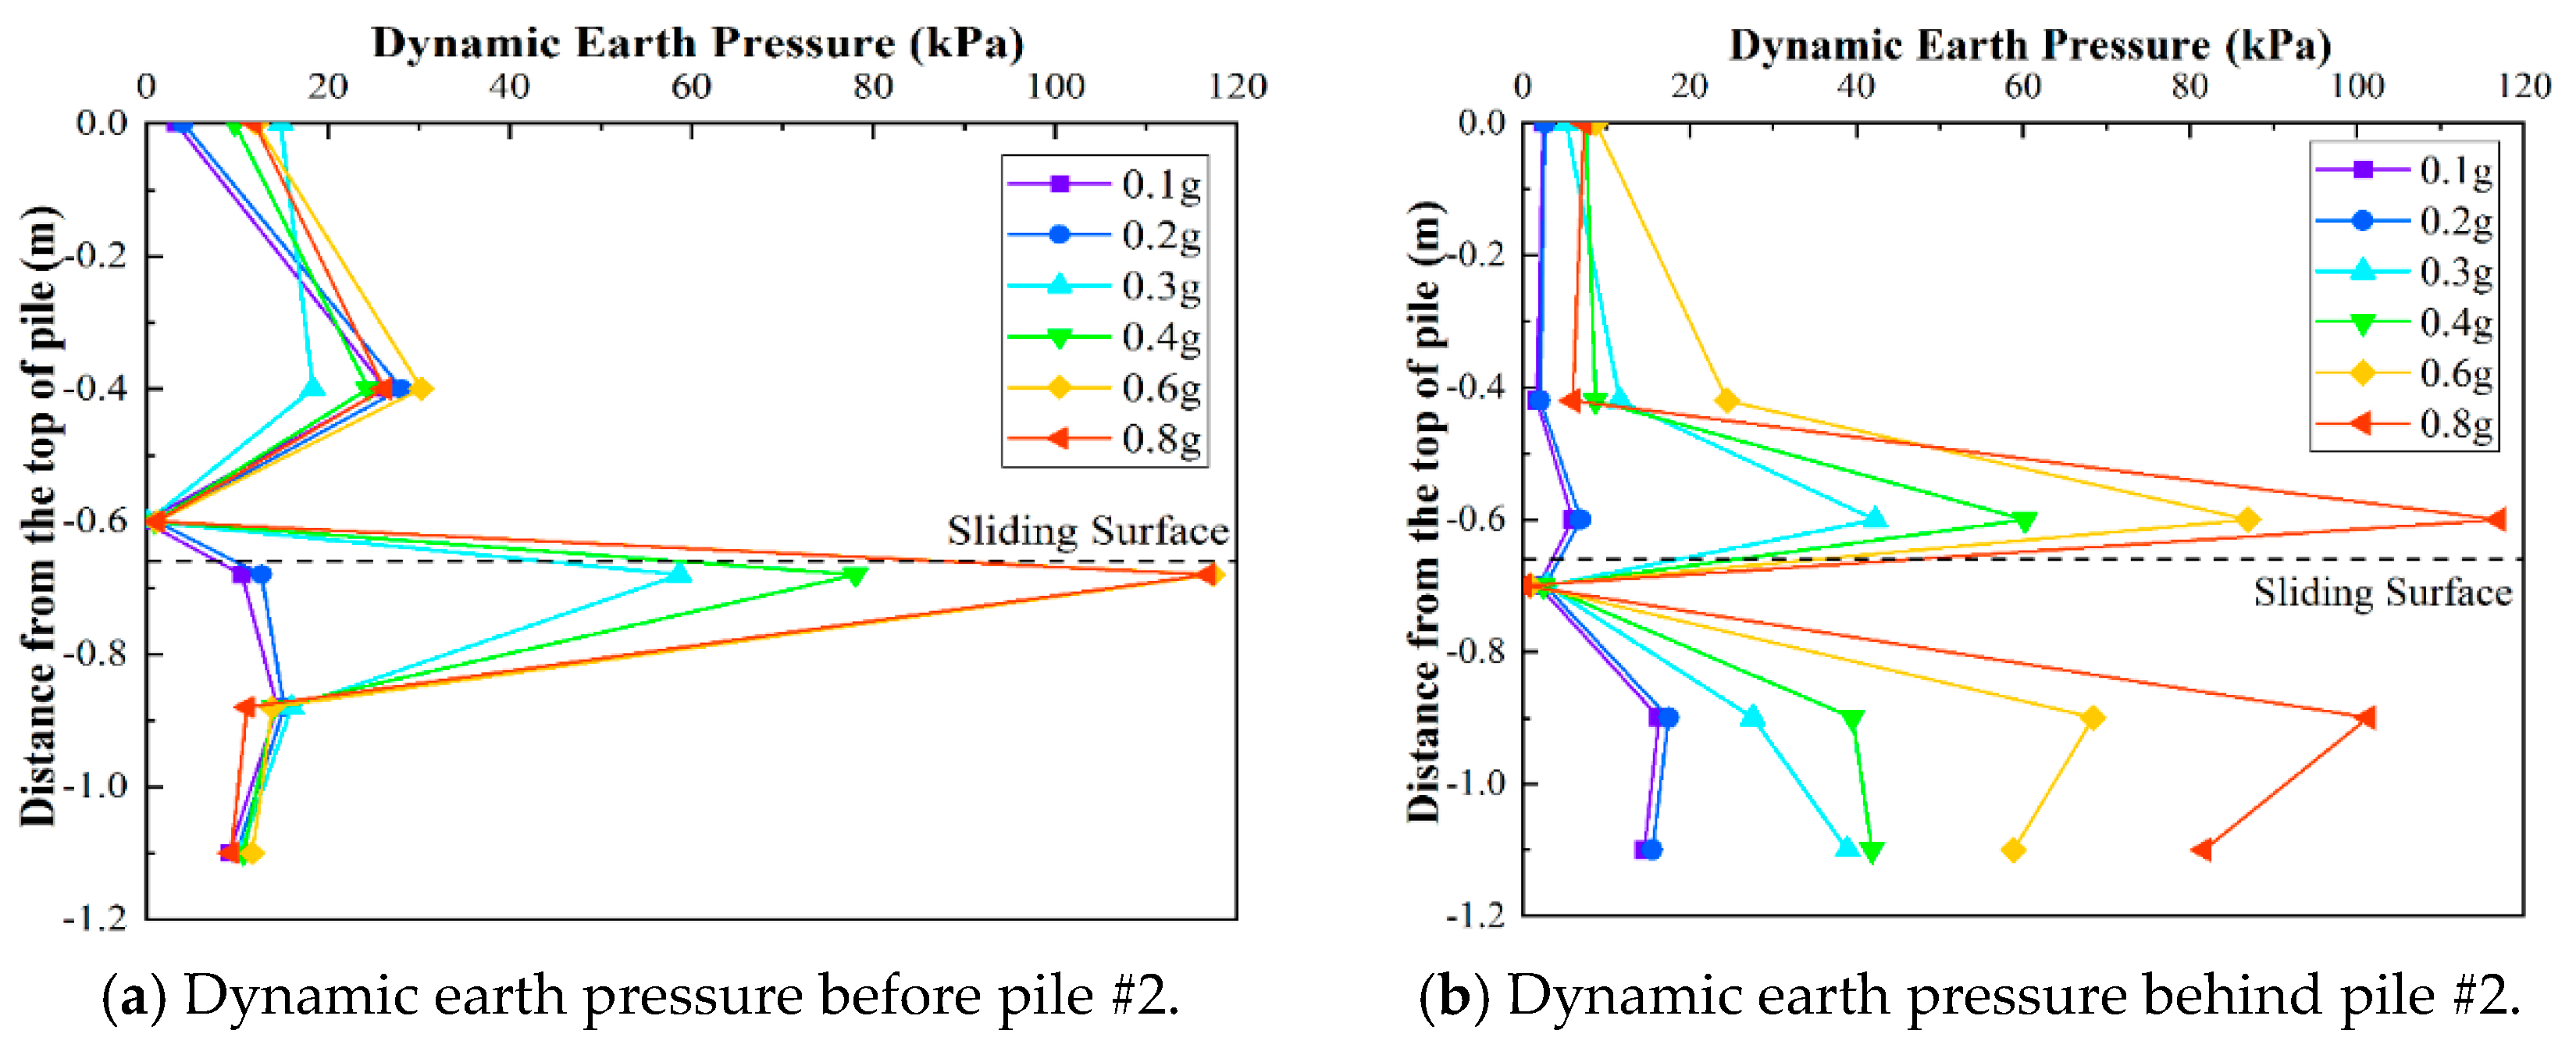
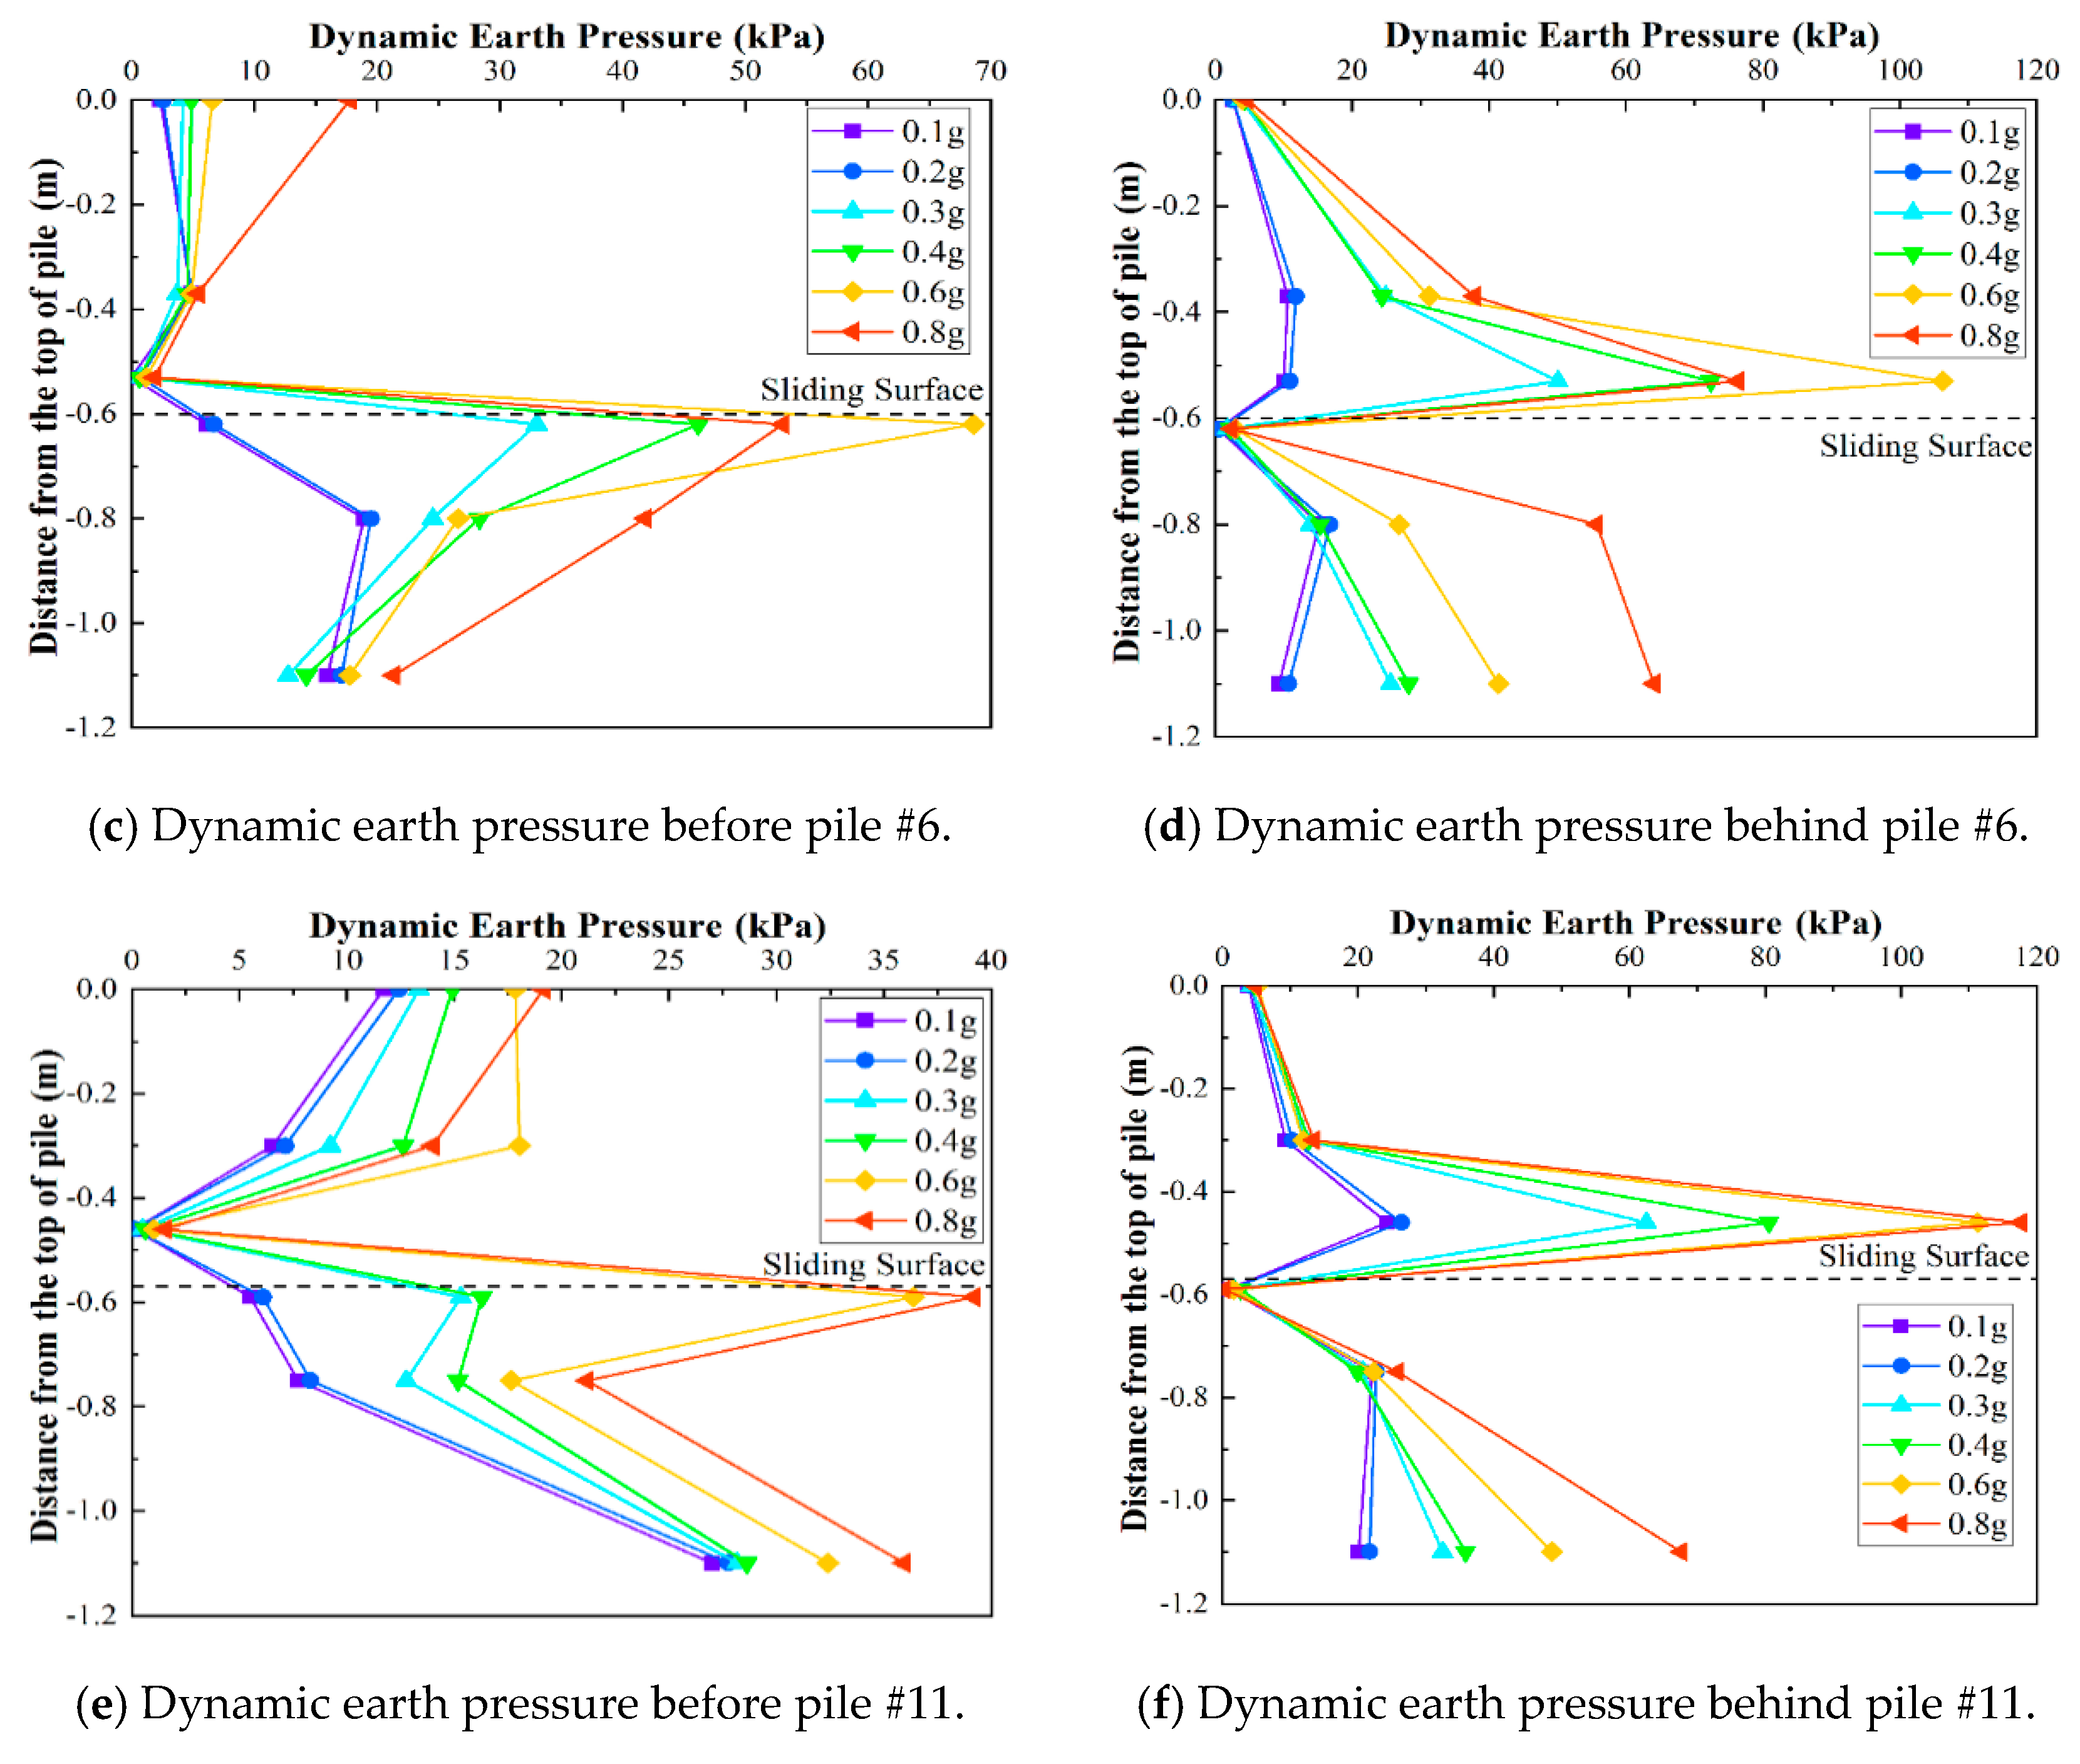
3.3. Earth Pressure Response Analysis

In order to study the response of earth pressure on the front and back of each row of the piles, piles #2, #6 and #11 were selected for analysis. The side facing the slope top was defined as the back of the pile, and the other side was defined as the front of the pile. Moreover, the “share ratio” is defined as the group effect reduction parameter for decreasing the load capacity of the pile.
Figure 12 shows the distribution curve of the earth pressure before and after each row of piles in the static model test. The earth pressure distribution before and after each row of piles is distributed triangularly, that is, the triangular shape is mainly due to the limited number of strain gauges. The earth pressure behind the piles is mainly distributed in the loaded section above the sliding surface, and gradually increases as the load increases. Nevertheless, the soil pressure behind the piles in the embedded section below the sliding surface is relatively minor. The stresses are primarily manifested in the resistance of the soil before the pile and are due to the deformation of the pile body, which also increases with the accumulation of the load. It is worth noting that at 26 kPa, the maximum earth pressure behind the back row of piles is about 87.6 kPa, while that of the middle row of piles is around 68.1 kPa, and that of the front row of piles is roughly 49.5 kPa. Thus, the load on the rear row of piles is the largest, followed by the middle row of piles, and the front row of piles is the smallest. This is consistent with the experimental results. This is because the landslide thrust directly acts on the back row of piles, and the pile body has a blocking effect for the landslide thrust. The load transmitted to the middle and the front row will gradually decrease.
It can be seen from the Table 4 that the proportion of piles carried by the rear piles increases initially and then decreases as the load increases with the maximum value (0.411) achieved at 22 kPa. At this time, the ratio of the earth pressure behind each row of piles is back row piles: middle row piles: front row piles = 0.411: 0.348: 0.241. With the further increase in the load, the overall proportion of the middle row piles and the front row piles is slightly larger than under a 22 kPa load. This reveals that the back-row piles are already too deformed, and as such, their load bearing capacity becomes weaker. Meanwhile, the front row and the middle row piles play an increased role, and the earth pressure triggered by the loading is jointly shared by the front row and the middle row piles.
Figure 13 shows the distribution curve of the earth pressure before and after each row of piles in the shaking table test. As it can be seen from the figure, the maximum dynamic earth pressure is chiefly distributed on the upper and lower sides of the sliding surface. The earth pressure behind the piles is approximately “triangular”, which is similar with the results of the static test. However, the dynamic earth pressure distribution in front of the pile is quite different compared to the static test, and obvious regularity does not exist. The reason may be the periodicity of the seismic load.
To contrast the sharing of dynamic earth pressure to each row of piles, the differences between the dynamic soil pressure in front of and after the piles under different peak accelerations are shown in Table 5. For instance, at a peak acceleration of 0.3 g to 0.6 g, the share ratio of the rear row piles is around 0.436 to 0.466, the middle row piles are roughly 0.370 to 0.400, and the front row piles are about 0.153 to 0.164. Compared to the static loading case, under seismic loading, the loading percentage of the front-row piles is significantly reduced. This may be because the peak value of the seismic load is instantaneous, and its effect is weakened before it can be transmitted to the front row of piles, resulting in limited load bearing effect on the front row of piles.

3.4. The Internal Force Response Analysis of the Pile

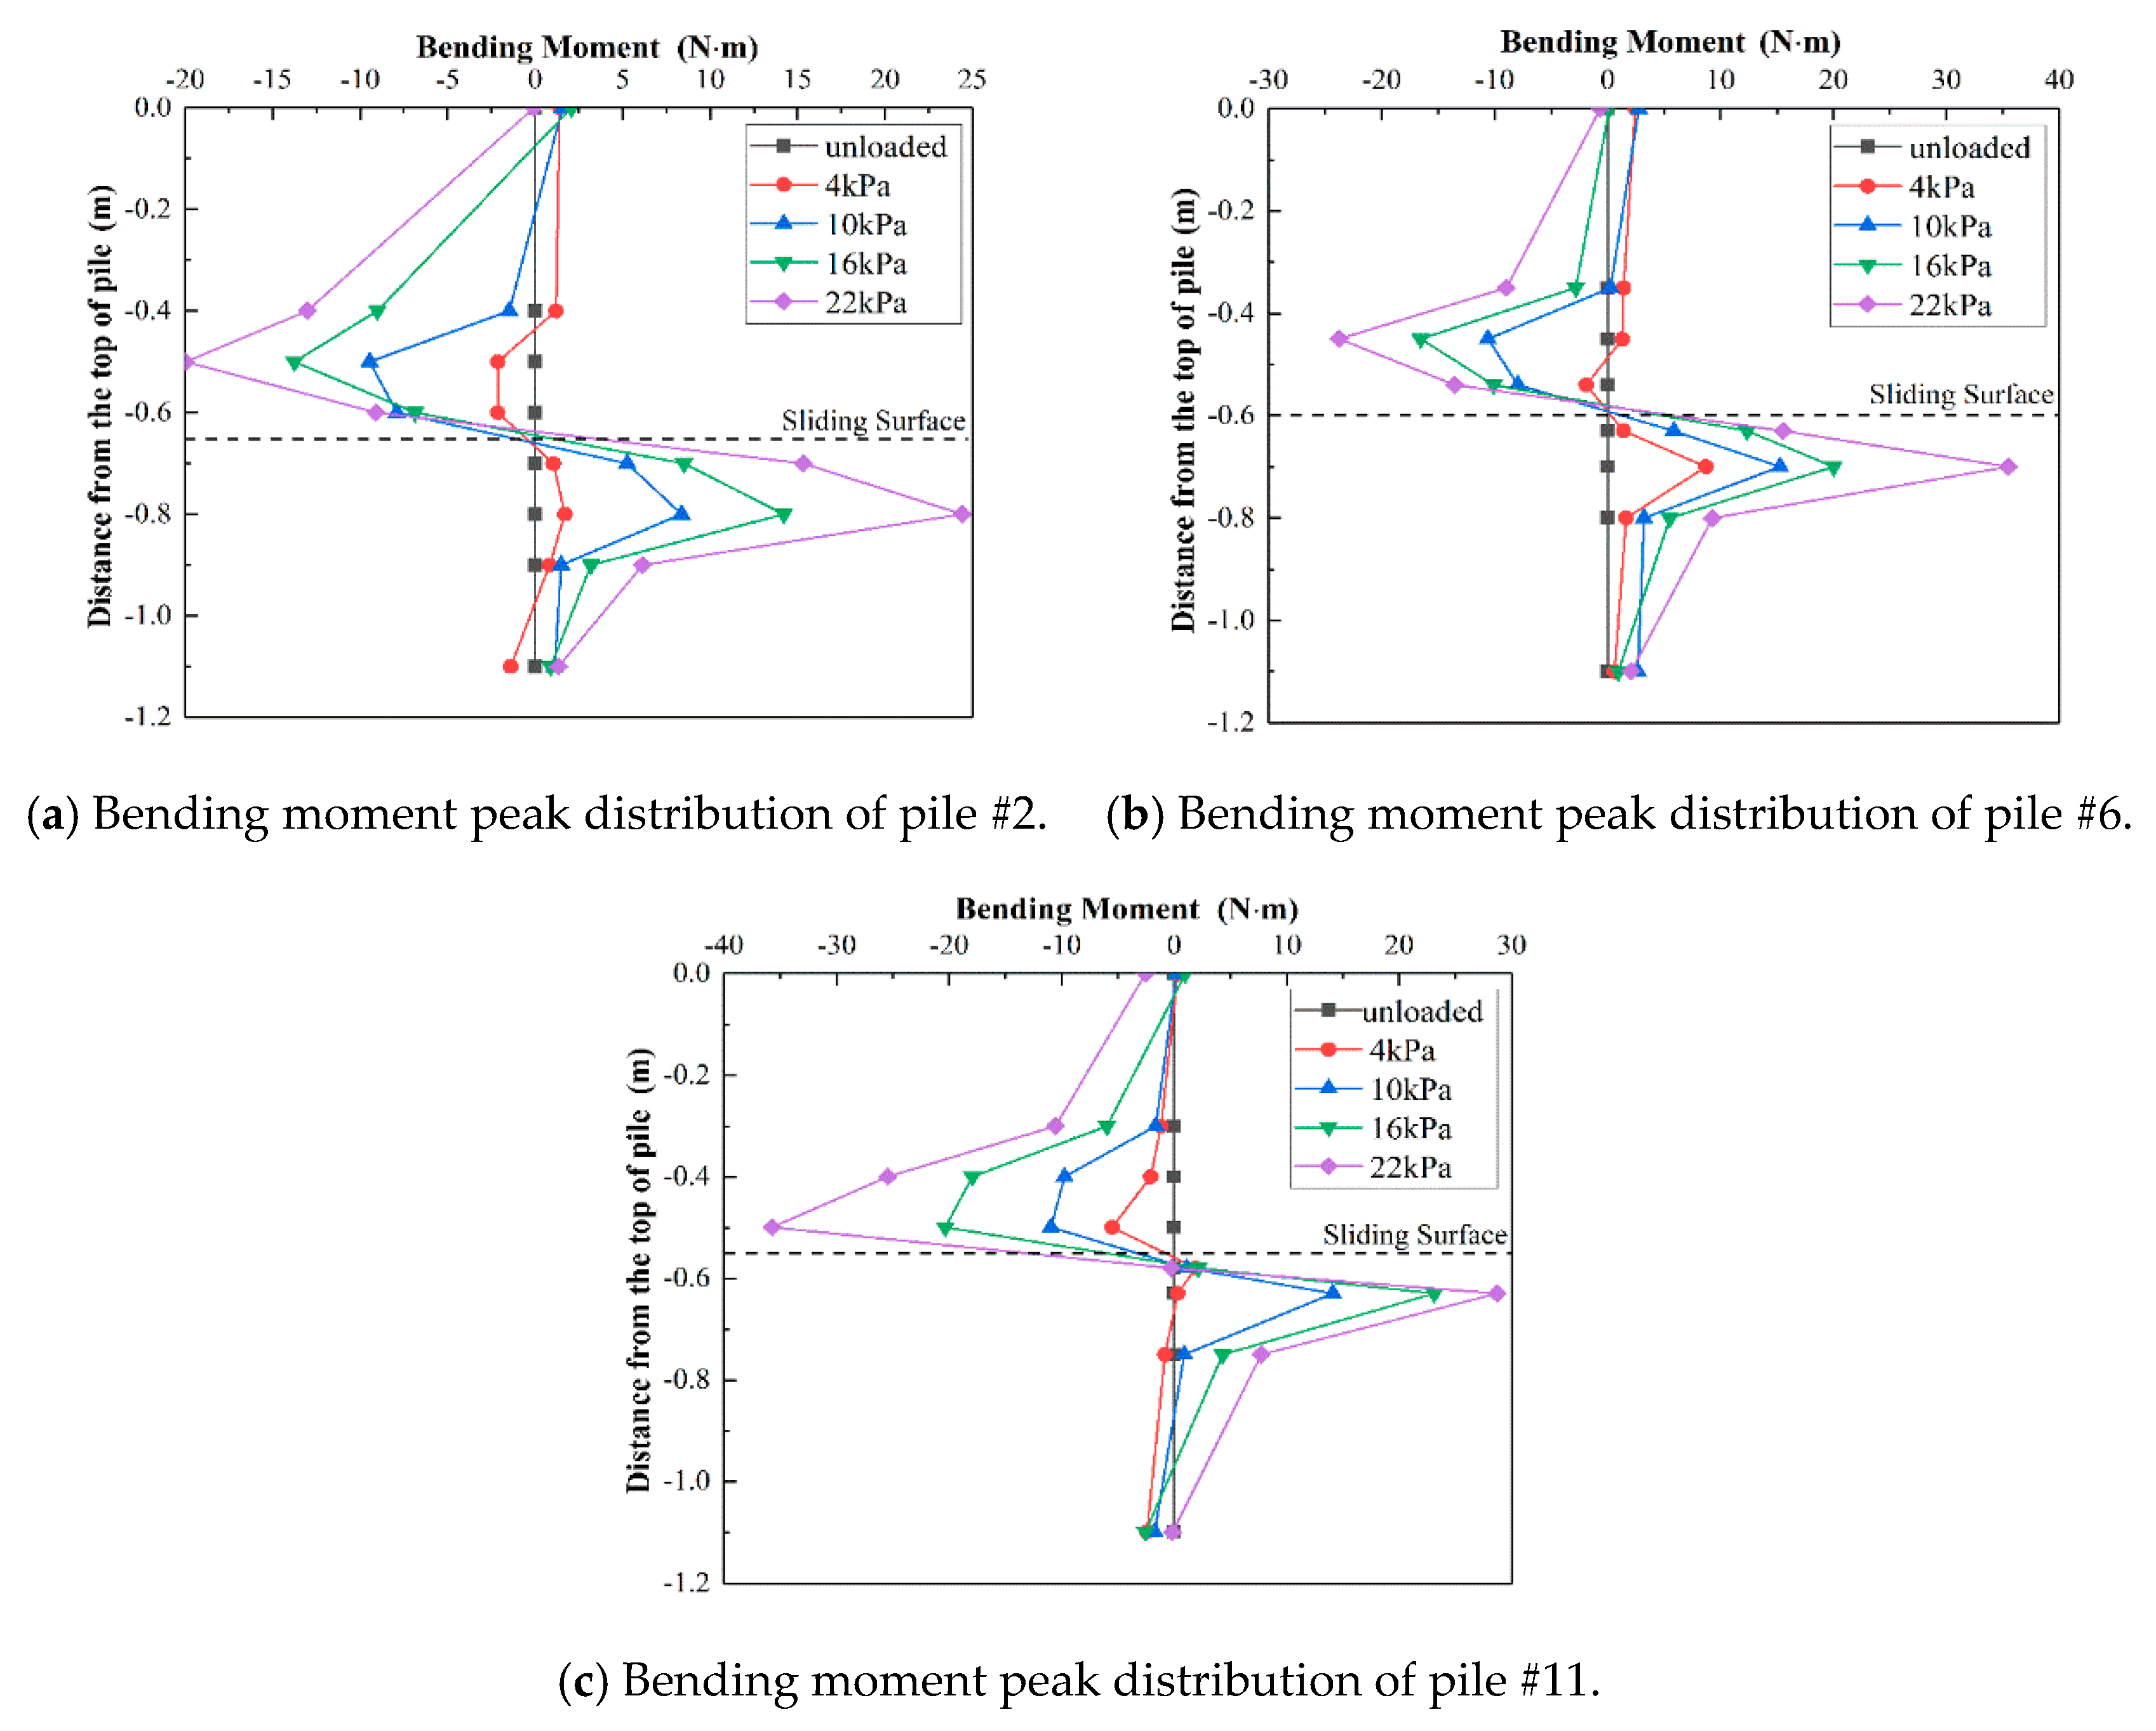
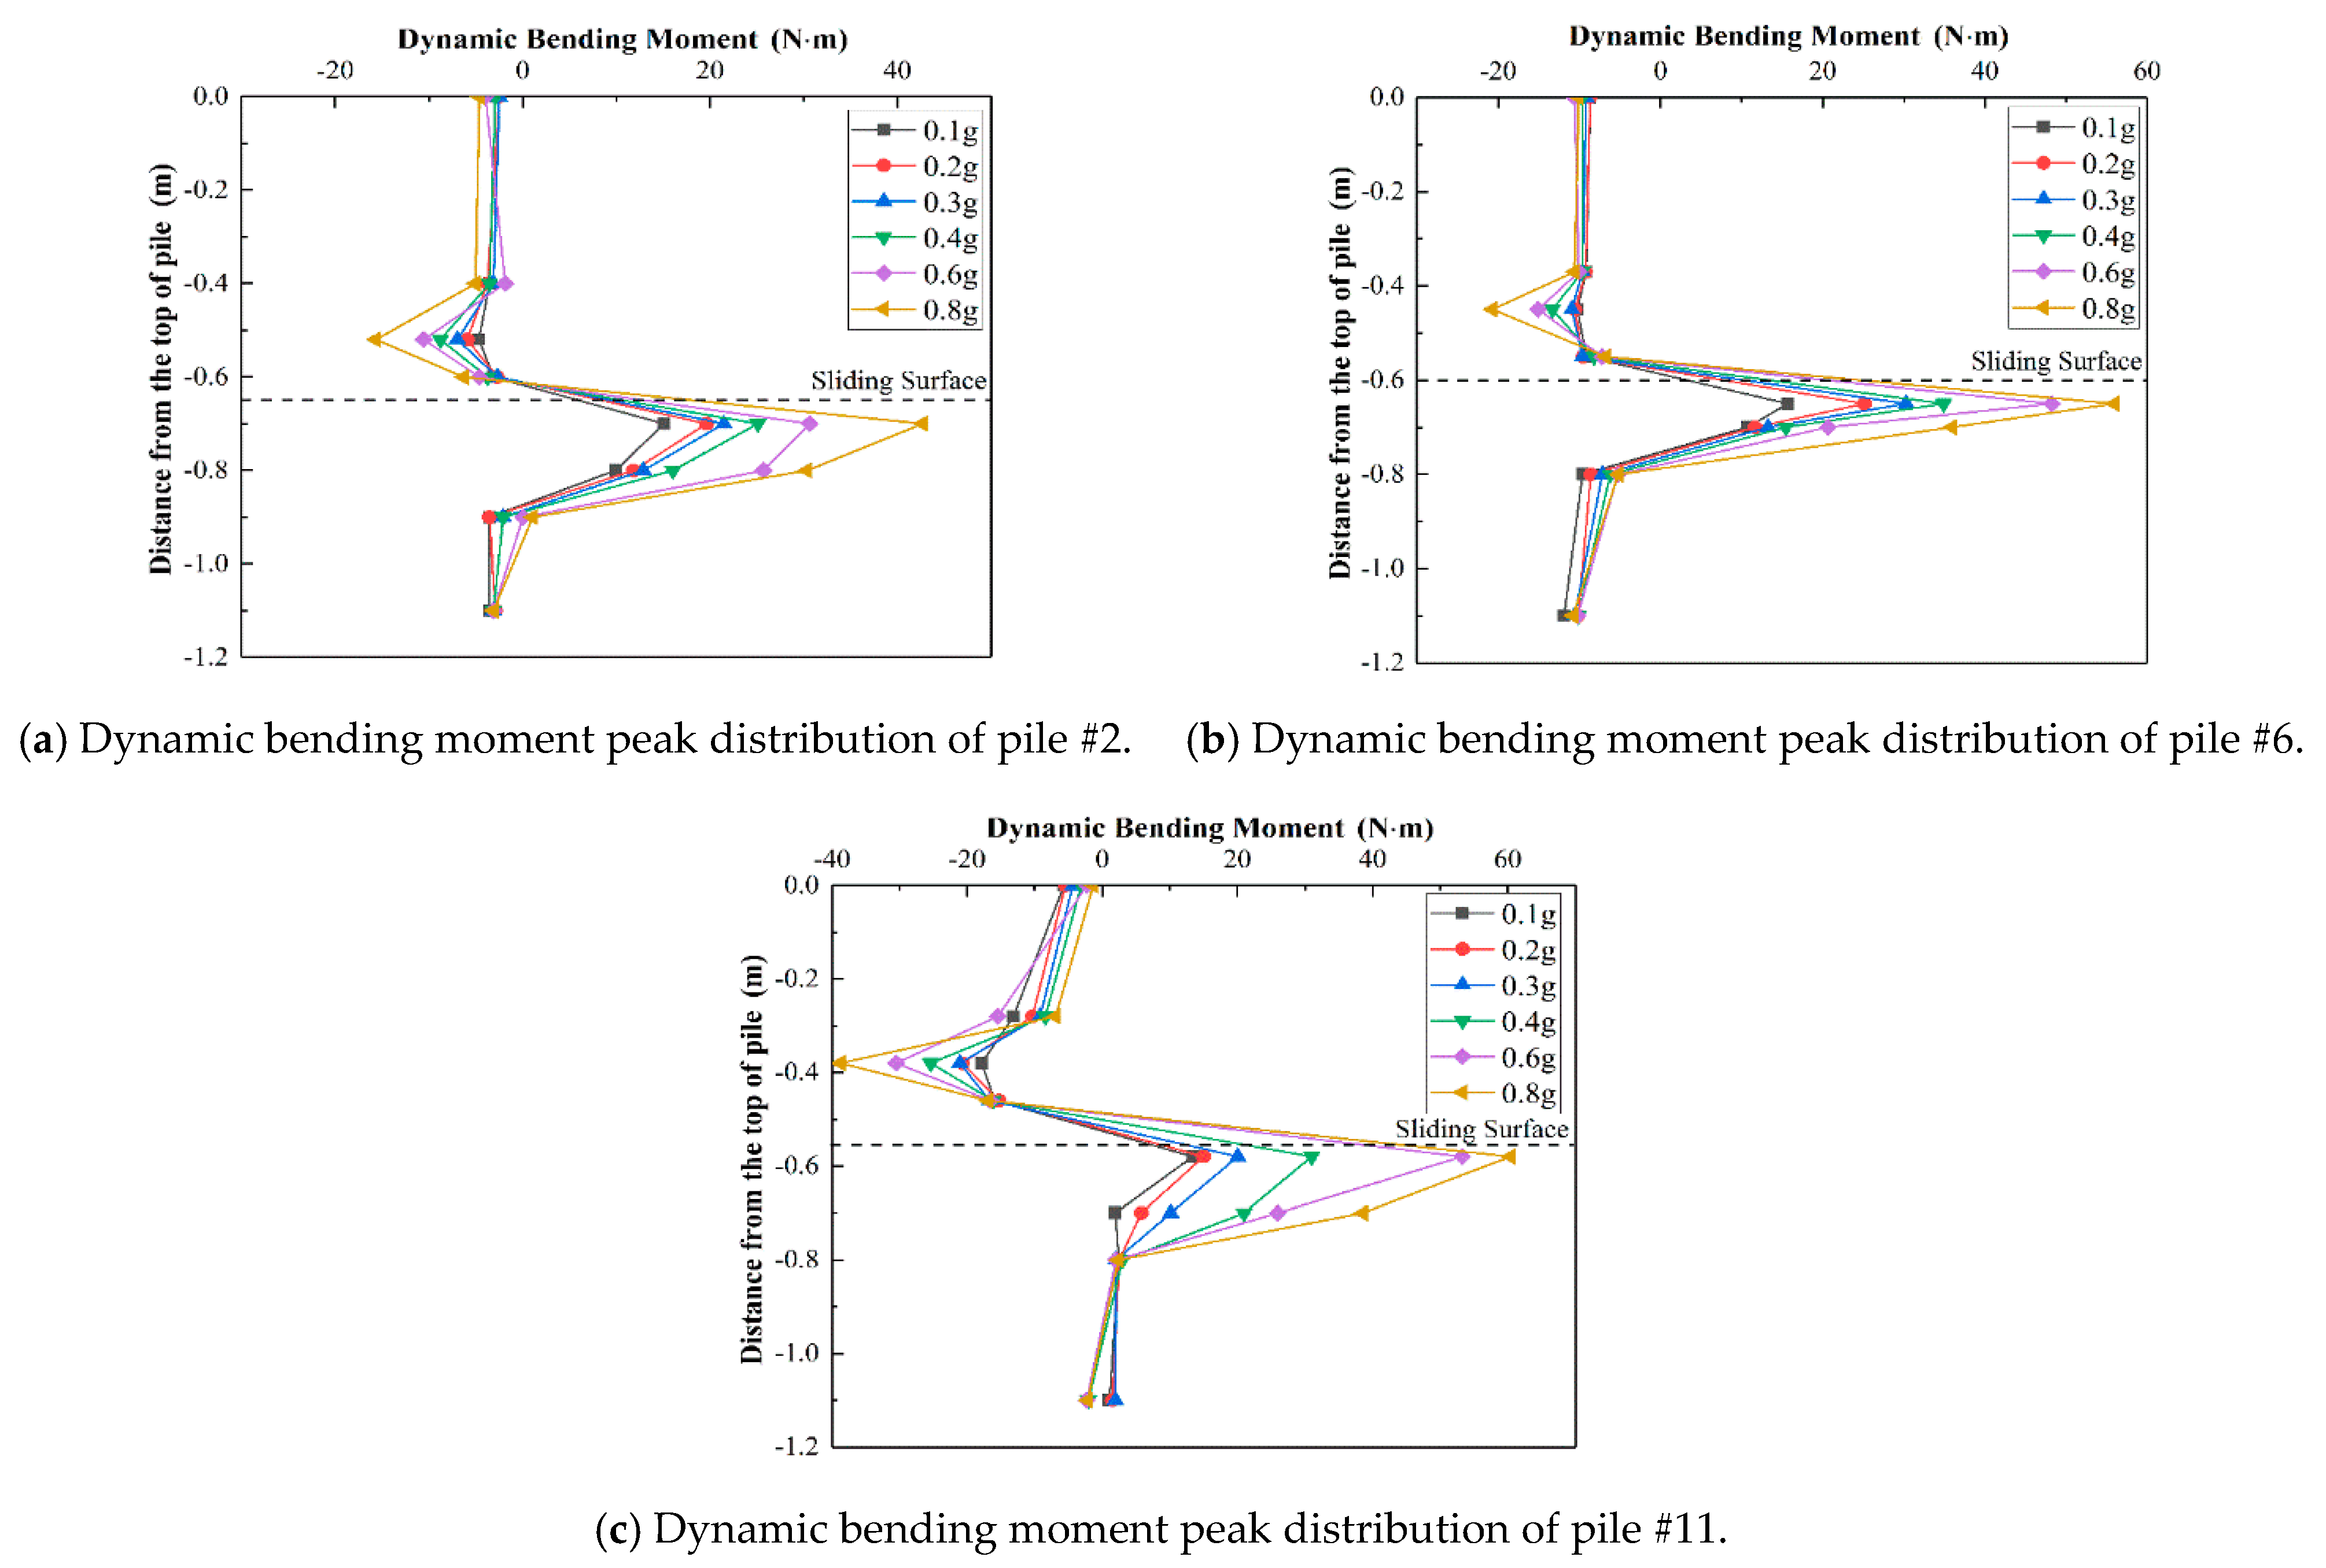
3.4.1. The Bending Moment Response of Pile

Figure 14 shows the bending moment distribution curve of each row of piles in the static model test. As it can be seen from the figure, the distribution of each row of piles present a “S” shape, the maximum negative bending moment appears above the sliding surface (the loaded section of the pile), and the maximum positive bending moment appears below the sliding surface (the embedded section of the pile). However, the location is slightly different. The distances from the maximum negative bending moment of piles #2, #6 and #11 to the sliding surface are 0.15, 0.13, and 0.07, and the distance of the maximum positive bending moment from the sliding surface are 0.13, 0.11, 0.10, respectively. It can be seen that the closer to the trailing edge of the landslide is, the closer the position of the maximum positive and negative bending moment of the pile body to the sliding surface is. Therefore, plastic failure is more likely to occur under the same load. In addition, the bending moment of each row of piles increases as the load increases.
Figure 15 shows the bending moment distribution curve of each row of piles in the shaking table test. As it can be seen from the figure, similar to the static loading case, the bending moment distribution was also an “S” shape. The maximum negative bending moment appeared above the sliding surface (the loaded section of the pile), and the maximum positive bending moment appears below the sliding surface (the embedded section of the pile). However, what is different from the static loading is that the maximum positive bending moments were all approximately 0.033 m away from the sliding surface (here: about one time the pile diameter), and the largest negative bending moments were around 0.15 m away from the sliding surface (here: about four times the pile diameter). This was because the direction of the applied seismic force was completely horizontal and had an elevation amplification effect, which directly caused the point of action of the resultant force acting on the pile to move upward. As a result, the position of the maximum positive bending moment of the pile was closer to the sliding surface, and the location of the maximum negative bending moment was farther away from the sliding surface than in the static test. Similarly, the bending moment of each row of piles increased as the peak acceleration of the input wave increased.

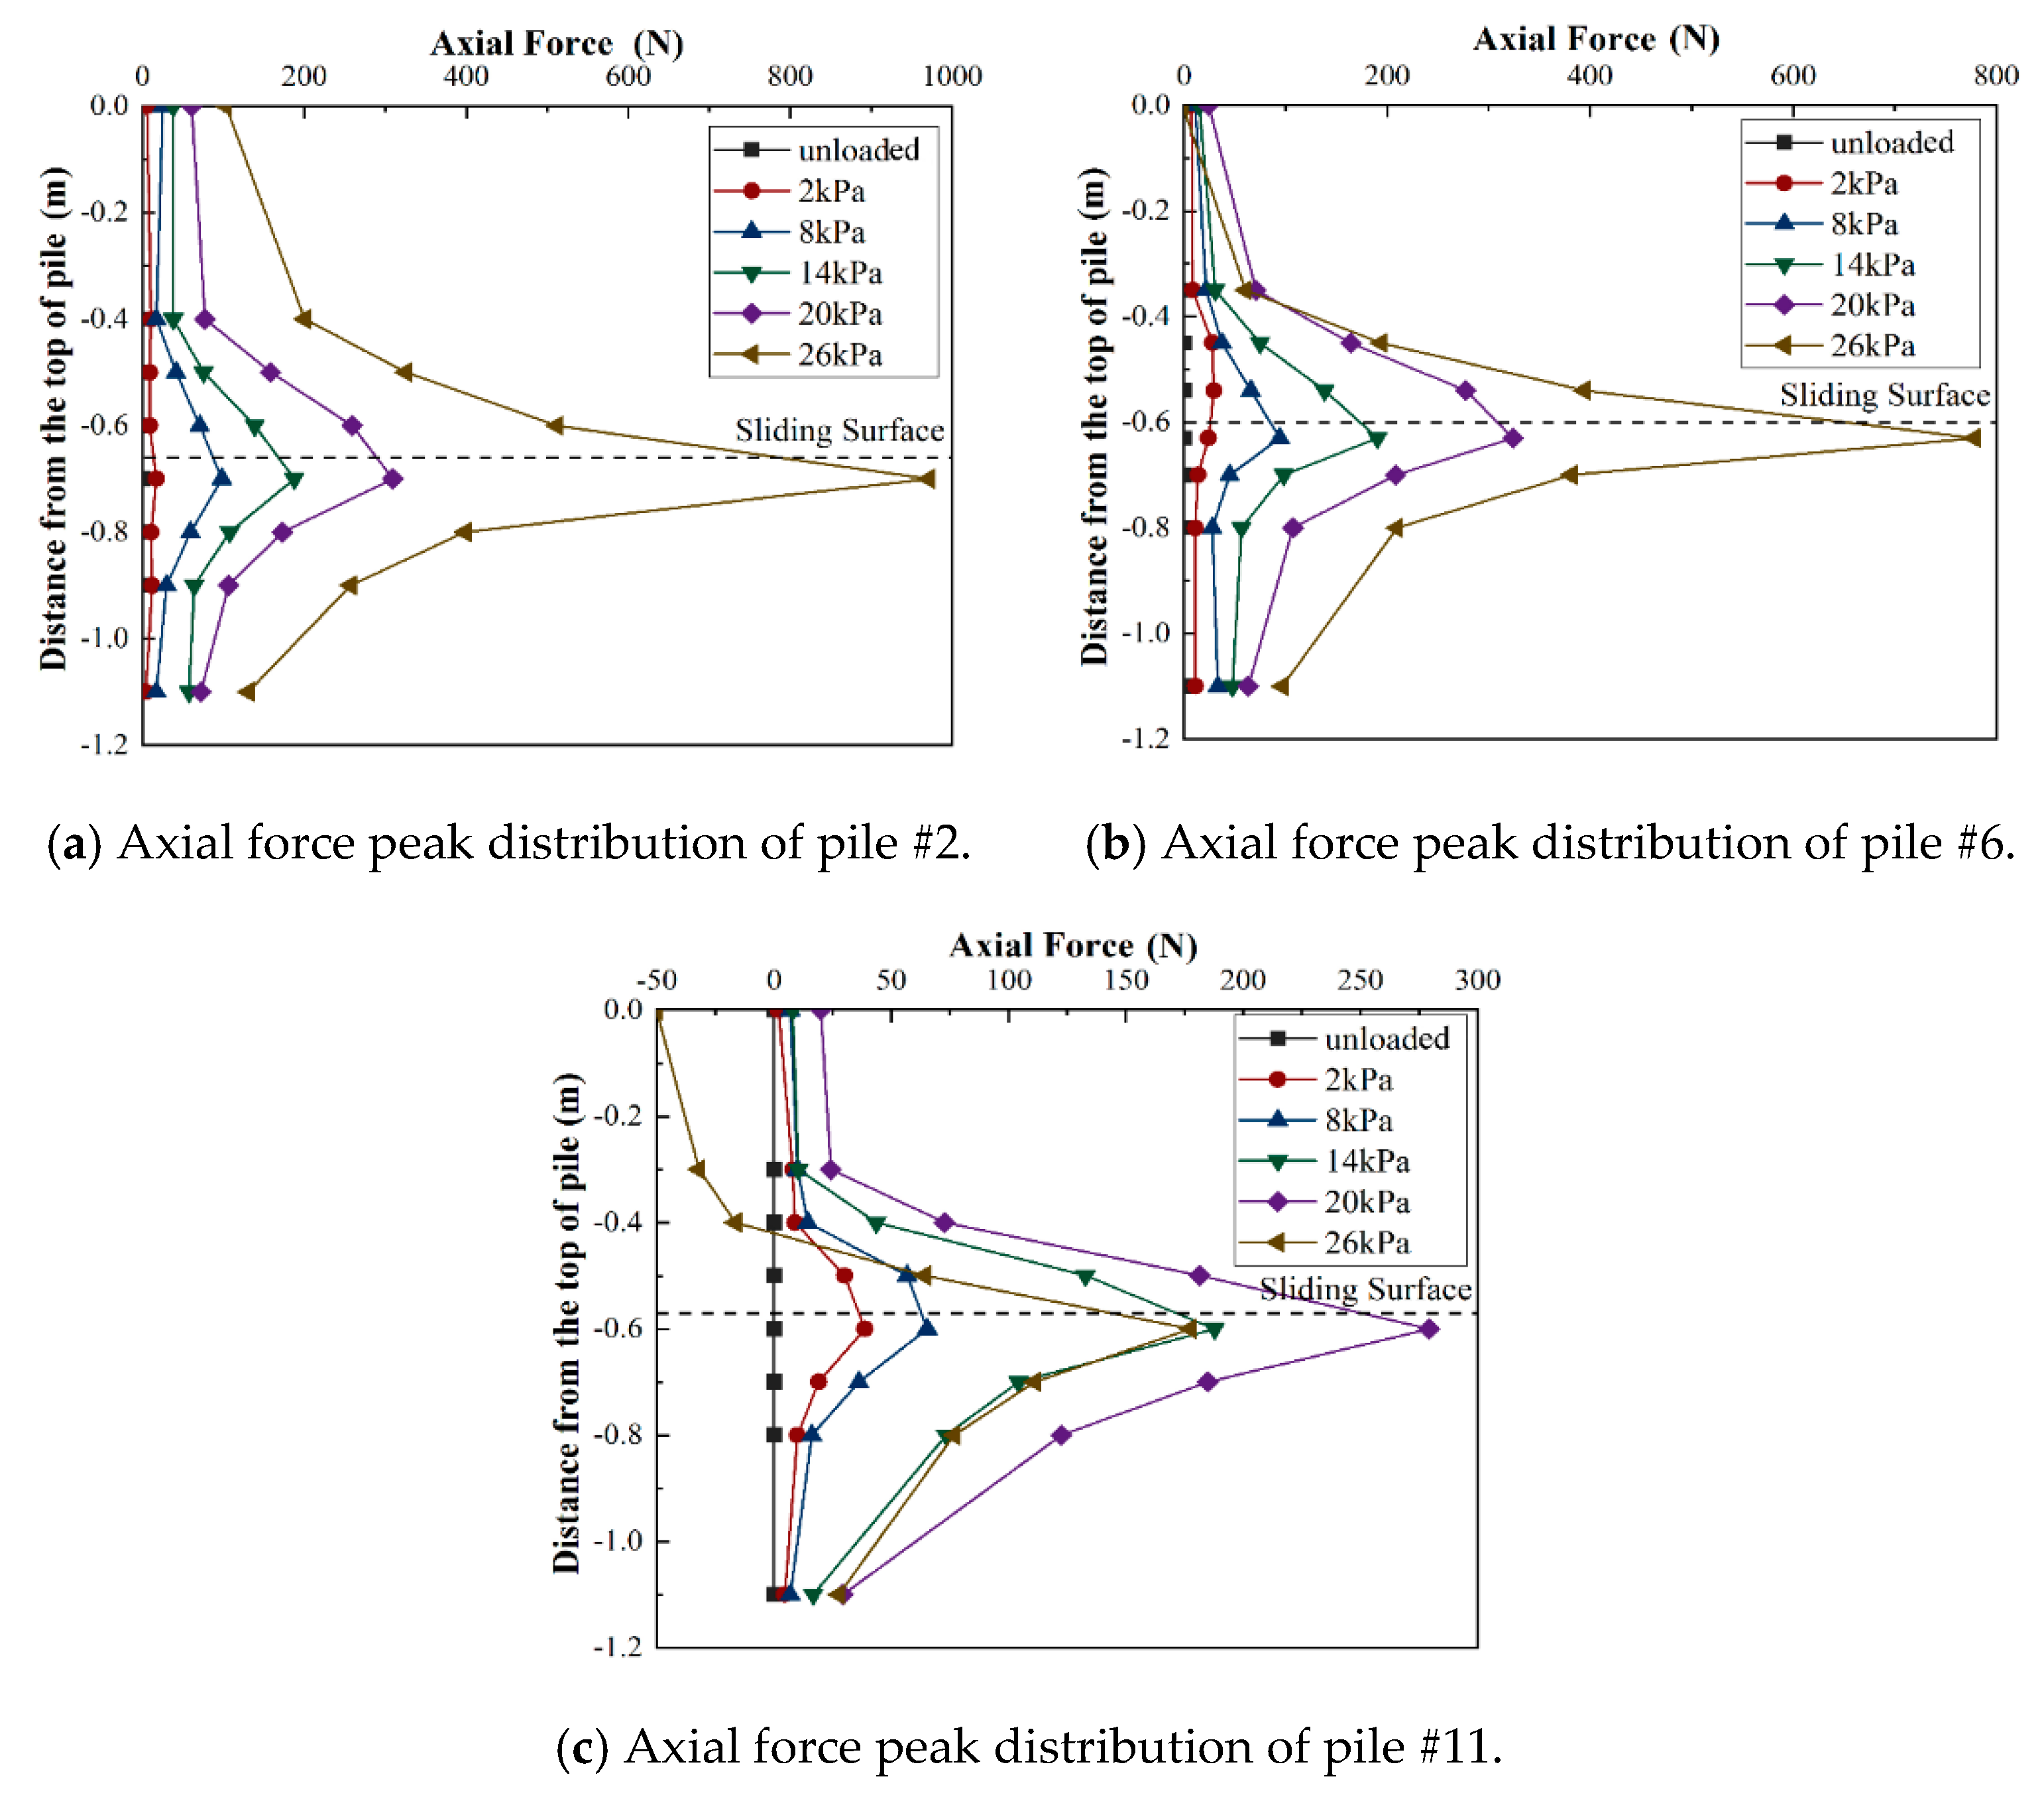
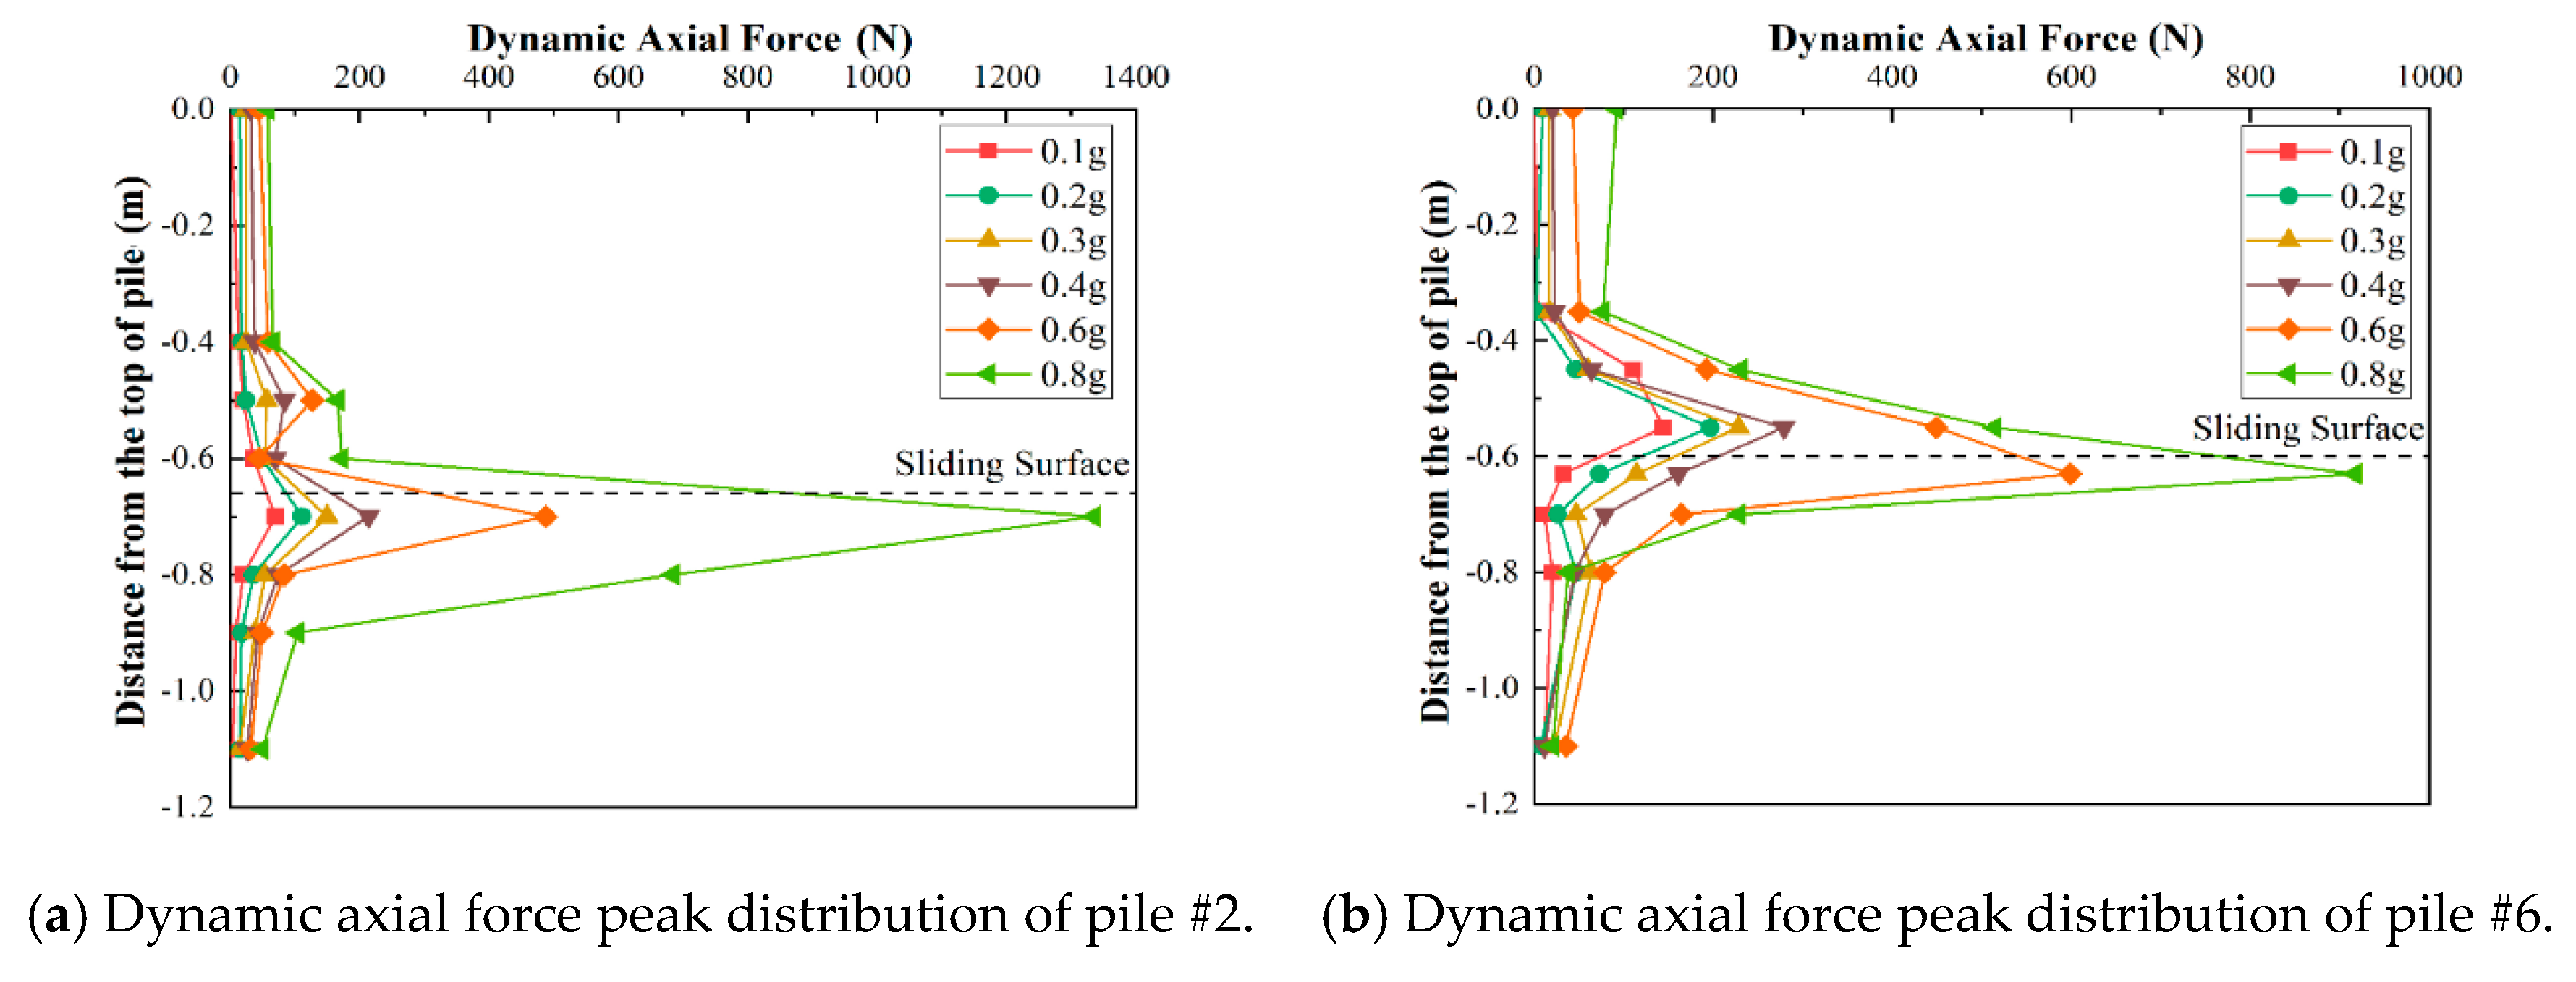
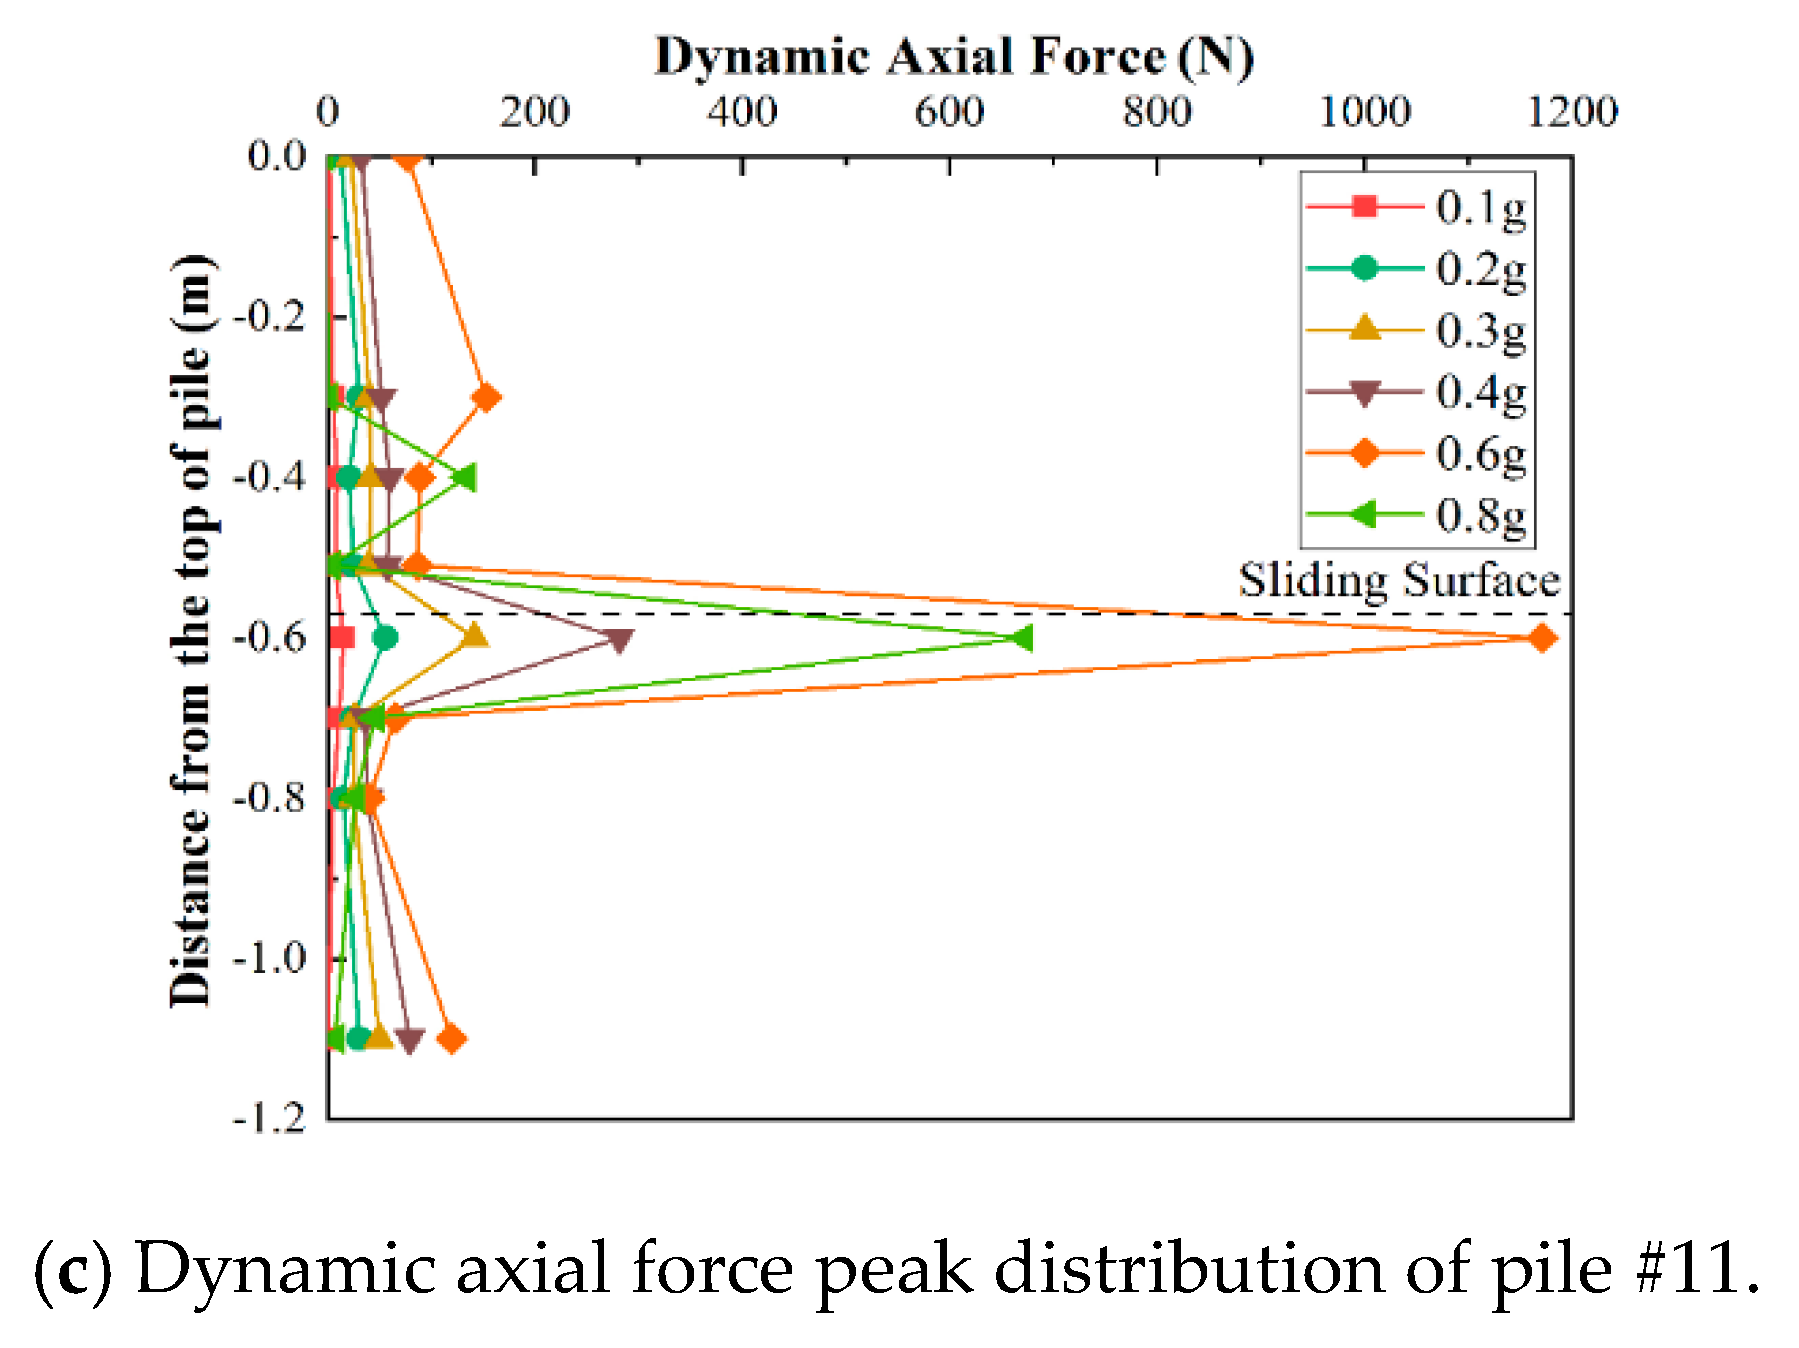
3.4.2. The Axial Force Response of Pile

Figure 16 shows the axial force distribution curve of each row of piles in the static model test. As it can be seen from the figure, the axial force distribution of each row of piles was distributed triangularly and was principally due to compressive stress (positive). At about 0.036 m (here: about one time the pile diameter) below, the sliding surface reached the maximum. Pile #2 was compressed under all levels of the load. When the load increased to 26 kPa, the pile #6, located near the top of the pile, occurred locally tensioned. Pile #11, also located near the top of the pile, had a local tension zone and the maximum axial force also decreased as the load increased. This was due to the circular sliding surface, and the landslide thrust acting on the pile tilted with the sliding surface. Hence, the micropiles were not completely horizontally loaded. Therefore, there was a landslide thrust component in the vertical direction that compressed each row of piles. Each row of piles could not achieve complete coordinated deformation during the deformation of the landslide. The rear-row piles had excessive deformation and tended to be tensioned, and to a certain extent, tended to offset the compressive stress of the pile. Therefore, the axial force decreased as the load increased. On the other hand, due to the connecting beam, the top of each pile was linked together, so the upper part of the pile was under tension. This also reflects that when the micropiles are used for slope stabilization, the micropiles do not completely fail after bending and shear failure, but continue to block the continuous deformation of the slope in the form of tensile and compression resistance.
Figure 17 shows the axial force distribution curve of each row of piles in the shaking table test. As it can be seen from the figure, similar to the case of the static model test, the axial force distribution of each row of piles is distributed triangularly, and it is mainly caused by compressive stress. Additionally, the maximum axial force appeared near the sliding surface, but the regularity is much more complicated than the static model test situation. It is worth noting that the maximum axial force of the front row and the middle row of piles are both obtained when the peak acceleration is 0.8 g. However, for the rear row of piles, the axial force under 0.8 g was smaller than it was under 0.6 g. As illustrated in the comparison of the results, the dynamic results are similar to the static case. After the damage of the rear piles exceeded a certain limit, the piles gradually transformed from compression to tension, and the axial force was somewhat reduced.

4. Discussion

This paper investigated the reinforcement and stabilization effects of micropile on slopes through carrying out static and dynamic model tests. However, some literature [12] has only studied the performance of micropiles under horizontal loads from static tests alone, and other literature [18] has only studied the dynamic characteristics of micropile reinforced landslides through a shaking table. As such, through systematic research and comparison, the reinforcing mechanism, seismic response mechanism, and failure modes of the micropiles were discussed, which is very important for the application of micropile in landslide prevention and slope stability design.
Applying the results of these tests to the reinforcement of soil landslides, we can consider increasing the number of longitudinal steel bars nearly three times the pile diameter above and below the sliding surface of the micropiles in the design process, which can avoid damage caused by an excessive bending moment. In addition, the results show that the damage degree and landslide thrust of the rear row piles are significantly greater than the piles in the first two rows, which can be taken into account to enlarge the rear row pile diameter to improve bending resistance as well as to enhance the overall stability of the micropiles through the reduction of pile spacing, etc. Therefore, the reinforcement capacity of the rear row of piles can be strengthened during the design process, especially in earthquake areas. Of course, other scholars can learn about the reinforcement and stability effect of micropile on a slope as well as the reinforcement mechanism, seismic response mechanism, and failure mode of micropile from this article. The results will also help other researches understand the proportion of landslide thrust that each row of piles bears when multi-row piles are used to reinforce a landslide. The proportions are not equal, but they are specific. Meanwhile, the distribution of earth pressure, bending moment, and axial force behind each row of piles can also be understood through this research.
On the other hand, in the future, more in-depth research can be conducted in the following two directions: (1) different types of seismic waves can be input for the study of soil–pile dynamic interaction, and (2) different types of micropile groups can be considered for the study of the supporting effect of piles on landslide treatment.

5. Conclusions

The static model test and shaking table tests were performed to study the anti-sliding characteristics of the interaction between micropiles and the landslide under static and dynamic loading. Through systematic research and comparison, the reinforcing mechanism, seismic response mechanism, and failure modes of the micropiles are discussed. It may be expected that in reality, a dynamic situation involves a larger failure/slide body because of the importance of inertia effects of the slope. The results show that under static and dynamic effects, the distribution of earth pressure, bending moment, and axial force on each row of piles are different. Additionally, the landslide thrust that each row of piles bears is not equally distributed, with each row bearing a certain proportion. In addition, the rear row piles require the most attention. However, this article still has the following shortcomings: (1) The sliding surfaces of the two tests are all preset sliding surfaces, which may more or less affect the results; (2) In the dynamic test of this paper, only horizontal earthquakes were considered, and the combined effects of horizontal and vertical earthquakes can be considered at a later stage; (3) While not being mandatory, it would be interesting to see a comparison of the test results with numerical analyses. This may be considered as future work.

Author Contributions

Project administration, Y.M.; data curation, T.Y.; investigation, T.Y.; writing—original draft, Y.M. and T.Y.; writing—review and editing, C.J.R. and Z.Z. All authors have read and agreed to the published version of the manuscript.

Funding

This research was funded by the financial support provided by the National Natural Science Foundation of China (Grant No. 41572261).

Institutional Review Board Statement

Not applicable for studies not involving humans or animals.

Informed Consent Statement

Not applicable for studies not involving humans.

Data Availability Statement

Data sharing not applicable. No new data were created or analyzed in this study. Data sharing is not applicable to this article.

Acknowledgments

The authors would like to thank the T.Y., C.J.R. and Z.Z. for their very helpful support in the writing of this research.

Conflicts of Interest

The authors declare no conflict of interest.

References

  1. Gao, Y.; Li, B.; Gao, H.; Chen, L.; Wang, Y. Dynamic Characteristics of High-Elevation and Long-Runout Landslides in the Emeishan Basalt Area: A Case Study of the Shuicheng ‘7.23′ Landslide in Guizhou, China. Landslides 2020, 17, 1663–1677. [Google Scholar] [CrossRef]
  2. Warrick, J.A.; Ritchie, A.C.; Schmidt, K.M.; Reid, M.E.; Logan, J. Characterizing the catastrophic 2017 Mud Creek landslide, California, using repeat structure-from-motion (SfM) photogrammetry. Landslides 2019, 16, 1201–1219. [Google Scholar] [CrossRef]
  3. Igwe, O. The characteristics and mechanisms of the recent catastrophic landslides in Africa under IPL and WCoE projects. Landslides 2018, 15, 2509–2519. [Google Scholar] [CrossRef]
  4. Zhang, M.; Yin, Y.; McSaveney, M. Dynamics of the 2008 earthquake-triggered Wenjiagou Creek rock avalanche, Qingping, Sichuan, China. Eng. Geol. 2016, 200, 75–87. [Google Scholar] [CrossRef]
  5. Ma, C.; Yan, Z.W.; Huang, P.; Gao, L. Evaluation of Landslide Susceptibility Based on the Occurrence Mechanism of Landslide: A Case Study in Yuan’an County, China. Environ. Earth Sci. 2021, 80, 94. [Google Scholar] [CrossRef]
  6. Wallemacq, P.; Below, R.; McLean, D. Economic Losses, Poverty and Disasters 1998–2017; United Nations Office for Disaster Risk Reduction (UNDRR) and Centre for Research on the Epidemiology of Disasters (CRED) Publications: Brussels, Belgium, 2018. [Google Scholar] [CrossRef]
  7. Deng, Y.S.; Sun, Y.N.; Zhao, M.H.; Wu, P.; Wang, Q. Experimental and Calculation Analysis of Slope Protection by Collaborated Micropiles and Vetiver. China J. Highw. Transport. 2020, 33, 68–75. [Google Scholar] [CrossRef]
  8. Bayesteh, H.; Fakharnia, M.A.; Khodaparast, M. Performance of driven grouted micropiles: Full-scale field study. Int. J. Geomech. 2021, 21, 04020250. [Google Scholar] [CrossRef]
  9. Men, Y.M.; Yan, J.K. Research Report on Large-Scale Physical Model test of Landslide Micro-Pile Prevention Technology; Chang’an University: Xi’an, China, 2011. [Google Scholar]
  10. Yan, J.K.; Yin, Y.P.; Men, Y.M. Experimental study on reinforcement of landslide micro-pile group. China Civil. Eng. J. 2011, 44, 120–128. [Google Scholar] [CrossRef]
  11. Wang, S.F. Research on the Micro-Pile Prevention and Control Project of Wenchuan Earthquake Landslide; Chang’an University: Xi’an, China, 2010. [Google Scholar]
  12. Richards, T.D.; Rothbauer, M.J. Lateral loads on pin piles (micropiles). In Geo-Support 2004: Drilled Shafis, Micropile, Deep Mixing, Remedial Methods, and Specialty Foundation Systems, Geotechnical Special Publication 124; Turner, J.P., Mayne, P.W., Eds.; ASCE: Reston, VA, USA, 2004; pp. 158–174. [Google Scholar] [CrossRef]
  13. Andrew, Z.B. Load Transfer in Micropiles for Slope Stabilization from Test of Large-Scale Physical Models. D; University of Missouri-Columbia: Columbia, MO, USA, 2006. [Google Scholar]
  14. Bruce, D.A.; Caden, A.W.; Sabain, P.J. Practical Advice for Foundation Desig-micropiles or structural Support[C]//ASCE. In Proceedings of the Geo-Frontiers 2005 Congress; ASCE: Reston, VA, USA, 2005; pp. 1–25. [Google Scholar] [CrossRef] [Green Version]
  15. Freitas, A.C.D.; Danziger, B.R.; Pacheco, M.; Gerscovich, D.M.S. 3-D predictions of installation and group effect on driven piles in sands. Int. J. Geotech. Eng. 2014, 9, 101–112. [Google Scholar] [CrossRef]
  16. Wolter, A.; Gischig, V.; Stead, D.; Clague, J.J. Investigation of geomorphic and seismic effects on the 1959 Madison canyon, Montana, landslide using an integrated field, engineering geomorphology mapping, and numerical modelling approach. Rock Mech. Rock Eng. 2015, 49, 2479–2501. [Google Scholar] [CrossRef]
  17. Moayed, R.Z.; Naeini, S.A. Imrovement of loose sandy soil deposits using micropiles. KSCE J. Civ. Eng. 2012, 16, 334–340. [Google Scholar] [CrossRef]
  18. Komak, P.A.; Jalilian, M.H.; Yin, J.H.; Fai, L.Y. Shaking table investigation of effects of inclination angle on seismic performance of micropiles. Int. J. Geomech. 2018, 18, 04018142. [Google Scholar] [CrossRef]
  19. Capatti, M.C.; Dezi, F.; Morici, M. Field Tests on micropiles under dynamic lateral loading. Procedia Eng. 2016, 158, 236–241. [Google Scholar] [CrossRef] [Green Version]
  20. Rollins, K.M.; Johnson, S.R.; Petersen, K.T.; Weaver, T.J. Static and dynamic lateral load behavior of pile groups based on full-scale testing. In Proceedings of the 13th International Conference on Offshore and Polar Drilling, Honolulu, HI, USA, 25 May 2003; pp. 506–513. [Google Scholar]
  21. Zhuang, Y.Z.; Chen, Y.; Huang, F.Y.; Qian, H.M. Experimental study on the influence of frequency on micro-pile-soil dynamic interaction. World Bridges 2016, 44, 21–25. [Google Scholar] [CrossRef]
  22. Niu, W.Q. Experimental Study on Seismic Dynamic Characteristics of Micro-Pile Retaining Structure; China Academy of Railway Sciences: Beijing, China, 2016. [Google Scholar]
  23. Wang, M.W.; Tobita, T.; Iai, S. Centrifuge modeling of soil-pile interaction in liquefiable soils subjected to strong motion. Chin. J. Rock Mech. Eng. 2009, 28, 2012–2017. [Google Scholar] [CrossRef]
  24. Li, S.C.; Wang, H.P.; Zhang, Q.Y.; Li, Y. New type geo-mechanical similar material experiments research and its application. Key Eng. Mater. 2006, 326, 1801–1804. [Google Scholar] [CrossRef]
  25. Fan, Q.S.; Zhu, Z.C. Handbook of Material Mechanics; China Construction Industry Press: Beijing, China, 1981. [Google Scholar]
Figure 1. (a) Static strain indicator, (b) displacement meter, (c) shaking table system, and (d) strain gauge and pressure box.
Applsci 11 06341 g001
Figure 2. Plan and section view of the landslide model (unit: mm).
Applsci 11 06341 g002
Figure 3. Model box (a) positive view; (b) lateral view.
Applsci 11 06341 g003
Figure 4. Models of the (a) micropiles and (b) connecting beam.
Applsci 11 06341 g004
Figure 5. The completed landslide model.
Applsci 11 06341 g005
Figure 6. Schematic view of loading (a) static loading; (b) shaking table loading.
Applsci 11 06341 g006
Figure 7. Layout plan of micropiles (unit: mm).
Applsci 11 06341 g007
Figure 8. The layout of the test components (unit: mm).
Applsci 11 06341 g008
Figure 9. Deformation and crack propagation of landslide model (unit: cm).
Applsci 11 06341 g009
Figure 10. Failure of micropiles (a) static model test; (b) shaking table test.
Applsci 11 06341 g010
Figure 11. Displacement change view of D1, D3, and D5.
Applsci 11 06341 g011
Figure 12. Earth pressure distribution in front of and behind each row of piles in the static model tests.
Applsci 11 06341 g012aApplsci 11 06341 g012b
Figure 13. Dynamic earth pressure distribution in front of and behind each row of piles in the dynamic tests.
Applsci 11 06341 g013aApplsci 11 06341 g013b
Figure 14. Bending moment distribution of each row of piles (static model test).
Applsci 11 06341 g014
Figure 15. Dynamic bending moment distribution of each row of pile (shaking table test).
Applsci 11 06341 g015
Figure 16. Axial force distribution for each row of piles (static model test).
Applsci 11 06341 g016
Figure 17. Dynamic axial force distribution for each row of piles (shaking table test).
Applsci 11 06341 g017aApplsci 11 06341 g017b
Table 1. The similarity ratios of the test model.
ParametersSimilarity LawSimilarity ConstantsRemarks
Geometry (L) C L 8Control Variable
Elasticity Modulus (E) C E 3Control Variable
Density (ρ) C ρ 0.75Control Variable
Load (F) C F = C E C L 2 192
Stress (σ) C σ = C E 3
Strain (ε) C ε = 1 1
Flexural Stiffness (EI) C E I = C E C L 4 12,288
Poisson Ratio (μ) C μ = 1 1
Time (T) C T = C L C E 0.5 C ρ 0.5 4
Frequency (f) C f = C L 1 C E 0.5 C ρ 0.5 0.25
Velocity (v) C v = C E 0.5 C ρ 0.5 2
Damping Coefficient (c) C c = C E 0.5 C L 2 C ρ 0.5 96
Mass (M) C M = C ρ C L 3 384
Stiffness (K) C K = C E C L 24
Table 2. Main mechanical indexes of soil specimens.
Soil SpecimenUnit Weight
γ (kN·m−3)
Water Content
W (%)
Cohesion
c (kPa)
Internal Friction Angle
Φ (°)
Elasticity Modulus
E (kPa)
Model Soil22.311.818.525.02.46 × 104
Table 3. The test loading sequence.
NumberInput WaveAcceleration PeakDuration
1EL-Centro0.1 g13.5 s
20.2 g
30.3 g
40.4 g
50.6 g
60.8 g
Table 4. The earth pressure sharing ratio of each row of piles (static model test).
Loading20 kPa22 kPa24 kPa26 kPa
Location
Back row pile0.3990.4110.4000.370
Middle row pile0.3450.3480.3540.369
Front row pile0.2560.2410.2460.261
Table 5. The earth pressure sharing ratio of each row of piles (shaking table test).
Loading0.3 g0.4 g0.6 g0.8 g
Location
Back row pile0.4660.4530.4360.390
Middle row pile0.3700.3940.4000.244
Front row pile0.1640.1530.1630.366
Publisher’s Note: MDPI stays neutral with regard to jurisdictional claims in published maps and institutional affiliations.

