Abstract
As human occupancy has an enormous effect on the dynamics of light, flexible, large-span, low-damping structures, which are sensitive to human-induced vibrations, it is essential to investigate the effects of pedestrian–structure interaction. The single-degree-of-freedom (SDOF) mass–spring–damping (MSD) model, the simplest dynamical model that considers how pedestrian mass, stiffness and damping impact the dynamic properties of structures, is widely used in civil engineering. With field testing methods and the SDOF MSD model, this study obtained pedestrian dynamics parameters from measured data of the properties of both empty structures and structures with pedestrian occupancy. The parameters identification procedure involved individuals at four walking frequencies. Body frequency is positively correlated to the walking frequency, while a negative correlation is observed between the body damping ratio and the walking frequency. The test results further show a negative correlation between the pedestrian’s frequency and his/her weight, but no significant correlation exists between one’s damping ratio and weight. The findings provide a reference for structural vibration serviceability assessments that would consider pedestrian–structure interaction effects.
1. Introduction
With the application of increasingly advanced structural design methods, high-strength, lightweight materials and construction techniques, building structures are evolving towards being lightweight, flexible, large spans and low damping. The covers of large-span and light structures such as footbridges, shelters, exhibition halls and stadium stands have a low vertical natural frequency and a large vibration response due to their lightness, large span and low damping. When the vertical or horizontal frequency of the structure is close to the excitation frequency of the crowd activity, the crowd excitation will easily cause resonation of the structure, whose response may even exceed the tolerance limit of human comfort, which results in psychological panic among pedestrians [1]. The problem of human discomfort caused by structural vibrations is of increasing concern [2,3,4,5,6,7,8,9,10,11,12,13,14], and current design codes may underestimate the impacts of vibrations induced by pedestrians [15].
To evaluate the pedestrian-induced structural response, the influence of the pedestrian as a dynamical system on the dynamic properties of the structure should not be ignored. The interaction between pedestrians and structure can be expressed in two aspects: (1) the influence of structural dynamic properties and vibration levels on human-induced loads; and (2) the influence of the residual crowd on structural dynamic properties and dynamic response.
The first type of interaction refers to the effect of pedestrians synchronizing their pace and phase with the vibration of the structure to improve walking comfort when pedestrians perceive excessive vibration response of the structure, whose synchronization effect, however, would even exacerbate in the case of large crowds. This is an unconscious synchronization effect, unlike a person who is disturbed by the crowd around him or her and alters his or her pace to match that of others. A classic case in point is the Millennium Bridge incident in London in 2000 [16]. The closure of this footbridge within three days of opening due to excessive pedestrian-induced vibrations has made researchers pay more attention to the phenomenon of human-induced vibration [5,17,18,19,20,21]. Ohlsson [22] found that the human walking loads measured on a rigid plane differ from those measured on a flexible timber floor slab in that parameters such as the human walking force amplitude altered when the vibration level of the structure reached a certain magnitude. Similarly, Baumann and Bachmann [23] found that the walking force amplitude of the pedestrian load measured on a rigid floor was 10% higher than that measured on a 19 m span prestressed flexible beam.
The second pedestrian–structure interaction effect refers to the fact that the resident pedestrian on the structure does not just act as an additional mass but acts as an independent mass–spring–damping system coupled to the structure, similar to a TMD (tuned mass damper) attached to the structure, and its effect on the dynamic characteristics and vertical vibration response of the structure is complicated. This idea comes from some actual phenomena that have been observed by researchers who study the effects of crowds on the dynamic properties of structures. The crowds not only increase the frequencies or even change the mode shapes of the structure [24,25,26,27] but also increase the damping of the structure [28,29,30,31,32,33].
In the field of biomechanics, Wei and Griffin [34] and Matsumoto and Griffin [35] treated the human body model as a single-degree-of-freedom (SDOF) mass–spring–damping (MSD) system and used random vibration excitation to excite the human body in standing and sitting postures. By measuring the contact force and displacement between the human body and the electro-hydraulic servo shaker, the data were obtained from the fundamental frequency and damping ratio of the human body with 60 test subjects in sitting and standing postures. As the level of excitation of the human body in this test is much higher than that of the structure to which the person is exposed in structural vibration, the results cannot be directly applied to coupled human–structure systems.
In the field of civil engineering, single-degree-of-freedom (SDOF) mass–spring–damped (MSD) human models are mostly used to assess the effect of the human body on the dynamic properties and response of structures. Fosch et al. [36,37,38] first used a single-degree-of-freedom damped human model to study human–structure interaction, proposing that the coupled mass of the human body be taken as the total mass of the human being. They obtained damping of 1.25 kN·s/m and stiffness of 40 kN/m for the human body, but the measured walking forces were not accurate, and the measured and calculated forces response time histories did not match well. Zheng and Brownjohn [39] carried out a coupled human–structure vibration test on a simply supported concrete slab with a span of 4 m. The natural frequencies and damping ratios of the coupled structure were identified by a modal identification method, and the frequencies and damping ratios of 30 standing human bodies were derived from a SDOF MSD model. Wei and Živanović [40] proposed a novel closed-form solutions to identify the dynamic properties of the human–structure system with the frequency response functions and the method was proved more efficient with no need of nonlinear optimization nor spatial or modal models of the empty structure and the human–structure system. Zhang et al. [41] proposed a generalized formulation of a damped plate-oscillator model to get the dynamic properties of coupled human–structure systems, and the effects of human occupants on the dynamic properties of lightweight floors were validated by the test results. Identifications of moving mass–spring–damper model can also be conducted through experimental test, which provide a basis for structural design [11,42,43,44]. In addition to the identification of human model parameters in fixed position, the identification of parameters of moving people is a hot topic of research as well [11,42,43,44]. Due to the effects of pedestrian–structure interactions, the issue of vibration serviceability for special types of flexible structures such as glass structures deserves particular attention, in which the mass of the glass structure is relatively small compared to the mass of the pedestrian, while, the span-to-thickness ratio of the glass structure is relatively high [45,46].
Although extensive studies have been carried out to simulate human–structure interactions using a single-degree-of-freedom mass–spring–damping model [47,48,49], the research on the dynamics of coupled systems when pedestrians are under walking conditions requires more experimental data to supplement. Nevertheless, the excitation of the human body by a shaking table, which is commonly used in the field of biomechanics, is higher than that of the human body by the real structure. Therefore, the human body parameters obtained by this method are not applicable in the field of civil engineering. The excitation of the human body by means of an excitation shaking table fails to obtain the parameters of the human body in the process of walking. It is thus necessary to carry out test experiments of human–structure interaction on real structures, with the aim to supplement the data on the dynamic parameters when pedestrians interact with the structure and explore the effect of pedestrians on the dynamic properties of the structure as well.
In this paper, we introduce the fundamental theory of structural dynamic parameter identification and explore the method of obtaining pedestrian dynamic parameters through a coupled pedestrian–structure system by treating the pedestrian as a single-degree-of-freedom mass–spring–damper system. The relationship between pedestrian body parameters (frequency and damping ratio) and walking frequency and body mass is obtained by identifying the parameters of 25 individual pedestrians walking on the floor slab. The relationship between different statures and the pedestrian dynamics parameters is explored as well. The results are of some guidance for the engineering design of structures that consider pedestrian–structure interactions.
The structure of this paper is as follows. In Section 2, the test set-up of a low-frequency steel–concrete composite slab for the identification of pedestrian’s dynamic properties of a human–structure interaction system is presented. The identification method and test cases are also introduced in this section. In Section 3, the identification results of the pedestrian’s dynamic properties are presented. Conclusions are drawn in Section 4.
2. Experimental Study of a Human Mass-Spring-Damping Model
2.1. The Set-Up of the Test Platform
A combined steel–concrete platform was built to investigate the pedestrian–structure interaction with a span of 4700 mm × 7700 mm. As shown in Figure 1, a 60 mm thick concrete slab was cast with a span of 5000 mm × 8000 mm and the concrete strength grade was set as C30. The ordinary hot-rolled I20b and I22b I-beam was used to prepare for the main beam, and the hot-rolled I-beam of type I12.6 was used to construct the secondary beam. More details are presented in Table 1.

Figure 1.
The floor plan and side view of the test platform: (a) layout of the plate; (b) the side view of the short side of the platform; and (c) the side view of the long side of the platform.

Table 1.
Parameter descriptions of the test components.
To adjust the natural frequency of the test structure to a low value to simulate a large span of light flexible floor slab, the stiffness of the structure is required to be reduced and the mass of the structure be increased. The detailed procedures are listed as follows:
- The height of the steel beam and the thickness of the concrete slab are kept to a minimum.
- Joints between the secondary beams and the main beams and between the beams and the columns are hinged.
- A 100 mm thick concrete mortar surface layer with a 1000 kg mass block and 16 mass blocks with a mass of 20 kg suspended under the beam are applied to increase the mass of the test concrete slab.
- Plastic sheeting is used to separate the concrete wings from the upper mortar surface and the surface is divided into blocks with tricot boards to minimize the additional stiffness provided to the structure by the decorative surface.
2.2. Test Instruments
The testing system and the excitation system form the apparatus required for this vibration test (Figure 2). The testing system consists of accelerometers and a signal acquisition and analysis system. Since the vibration frequency of interest in the study of pedestrian–structure interaction is no more than 50 Hz, 941-B ultra-low frequency sensors were used in this experiment, with a passband range of 0.25–80 Hz. The AZ808, manufactured by Anzheng, was used for filtering the signal and the AZ308 was used for data acquisition. Table 2 lists the types and quantities of the main test instruments required. The excitation system includes a shaker, a power amplifier and a signal generator, the parameters of which are shown in Table 2.
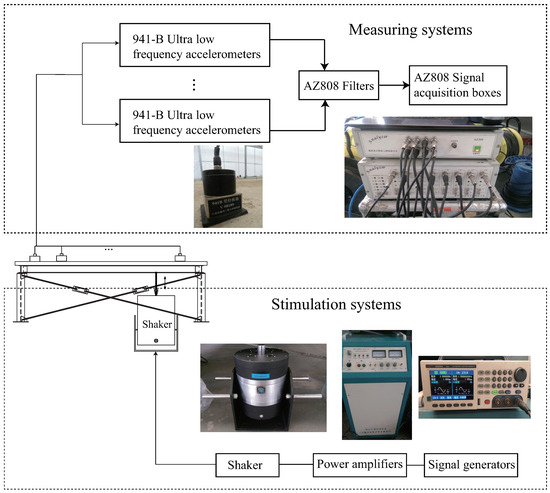
Figure 2.
Test system and excitation system.
Table 2.
Main apparatus and equipment for vibration test.
2.3. Theory of Mode Test
The method for the identification of the structural dynamic properties is the ambient random vibration method. When modal tests are carried out on large structures such as bridges and architectural buildings, artificial excitation in a sinusoidal, random or impulsive form is not possible or permissible. Vibration environments exist for almost any large structure: wind, water impact, ground movement, vibrations caused by moving vehicles, etc. Under the excitation of these natural environments, structures are expected to produce tiny vibrations. Although we cannot precisely quantify the characteristics of these excitation signals, they can be estimated to some extent. It is a reasonable hypothesis that the ambient excitation can be treated as stochastic excitation signals with a continuous spectrum with a certain bandwidth where frequency bands of structural relevance are mainly covered. Thus, the vibration response of the structure induced by ambient excitation can reflect the dynamic properties of the structure. With the assumption that the structural vibration system with n degrees of freedom (nDOF) is stimulated by an identical white noise, the frequency response function of these n degrees of freedom to the input white noise can be exhibited as
One column or one row of the vibration shape matrix of the system is defined by Equation (1). The frequency response function for the ith degrees of freedom under a stochastic excitation can be expressed as
where the power spectrum of the external force is denoted by F and the conjugate value of F is denoted by . denotes the cross-power spectrum of the vibration response at point i with respect to the excitation f. represents the self-power spectrum of the excitation f.
With the signal of the input force F unmeasurable, the identification of the structural modes can be done by way of substituting the vibration quantity of a reference degree of freedom i for F in Equation (2), and the transfer function of the jth DOF to the ith DOF is obtained as
where the power spectrum of the vibration response of is denoted by . The conjugate value of is denoted by . indicates the cross-power spectrum of the vibration response at point i and the vibration response at point j. denotes the self-relative power spectrum of the vibration response at point i. From Equations (2) and (3), we get
From Equation (4), we can obtain its amplitude as
where forms the vector of vibrational shapes. The subscript k of denotes the kth order natural frequency of the structure. The kth order frequency of the structure is picked from the peak of the power spectral density function and its range is determined by the frequency range of the analysis. The phase of is the difference between the phase of and the phase of (in-phase or anti-phase), i.e., the positive and negative sign of the real part of the cross-spectrum between the jth measured DOF with the ith reference DOF.
Each frequency of the structure can be identified from the frequency at the corresponding peak on the amplitude–frequency curve of the transfer function . The approach adopted is to pick the natural frequency corresponding to the peak value of the total set average curve of the power spectrum at all measured points. A linear average of the amplitude of all the measured transfer functions produces a defined mean amplitude and frequency curve. This average curve, although not representative of a particular measurement, gives an overall indication of all vibration modes excited in the analyzed frequency range. This is due to the fact that the peaks of the amplitude curve of individual measurements can be perturbations or mixing frequencies. If the point located in the vibration node line is chosen as the reference point, there can be missed modes in the amplitude curve where there is no peak. By averaging a large number of measures, the possibility of the errors mentioned above can be significantly reduced. The effectiveness of the method has been proved by a large number of vibration tests.
2.3.1. System Damping Identification Method
Among the modal parameters of a structure, the accuracy of identifying the damping ratio is far lower than that of identifying the natural frequency and vibration shape, and it is even more difficult to guarantee the accuracy when the test results are disturbed by noise. Thus, improving the accuracy of the identification of structural damping ratio has been the pursued goal of structural dynamics researchers. In this study, two methods were used to identify the damping ratio of the system: (1) the natural excitation technique method (NExT) in the field of time-domain data pre-processing; and (2) free vibration decay method based on the free vibration decay curve of the structure. The fundamental principles and applications of NExT are described briefly below.
The NExT method was first proposed by James et al. [50] at SADIA National Laboratory in the USA. The modal parameters of a high-speed turbine blade in operation are identified with this method. The basic principle is that the correlation function calculated from the response signal between two points of the structure has shown many similarities to the impulse response function under ambient excitation. Thus, the impulse response function of a structure can be substituted by a correlation function to identify the modal parameters of the structure more conveniently and efficiently. The theoretical analysis of the NExT method is as follows.
Assuming a linear system with degrees of freedom N, when an external excitation is applied to point k of the system, the response at point i of the system can be expressed as
where denotes the rth-order mode shape at the ith measurement point, and denotes the constant term associated with the excitation point k and the mode order r. denotes the eigenvalue of the rth-order mode. p represents the time-integrated variable used to calculate the response value at point i. When the system is excited by a unit impulse force at point k, the unit impulse response at point i of the system can be expressed as
For a linear system with responses obtained by testing at points i and j that can be represented as and , respectively, the cross-correlation function of these two columns of response data can be expressed as
It defines the cross-correlation function as the expected valued of the product of two responses evaluated at a time separation of . The operator symbol E indicates the process of taking the expected value. means the time separation. Then, we get
p and q are used to distinguish the time integration variables for the two integration stages, rather than using the traditional time variables . When is an ideal white noise excitation, by definition of the cross-correlation function, we have
where denotes the pulse function and is the constant associated with the stimulation point k. Combining Equations (8) and (9), we can obtain
Integrating, we have
Record as
Notice that is a constant related exclusively to the reference point j and to the mode order r. Combining Equations (12) and (13), we can obtain
Comparing the pulse response function with the cross-correlation function between points i and j of the system, it can be found that the mathematical expressions for the two are identical under white noise excitation. The specific constants and are equivalent to multiplying the same order modal shape function by the same constant for each measurement point and will not alter the characteristics of the mode shape function. It can be argued that it is feasible at a theoretical level to substitute the impulse response function of a system with a cross-correlation function between the responses of its two measurement points and to integrate it with conventional modal parameter identification methods for modal identification under ambient excitation. The specific process of the NExT method is:
- Collect response data of measurement points using sensors.
- Select a measurement point with a lower response as a reference point and calculate the correlation function between the other measurement point and the reference point.
- Use the calculated cross-correlation function between the measurement points as the impulse response function and then combine it with other mode parameter identification methods to identify the dynamic parameters.
The implementation of ambient excitation for mode identification of structure is as follows.
- 1.
- Select ith DOF on the structure as the parametric degrees of freedom.
- 2.
- Obtain the transfer function of jth DOF with respect to the ith reference degree of freedom from the measurements. That is, a two-channel fast Fourier transform (FFT) analysis of the vibration response of the jth and the ith points is performed to obtain the mutual power spectrum of the jth DOF with respect to the ith DOF, the self-power spectrum of the jth DOF and the self-power spectrum of the ith DOF, and the transfer function is calculated from Equation (4).
- 3.
- Choose the peak frequency on the curve of or as the natural frequency of the structure.
- 4.
- Estimate the structural frequency as and obtain the value of from Equation (5) as the amplitude of the shape at the jth DOF in the shape function at the estimated frequency.
2.3.2. Study Methodology
In this study, the pedestrian was simplified to a single-degree-of-freedom mass–spring–damper (MSD) model, and a two-degree-of-freedom coupled pedestrian–structure model was established, as shown in Figure 3. The coupling effect between the vibration induced by the first mode of the slab and the pedestrian was considered, thus the slab could be assumed to be equivalent to a SDOF dynamic system. In this coupled system, the pedestrian is equated to a SDOF system for simplicity. In Figure 3, denotes the equivalent stiffness of the first mode of the slab, refers to its first modal mass and denotes its first modal damping. denotes the equivalent mass of the pedestrian and is taken to be the total mass of the pedestrian. is the equivalent stiffness of the pedestrian and is its equivalent damping. Once the mass and damping ratio of the pedestrian are derived from the test results, the equivalent stiffness and of the pedestrian can be easily calculated by dynamic methods, which are not presented in this paper.
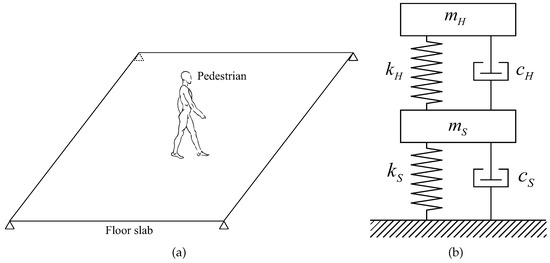
Figure 3.
A simplified dynamic model of the coupled pedestrian–structure system with the pedestrian treated as a SDOF MSD model: (a) a pedestrian walking on a plate; and (b) a two-degree-of-freedom coupled pedestrian–structure model.
Drawing on the test method proposed by Zheng and Brownjohn [39], the dynamic characteristic parameters of the pedestrian MSD model were derived by identifying the modal parameters of the empty structure and identification of the coupled pedestrian–structure system, respectively. The difference is that the modal testing method used in this study is the ambient excitation method. The coupled two-degree-of-freedom pedestrian–structure model with damping is considered, with the dynamic equations expressed as
With the floor slab and the human body both simulated with a single-degree-of-freedom mass–spring–damper (MSD), symbols and are the vibrational displacements of the structure and the human body as a single degree of freedom, respectively; and are the vibrational velocities; and are the vibrational accelerations; and and are the external forces acting on the structure and the human body. Random perturbations and excitation from the outside environment can be denoted by . indicates the time history of the human dynamic force. Using the vibration test described above, the dynamic properties of the coupled system can be identified from the free vibration process of the slab structure. With the vibration vector , the eigenvector equation of the coupled system can be expressed as
The eigenvalue equation for the pedestrian–structure coupled system is
By simplifying Equation (17), we get
By taking the mass ratio of the human body to the structure as , Equation (18) becomes
Equation (19) is a quadratic equation concerning the eigenvalues , which can be solved to obtain their eigenvalues . The frequency and damping ratio of the coupled system can be calculated from Equations (20) and (21) as follows.
The second-order modal frequencies and damping ratio of the coupled system for the slab structure and human body are obtained from Equations (20) and (21), respectively. The natural frequencies and damping ratio of the structure are and , respectively, obtained from the modal testing of the structure on which people stay. Then, we get
Together with the structural modal frequency and damping ratio obtained from the structural modal tests before human occupancy, as well as the mass ratio of body mass to the structural mass , the quadratic equations can be solved by substituting Equations (22) and (23) into Equation (19) to obtain the vibration frequencies and its damping ratio of the human body.
2.4. Scheme of the Mode Test
- Test A: Original structure test
Consistent with the site conditions, 45 measurement points were set up for the empty floor slab test, creating a 5 × 9 grid, as shown in Figure 4a. The meshing in the AZ-Cras software is shown in Figure 4b. For the modal parameter identification, point 27 was chosen as the stationary reference point, and a four-channel model was performed. That is, the 941 B sensor connected to channel 1 was placed at point 27 all the time, while channels 2–4 were acting as moving points. The entire test process was divided into 15 measurement sets, as shown in Figure 4c. In this study, only the first few modes of the floor slab were of interest and the collected accelerations were low-pass filtered at 20 Hz to reduce the signal noise. The field tests are shown in Figure 4d.
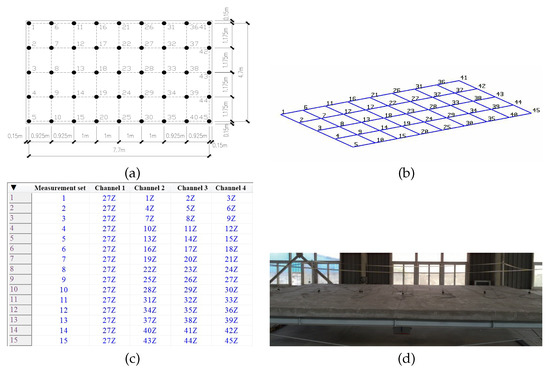
Figure 4.
Grid division for mode identification of empty structures: (a) layout of the grid division of the plate; (b) model built in the AZ-Cras system; (c) measurement set; and (d) field tests.
To validate the damping ratios of the first-order mode obtained by the Macras system, three sets of free vibration decay tests were carried out, with the measurement point located in the middle of the slab. The process is as follows: based on the first-order modal frequency of the slab obtained from the Macras system, a sinusoidal excitation is applied to the floor slab using the shaker to make the slab resonate at its first natural frequency, and then the shaker is switched off when vibration amplitude is in a stable vibration state, allowing the floor slab to vibrate in free decay. Based on the free vibration decay method, the first-order modal damping ratio of the floor slab is identified.
- Test B: Single person walking test
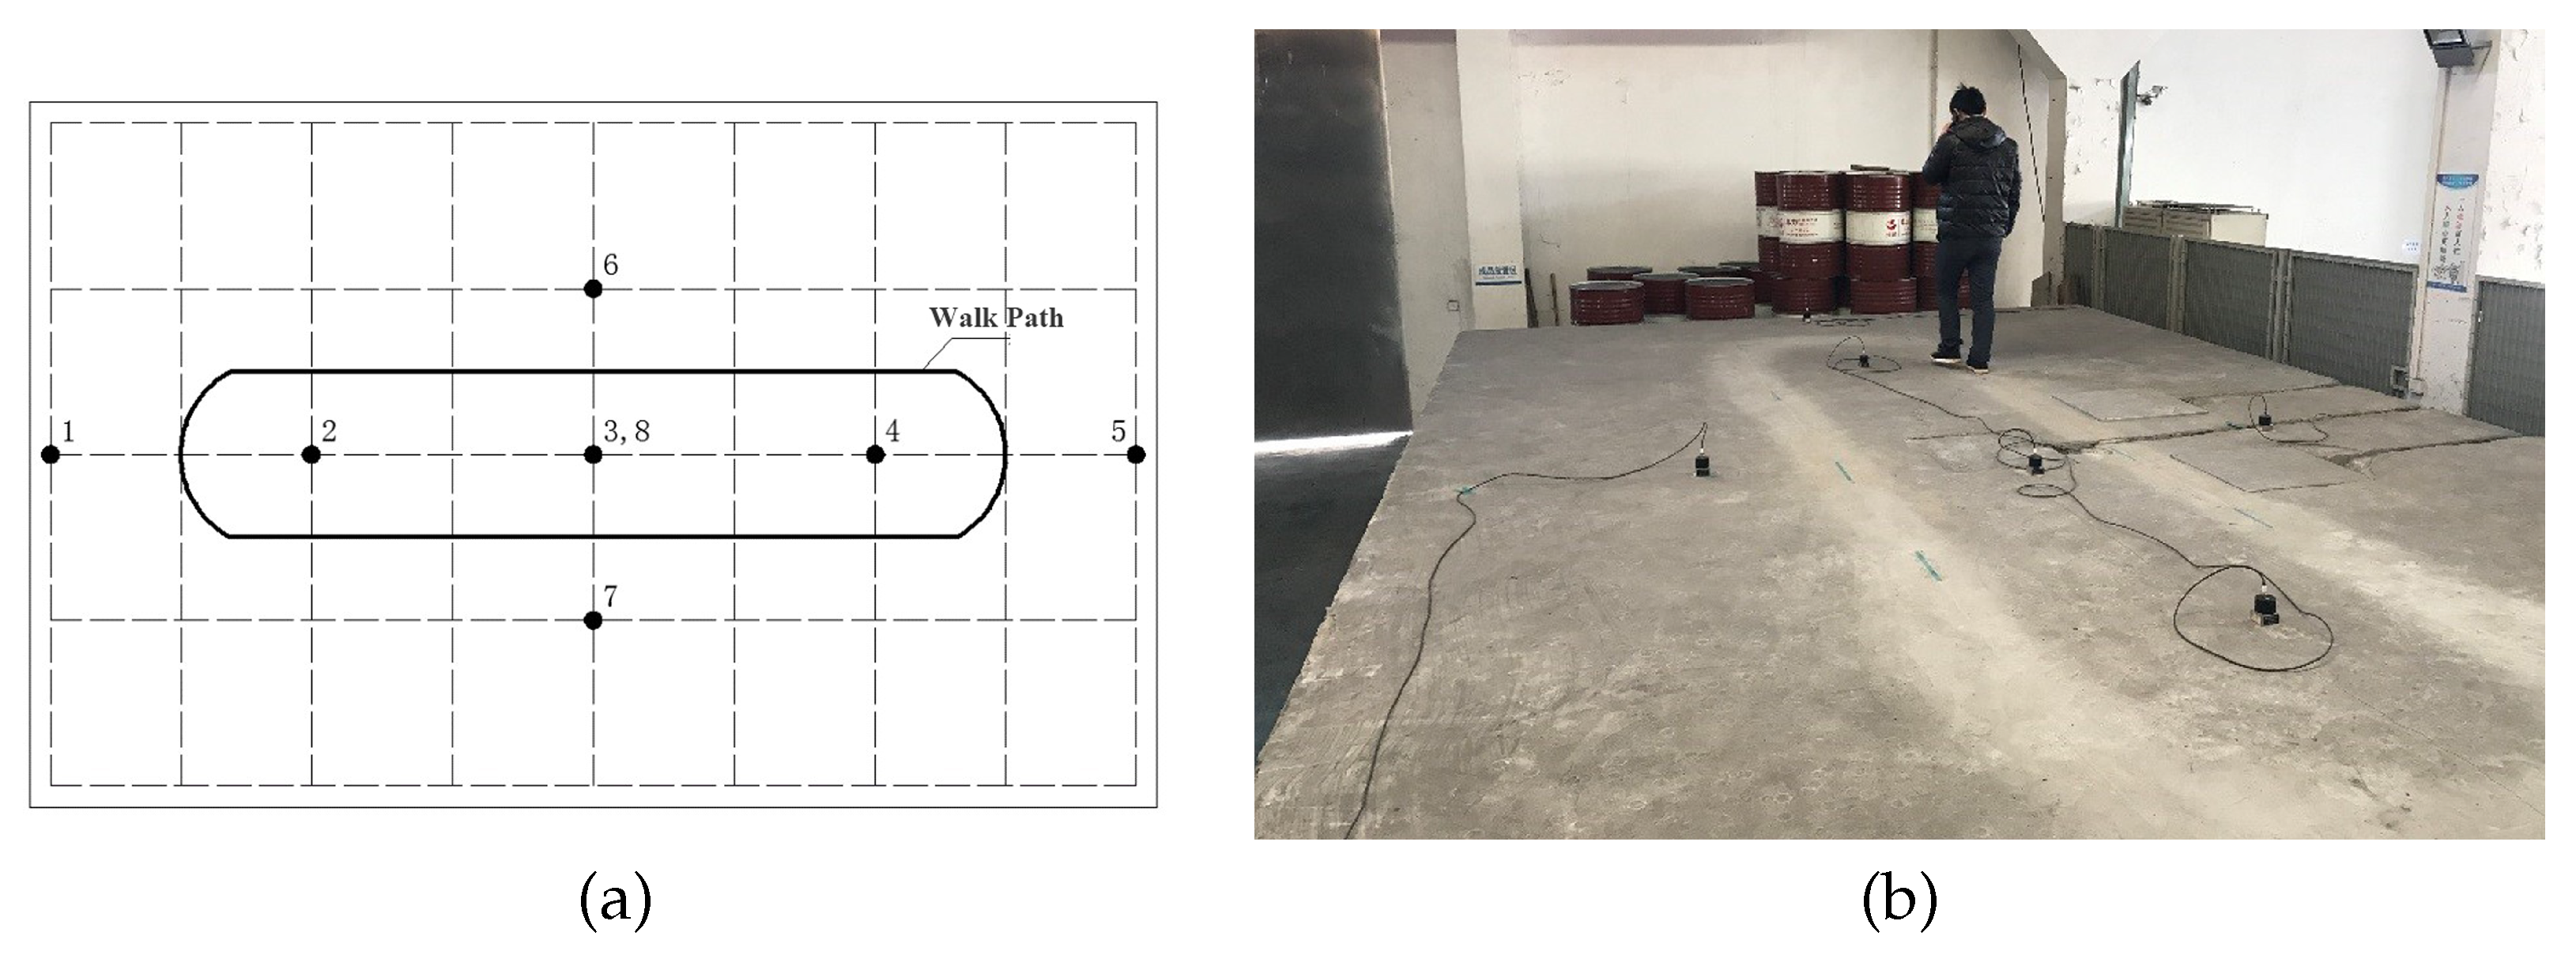
Twenty-five pedestrian dynamic parameter identifications were carried out in this test, with 20 males and 5 females. Similar to the modal testing of floor slabs, the Sscras and Macras modules of Anzheng’s modal testing software were used in combination with eight channels for data acquisition for the single person walking test. The focus of this study was the first-order mode of the structure; the placement of the response measurement points and the walking path of the subject were set close to the middle of the floor slab. The position of the measurement points and the walking path on the test floor are shown in Figure 5a, and the single person walking test scene is shown in Figure 5b. To identify the effect of different walking frequencies on the dynamic properties of the human walking model, four walking conditions were performed, with step frequencies of 1.5, 1.7, 1.9 and 2.1 Hz, and two trials were conducted for each case, with the final results being the average of the two trials. To investigate the effect of other body parameters on the pedestrian dynamic parameters, the weight and height of each subject were collected prior to the test, as shown in Table 3.
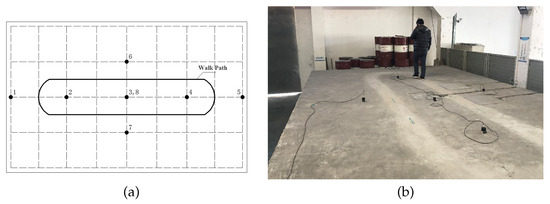
Figure 5.
Single person walking test: (a) walk path and layout of the response measurement points; and (b) single person walking test.
Table 3.
Physical characteristics of the subject.
3. Results and Discussion
3.1. Identification of Modal Parameters for Test Floor Slabs
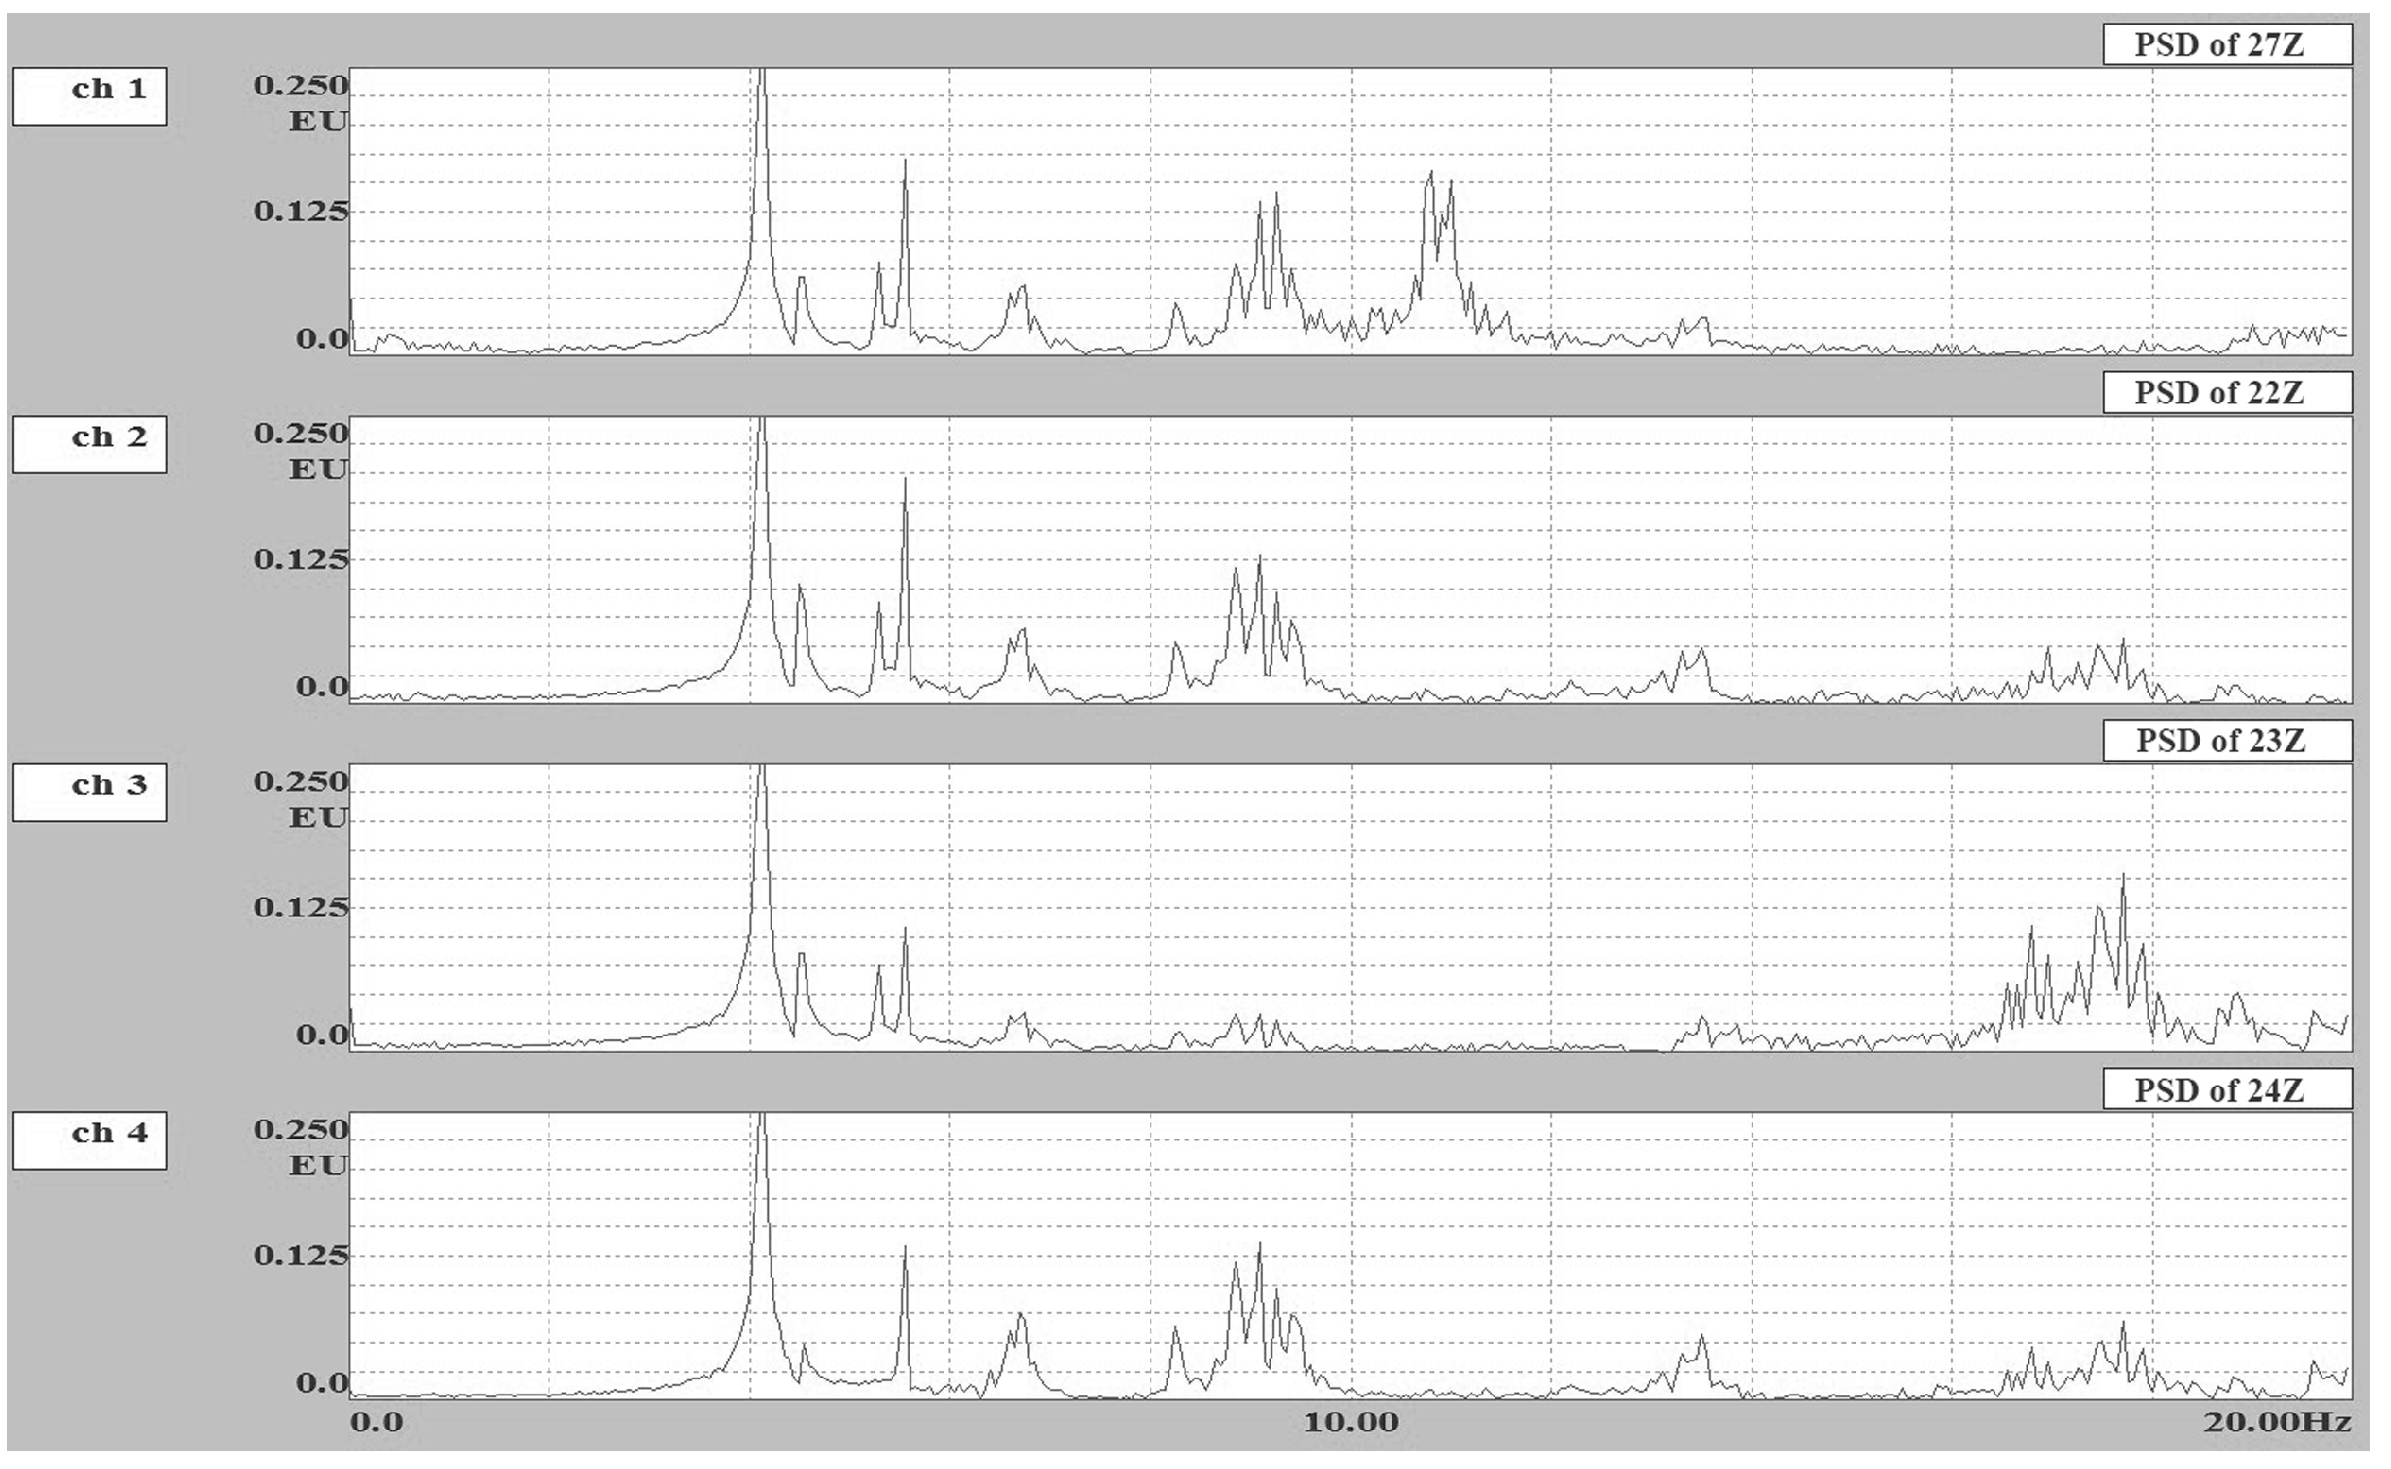
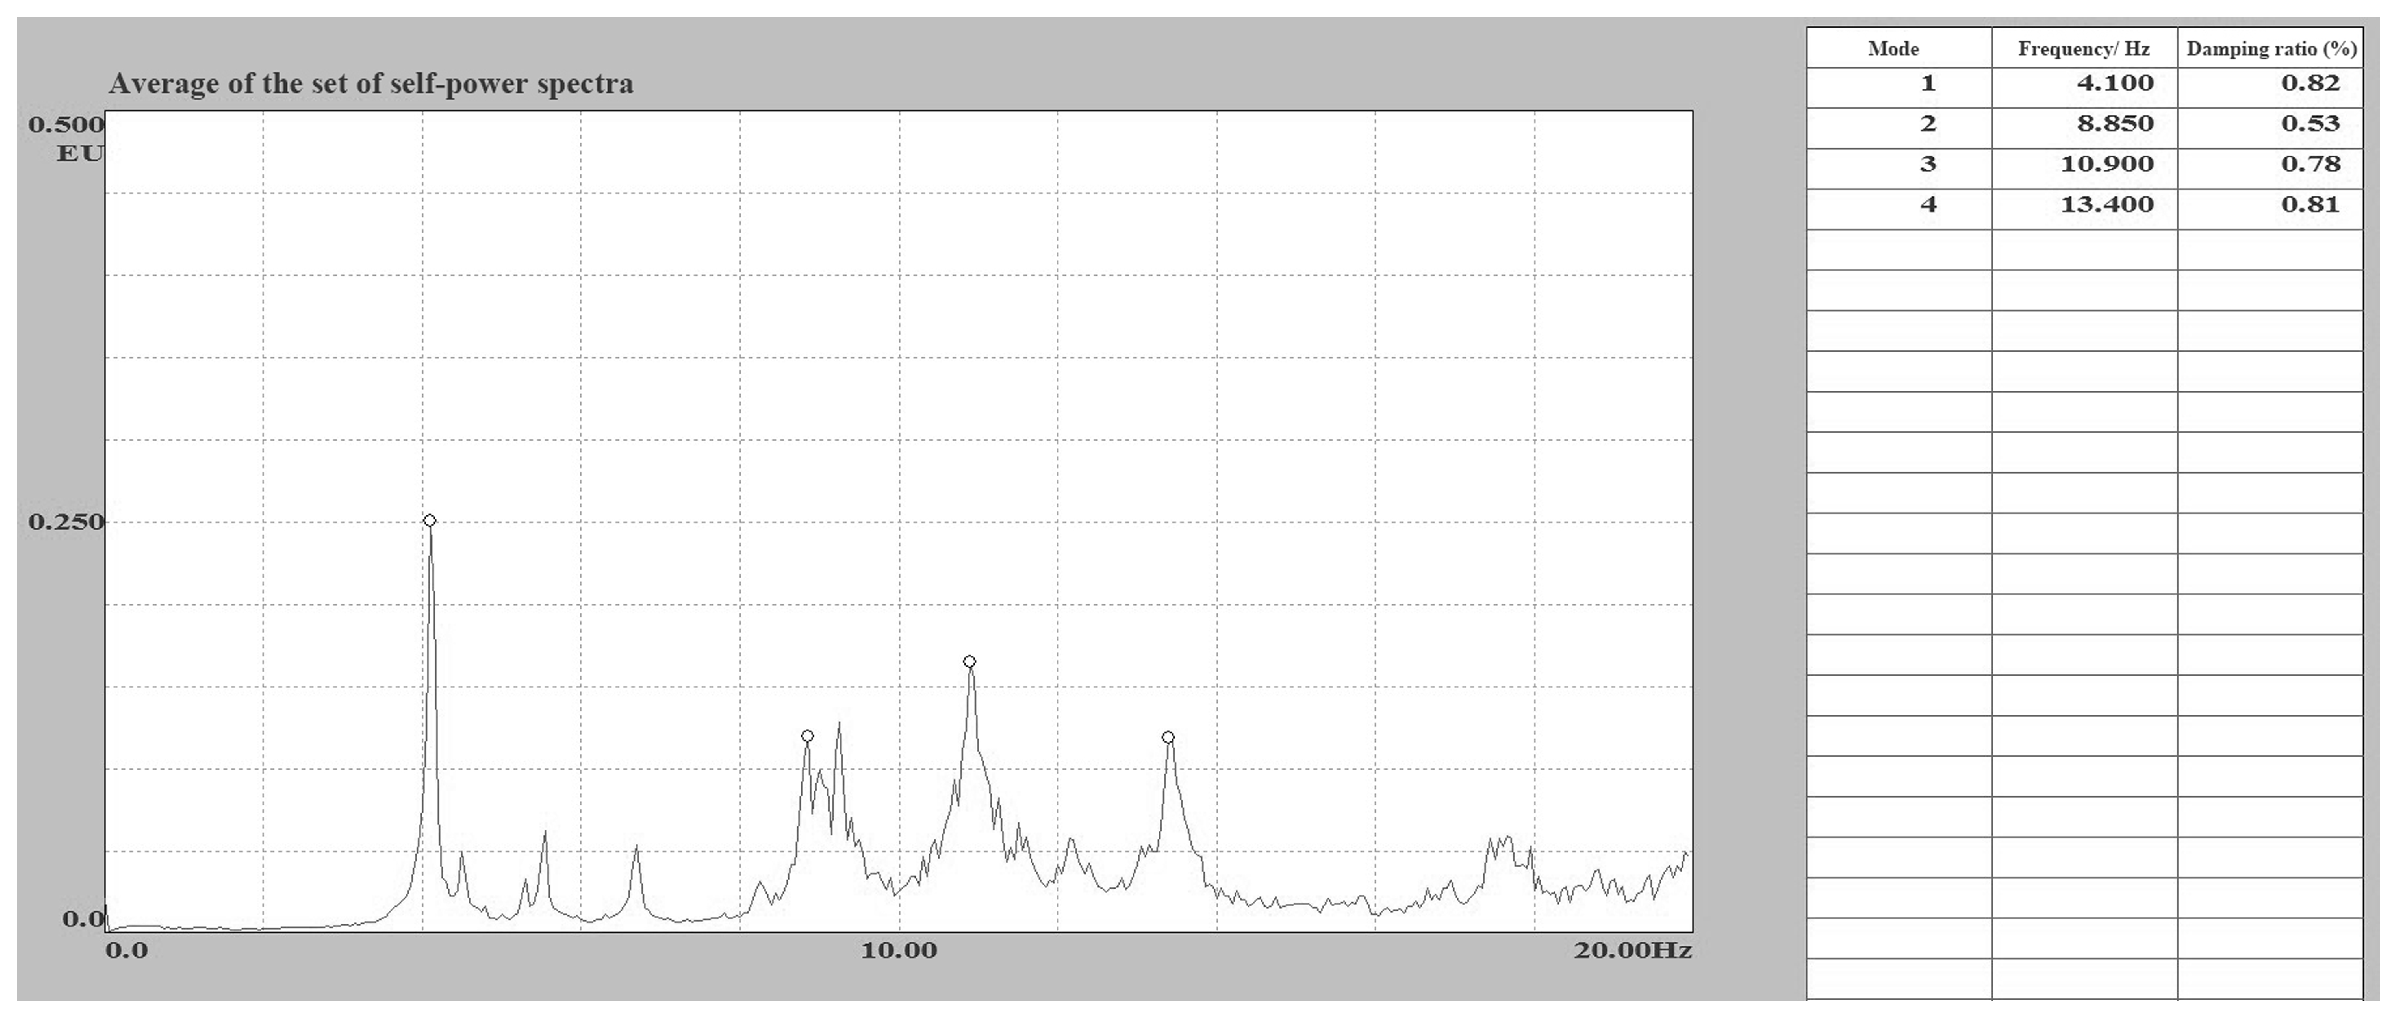
Three modal tests were carried out on the test slab and the average of the three tests was taken as the result of the identification of the modal parameters of the slab. In this modal test, four signal channels were employed to capture the acceleration response of the floor slab under ambient excitation. Figure 6 and Figure 7 show the acceleration time history and self-power spectrum curves for each measurement point in Measurement Group 8, respectively. Macras software uses the total average self-power spectra to obtain estimates of the modal parameters. Figure 8 shows the total average self-power spectra and the corresponding modal parameter identification results for a test case. The first four orders of vibration of the slab obtained by the software are shown in Figure 9.
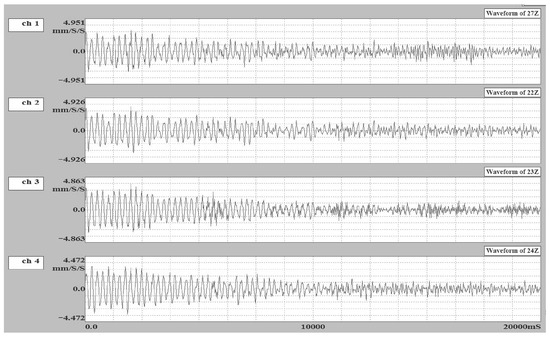
Figure 6.
Acceleration time history for four measurement points on the slab under ambient excitation.
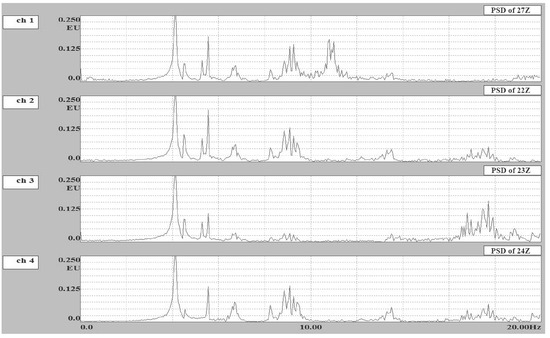
Figure 7.
Acceleration self-power spectrum for each channel under ambient excitation.

Figure 8.
Floor slab mode identification results.

Figure 9.
Vibration modes corresponding to the first four orders of the test floor slab: (a) first mode of the slab; (b) second mode of the slab; (c) third mode of the slab; and (d) fourth mode of the slab.
According to the theoretical analysis of linear systems concerning eigenvalues, any two eigenvectors should be orthogonal. For modal analysis, the shape functions of any two orders of modes should be orthogonal, which means their vector product should be equal to zero. For this purpose, the modal assurance criterion (MAC) can be adopted to judge whether two shapes are identical shape. The modal assurance criterion (MAC) is defined in Equation (24) as follows [51],
where and are the two vibration vectors to be judged. The modal judgement criterion is to examine whether there is an identical correlation factor between the two vectors. If the MAC value is close to 1, then the two vectors are identical; if the MAC value is close to zero, then the difference between the two vectors is significant. Figure 10 shows the MAC histogram of the mode shape function of a floor, the specific calculated MAC values of which are shown in Table 4.
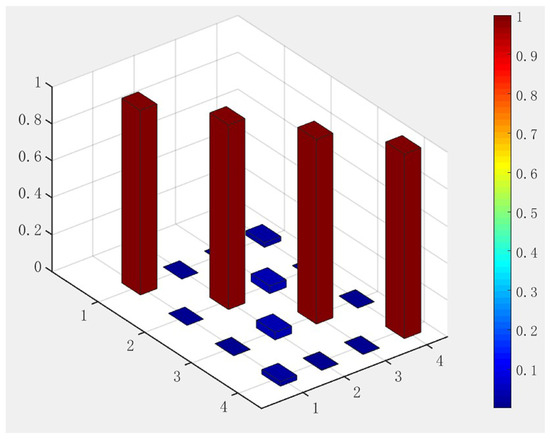
Figure 10.
MAC histogram.
Table 4.
MAC values.
It is evident that there are significant differences between the mode shapes, and no fake modes are present. The results of the three identifications of the modal parameters of the test floor slab are listed in Table 5, and the average of the three final results is taken, which shows that the first-order mode frequency of the floor slab has a mean value of 4.113 Hz.
Table 5.
Identification results of the modal parameters of the floor slab.
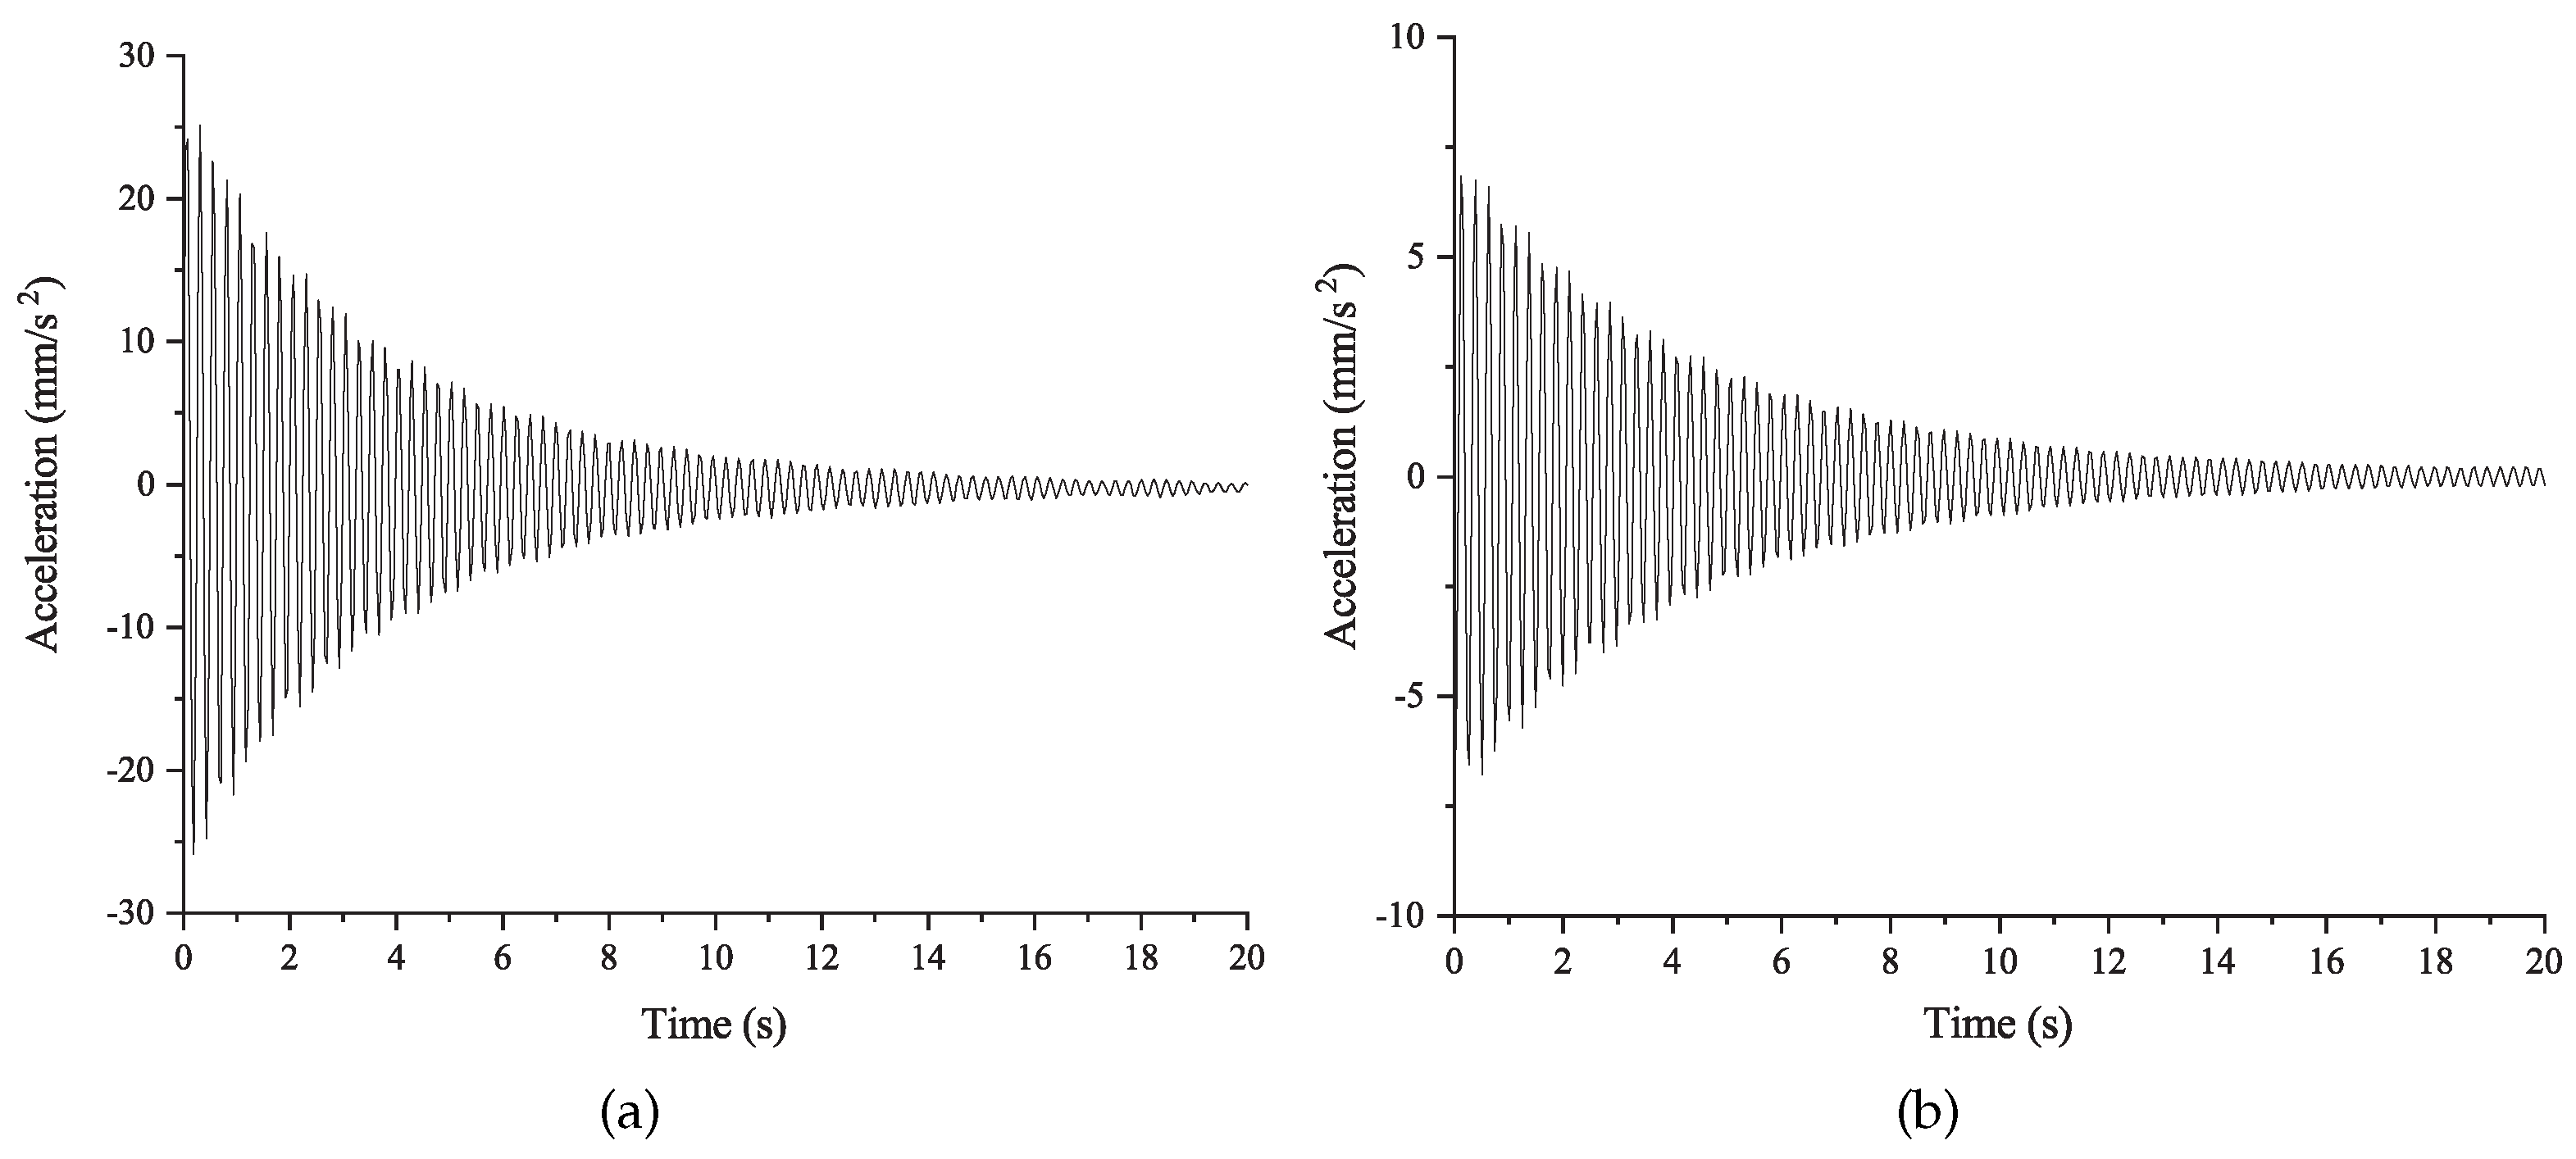
Three free vibration decay tests were carried out to verify the damping ratios of the first-order mode of the floor slabs identified by Anzheng’s Macras module. The collected acceleration time history curve for the decay of free vibration in the middle of the slab is shown in Figure 11a. The collected acceleration time history curve is band-pass filtered to limit the frequency of the signal to be close to the first-order frequency of the floor slab. The low-pass filter is set at 4.0 Hz and the high-pass filter is set at 4.2 Hz, and the filtered acceleration time history curve is shown in Figure 11b. The damping ratio of the structure was identified by using the free vibration decay method to process the filtered acceleration time history. The identification results are shown in Table 6. It can be observed that the identification results are very close to those of Macras, and the damping ratio identification results are reliable. The damping ratio of the first-order modal of the test floor is taken as 0.88%.

Figure 11.
Floor acceleration response before and after filtering: (a) before filtering; and (b) after filtering.
Table 6.
Comparison of damping ratio identification results.
3.2. Identification of Pedestrian Dynamics Model Parameters
In this study, four walking cases were selected for the single person walking test. The walking step frequency was 1.5, 1.7, 1.9 and 2.1 Hz, respectively. Two tests were conducted for each walking case, and the final results were obtained by taking the average of the two tests. To investigate whether pedestrians of different stature have an effect on human parameters, we divided the subjects into two groups by their height. The first group is the high stature group (Group 1), whose stature is greater than 170 cm. The second group is the short stature group (Group 2), whose stature is less than 170 cm. The identification results of the dynamic parameters of the coupled pedestrian–structure system for various walking cases are analyzed in the following part. Table 7, Table 8, Table 9 and Table 10 give the results of the identification of the dynamic characteristic parameters of the system for each walking case, where is the frequency of the coupled human–structure system; is the damping ratio of the coupled human–structure system; is the frequency of the pedestrian MSD model; and is the damping ratio of the pedestrian MSD model.
Table 7.
Identification of human parameters in 1.5 Hz walking conditions.
Table 8.
Identification of human parameters in 1.7 Hz walking conditions.
Table 9.
Identification of human parameters in 1.9 Hz walking conditions.
Table 10.
Identification of human parameters in 2.1 Hz walking conditions.
Based on the results of the parameter identification given in Table 10 and Table 11, it can be noticed that the parameters of the MSD model for a walking pedestrian are significantly different from those of a stationary human body [39]. The human body exhibits a significantly lower dynamic frequency in walking process than in a standing position and closer to its single-legged bent position [52], a result consistent with the physical mechanisms of the walking process. When the pedestrian walks at a 1.5 Hz step frequency, the mean dynamic frequency of the subjects in Group 1 is 2.1353 Hz with a damping ratio of 29.02%, and the mean frequency of the subjects in Group 2 is 2.2144 Hz with a damping ratio of 26.17%. When a single walker walks at different pacing frequencies, his/her dynamic frequency exhibits different values. The results of the MSD model parameter identification for each walking condition are presented in Table 10, together with the results of other researchers’ parameter identification of the human MSD model. As can be observed in Table 10, the frequencies and damping ratios of the pedestrian MSD model are less than those of the standing position, and, in particular, the human body frequencies are significantly lower than those of the standing position.
Table 11.
Comparison of human model parameter identification results.
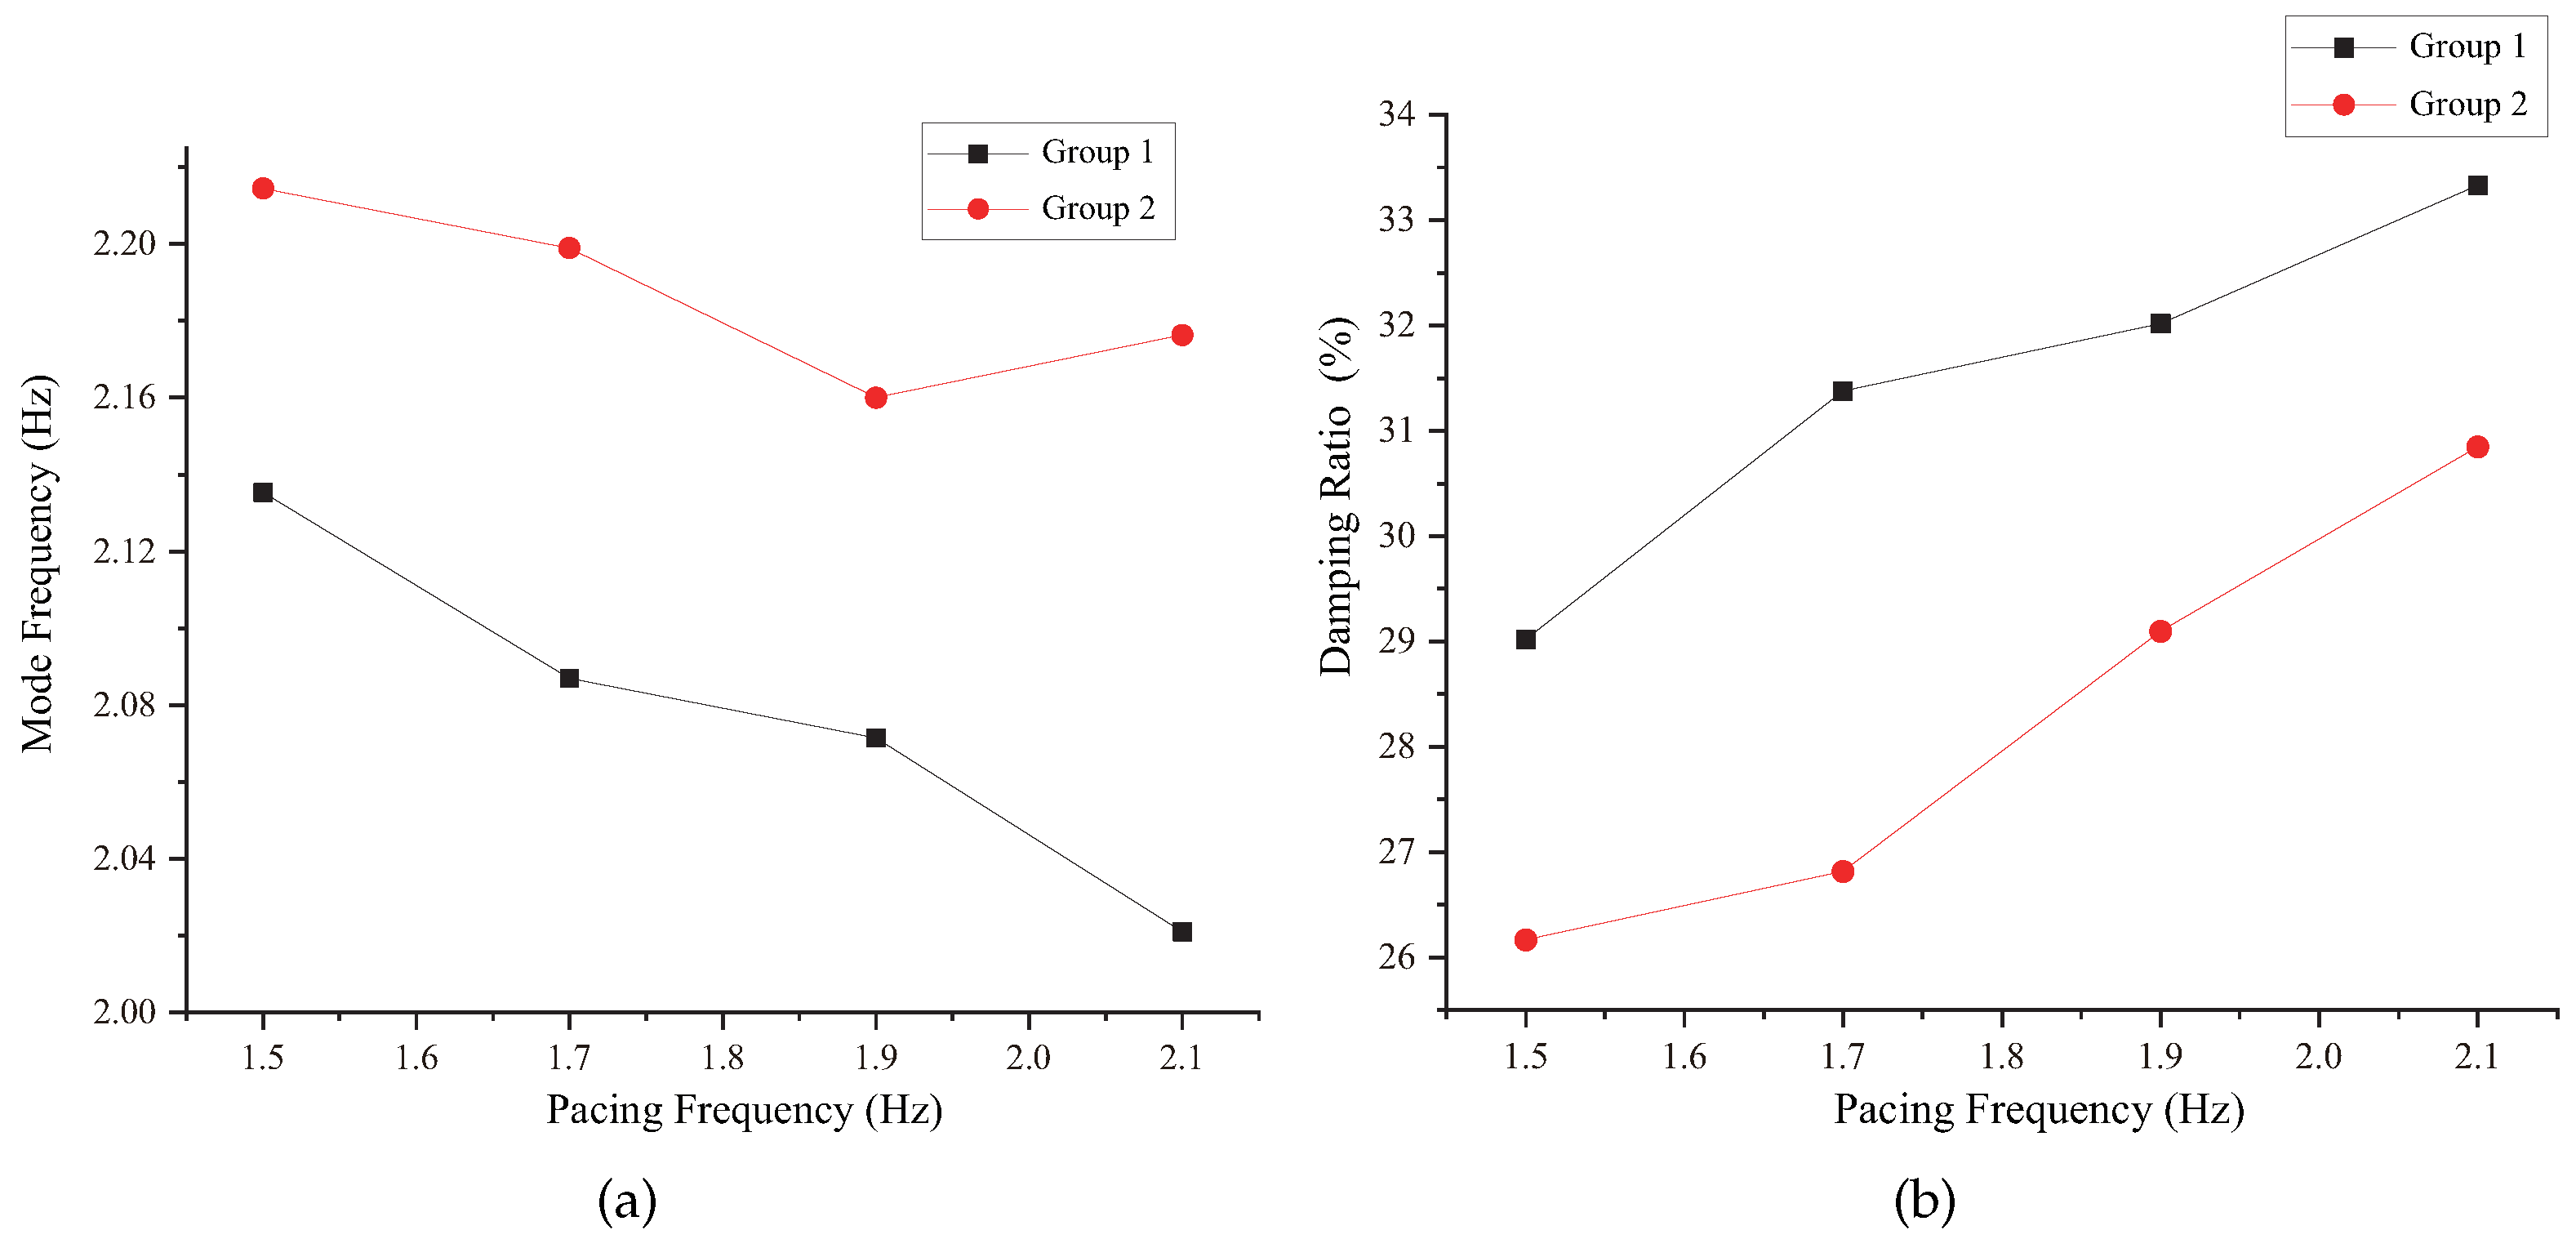
To demonstrate more clearly the effect of the pedestrian’s stride frequency and one’s stature on the parameters of the pedestrian MSD model, the average of the identification results for each test case is plotted in Figure 12. As shown in Figure 12, when the pedestrian walks with a certain frequency, the mode frequency of pedestrian in Group 1 is less than that of Group 2, while the damping ratio of Group 1 is greater than that of Group 2. Meanwhile, it can be noticed that, with the increase of the stride frequency, the mode frequency of the pedestrian shows a decreasing trend. This trend is consistent with the physical mechanism of the pedestrian walking procedure. When a pedestrian walks at a lower frequency, the contact time between the pedestrian and the structure per step is longer than that at a higher frequency, and the stiffness of the pedestrian during walking is mainly attributed to the stiffness of the supporting leg, so the mode frequency of the pedestrian at a lower frequency is greater than that at a higher frequency. The damping ratio increases as the walking frequency of the pedestrian increases.
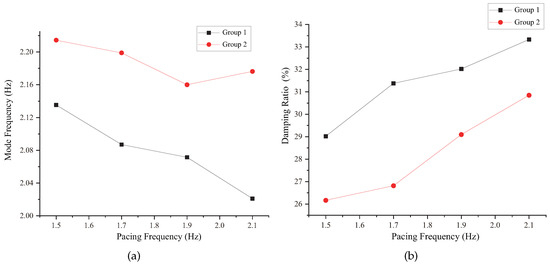
Figure 12.
The influence of step frequency and stature on the parameters of the pedestrian MSD model: (a) mode frequency; and (b) damping ratio.
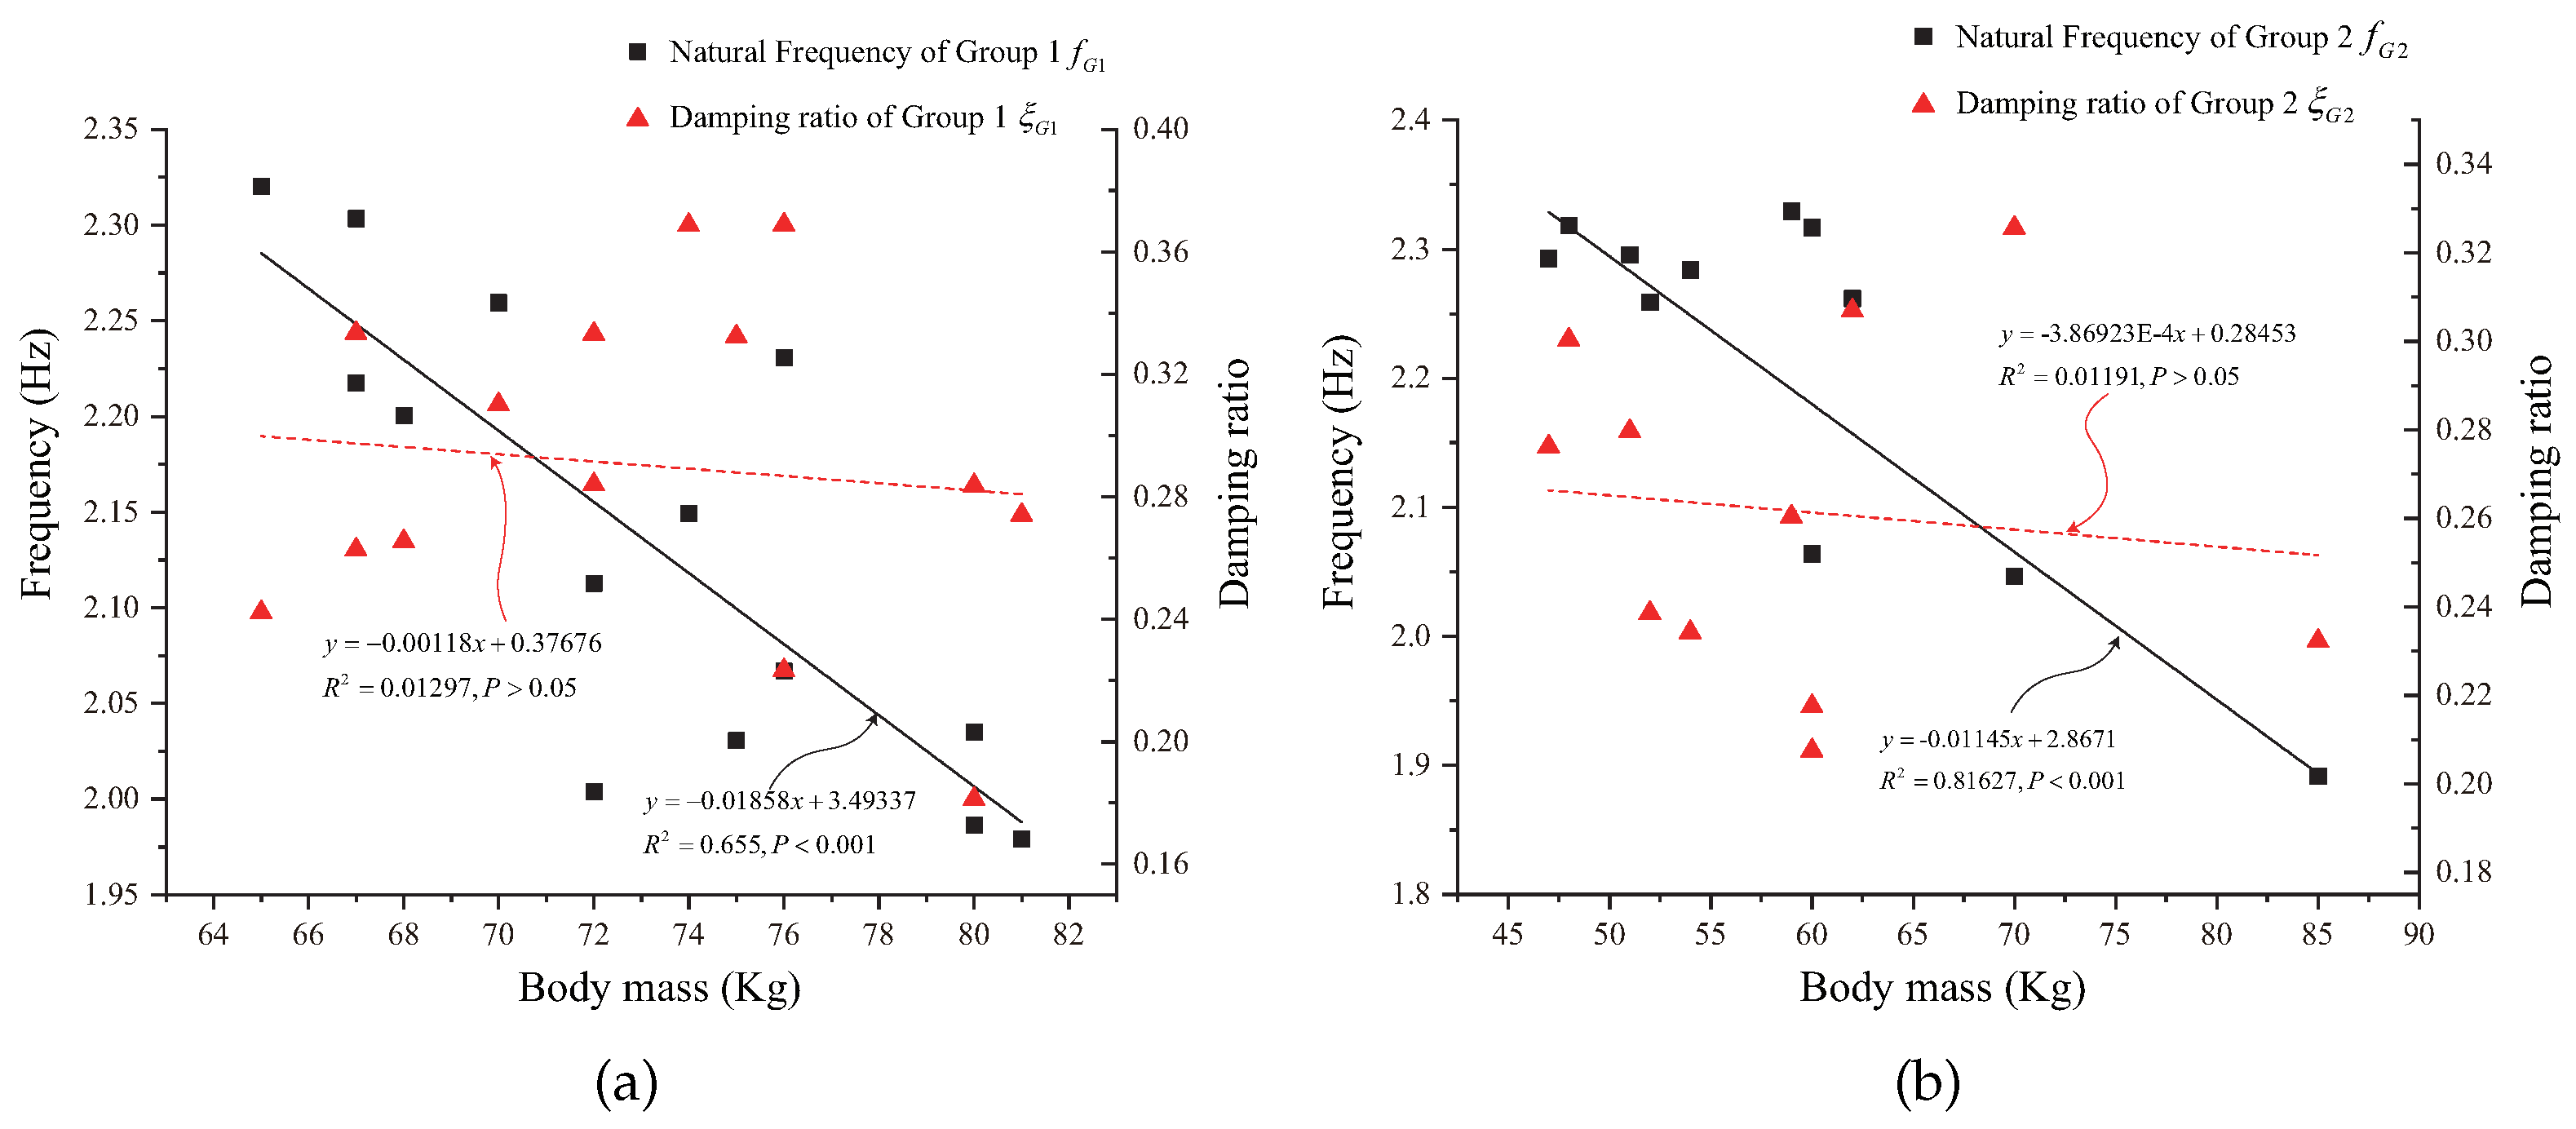
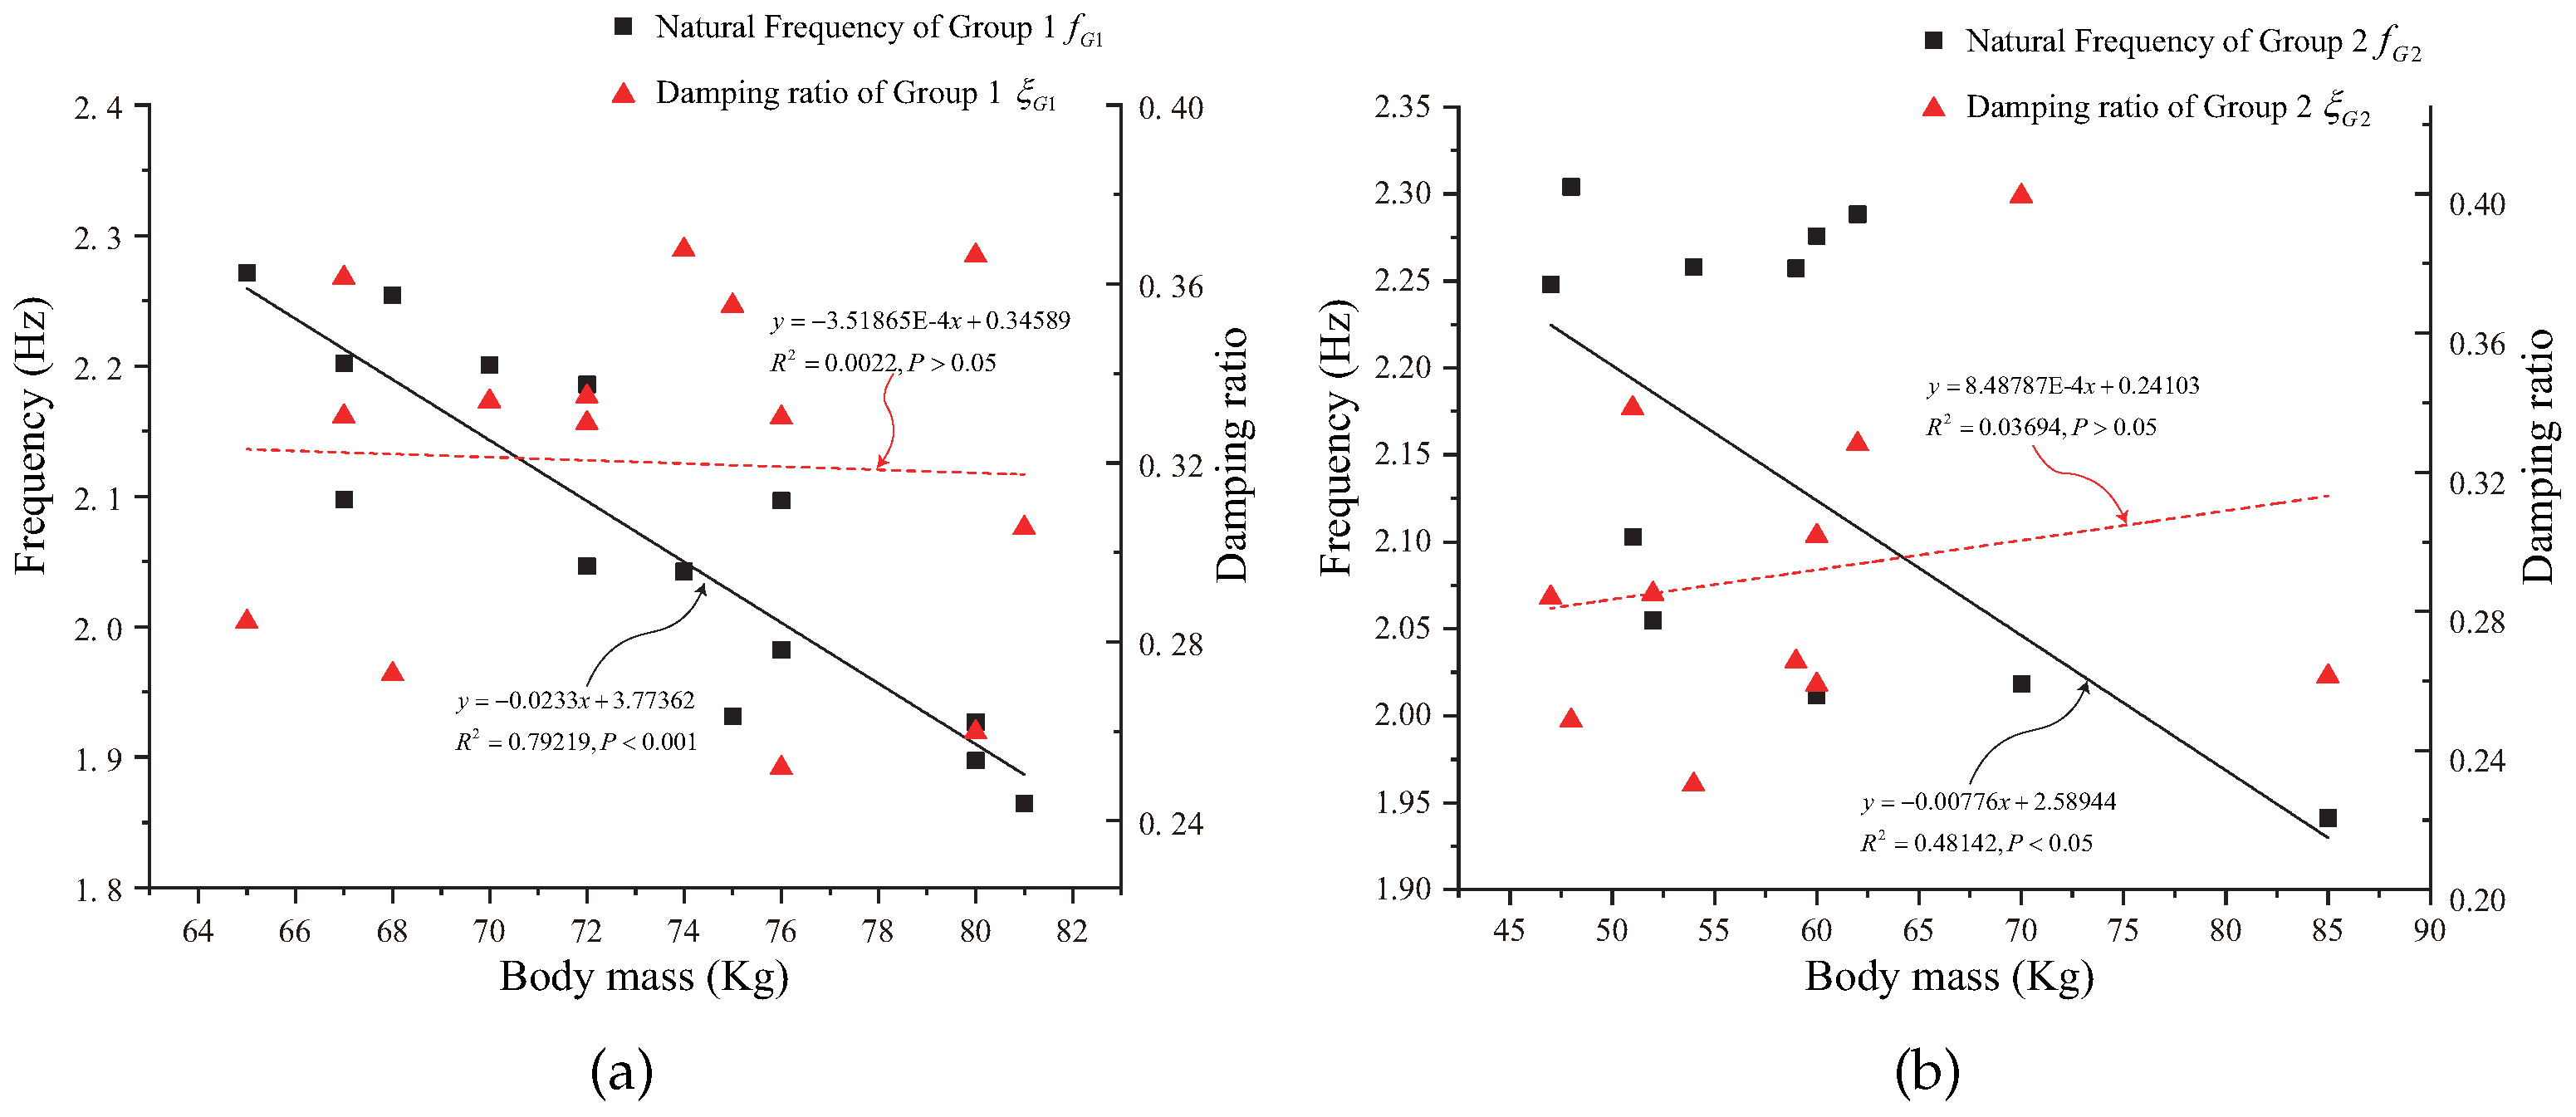
The results of MSD model parameter identification for all tests for each walking condition are plotted in Figure 13, Figure 14, Figure 15 and Figure 16. As shown in Figure 13a, when the stride frequency is 1.5 Hz, there is a significant negative correlation between the body frequency of the pedestrian in the high stature group (Group 1) and his mass. That is, with the increasing weight of a subject in Group 1, the frequency of his body is decreasing. Nevertheless, there is no significant tendency for the body damping ratio to change as the weight of the pedestrian in the high stature group increases. This indicates that the average damping ratio of the high stature group can be taken for the vibration serviceability evaluation of large-span floor slabs with the consideration of pedestrian–structure coupling effects. Similar to the results in Figure 13a, there is a significant negative correlation between the body frequency of pedestrians in the short stature group (Group 2) and their body mass in Figure 13b. It is worth noting that there is no significant correlation between the body damping ratio of pedestrians in the short stature group and their body weight in Figure 13b; the correlation characteristics are consistent with those presented in Figure 14b–Figure 16b.
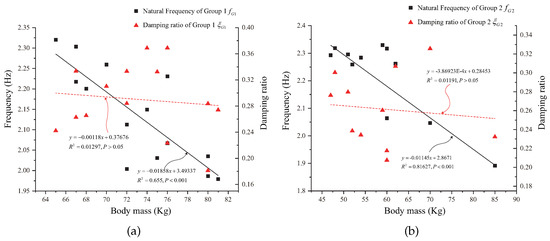
Figure 13.
Identification result of MSD model parameters of the subjects at pacing frequency of 1.5 Hz: (a) Group 1; and (b) Group 2. Note: means the mode frequency of the high stature group, denotes the mode frequency of short stature group, denotes the damping ratio of the high stature group and denotes the damping ratio of the short stature group.

Figure 14.
Identification result of MSD model parameters of the subjects at pacing frequency of 1.7 Hz: (a) Group 1; and (b) Group 2. Note: means the mode frequency of the high stature group, denotes the mode frequency of the short stature group, denotes the damping ratio of the high stature group and denotes the damping ratio of the short stature group.

Figure 15.
Identification result of MSD model parameters of the subjects at pacing frequency of 1.9 Hz: (a) Group 1; and (b) Group 2. Note: means the mode frequency of the subjects in high stature group, denotes the mode frequency of the subjects in short stature group, denotes the damping ratio of the subjects in high stature group and denotes the damping ratio of the subjects in short stature group.
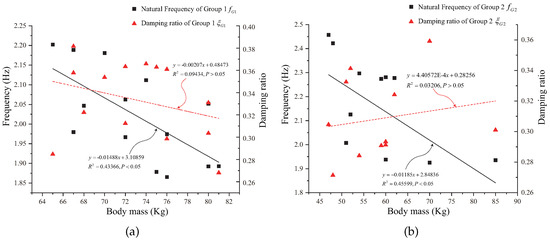
Figure 16.
Identification result of MSD model parameters of the subjects at pacing frequency of 2.1 Hz: (a) Group 1; and (b) Group 2. Note: means the mode frequency of the high stature group, denotes the mode frequency of the short stature group, denotes the damping ratio of the high stature group and denotes the damping ratio of the short stature group.
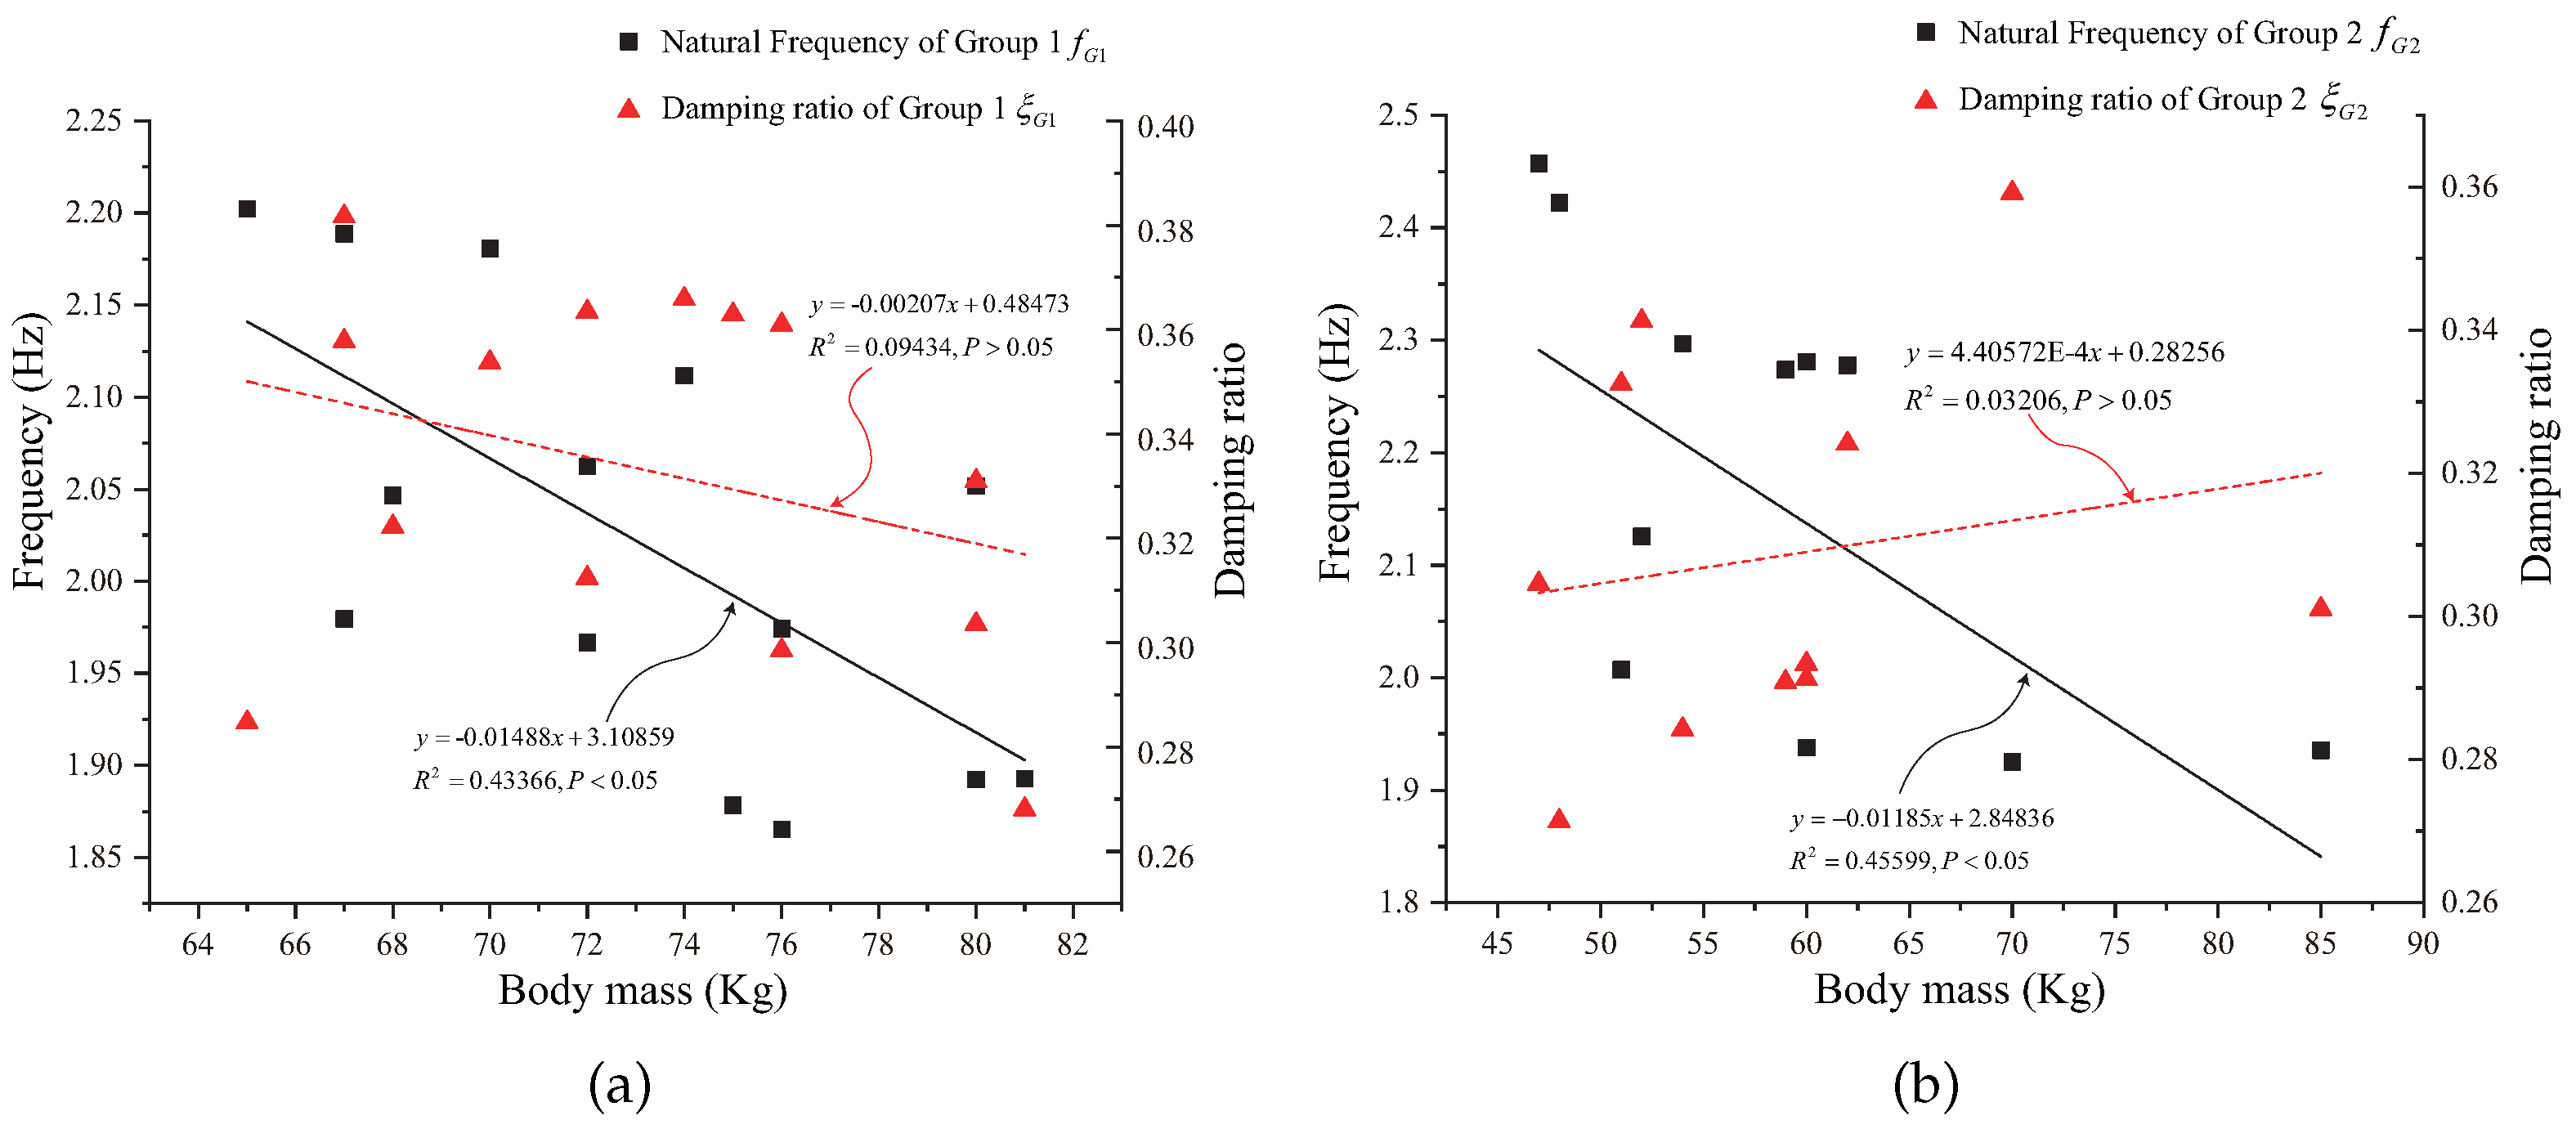
From the results in Figure 13a–Figure 16a, it can be seen that there is a significant negative correlation between body frequency and mass of high stature group whose walking frequencies are 1.5, 1.7, 1.9 and 2.1 Hz. From the results in Figure 13b–Figure 16b, it can be found that, when the walking frequency is 1.5, 1.7, 1.9 and 2.1 Hz, there is an obviously negative correlation between body frequency and the mass of short stature group from the results of the regression (p < 0.05). There is no significant correlation between the damping ratios of pedestrians and their body weight at all frequencies. It is advisable to take the average damping ratios of pedestrians in various walk frequency cases as a reference for the vibration serviceability evaluation of the structure.
In the field of structural vibration serviceability, few studies have been carried on to identify the parameters of walking human using SDOF MSD models. Representative studies in this field were reported by Silva and Pimentel [53], Jiménez-Alonso and Sáez [54] and Shahabpoor et al. [43] respectively.
By correlating the ground reaction force and the acceleration at the waist, Silva and Pimentel [53] obtained the dynamic parameters of a walking human. The frequency and damping ratio were suggested as 2.64 Hz and 0.55 if the human mass is assumed to be equal to 70 kg and walking frequency to be 1.8 Hz. Using a 3DOF model to simulate the pedestrian–structure interaction in the vertical direction, Jiménez-Alonso and Sáez [54] suggested that the natural frequency and damping ratio of a walking human could be set as 2.75 Hz and 0.47 if the mass of the MSD modal was taken as 84% of the total body mass. With a comprehensive and unique set of human traffic-structure experimental data, Shahabpoor et al. [43] obtained the ranges of frequency and damping ratio of the SDOF MSD as 2.75–3.00 Hz and 27.5–30%, respectively.
The dynamic parameters suggested by the studies above are generally consistent with the findings of this study regarding the frequency and damping ratio, but the values in our study are slightly lower. This is due to the fact that, in our study, we picked the interaction between pedestrians and the floor slab as the research object. The three studies listed above, in contrast, all picked the interaction between pedestrians and bridges as the research object. By comparing the results of other studies, it can be assumed that the types of the structural system of the structure are not negligible when pedestrian–structure interactions were considered. The variation of pedestrian dynamic properties under different types of structural systems deserves to be explored in future research.
4. Conclusions
This paper introduces the method and theory of identifying modal parameters of systems based on ambient excitation. It describes the modal test method under ambient excitation and its implementation process. It presents the method of identifying the dynamic parameters of a single person by establishing the coupled human–structure system and the modal tests of the test floor carried out under two conditions: an empty structure and a pedestrian walking on the floor at different step frequencies. The identification results show that the mean value of the frequency and damping ratio (walking frequency was 1.5 Hz) was 2.1702 Hz and 27.77%. When the walking frequency was 1.7, 1.9 and 2.1 Hz, the mean value of the frequency and damping ratio were 2.1362 Hz and 29.37%, 2.1104 Hz and 30.74% and 2.0894 Hz and 32.24%, respectively. Meanwhile, there exists a significant negative correlation between the mode frequency of the pedestrian and the mass of the body at different walking frequencies. However, the relationship between the damping ratio of the pedestrian and the body mass is unclear.
By dividing the test subjects into two groups by height, it was found that, for the high stature group, their body frequency was lower than that of the short stature group, but their body damping ratio was higher. The correlation analysis showed that the correlation between body frequency and body weight remained consistent for different stature groups, that is, a negative correlation was observed. This indicates that pedestrian body weight has a critical effect on body frequency relative to pedestrian height and should be handled with caution when considering pedestrian–structure interactions.
Different from the methods commonly adopted in the field of biomechanics to obtain dynamic parameters of the human body using an excitation platform [34,35], this study is dedicated to the parameters obtained from a full-scale pedestrian–floor coupling system. The full-scale slab platform in this study can eliminate the deficiency of an excitation platform with a high level of excitation intensity, as well as the incapacity to perform pedestrian parameter identification due to the small platform.
It is worth noting that, in this study, floor slabs were used as the research object, which is different from the usage of footbridges to study pedestrian–structure interactions in recent years [42,43,44]. By substituting the floor slab for the footbridge as the object of this study, it was feasible to explore further the influence of different structural types on the pedestrian–structure interaction and give a reference for the vibration serviceability design involving large span floors.
In summary, this study provides human dynamic parameters for the design of light and flexible large-span floor slabs considering pedestrian–structure interactions. However, several limitations of this study merit emphasis.
- 1.
- In this study, the walking pedestrian was considered as an unmovable SDOF MSD dynamics model. Although the pedestrian walking route was placed as close to the middle span of the floor as possible in the test, there is no denying that the location of the pedestrian has an effect on the results of the test.
- 2.
- The limited field test conditions resulted in a relatively small number of test participants, especially female subjects, making for a smaller group for short stature.
Based on the experimental and test method described in this study, more experiments can be extended to obtain the dynamic properties of the pedestrian by measuring the dynamics of the coupled pedestrian–structure system. With more data collected, the designers of light and flexible structures can be better advised.
Author Contributions
Conceptualization, H.L. and D.A.; methodology, D.A.; software, H.L.; validation, H.L., W.X. and P.W.; formal analysis, H.L. and D.A.; investigation, D.A.; resources, D.A.; data curation, D.A.; writing—original draft preparation, H.L.; writing—review and editing, H.L.; visualization, H.L.; supervision, Z.Z.; project administration, Z.Z.; and funding acquisition, Z.Z. All authors have read and agreed to the published version of the manuscript.
Funding
This study was supported by the National Natural Science Foundation of China (Grant No. 51278106), Project of Science and Technology Research and Development Program of China Railway Corporation (Grant No. P2018G049), and Key R & D project of Jiangsu Province (Grant No. BE2019107).
Institutional Review Board Statement
Not applicable.
Informed Consent Statement
Informed consent was obtained from all subjects involved in the study.
Data Availability Statement
The authors confirm that the data supporting the findings of this study are available within the article.
Acknowledgments
The authors thank HY Liang (Soochow University) for revising the manuscript and polishing the language.
Conflicts of Interest
The authors declare no conflict of interest.
References
- Ljungberg, J.; Parmentier, F. Psychological effects of combined noise and whole-body vibration: A review and avenues for future research. Proc. Inst. Mech. Eng. Part D J. Automob. Eng. 2010, 224, 1289–1302. [Google Scholar] [CrossRef]
- Bachmann, H. Vibration upgrading of gymnasia, dance halls and footbridges. Struct. Eng. Int. 1992, 2, 118–124. [Google Scholar] [CrossRef]
- Quast, U. Schwingungsverhalten der Tribünen des Volksparkstadions Hamburg. Beton-Und Stahlbetonbau 1993, 88, 233–236. [Google Scholar] [CrossRef]
- Kasperski, M. Actual problems with stand structures due to spectator-induced vibrations. In Proceedings of the Eurodyn, Florence, Italy, 5–8 June 1996; Volume 96, pp. 455–461. [Google Scholar]
- Dallard, P.; Fitzpatrick, T.; Flint, A.; Low, A.; Smith, R.R.; Willford, M.; Roche, M. London Millennium Bridge: Pedestrian-induced lateral vibration. J. Bridge Eng. 2001, 6, 412–417. [Google Scholar] [CrossRef]
- Nakamura, S.i.; Kawasaki, T. Lateral vibration of footbridges by synchronous walking. J. Constr. Steel Res. 2006, 62, 1148–1160. [Google Scholar] [CrossRef]
- Eckhardt, B.; Ott, E.; Strogatz, S.H.; Abrams, D.M.; McRobie, A. Modeling walker synchronization on the Millennium Bridge. Phys. Rev. E 2007, 75, 021110. [Google Scholar] [CrossRef] [PubMed]
- Macdonald, J.H. Lateral excitation of bridges by balancing pedestrians. Proc. R. Soc. A Math. Phys. Eng. Sci. 2009, 465, 1055–1073. [Google Scholar] [CrossRef] [Green Version]
- Ahmadi, E.; Caprani, C. Damping and frequency of human-structure interaction system. In Proceedings of the MATEC Web of Conferences, EDP Sciences, Singapore, 15–16 September 2015; Volume 24, p. 07006. [Google Scholar] [CrossRef] [Green Version]
- Shahabpoor, E.; Pavic, A.; Racic, V.; Zivanovic, S. Effect of group walking traffic on dynamic properties of pedestrian structures. J. Sound Vib. 2017, 387, 207–225. [Google Scholar] [CrossRef] [Green Version]
- He, W.; Xie, W.p. Characterization of stationary and walking people on vertical dynamic properties of a lively lightweight bridge. Struct. Control Health Monit. 2018, 25, e2123. [Google Scholar] [CrossRef]
- Liang, H.; Zhang, Z.; Wei, P. Theoretical Derivation and Parameters Analysis of a Human-Structure Interaction System with the Bipedal Walking Model. J. Math. 2021, 2021. [Google Scholar] [CrossRef]
- Liang, H.; Xie, W.; Wei, P.; Zhou, Y.; Zhang, Z. The Effect of the Decorative Surface Layer on the Dynamic Properties of a Symmetric Concrete Slab. Symmetry 2021, 13, 1174. [Google Scholar] [CrossRef]
- Liang, H.; Xie, W.; Zhang, Z.; Wei, P.; Changhui, C. A Three-Dimensional Mass-Spring Walking Model Could Describe the Ground Reaction Forces. Math. Probl. Eng. 2021, 2021. [Google Scholar] [CrossRef]
- Porcu, M.C.; Pittau, F. Excessive Pedestrian-Induced Swaying in Code-Compliant Walkways. Struct. Eng. Int. 2015, 25, 450–459. [Google Scholar] [CrossRef]
- Strogatz, S.H.; Abrams, D.M.; McRobie, A.; Eckhardt, B.; Ott, E. Crowd synchrony on the Millennium Bridge. Nature 2005, 438, 43–44. [Google Scholar] [CrossRef]
- Parker, D. Marching to a new tune. New Civil Engineer, 1 May 2000; 12–13. [Google Scholar]
- Fitzpatrick, T.; Dallard, P.; Le Bourva, S.; Low, A.; Smith, R.R.; Willford, M. Linking London: The Millennium Bridge; Royal Academy of Engineering: London, UK, 2001; pp. 1–28. [Google Scholar]
- Newland, D.E. Vibration of the London Millennium Bridge: Cause and cure. Int. J. Acoust. Vib. 2003, 8, 9–14. [Google Scholar] [CrossRef]
- Dallard, P.; Fitzpatrick, T.; Low, A.; Ridsill Smith, R.; Flint, A. The Millennium Bridge, London: Problems and Solutions; Institution of Structural Engineers: London, UK, 2001; Volume 79. [Google Scholar]
- Pavic, A.; Armitage, T.; Reynolds, P.; Wright, J. Methodology for modal testing of the Millennium Bridge, London. Proc. Inst. Civ.-Eng.-Struct. Build. 2002, 152, 111–121. [Google Scholar] [CrossRef]
- Ohlsson, S. Ten years of floor vibration research—A review of aspects and some results. In Proceedings of the Symposium/Workshop on Serviceability of Buildings (Movements, Deformations, Vibrations), Ottawa, ON, Canada, 16–18 May 1988; Volume 1, pp. 419–434. [Google Scholar]
- Baumann, K.; Bachmann, H. Durch Menschen verursachte dynamische Lasten und deren Auswirkungen auf Balkentragwerke. Bericht/Institut für Baustatik und Konstruktion ETH Zürich 1988, 7501. [Google Scholar] [CrossRef]
- Lenzing, H. Durch Menschen Induzierte Schwingungen; Universität Hannover: Hanover, Germany, 1988. [Google Scholar]
- Ellis, B.; Ji, T. Human-structure interaction in vertical vibrations. Proc. Inst. Civ.-Eng.-Struct. Build. 1997, 122, 1–9. [Google Scholar] [CrossRef] [Green Version]
- Littler, J. Full-scale testing of large cantilever grandstands to determine their dynamic response. In Stadia, Arenas and Grandstands; CRC Press: Boca Raton, FL, USA, 1998; pp. 123–134. [Google Scholar]
- Littler, J. Retractable Grandstands: Dynamic Response; BRE Watford: Garston, UK, 2000. [Google Scholar]
- Lenzen, K.H. Vibration of steel joist-concrete slab floors. AISC Eng. J. 1966, 3, 133–136. [Google Scholar]
- Polensek, A. Damping capacity of nailed wood-joist floors. Wood Sci. For. Prod. Res. Soc. Madison 1975, 8, 141–151. [Google Scholar]
- Rainer, J.; Pernica, G. Vibration characteristics of a floor sample. Acoust. Soc. Am. J. 1981, 69, S25. [Google Scholar] [CrossRef] [Green Version]
- Rainer, J.H.; Pernica, G. Damping of a floor sample. In Proceedings of the Dynamic Response of Structures: Experimentation, Observation, Prediction and Control, ASCE, Atlanta, GA, USA, 15–16 December 1981; pp. 859–873. [Google Scholar]
- Brownjohn, J.M. Energy dissipation from vibrating floor slabs due to human-structure interaction. Shock Vib. 2001, 8, 315–323. [Google Scholar] [CrossRef]
- Živanović, S.; Diaz, I.; Pavić, A. Influence of walking and standing crowds on structural dynamic properties. In Proceedings of the Conference & Exposition on Structural Dynamics (IMAC XXVII), Orlando, FL, USA, 9–12 February 2009. [Google Scholar]
- Wei, L.; Griffin, M. Mathematical models for the apparent mass of the seated human body exposed to vertical vibration. J. Sound Vib. 1998, 212, 855–874. [Google Scholar] [CrossRef]
- Matsumoto, Y.; Griffin, M. Dynamic response of the standing human body exposed to vertical vibration: Influence of posture and vibration magnitude. J. Sound Vib. 1998, 212, 85–107. [Google Scholar] [CrossRef]
- Foschi, R.O.; Neumann, G.A.; Yao, F.; Folz, B. Floor vibration due to occupants and reliability-based design guidelines. Can. J. Civ. Eng. 1995, 22, 471–479. [Google Scholar] [CrossRef]
- Foschi, R.O.; Gupta, A. Reliability of floors under impact vibration. Can. J. Civ. Eng. 1987, 14, 683–689. [Google Scholar] [CrossRef]
- Folz, B.; Foschi, R.O. Coupled vibrational response of floor systems with occupants. J. Eng. Mech. 1991, 117, 872–892. [Google Scholar] [CrossRef]
- Zheng, X.; Brownjohn, J.M. Modeling and simulation of human-floor system under vertical vibration. In Smart Structures and Materials 2001: Smart Structures and Integrated Systems; International Society for Optics and Photonics: Bellingham, WA, USA, 2001; Volume 4327, pp. 513–520. [Google Scholar] [CrossRef]
- Wei, X.; Živanović, S. Frequency response function-based explicit framework for dynamic identification in human-structure systems. J. Sound Vib. 2018, 422, 453–470. [Google Scholar] [CrossRef]
- Zhang, S.; Xu, L.; Qin, J. Vibration of lightweight steel floor systems with occupants: Modelling, formulation and dynamic properties. Eng. Struct. 2017, 147, 652–665. [Google Scholar] [CrossRef]
- Ahmadi, E.; Caprani, C.; Živanović, S.; Heidarpour, A. Experimental validation of moving spring-mass-damper model for human-structure interaction in the presence of vertical vibration. Structures 2021, 29, 1274–1285. [Google Scholar] [CrossRef]
- Shahabpoor, E.; Pavic, A.; Racic, V. Identification of mass—Spring—Damper model of walking humans. Structures 2016, 5, 233–246. [Google Scholar] [CrossRef] [Green Version]
- Shahabpoor, E.; Pavic, A.; Racic, V. Identification of walking human model using agent-based modelling. Mech. Syst. Signal Process. 2018, 103, 352–367. [Google Scholar] [CrossRef]
- Bedon, C. Experimental investigation on vibration sensitivity of an indoor glass footbridge to walking conditions. J. Build. Eng. 2020, 29, 101195. [Google Scholar] [CrossRef]
- Bedon, C.; Fasan, M. Reliability of field experiments, analytical methods and pedestrian’s perception scales for the vibration serviceability assessment of an in-service glass walkway. Appl. Sci. 2019, 9, 1936. [Google Scholar] [CrossRef] [Green Version]
- Sachse, R.; Pavic, A.; Reynolds, P. Parametric study of modal properties of damped two-degree-of-freedom crowd–structure dynamic systems. J. Sound Vib. 2004, 274, 461–480. [Google Scholar] [CrossRef]
- Shahabpoor, E.; Pavic, A.; Racic, V. Using MSD model to simulate human-structure interaction during walking. In Topics in Dynamics of Civil Structures; Springer: Berlin/Heidelberg, Germany, 2013; Volume 4, pp. 357–364. [Google Scholar] [CrossRef]
- Zhou, D.; Han, H.; Ji, T.; Xu, X. Comparison of two models for human-structure interaction. Appl. Math. Model. 2016, 40, 3738–3748. [Google Scholar] [CrossRef]
- James, G.H., III; Carne, T.G.; Lauffer, J.P. The natural excitation technique (NExT) for modal parameter extraction from operating wind turbines. NASA STI/Recon Tech. Rep. N 1993, 93, 28603. [Google Scholar]
- Heylen, W.; Lammens, S.; Sas, P. Modal Analysis Theory and Testing; Katholieke Universiteit Leuven Leuven: Leuven, Belgium, 1997; Volume 200. [Google Scholar]
- Matsumoto, Y.; Griffin, M. Mathematical models for the apparent masses of standing subjects exposed to vertical whole-body vibration. J. Sound Vib. 2003, 260, 431–451. [Google Scholar] [CrossRef]
- Silva, F.; Pimentel, R. Biodynamic walking model for vibration serviceability of footbridges in vertical direction. In Proceedings of the 8th International Conference on Structural Dynamics (Eurodyn’11), Leuven, Belgium, 4–6 July 2011; pp. 1090–1096. [Google Scholar]
- Jiménez Alonso, J.F.; Sáez Pérez, A. A Direct Pedestrian-Structure Interaction Model to Characterize the Human Induced Vibrations on Slender Footbridges; Consejo Superior de Investigaciones Científicas: Madrid, Spain, 2014. [Google Scholar] [CrossRef] [Green Version]


Publisher’s Note: MDPI stays neutral with regard to jurisdictional claims in published maps and institutional affiliations. |
© 2021 by the authors. Licensee MDPI, Basel, Switzerland. This article is an open access article distributed under the terms and conditions of the Creative Commons Attribution (CC BY) license (https://creativecommons.org/licenses/by/4.0/).