Article

A Voxel-Based Assessment of Noise Properties in Computed Tomography Imaging with the ASiR-V and ASiR Iterative Reconstruction Algorithms

1
Unit of Medical Physics, Pisa University Hospital “Azienda Ospedaliero-Universitaria Pisana”, 56126 Pisa, Italy
2
Department of Electrical, Electronic and Information Engineering “Guglielmo Marconi”, University of Bologna, 47522 Cesena, Italy
3
Department of Radiology, Azienda USL Toscana Nord Ovest, 56025 Pontedera, Italy
*
Author to whom correspondence should be addressed.
These authors contributed equally to this study.
Appl. Sci. 2021, 11(14), 6561; https://doi.org/10.3390/app11146561
Submission received: 24 May 2021 / Revised: 8 July 2021 / Accepted: 10 July 2021 / Published: 16 July 2021
(This article belongs to the Special Issue Applications of Medical Physics)

Abstract

:
Given the inherent characteristics of nonlinearity and nonstationarity of iterative reconstruction algorithms in computed tomography (CT) imaging, this study aimed to perform, for the first time, a voxel-based characterization of noise properties in CT imaging with the ASiR-V and ASiR algorithms as compared with conventional filtered back projection (FBP). Multiple repeated scans of the Catphan-504 phantom were carried out. CT images were reconstructed using FBP and ASiR/ASiR-V with different blending levels of reconstruction (20%, 40%, 60%, 80%, 100%). Noise maps and their nonuniformity index (NUI) were obtained according to the approach proposed by the report of AAPM TG-233. For the homogeneous CTP486 module, ASiR-V/ASiR allowed a noise reduction of up to 63.7%/52.9% relative to FBP. While the noise reduction values of ASiR-V-/ASiR-reconstructed images ranged up to 33.8%/39.9% and 31.2%/35.5% for air and Teflon contrast objects, respectively, these values were approximately 60%/50% for other contrast objects (PMP, LDPE, polystyrene, acrylic, Delrin). Moreover, for all contrast objects but air and Teflon, ASiR-V showed a greater noise reduction potential than ASiR when the blending level was ≥40%. While noise maps of the homogenous CTP486 module showed only a slight spatial variation of noise (NUI < 5.2%) for all reconstruction algorithms, the NUI values of iterative-reconstructed images of the nonhomogeneous CTP404 module increased nonlinearly with blending level and were 19%/15% and 6.7% for pure ASiR-V/ASiR and FBP, respectively. Overall, these results confirm the potential of ASiR-V and ASiR in reducing noise as compared with conventional FBP, suggesting, however, that the use of pure ASiR-V or ASiR might be suboptimal for specific clinical applications.

1. Introduction

The impact of computed tomography (CT) imaging on patient dose has been a topic of increasing attention in recent years [1,2,3,4,5,6,7,8]. Given that CT examinations are the major source of population exposure to ionizing radiation in industrialized countries [9,10], many strategies have been implemented to keep patient dose as low as reasonably achievable while maintaining a good diagnostic image quality [11]. In this regard, acquisition-related approaches, such as tube current modulation (both in the axial and longitudinal planes), appropriate selection of tube voltage according to patient size, table motion, and gantry rotation speed optimization have been successfully adopted on modern CT scanners [11,12,13]. The introduction of iterative reconstruction (IR) algorithms in clinical practice represents an important step toward dose optimization [13,14,15,16,17,18]. Unlike the conventional filtered backprojection (FBP) algorithm, IR algorithms take into account various physical aspects of CT image acquisition and can be based on statistical or model-based approaches [19,20,21,22]. While statistical-based IR algorithms usually consider the fluctuations in the projection measurement through a statistical method (e.g., by modeling the photon counting), model-based algorithms include a more complex description of physical and optical aspects in the reconstruction process, resulting in a better representation of the whole imaging process but in a longer reconstruction time [19,20,21,22]. When compared with conventional FBP, IR algorithms have proven to significantly decrease noise in CT imaging, allowing CT examinations with reduced patient exposure while providing still acceptable diagnostic images [23,24,25,26,27,28]. The noise properties of CT images obtained using IR algorithms can be rather different from those of FBP-derived CT images [20,21]. Indeed, IR algorithms can have an impact not only on the noise level but also on the noise texture of CT images [24,29,30,31,32,33,34,35]. Therefore, for each specific IR algorithm, a comprehensive characterization of the noise properties and quality of reconstructed CT images is recommended to adequately assess its dose reduction potential and usefulness.
So far, a number of IR algorithms with different characteristics have been implemented on clinical CT scanners [21,22], such as the adaptive statistical iterative reconstruction (ASiR) [36], adaptive statistical iterative reconstruction-V (ASiR-V) [37], and Veo [38] (GE Healthcare, Waukesha, WI, USA). The ASiR algorithm works on sinogram data by modeling the photon statistics and some noise-related properties of the scanned object (e.g., scatter), and can be employed with different FBP–ASiR blending levels [36]. Although ASiR is widely adopted due to its fast reconstruction time, some image quality properties, such as image texture and spatial resolution, depend on the blending level of reconstruction and the dose level, yielding some artificial image texture and degradation of spatial resolution at a higher percentage of blending for low-contrast objects [24,29,33,39,40]. The model-based Veo algorithm allows limiting these drawbacks by modeling the entire imaging system (i.e., X-ray tube output, detector response, radiation scatter properties, geometric features of the beam) [21,22,34,41]. However, due to the complexity of the imaging system model, Veo reconstruction time is greatly increased compared with ASiR, hampering its wide use in clinical practice [31,34,41,42]. The more recent ASiR-V algorithm has been proposed to reduce reconstruction time with respect to Veo while preserving some advantages of the full model-based approach in terms of image quality [22,34,36]. In particular, ASiR-V features more advanced noise and object modeling as compared with ASiR [36] and implements parts of the Veo physics model, but excludes the system optics in the modeling process, enabling reconstruction time almost comparable to that of FBP [36]. Like ASiR, ASiR-V can be blended with FBP at different percentages of reconstruction, from 0% (i.e., FBP) to 100% (i.e., pure ASiR-V) [36].
Several previous studies have characterized the image quality of CT imaging with ASiR [24,28,29,33,39,43,44], finding substantial noise reduction properties as compared with conventional FBP. For instance, Miéville et al. showed that the benefit of ASiR in terms of noise reduction occurs almost independently of dose level (CTDIvol range: 0.2–7.2 mGy) with a noise reduction relative to FBP of approximately 20% and 50% for ASiR 40% and ASiR 100%, respectively [24]. Analogously, Hussain et al. found, for two different radiation exposures (tube loads of 130 and 260 mAs at 120 kVp), a noise reduction relative to FBP of approximately 30% and 50% with ASiR 50% and ASiR 100%, respectively [43]. A study by Barca et al. confirmed that ASiR has the capability of reducing noise by up to 50% relative to FBP while preserving diagnostic information at low radiation exposure [33].
More recently, a number of clinical and phantom studies have evaluated the dose reduction potential and performance of ASiR-V [45,46,47,48,49,50,51,52,53,54,55,56,57,58,59]. In particular, some studies have assessed the noise properties of CT imaging with ASiR-V in comparison with FBP or other IR algorithms [45,46,49,50,51,52,53,54,55,57,58,59]. For instance, a clinical study by Gatti et al. showed that a relevant noise reduction can be obtained using ASiR-V 40% with respect to ASiR 50% in the CT imaging of oncologic patients [50]. Goodenberger et al. compared abdomen and phantom CT images reconstructed by adopting FBP, ASiR, Veo, and ASiR-V algorithms [51]. They performed subjective and objective analyses showing that ASiR-V 30% and ASiR-V 60% provided the best combination of qualitative and quantitative performances. In a phantom study, Lim et al. compared the image quality of images reconstructed using FBP, ASiR, and ASiR-V algorithms [52]. They found that ASiR-V can allow an appreciable reduction of CT image noise and an improvement in contrast-to-noise ratio and spatial resolution. Euler et al. evaluated image noise, spatial resolution, lesion detectability, and dose reduction potential of ASiR-V (50% and 100%) in comparison with FBP by performing phantom CT acquisitions [54]. They reported that ASiR-V has the capability of reducing image noise and improving low-contrast lesion detectability when compared with FBP. They suggested that such improvement in detection can allow radiation exposure reduction. De Marco and Origgi [55] assessed the noise level and noise power spectrum properties of CT imaging with ASiR-V, considering phantom images reconstructed with soft, standard, and bone kernels. As compared with FBP, they found a greater noise reduction provided by ASiR-V with respect to ASiR for soft and standard kernels, while less noise reduction was found for the bone kernel.
While these studies [50,51,52,54,55] have explored in detail some image quality aspects of CT imaging with ASiR-V and possibly ASiR as compared with FBP, noise level has been estimated by computing the standard deviation (SD) of CT numbers within a given region of interest (ROI) [17,60,61]. However, this approach would be conceptually appropriate only for ergodic and stationary imaging systems, which feature uncorrelated noise [17,62]. Actually, due to image reconstruction and processing, CT image noise may present some degrees of correlation [63,64]. Moreover, this approach cannot provide information on the degree of spatial nonuniformity of noise [65]. Therefore, a more rigorous characterization of noise properties should be performed by computing voxelwise noise maps through multiple repeated CT imaging acquisitions [17,41,65]. Notably, these issues might be of particular relevance for IR algorithms given their inherent nonlinearity and nonstationarity properties. Therefore, the purpose of this phantom study was to carry out a voxel-based assessment of noise properties in CT imaging with ASiR-V and ASiR for different blending levels of reconstruction and contrast objects.

2. Materials and Methods

2.1. Scanner and Phantom Acquisitions
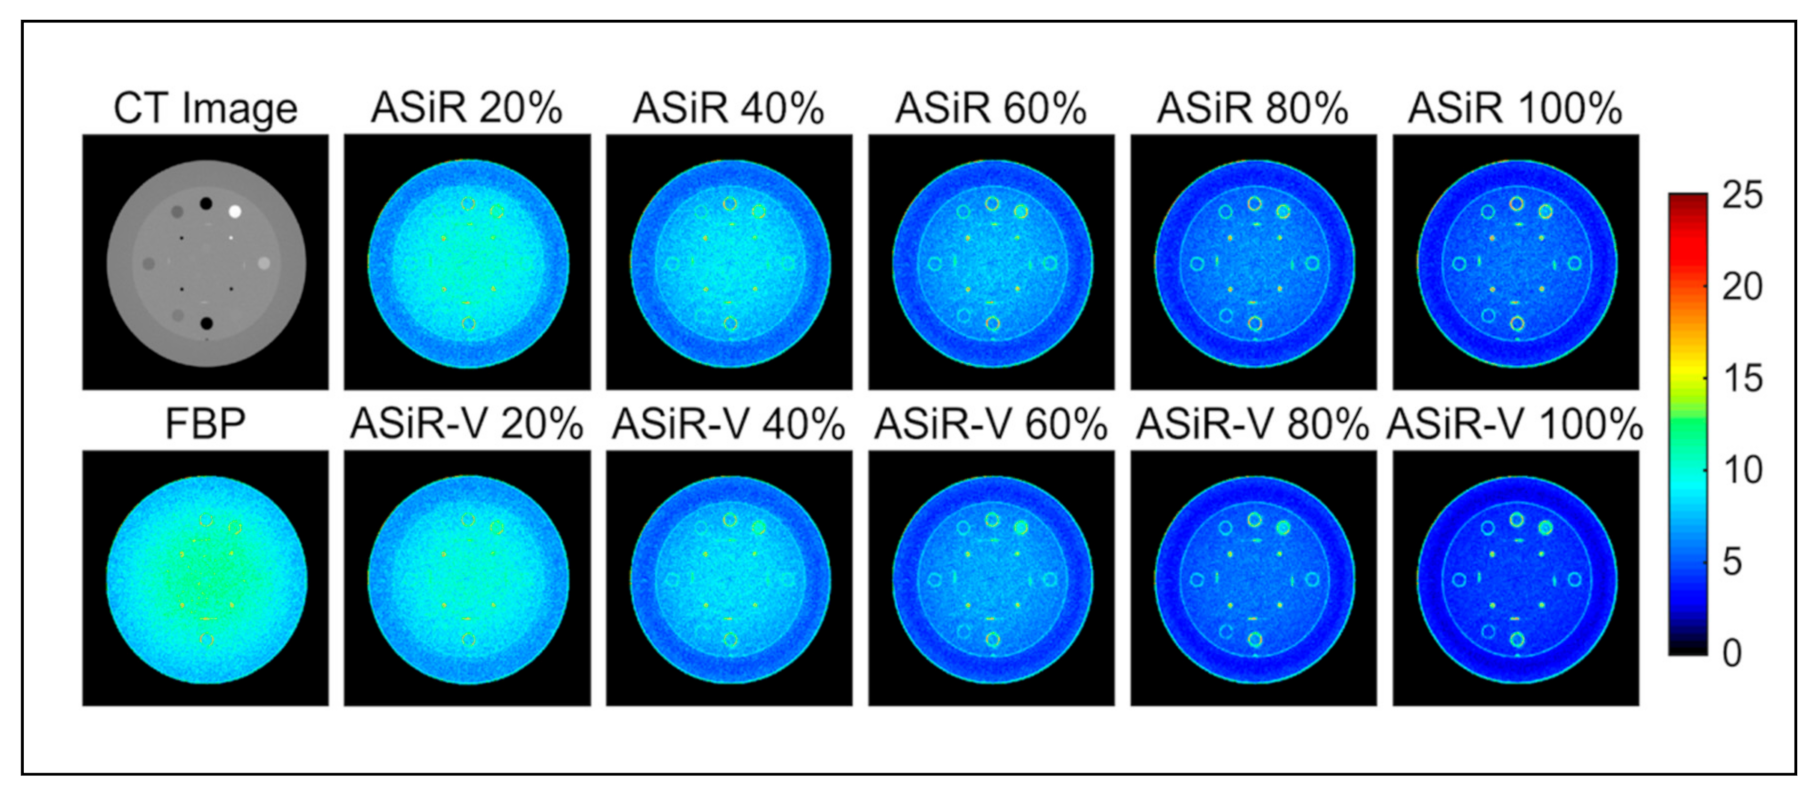
A 64-slice CT scanner (Optima CT660, GE Healthcare, Waukesha, WI, USA) was employed to acquire (helical scan mode; pitch, 0.984; rotation time, 1 s; tube load, 100 mAs without modulation; tube voltage, 120 kVp; collimation, 40 mm) images of the Catphan-504 phantom (The Phantom Laboratory, Salem, NY, USA). The entire phantom was scanned 40 times under identical conditions. CT images (slice thickness, 2.5 mm; display field of view, 250 mm × 250 mm; standard convolution kernel) were reconstructed using conventional FBP and ASiR/ASiR-V algorithms with different blending levels of reconstruction (20%, 40%, 60%, 80%, and 100%).
The Catphan-504 phantom has a cylindrical shape (20 cm outer diameter) and consists of four modules. In particular, the CTP486 and CTP404 modules were employed for noise properties assessment. The CTP486 module is a homogeneous medium, while the CTP404 module includes different contrast objects within a homogeneous background. Nominal CT numbers of the contrast objects are reported in Table 1.

2.2. Noise Maps

In order to assess local noise properties, as suggested by the AAPM Task Group 233 report [65], noise maps of CT images reconstructed by using FBP (N-FBP), ASiR (N-ASiR), and ASiR-V (N-ASiR-V) were obtained on a voxel-by-voxel basis computing the SD of each voxel value across the 40 repeated acquisitions. Then, maps of the percentage difference between noise of FBP-reconstructed images and noise of both ASiR-V-reconstructed (PDN-ASiR-V) and ASiR-reconstructed (PDN-ASiR) images were computed voxelwise. In particular, N-FBP as well as N-ASiR, N-ASiR-V, PDN-ASiR-V, and PDN-ASiR maps with different blending levels of reconstruction were obtained for the slice at the central level of both the CTP486 and CTP404 phantom modules.
For CT imaging of the homogeneous CTP486 module, a summary noise level was estimated as the mean ± SD value of N-FBP, N-ASiR, and N-ASiR-V maps within a central circular ROI of 1 cm diameter. Analogously, a summary percentage noise reduction of ASiR-V and ASiR with respect to FBP was estimated as the mean ± SD value of PDN-ASiR-V and PDN-ASiR maps, respectively, within a central circular ROI of 1 cm diameter.
For CT imaging of the CTP404 module, a summary noise value of each contrast object was estimated as the mean ± SD value of N-FBP, N-ASiR, and N-ASiR-V maps within a circular ROI of 1 cm diameter placed in the center of the contrast object. Analogously, for each contrast object, a summary percentage noise reduction of ASiR-V and ASiR with respect to FBP was estimated as the mean ± SD value of PDN-ASiR-V and PDN-ASiR maps, respectively, within a circular ROI of 1 cm diameter placed in the center of the contrast object.
In order to assess the spatial nonuniformity degree of N-FBP, N-ASiR, and N-ASiR-V maps, the nonuniformity index (NUI) [67], as proposed by the AAPM Task Group 233 report [65], was employed. Specifically, for both the CTP486 and CTP404 modules, the entire inner part of the phantom (diameter, 15 cm) was divided into k = 249 ROIs (size, 8 mm × 8 mm). Then, for each map (N-FBP, N-ASiR, and N-ASiR-V), the NUI was calculated as:
N U I = 100 m 1 k 1 i = 1 k ( m i m ) 2
where mi and <m> are the average of the values of the considered map within the i-th ROI and the average of all mi values, respectively.
Furthermore, in order to characterize the spatial distribution of noise in CT imaging with ASiR and ASiR-V reconstruction algorithms, the histograms of N-ASiR and N-ASiR-V maps, as well as of N-FBP map, were computed for the entire inner part of the CTP486 module (diameter, 15 cm). Then, the histogram descriptors of median, interquartile range, kurtosis, and skewness were calculated.
Image analysis was performed by using the MATLAB R2018a (MathWorks, Natick, MA, USA) software package.

3. Results

N-FBP and N-ASiR/N-ASiR-V maps (with different blending levels of reconstruction) of the CTP486 homogeneous module and CTP404 module with contrast objects are shown in Figure 1 and Figure 2, respectively.
Moreover, PDN-ASiR and PDN-ASiR-V maps (with different blending levels of reconstruction) of the CTP486 homogeneous module and CTP404 module with contrast objects are displayed in Figure 3 and Figure 4, respectively.
Noise maps of the homogenous CTP486 phantom module (Figure 1) showed only a slight spatial variation of local noise values for the FBP-reconstructed CT image, which seemed less for ASiR-V- and ASiR-reconstructed CT images with higher blending levels. This is corroborated by the NUI values reported in detail in Figure 5. In particular, the NUI value for the FBP-reconstructed CT image was 5.2%, while the NUI values for the ASiR-V- and ASiR-reconstructed CT images with a 100% blending level were 2.7% and 3.4%, respectively. On the other hand, noise maps of the CTP404 phantom module (including various contrast objects) (Figure 2) showed a more appreciable degree of spatial variation of noise, with higher noise values at the boundary between each contrast object and background, especially for ASiR-V- and ASiR-reconstructed CT images. The NUI value for the FBP-reconstructed CT image was 6.7%. The NUI values for the IR-reconstructed CT images increased nonlinearly with the blending level and were 19% and 15% for pure ASiR-V and ASiR, respectively.
As shown by PDN-ASiR-V and PDN-ASiR maps of the homogenous CTP486 module (Figure 3), when compared with conventional FBP, both ASiR and ASiR-V allowed a substantial noise reduction in CT imaging. In this regard, noise values in the CT imaging of the homogenous CTP486 phantom module are reported in Table 2 for FBP, ASiR-V, and ASiR. The percentage difference between noise in the FBP-reconstructed CT image and that in both ASiR-V- and ASiR-reconstructed CT images increased with increasing blending level, up to 64% and 53% for ASiR-V and ASiR, respectively (Figure 6). Except for the lowest blending level of 20%, ASiR-V presented greater noise reduction potential than ASiR (Figure 6).
For different contrast objects (i.e., air, PMP, LDPE, polystyrene, acrylic, Delrin, Teflon) of the CTP404 phantom module, summary noise level values in CT imaging using FBP and ASiR-V/ASiR with different blending levels of reconstruction are reported in detail in Table 3. Figure 7 shows the noise reduction properties of ASiR-V and ASiR reconstruction algorithms with respect to conventional FBP for different contrast objects and blending levels of reconstruction. For all contrast objects, when compared with conventional FBP, both ASiR-V and ASiR allowed a substantial reduction in noise level, which decreased with an increasing blending level of reconstruction (Table 3). The noise reduction properties of both ASiR and ASiR-V depended on the contrast object. In particular, higher contrast objects (i.e., air and Teflon) were characterized by a lower noise reduction degree (Figure 7). Moreover, for all contrast objects but air and Teflon, ASiR-V showed a greater noise reduction potential than ASiR when the blending level was ≥40%.
Histograms of N-ASiR and N-ASiR-V maps, as well as of the N-FBP map, are shown in Figure 8. Moreover, values of histogram descriptors (median, interquartile range, kurtosis, skewness) are reported in detail in Table 4. While noise map histogram of the FBP-reconstructed CT image approximated a Gaussian distribution (kurtosis and skewness values of 3 and 0.23, respectively), noise map histograms of ASiR- and ASiR-V-reconstructed CT images leaned to deviate from a Gaussian distribution when increasing the blending level of reconstruction, with kurtosis/skewness values for pure ASiR- and ASiR-V-reconstructed CT images of 3.57/0.41 and 3.35/0.24, respectively.

4. Discussion

Given that IR algorithms in CT imaging can be inherently nonlinear and nonstationary, noise properties should be possibly assessed by using a rigorous voxel-based approach exploiting multiple repeated acquisitions. Unlike the widely employed approach of estimating noise as the SD of CT numbers within an ROI, this more complex approach allows for solving potential issues related to nonvalidity of the ergodic theorem for CT imaging with IRs, as well as for assessing the spatial nonuniformity degree of noise. However, so far, only few studies [67,68,69,70] have employed such an approach to characterize noise properties in CT imaging with IRs. In particular, Solomon and Samei [68] performed multiple repeated CT acquisitions of a uniform phantom and of two anatomically informed textured phantoms, and used these phantoms to assess noise properties for FBP and the sinogram affirmed iterative reconstruction (SAFIRE, Siemens Healthcare) algorithm. They found that noise was globally nonstationary, and this was mostly relevant for SAFIRE-reconstructed CT images of textured phantoms. In a similar study, Solomon et al. [69] showed that the advanced modeled iterative reconstruction (ADMIRE, Siemens Healthcare) algorithm with different iterative strengths (i.e., 3, 4, and 5) allowed a noise reduction of up to 64% relative to FBP. A study by Funama et al. [70] compared noise in CT images of a porcine liver phantom surrounded by agar gel acquired 100 times, reconstructed using FBP and the iterative model reconstruction (IMR, Philips Healthcare) algorithm with various noise reduction levels (L1, L2, and L3, where L3 offers the greatest noise reduction). They revealed a spatial dependence of noise for IMR-reconstructed CT images. Moreover, for IMR-L3, a noise reduction of 68%–75% relative to FBP was observed. Li et al. [67] acquired 50 repeated acquisitions of a homogeneous phantom in order to assess the spatial nonuniformity of noise maps associated with FBP- and Veo-reconstructed images. Veo-reconstructed CT images were characterized by at least a 50% reduction in NUI values relative to FBP-reconstructed CT images.
Some previous clinical or phantom studies have reported a higher noise reduction capability of ASiR-V as compared with ASiR. For instance, Gatti et al. [50] conducted a retrospective case–control study involving oncologic patients who underwent baseline and follow-up CT scans with ASiR 50% and ASiR-V 40%, respectively. Noise was estimated as the SD of CT numbers within three circular ROIs placed in homogeneous regions of three different tissues. Regardless of the anatomical region, noise was found lower in ASiR-V 40%-reconstructed images than in ASiR 50%-reconstructed images, albeit radiation exposure was 38% lower for the ASIR-V examinations than for the ASiR ones. Similarly, Goodenberger et al. carried out a retrospective study on 36 patients who underwent an abdomino-pelvic CT scan [51]. They assessed the noise level within lesions for CT images reconstructed using FBP, ASiR 80%, Veo, and ASiR-V (30%, 60%, and 90%). The highest noise level was revealed on FBP-reconstructed images, followed by ASiR-V 30%-, ASiR 80%-, Veo-, ASiR-V 60%-, and ASiR-V 90%-reconstructed images. Lim et al. [52] compared the noise performances of ASiR-V, ASiR, and FBP on an anthropomorphic phantom using three blending levels of reconstruction (30%, 50%, and 70%) and five different tube currents. By assessing the noise magnitude and noise reduction relative to FBP within a circular ROI in a homogeneous area of the phantom, they found that ASiR-V 30%, ASiR-V 50%, and ASiR-V 70% can allow a noise reduction of 30%–45%, 41%–61%, and 52%–67%, respectively. On the other hand, ASiR with the same blending levels showed a lower noise reduction of 18%–20%, 30%–33%, and 41%–49%, respectively. Euler et al. [54] characterized the noise level of ASiR-V-reconstructed (50% and 100% blending levels of reconstruction) CT images. On average, they found a noise reduction of 37% (ASiR-V 50%) and 72% (ASiR-V 100%) relative to FBP. Another phantom study by De Marco and Origgi [55] compared the noise levels of FBP-, ASiR-V-, and ASiR-reconstructed images (blending levels of 40%, 60%, and 100%) acquired on two different CT scanners (i.e., ASiR-V- and ASiR-reconstructed images were not obtained from the same sinogram data). Specifically, this study assessed the effect of convolution kernel (standard, soft, and bone), slice thickness, and radiation exposure on noise level for all the used reconstruction algorithms. When compared with FBP, ASiR-V showed a greater noise (estimated as the SD of CT numbers within a square ROI in a homogeneous phantom) reduction than ASiR with noise reduction values of 12%–28%, 18%–41%, and 29%–64% for ASiR-V 40%, 60%, and 100%, respectively. For both ASiR-V and ASiR, noise reduction relative to FBP was almost independent of dose exposure.
To the best of our knowledge, this is the first study that performed, for different blending levels of reconstruction and contrast objects, a voxel-based assessment of noise properties in CT imaging with ASiR-V and ASiR algorithms as compared with conventional FBP. This approach, which can allow a better characterization of noise properties in CT imaging with IR algorithms, is based on spatial noise maps (Figure 1 and Figure 2). In general, we found that, when compared with FBP, ASiR-V presents a greater noise reduction than ASiR for a homogeneous medium, except for the lowest blending level of 20% (Figure 6). In particular, the noise reduction value ranged up to 52.9% and 63.7% for pure ASiR and pure ASiR-V, respectively. This finding has also been confirmed for various contrast objects (i.e., PMP, LDPE, polystyrene, acrylic, Delrin) (Figure 7) with noise reduction values rather independent of contrast objects and ranging up to approximately 50% and 60% for pure ASiR and pure ASiR-V, respectively. On the other hand, for higher contrast objects (i.e., air and Teflon) and all blending levels, ASiR-V showed a lower noise reduction capability than ASiR. In this case, the noise reduction values of ASiR-V-/ASiR-reconstructed images were lower and ranged up to 33.8%/39.9% and 31.2%/35.5% for air and Teflon contrast objects, respectively.
In this work, unlike a few previous studies on the characterization of noise in CT imaging with ASiR-V and ASiR [50,51,52,54,55], voxelwise noise maps allow an assessment of the spatial uniformity of noise, which might be affected by the nonlinearity and nonstationarity effects of IR algorithms. For the homogeneous medium, FBP-reconstructed images showed a rather low level of the spatial nonuniformity of noise with an NUI value of 5.2%. The NUI values of ASiR-V- and ASiR-reconstructed CT images were lower than the NUI value of FBP-reconstructed images and slightly decreased with an increasing blending level of reconstruction (Figure 5a). This could be partly associated with a shift of noise power spectrum curves toward lower spatial frequencies, which has been observed for CT imaging with ASiR-V and ASiR mostly at higher blending levels of reconstruction [24,29,35,55]. Notably, for the nonhomogeneous medium with contrast objects, both ASiR-V- and ASiR-reconstructed CT images showed NUI values greater than the NUI value of FBP-reconstructed CT images (approximately 7%), increasing with the blending level of reconstruction (Figure 5b). In particular, the NUI values of CT imaging with pure ASiR-V and pure ASiR were approximately three and two times, respectively, that of CT imaging with FBP. This is likely to derive from a noise reduction capability of ASiR-V and ASiR reconstruction algorithms that does not seem so effective at the boundary between different media (Figure 2 and Figure 4). While this effect has been reported for other IR algorithms [68,69,70], no previous study has observed it for CT imaging with ASiR-V and ASiR. As submitted by Solomon and Samei [68], given that IR algorithms aim at reducing noise while preserving the fidelity of fine details, this necessitates a conservative approach to noise reduction for voxels near edges, and therefore, noise is not reduced as much near edges or structures (i.e., “edge” effect).
The nonuniformity findings of this study suggest that, for CT imaging, a noise evaluation only in homogeneous phantoms could be incomplete and/or partly misleading when IR algorithms are employed. While pure ASiR-V/ASiR offers the maximum noise reduction capability in reconstructed CT images, a blending level of 100% can affect the spatial uniformity of noise mostly at the boundary between different structures. Therefore, for specific clinical applications of CT imaging with ASiR-V and ASiR, the use of a maximum blending level of reconstruction might be not optimal [27,40,43,44,71,72]. In particular, the revealed “edge” effect might partly limit the potential of IR algorithms in studying small structures (such as metastases, vessels, pulmonary nodules, or brain ischemic lesions), especially when they present reduced contrast.
Analysis of noise map histograms (Table 4) showed that, for both ASiR- and ASiR-V-reconstructed CT images, kurtosis and interquartile range/median values monotonically increased and decreased, respectively, with increasing blending level of reconstruction. Moreover, for all the blending levels of reconstruction, noise map histograms of ASiR-reconstructed CT images were characterized by higher or equal kurtosis and interquartile range values compared with that of ASiR-V-reconstructed CT images. Overall, these results might reflect the inherent nonlinear and nonstationary properties of iterative reconstruction algorithms in CT imaging.

5. Conclusions

In this preliminary study, we aimed at characterizing in greater detail noise properties in CT imaging with ASiR-V and ASiR by means of spatial noise maps obtained from multiple repeated acquisitions of a homogeneous phantom and of a phantom with different contrast objects. Our results confirm the potential of ASiR-V and ASiR in reducing noise (up to 60% or more) as compared with conventional FBP. In this regard, while ASiR-V outperforms ASiR in general, this does not necessarily hold true for the CT imaging of structures with high contrast. Both ASiR-V- and ASiR-reconstructed CT images show a higher spatial nonuniformity of noise than FBP-reconstructed images. This effect increases with increasing blending level of reconstruction and reflects a less effective noise reduction potential of ASiR-V and ASiR at the boundary between different structures.
In summary, an exhaustive characterization of noise properties in CT imaging with IR algorithms is needed to actually assess the dose reduction potential of this technique and its possible limitations for specific clinical applications. This study suggests that, when using IR algorithms, the conventional approach of estimating the noise level by computing the SD of CT numbers within a given ROI is inadequate and precludes showing any non-negligible spatial nonuniformity of noise, which may vary with the blending level of reconstruction. Overall, our findings indicate that a voxel-based characterization of noise properties is recommended when dealing with a novel IR algorithm or when comparing the performances of different IR algorithms.

Author Contributions

Conceptualization, P.B. and M.G.; methodology, P.B., D.M. and M.G.; software, D.M.; validation, P.B., D.M., and M.G.; formal analysis, D.M.; investigation, P.B., D.M., and M.G.; resources, A.C.T. and M.G.; data curation, P.B. and D.M.; writing—original draft preparation, P.B., D.M., and M.G.; writing—review and editing, P.B., D.M., C.M., S.C., S.D., A.C.T. and M.G.; visualization, P.B., D.M., C.M., S.C., S.D., A.C.T. and M.G.; supervision, M.G.; project administration, M.G. All authors have read and agreed to the published version of the manuscript.

Funding

This research received no external funding.

Data Availability Statement

The data presented in this study are available on reasonable request from the corresponding author.

Acknowledgments

The authors would like to thank Davide Caramella for a stimulating and constructive discussion.

Conflicts of Interest

The authors declare no conflict of interest.

References

  1. Brenner, D.J.; Hall, E.J. Computed Tomography—An Increasing Source of Radiation Exposure. N. Engl. J. Med. 2007, 357, 2277–2284. [Google Scholar] [CrossRef] [PubMed] [Green Version]
  2. Boone, J.M.; Brink, J.A.; Edyvean, S.; Huda, W.; Leitz, W.; McCollough, C.H.; McNitt-Gray, M.F. Report 87. J. ICRU 2012, 12. [Google Scholar] [CrossRef]
  3. Thrall, J.H. Radiation Exposure in CT Scanning and Risk: Where Are We? Radiology 2012, 264, 325–328. [Google Scholar] [CrossRef] [PubMed] [Green Version]
  4. Smith-Bindman, R.; Wang, Y.; Chu, P.; Chung, R.; Einstein, A.J.; Balcombe, J.; Cocker, M.; Das, M.; Delman, B.N.; Flynn, M.; et al. International Variation in Radiation Dose for Computed Tomography Examinations: Prospective Cohort Study. BMJ 2019, k4931. [Google Scholar] [CrossRef] [Green Version]
  5. Lumbreras, B.; Salinas, J.M.; Gonzalez-Alvarez, I. Cumulative Exposure to Ionising Radiation from Diagnostic Imaging Tests: A 12-Year Follow-up Population-Based Analysis in Spain. BMJ Open 2019, 9, e030905. [Google Scholar] [CrossRef] [PubMed] [Green Version]
  6. Andersson, J.; Pavlicek, W.; Al-Senan, R.; Cody, D.; Dixon, R.; Columbo, P.; Dong, F.; Edyvean, S.; Jansen, J.; Kanal, K.; et al. Estimating Patient Organ Dose with Computed Tomography: A Review of Present Methodology and Required DICOM Information. A Joint Report of AAPM Task Group 246 and the European Federation of Organizations for Medical Physics (EFOMP); AAPM: Alexandria, VA, USA, 2019. [Google Scholar]
  7. Rehani, M.M.; Yang, K.; Melick, E.R.; Heil, J.; Šalát, D.; Sensakovic, W.F.; Liu, B. Patients Undergoing Recurrent CT Scans: Assessing the Magnitude. Eur. Radiol. 2020, 30, 1828–1836. [Google Scholar] [CrossRef]
  8. De Mattia, C.; Campanaro, F.; Rottoli, F.; Colombo, P.E.; Pola, A.; Vanzulli, A.; Torresin, A. Patient Organ and Effective Dose Estimation in CT: Comparison of Four Software Applications. Eur. Radiol. Exp. 2020, 4, 14. [Google Scholar] [CrossRef] [Green Version]
  9. European Commission; Directorate-General for Energy. Medical Radiation Exposure of the European Population; Radiation Protection; Publications Office of the European Union: Luxembourg, 2015; ISBN 978-92-79-45374-8. [Google Scholar]
  10. National Council on Radiation Protection and Measurements (Ed.) Medical Radiation Exposure of Patients in the United States: Recommendations of the National Council on Radiation Protection and Measurements; NCRP Report; National Council on Radiation Protection and Measurements: Bethesda, MD, USA, 2019; ISBN 978-1-944888-16-9. [Google Scholar]
  11. McNitt-Gray, M.F. AAPM/RSNA Physics Tutorial for Residents. Topics in CT: Radiation Dose in CT. RadioGraphics 2002, 22, 1541–1553. [Google Scholar] [CrossRef]
  12. Gunn, M.L.D.; Kohr, J.R. State of the Art: Technologies for Computed Tomography Dose Reduction. Emerg. Radiol. 2010, 17, 209–218. [Google Scholar] [CrossRef]
  13. Silva, A.C.; Lawder, H.J.; Hara, A.; Kujak, J.; Pavlicek, W. Innovations in CT Dose Reduction Strategy: Application of the Adaptive Statistical Iterative Reconstruction Algorithm. Am. J. Roentgenol. 2010, 194, 191–199. [Google Scholar] [CrossRef] [PubMed]
  14. Costello, J.E.; Cecava, N.D.; Tucker, J.E.; Bau, J.L. CT Radiation Dose: Current Controversies and Dose Reduction Strategies. Am. J. Roentgenol. 2013, 201, 1283–1290. [Google Scholar] [CrossRef]
  15. Hara, A.K.; Paden, R.G.; Silva, A.C.; Kujak, J.L.; Lawder, H.J.; Pavlicek, W. Iterative Reconstruction Technique for Reducing Body Radiation Dose at CT: Feasibility Study. Am. J. Roentgenol. 2009, 193, 764–771. [Google Scholar] [CrossRef]
  16. Kalra, M.K.; Woisetschläger, M.; Dahlström, N.; Singh, S.; Lindblom, M.; Choy, G.; Quick, P.; Schmidt, B.; Sedlmair, M.; Blake, M.A.; et al. Radiation Dose Reduction with Sinogram Affirmed Iterative Reconstruction Technique for Abdominal Computed Tomography. J. Comput. Assist. Tomogr. 2012, 36, 339–346. [Google Scholar] [CrossRef] [PubMed]
  17. Vaishnav, J.Y.; Jung, W.C.; Popescu, L.M.; Zeng, R.; Myers, K.J. Objective Assessment of Image Quality and Dose Reduction in CT Iterative Reconstruction: Validating Dose Reduction Claims for CT Iterative Reconstruction. Med. Phys. 2014, 41, 071904. [Google Scholar] [CrossRef]
  18. Padole, A.; Ali Khawaja, R.D.; Kalra, M.K.; Singh, S. CT Radiation Dose and Iterative Reconstruction Techniques. Am. J. Roentgenol. 2015, 204, W384–W392. [Google Scholar] [CrossRef]
  19. Beister, M.; Kolditz, D.; Kalender, W.A. Iterative Reconstruction Methods in X-Ray CT. Phys. Med. 2012, 28, 94–108. [Google Scholar] [CrossRef]
  20. Willemink, M.J.; de Jong, P.A.; Leiner, T.; de Heer, L.M.; Nievelstein, R.A.J.; Budde, R.P.J.; Schilham, A.M.R. Iterative Reconstruction Techniques for Computed Tomography Part 1: Technical Principles. Eur. Radiol. 2013, 23, 1623–1631. [Google Scholar] [CrossRef]
  21. Geyer, L.L.; Schoepf, U.J.; Meinel, F.G.; Nance, J.W.; Bastarrika, G.; Leipsic, J.A.; Paul, N.S.; Rengo, M.; Laghi, A.; De Cecco, C.N. State of the Art: Iterative CT Reconstruction Techniques. Radiology 2015, 276, 339–357. [Google Scholar] [CrossRef]
  22. Stiller, W. Basics of Iterative Reconstruction Methods in Computed Tomography: A Vendor-Independent Overview. Eur. J. Radiol. 2018, 109, 147–154. [Google Scholar] [CrossRef]
  23. Pickhardt, P.J.; Lubner, M.G.; Kim, D.H.; Tang, J.; Ruma, J.A.; del Rio, A.M.; Chen, G.-H. Abdominal CT with Model-Based Iterative Reconstruction (MBIR): Initial Results of a Prospective Trial Comparing Ultralow-Dose with Standard-Dose Imaging. Am. J. Roentgenol. 2012, 199, 1266–1274. [Google Scholar] [CrossRef] [Green Version]
  24. Miéville, F.A.; Gudinchet, F.; Brunelle, F.; Bochud, F.O.; Verdun, F.R. Iterative Reconstruction Methods in Two Different MDCT Scanners: Physical Metrics and 4-Alternative Forced-Choice Detectability Experiments—A Phantom Approach. Phys. Med. 2013, 29, 99–110. [Google Scholar] [CrossRef] [Green Version]
  25. Willemink, M.J.; Leiner, T.; de Jong, P.A.; de Heer, L.M.; Nievelstein, R.A.J.; Schilham, A.M.R.; Budde, R.P.J. Iterative Reconstruction Techniques for Computed Tomography Part 2: Initial Results in Dose Reduction and Image Quality. Eur. Radiol. 2013, 23, 1632–1642. [Google Scholar] [CrossRef]
  26. Chen, J.-H.; Jin, E.-H.; He, W.; Zhao, L.-Q. Combining Automatic Tube Current Modulation with Adaptive Statistical Iterative Reconstruction for Low-Dose Chest CT Screening. PLoS ONE 2014, 9, e92414. [Google Scholar] [CrossRef]
  27. Smith, E.A.; Dillman, J.R.; Goodsitt, M.M.; Christodoulou, E.G.; Keshavarzi, N.; Strouse, P.J. Model-Based Iterative Reconstruction: Effect on Patient Radiation Dose and Image Quality in Pediatric Body CT. Radiology 2014, 270, 526–534. [Google Scholar] [CrossRef] [PubMed]
  28. Mangat, J.; Morgan, J.; Benson, E.; Båth, M.; Lewis, M.; Reilly, A. A Study of the Image Quality of Computed Tomography Adaptive Statistical Iterative Reconstructed Brain Images Using Subjective and Objective Methods. Radiat. Prot. Dosim. 2016, 169, 92–99. [Google Scholar] [CrossRef] [PubMed]
  29. Samei, E.; Richard, S. Assessment of the Dose Reduction Potential of a Model-Based Iterative Reconstruction Algorithm Using a Task-Based Performance Metrology. Med. Phys. 2014, 42, 314–323. [Google Scholar] [CrossRef] [PubMed]
  30. Dodge, C.T.; Tamm, E.P.; Cody, D.D.; Liu, X.; Jensen, C.T.; Wei, W.; Kundra, V.; Rong, X.J. Performance Evaluation of Iterative Reconstruction Algorithms for Achieving CT Radiation Dose Reduction—A Phantom Study. J. Appl. Clin. Med. Phys. 2016, 17, 511–531. [Google Scholar] [CrossRef] [PubMed] [Green Version]
  31. Li, G.; Liu, X.; Dodge, C.T.; Jensen, C.T.; Rong, X.J. A Noise Power Spectrum Study of a New Model-Based Iterative Reconstruction System: Veo 3.0. J. Appl. Clin. Med. Phys. 2016, 17, 428–439. [Google Scholar] [CrossRef] [Green Version]
  32. Andersen, H.K.; Völgyes, D.; Martinsen, A.C.T. Image Quality with Iterative Reconstruction Techniques in CT of the Lungs—A Phantom Study. Eur. J. Radiol. Open 2018, 5, 35–40. [Google Scholar] [CrossRef] [Green Version]
  33. Barca, P.; Giannelli, M.; Fantacci, M.E.; Caramella, D. Computed Tomography Imaging with the Adaptive Statistical Iterative Reconstruction (ASIR) Algorithm: Dependence of Image Quality on the Blending Level of Reconstruction. Australas. Phys. Eng. Sci. Med. 2018, 41, 463–473. [Google Scholar] [CrossRef]
  34. Willemink, M.J.; Noël, P.B. The Evolution of Image Reconstruction for CT—From Filtered Back Projection to Artificial Intelligence. Eur. Radiol. 2019, 29, 2185–2195. [Google Scholar] [CrossRef] [Green Version]
  35. Pan, T.; Hasegawa, A.; Luo, D.; Wu, C.C.; Vikram, R. Technical Note: Impact on Central Frequency and Noise Magnitude Ratios by Advanced CT Image Reconstruction Techniques. Med. Phys. 2020, 47, 480–487. [Google Scholar] [CrossRef] [PubMed]
  36. Hsieh, J. Adaptive Statistical Iterative Reconstruction. White Papper GE Healthcare; 2008; pp. 1–4. [Google Scholar]
  37. Fan, J.; Yue, M.; Melnyk, R. Benefits of ASiR-V Reconstruction for Reducing Patient Radiation Dose and Preserving Diagnostic Quality in CT Exams. White Papper GE Healthcare; 2014; pp. 1–8. [Google Scholar]
  38. Thibault, J.-B. Veo CT Model-Based Iterative Reconstruction. White Papper GE Healthcare; 2010; pp. 1–12. [Google Scholar]
  39. Richard, S.; Husarik, D.B.; Yadava, G.; Murphy, S.N.; Samei, E. Towards Task-Based Assessment of CT Performance: System and Object MTF across Different Reconstruction Algorithms. Med. Phys. 2012, 39, 4115–4122. [Google Scholar] [CrossRef]
  40. McCollough, C.H.; Yu, L.; Kofler, J.M.; Leng, S.; Zhang, Y.; Li, Z.; Carter, R.E. Degradation of CT Low-Contrast Spatial Resolution Due to the Use of Iterative Reconstruction and Reduced Dose Levels. Radiology 2015, 276, 499–506. [Google Scholar] [CrossRef]
  41. Hsieh, J. Computed Tomography: Principles, Design, Artifacts, and Recent Advances; SPIE PRESS: Bellingham, WA, USA, 2015; ISBN 978-1-62841-825-5. [Google Scholar]
  42. Thibault, J.-B.; Sauer, K.D.; Bouman, C.A.; Hsieh, J. A Three-Dimensional Statistical Approach to Improved Image Quality for Multislice Helical CT. Med. Phys. 2007, 34, 4526–4544. [Google Scholar] [CrossRef]
  43. Hussain, F.A.; Mail, N.; Shamy, A.M.; Alghamdi, S.; Saoudi, A. A Qualitative and Quantitative Analysis of Radiation Dose and Image Quality of Computed Tomography Images Using Adaptive Statistical Iterative Reconstruction. J. Appl. Clin. Med. Phys. 2016, 17, 419–432. [Google Scholar] [CrossRef]
  44. Kim, H.G.; Chung, Y.E.; Lee, Y.H.; Choi, J.-Y.; Park, M.-S.; Kim, M.-J.; Kim, K.W. Quantitative Analysis of the Effect of Iterative Reconstruction Using a Phantom: Determining the Appropriate Blending Percentage. Yonsei Med. J. 2015, 56, 253. [Google Scholar] [CrossRef]
  45. Kwon, H.; Cho, J.; Oh, J.; Kim, D.; Cho, J.; Kim, S.; Lee, S.; Lee, J. The Adaptive Statistical Iterative Reconstruction-V Technique for Radiation Dose Reduction in Abdominal CT: Comparison with the Adaptive Statistical Iterative Reconstruction Technique. Br. J. Radiol. 2015, 88, 20150463. [Google Scholar] [CrossRef] [Green Version]
  46. Benz, D.C.; Gräni, C.; Mikulicic, F.; Vontobel, J.; Fuchs, T.A.; Possner, M.; Clerc, O.F.; Stehli, J.; Gaemperli, O.; Pazhenkottil, A.P.; et al. Adaptive Statistical Iterative Reconstruction-V: Impact on Image Quality in Ultralow-Dose Coronary Computed Tomography Angiography. J. Comput. Assist. Tomogr. 2016, 40, 958–963. [Google Scholar] [CrossRef] [Green Version]
  47. So, A.; Imai, Y.; Nett, B.; Jackson, J.; Nett, L.; Hsieh, J.; Wisenberg, G.; Teefy, P.; Yadegari, A.; Islam, A.; et al. Technical Note: Evaluation of a 160-Mm/256-Row CT Scanner for Whole-Heart Quantitative Myocardial Perfusion Imaging. Med. Phys. 2016, 43, 4821–4832. [Google Scholar] [CrossRef]
  48. Racine, D.; Ott, J.G.; Ba, A.; Ryckx, N.; Bochud, F.O.; Verdun, F.R. Objective Task-Based Assessment of Low-Contrast Detectability in Iterative Reconstruction. Radiat. Prot. Dosim. 2016, 169, 73–77. [Google Scholar] [CrossRef]
  49. Kim, H.G.; Lee, H.-J.; Lee, S.-K.; Kim, H.J.; Kim, M.-J. Head CT: Image Quality Improvement with ASIR-V Using a Reduced Radiation Dose Protocol for Children. Eur. Radiol. 2017, 27, 3609–3617. [Google Scholar] [CrossRef]
  50. Gatti, M.; Marchisio, F.; Fronda, M.; Rampado, O.; Faletti, R.; Bergamasco, L.; Ropolo, R.; Fonio, P. Adaptive Statistical Iterative Reconstruction–V versus Adaptive Statistical Iterative Reconstruction: Impact on Dose Reduction and Image Quality in Body Computed Tomography. J. Comput. Assist. Tomogr. 2018, 42, 191–196. [Google Scholar] [CrossRef] [PubMed]
  51. Goodenberger, M.H.; Wagner-Bartak, N.A.; Gupta, S.; Liu, X.; Yap, R.Q.; Sun, J.; Tamm, E.P.; Jensen, C.T. Computed Tomography Image Quality Evaluation of a New Iterative Reconstruction Algorithm in the Abdomen (Adaptive Statistical Iterative Reconstruction–V) a Comparison with Model-Based Iterative Reconstruction, Adaptive Statistical Iterative Reconstruction, and Filtered Back Projection Reconstructions. J. Comput. Assist. Tomogr. 2018, 42, 184–190. [Google Scholar] [CrossRef]
  52. Lim, K.; Kwon, H.; Cho, J.; Oh, J.; Yoon, S.; Kang, M.; Ha, D.; Lee, J.; Kang, E. Initial Phantom Study Comparing Image Quality in Computed Tomography Using Adaptive Statistical Iterative Reconstruction and New Adaptive Statistical Iterative Reconstruction V. J. Comput. Assist. Tomogr. 2015, 39, 443–448. [Google Scholar] [CrossRef]
  53. Tang, H.; Yu, N.; Jia, Y.; Yu, Y.; Duan, H.; Han, D.; Ma, G.; Ren, C.; He, T. Assessment of Noise Reduction Potential and Image Quality Improvement of a New Generation Adaptive Statistical Iterative Reconstruction (ASIR-V) in Chest CT. Br. J. Radiol. 2018, 91, 20170521. [Google Scholar] [CrossRef]
  54. Euler, A.; Solomon, J.; Marin, D.; Nelson, R.C.; Samei, E. A Third-Generation Adaptive Statistical Iterative Reconstruction Technique: Phantom Study of Image Noise, Spatial Resolution, Lesion Detectability, and Dose Reduction Potential. Am. J. Roentgenol. 2018, 210, 1301–1308. [Google Scholar] [CrossRef]
  55. De Marco, P.; Origgi, D. New Adaptive Statistical Iterative Reconstruction ASiR-V: Assessment of Noise Performance in Comparison to ASiR. J. Appl. Clin. Med. Phys. 2018, 19, 275–286. [Google Scholar] [CrossRef] [Green Version]
  56. Viry, A.; Aberle, C.; Racine, D.; Knebel, J.-F.; Schindera, S.T.; Schmidt, S.; Becce, F.; Verdun, F.R. Effects of Various Generations of Iterative CT Reconstruction Algorithms on Low-Contrast Detectability as a Function of the Effective Abdominal Diameter: A Quantitative Task-Based Phantom Study. Phys. Med. 2018, 48, 111–118. [Google Scholar] [CrossRef] [Green Version]
  57. Chen, L.; Jin, C.; Li, J.; Wang, G.; Jia, Y.; Duan, H.; Pan, N.; Guo, J. Image Quality Comparison of Two Adaptive Statistical Iterative Reconstruction (ASiR, ASiR-V) Algorithms and Filtered Back Projection in Routine Liver CT. Br. J. Radiol. 2018, 91, 20170655. [Google Scholar] [CrossRef]
  58. Tang, H.; Liu, Z.; Hu, Z.; He, T.; Li, D.; Yu, N.; Jia, Y.; Shi, H. Clinical Value of a New Generation Adaptive Statistical Iterative Reconstruction (ASIR-V) in the Diagnosis of Pulmonary Nodule in Low-Dose Chest CT. Br. J. Radiol. 2019, 92, 20180909. [Google Scholar] [CrossRef]
  59. Han, W.K.; Na, J.C.; Park, S.Y. Low-Dose CT Angiography Using ASiR-V for Potential Living Renal Donors: A Prospective Analysis of Image Quality and Diagnostic Accuracy. Eur. Radiol. 2020, 30, 798–805. [Google Scholar] [CrossRef]
  60. International Atomic Energy Agency. Quality Assurance Programme for Computed Tomography: Diagnostic and Therapy Applications; IAEA: Vienna, Austria, 2012; ISBN 978-92-0-128910-0. [Google Scholar]
  61. European Commission. Criteria for Acceptability of Medical Radiological Equipment Used in Diagnostic Radiology, Nuclear Medicine and Radiotherapy; Radiation Protection; Publications Office of the European Union: Luxembourg, 2013; ISBN 978-92-79-27747-4. [Google Scholar]
  62. Dance, D.R. (Ed.) Diagnostic Radiology Physics: A Handbook for Teachers and Students; STI/PUB; International Atomic Energy Agency: Vienna, Austria, 2014; ISBN 978-92-0-131010-1. [Google Scholar]
  63. Riederer, S.J.; Pelc, N.J.; Chesler, D.A. The Noise Power Spectrum in Computed X-Ray Tomography. Phys. Med. Biol. 1978, 23, 446–454. [Google Scholar] [CrossRef]
  64. Friedman, S.N.; Fung, G.S.K.; Siewerdsen, J.H.; Tsui, B.M.W. A Simple Approach to Measure Computed Tomography (CT) Modulation Transfer Function (MTF) and Noise-Power Spectrum (NPS) Using the American College of Radiology (ACR) Accreditation Phantom. Med. Phys. 2013, 40, 051907. [Google Scholar] [CrossRef] [Green Version]
  65. Samei, E.; Bakalyar, D.; Boedeker, K.; Brady, S.; Fan, J.; Leng, S.; Myers, K.; Popescu, L.; Ramirez-Giraldo, J.C.; Ranallo, F.; et al. Performance Evaluation of Computed Tomography Systems—The Report of AAPM Task Group 233; AAPM: Alexandria, VA, USA, 2019. [Google Scholar]
  66. The Phantom Laboratory. Catphan ® 504 Manual; The Phantom Laboratory: Salem, NY, USA, 2013. [Google Scholar]
  67. Li, K.; Tang, J.; Chen, G.-H. Statistical Model Based Iterative Reconstruction (MBIR) in Clinical CT Systems: Experimental Assessment of Noise Performance. Med. Phys. 2014, 41, 041906. [Google Scholar] [CrossRef] [Green Version]
  68. Solomon, J.; Samei, E. Quantum Noise Properties of CT Images with Anatomical Textured Backgrounds across Reconstruction Algorithms: FBP and SAFIRE. Med. Phys. 2014, 41, 091908. [Google Scholar] [CrossRef]
  69. Solomon, J.; Wilson, J.; Samei, E. Characteristic Image Quality of a Third Generation Dual-Source MDCT Scanner: Noise, Resolution, and Detectability. Med. Phys. 2015, 42, 4941–4953. [Google Scholar] [CrossRef] [PubMed]
  70. Funama, Y.; Taguchi, K.; Utsunomiya, D.; Oda, S.; Katahira, K.; Tokuyasu, S.; Yamashita, Y. Image Quality Assessment of an Iterative Reconstruction Algorithm Applied to Abdominal CT Imaging. Phys. Med. 2014, 30, 527–534. [Google Scholar] [CrossRef]
  71. Geyer, L.L.; Körner, M.; Harrieder, A.; Mueck, F.G.; Deak, Z.; Wirth, S.; Linsenmaier, U. Dose Reduction in 64-Row Whole-Body CT in Multiple Trauma: An Optimized CT Protocol with Iterative Image Reconstruction on a Gemstone-Based Scintillator. Br. J. Radiol. 2016, 89, 20160003. [Google Scholar] [CrossRef] [Green Version]
  72. Brady, S.L.; Yee, B.S.; Kaufman, R.A. Characterization of Adaptive Statistical Iterative Reconstruction Algorithm for Dose Reduction in CT: A Pediatric Oncology Perspective. Med. Phys. 2012, 39, 5520–5531. [Google Scholar] [CrossRef]
Figure 1. Noise maps (HU) of a CT image of the CTP486 phantom module reconstructed using FBP and ASiR/ASiR-V with different blending levels (20%, 40%, 60%, 80%, and 100%). The corresponding FBP-reconstructed CT image of the phantom is also displayed.
Applsci 11 06561 g001
Figure 2. Noise maps (HU) of a CT image of the CTP404 phantom module reconstructed using FBP and ASiR/ASiR-V with different blending levels (20%, 40%, 60%, 80%, and 100%). The corresponding FBP-reconstructed CT image of the phantom is also displayed.
Applsci 11 06561 g002
Figure 3. CTP486 phantom module. Maps of the percentage difference (%) between noise of the FBP-reconstructed CT image and noise of both ASiR-V-reconstructed and ASiR-reconstructed CT images with different blending levels (20%, 40%, 60%, 80%, and 100%).
Applsci 11 06561 g003
Figure 4. CTP404 phantom module. Maps of the percentage difference (%) between noise of the FBP-reconstructed CT image and noise of both ASiR-V-reconstructed and ASiR-reconstructed CT images with different blending levels (20%, 40%, 60%, 80%, and 100%).
Applsci 11 06561 g004
Figure 5. Nonuniformity index (NUI) values of noise maps of CT reconstructed images (FBP, ASiR-V, and ASiR) of the CTP486 (a) and CTP404 (b) phantom modules. For NUI estimation, only the inner part of the phantom (diameter, 15 cm) was considered.
Applsci 11 06561 g005
Figure 6. CTP486 homogeneous phantom module. Noise reduction properties of ASiR-V and ASiR reconstruction algorithms with respect to conventional FBP, NR(%), estimated as the mean (SD) value of PDN-ASiR-V and PDN-ASiR-V maps within a central circular ROI of 1 cm diameter.
Applsci 11 06561 g006
Figure 7. CTP404 phantom module with different contrast objects (i.e., air, PMP, LDPE, polystyrene, acrylic, Delrin, Teflon). Noise reduction properties of ASiR-V and ASiR reconstruction algorithms with respect to conventional FBP, NR(%), estimated as the mean (SD) value of PDN-ASiR-V and PDN-ASiR-V maps within a central circular ROI of 1 cm diameter placed in each contrast object.
Applsci 11 06561 g007
Figure 8. Histograms of noise maps (bin width of 0.1 HU) for FBP- (a), ASiR- (b), and ASiR-V-reconstructed (c) CT images of the homogenous CTP486 module with different blending levels of reconstruction (20%, 40%, 60%, 80%, and 100%).
Applsci 11 06561 g008
Table 1. Nominal CT numbers of the Catphan-CTP404 contrast objects [66].
MaterialCT Numbers (HU)
Air−1046: −986
PMP a−220: −172
LDPE b−121: −87
Polystyrene−65: −29
Acrylic92: 137
Delrin344: 387
Teflon941: 1060
a Polymethylpentene, b low-density polyethylene.
Table 2. Homogeneous CTP486 module. Noise level estimated as the mean (SD) value of N-FBP, N-ASiR, and N-ASiR-V maps within a central circular ROI of 1 cm diameter.
Blending LevelFBPASiRASiR-V
0%9.5 (1.3)
20% 7.9 (1.1)8.0 (1.2)
40% 6.9 (1.0)6.5 (1.0)
60% 5.8 (0.8)5.4 (0.8)
80% 4.9 (0.7)4.4 (0.6)
100% 4.5 (0.7)3.4 (0.5)
Table 3. CTP404 phantom module with different contrast objects (i.e., air, PMP, LDPE, polystyrene, acrylic, Delrin, Teflon). Summary noise level of each contrast object estimated as the mean (SD) value of N-FBP, N-ASiR, and N-ASiR-V maps within a central circular ROI of 1 cm diameter.
AirPMPLDPEPolystyreneAcrylicDelrinTeflon
FBP 9.0 (1.0)9.7 (1.1)9.8 (1.1)9.6 (1.0)9.7 (1.2)10.4 (1.1)11.3 (1.3)
ASiR20%8.1 (0.9)8.6 (0.9)8.6 (0.9)8.4 (0.9)8.5 (1.0)9.2 (0.9)10.2 (1.2)
40%7.3 (0.8)7.5 (0.8)7.6 (0.8)7.4 (0.8)7.5 (0.9)8.1 (0.8)9.4 (1.1)
60%6.6 (0.8)6.5 (0.7)6.5 (0.7)6.4 (0.7)6.4 (0.8)7.0 (0.7)8.5 (1.1)
80%5.8 (0.7)5.5 (0.7)5.6 (0.6)5.4 (0.6)5.5 (0.6)6.0 (0.6)7.7 (1.0)
100%5.4 (0.7)5.1 (0.7)5.0 (0.6)4.9 (0.6)5.0 (0.7)5.5 (0.7)7.3 (1.0)
ASiR-V20%8.4 (0.9)8.5 (0.9)8.6 (0.9)8.5 (0.9)8.5 (1.0)9.1 (0.9)10.5 (1.2)
40%7.7 (0.9)7.4 (0.8)7.4 (0.8)7.3 (0.8)7.4 (0.9)7.9 (0.8)9.7 (1.2)
60%7.1 (0.9)6.3 (0.7)6.3 (0.7)6.2 (0.7)6.2 (0.7)6.7 (0.7)9.0 (1.2)
80%6.5 (0.9)5.3 (0.6)5.2 (0.6)5.2 (0.6)5.1 (0.6)5.6 (0.6)8.3 (1.2)
100%6.0 (1.0)4.3 (0.5)4.2 (0.5)4.2 (0.5)4.1 (0.5)4.6 (0.5)7.7 (1.3)
Table 4. Descriptive metrics of noise map histograms for FBP-, ASiR-, and ASiR-V-reconstructed CT images of the homogenous CTP486 module with different blending levels of reconstruction (20%, 40%, 60%, 80%, and 100%). Median and interquartile range values are expressed as HU; kurtosis and skewness values are unitless.
MedianInterquartile RangeKurtosisSkewness
FBP 9.161.623.000.23
ASiR20%7.811.393.070.27
40%6.861.173.100.26
60%5.880.993.130.25
80%5.000.833.140.22
100%4.510.803.570.41
ASiR-V20%7.911.373.030.24
40%6.571.153.100.27
60%5.510.923.110.25
80%4.520.743.140.23
100%3.600.573.350.24
Publisher’s Note: MDPI stays neutral with regard to jurisdictional claims in published maps and institutional affiliations.

