Abstract
This paper aims to critically review the current body of literature relating to the calculation methods of construction material stock. To this end, this study adopts a systematic literature review technique in order to identify the relevant studies. The findings revealed that the bottom-up and top-down methodologies were commonly employed by the reviewed studies. Based on the findings, it is recommended that the bottom-up approach should be utilized when dealing with small-scale areas or where more accurate results are required. The top-down method should be used wherein the research area is large, and the results could be estimated based upon assumptions and statistical data. Similarly, the demand-driven methodology should be used to find the material stock accumulation due to socio-economic factors. The study also found that the material stock results can be used as data for other research, such as waste management and embodied energy. Further, this paper proposes a conceptual framework to ease the process of calculating construction material stocks in different projects. The outcomes of this research shall be beneficial for future studies that explore the literature connected to the construction material stock and recommend methods and techniques that should be used to quantify the material stock.
1. Introduction
The increasing trend of global energy consumption has caused several serious environmental issues including climate change, global warming, and the depletion of natural resources [1]. In this regard, the construction industry plays a significant role in consuming more than 40% of the global energy and emitting nearly 40% of greenhouse gases (GHGs) worldwide [1]. The construction industry also contributes to environmental deterioration by generating a considerable amount of waste. Construction materials are one of the largest flows incoming into urban contexts after water [1], causing many environmental issues during the entire processes of mining, manufacturing, transportation, and end of life [2]. The expel of these materials, mostly non-renewable materials into the urban areas, has increased sharply since the mid-20th century due to the sprawl of cities. Considering the impending increase in the world’s population, the construction industry is expected to contribute even more to exacerbating the environment due to booming demands for services.
Materials are extracted from the earth to fulfill the demands driven by economic growth. While the proportion of these materials is consumed immediately, such as fossil fuel, others remain in use for a much longer period. Examples of the latter are metallic and non-metallic materials. The process of flowing materials into and out of an economy is called material stock [3]. Over the recent decades, urban areas have witnessed inflows and outflows of construction materials due to the surge of developing infrastructures and buildings as well as for demolitions and refurbishments that drain away materials from the urban context. The estimation of construction material flows can help to foster the concept of environmental sustainability within an urban context since it allows the reuse of construction materials as a source of raw materials for new constructions [4]. The approach for the calculation of construction material stock can be expressed using Equation (1). Domestic extraction refers to when the construction material is sourced within the study area and correction factors refer to the adjustments made due to statistical and calculation errors. The process of calculating the values required for each input involves certain complexities such as the availability of data, employment of adequate techniques, and assumptions [5,6]. Hence, there has been an increase in research articles developed to streamline the process of calculating construction material stock using different methodologies [7,8,9]. In a recent study, Augiseau and Barles [2] performed comprehensive research, analyzing 31 publication materials pertaining to construction material flows and stock. The findings showed that the material stock is an ongoing process and non-metallic resources would be insufficient to meet the future demand. Despite the promising results, Augiseau and Barles [2] failed to expound on the details of the methodological approaches adopted by the analyzed studies. The development of a detailed understanding of the methods being employed from existing studies can potentially pave the way toward the enhancement of sustainability in the built environment by providing a clear knowledge about the current methods for estimation of construction material stock, as well as their applicability.
Notwithstanding the increasing number of research, the methodologies have been applied differently. No research has been done to provide an in-depth analysis of the different methods and how material stock could be used as data to research further. The current body of literature attributing to the calculation methods of construction material stock is deemed to be fairly fragmented. Correspondingly, this paper aims to provide a state-of-art review of the methodological approaches utilized by the current body of literature to calculate construction material stock. The outcome of this paper is beneficial for the body of knowledge as it combines fragmented knowledge. Also, the paper is beneficial for the researchers as it would help to select an appropriate method for the research. The remainder of this paper unfolds as follows: Section 2 provides details on the research methodology, Section 3 offer descriptive and content analyses of the selected articles for examination. Section 4 discusses the findings of the review and puts forward a conceptual framework to facilitate calculation of the material stocks in construction, prior to the conclusion given in Section 5.
2. Materials and Methods
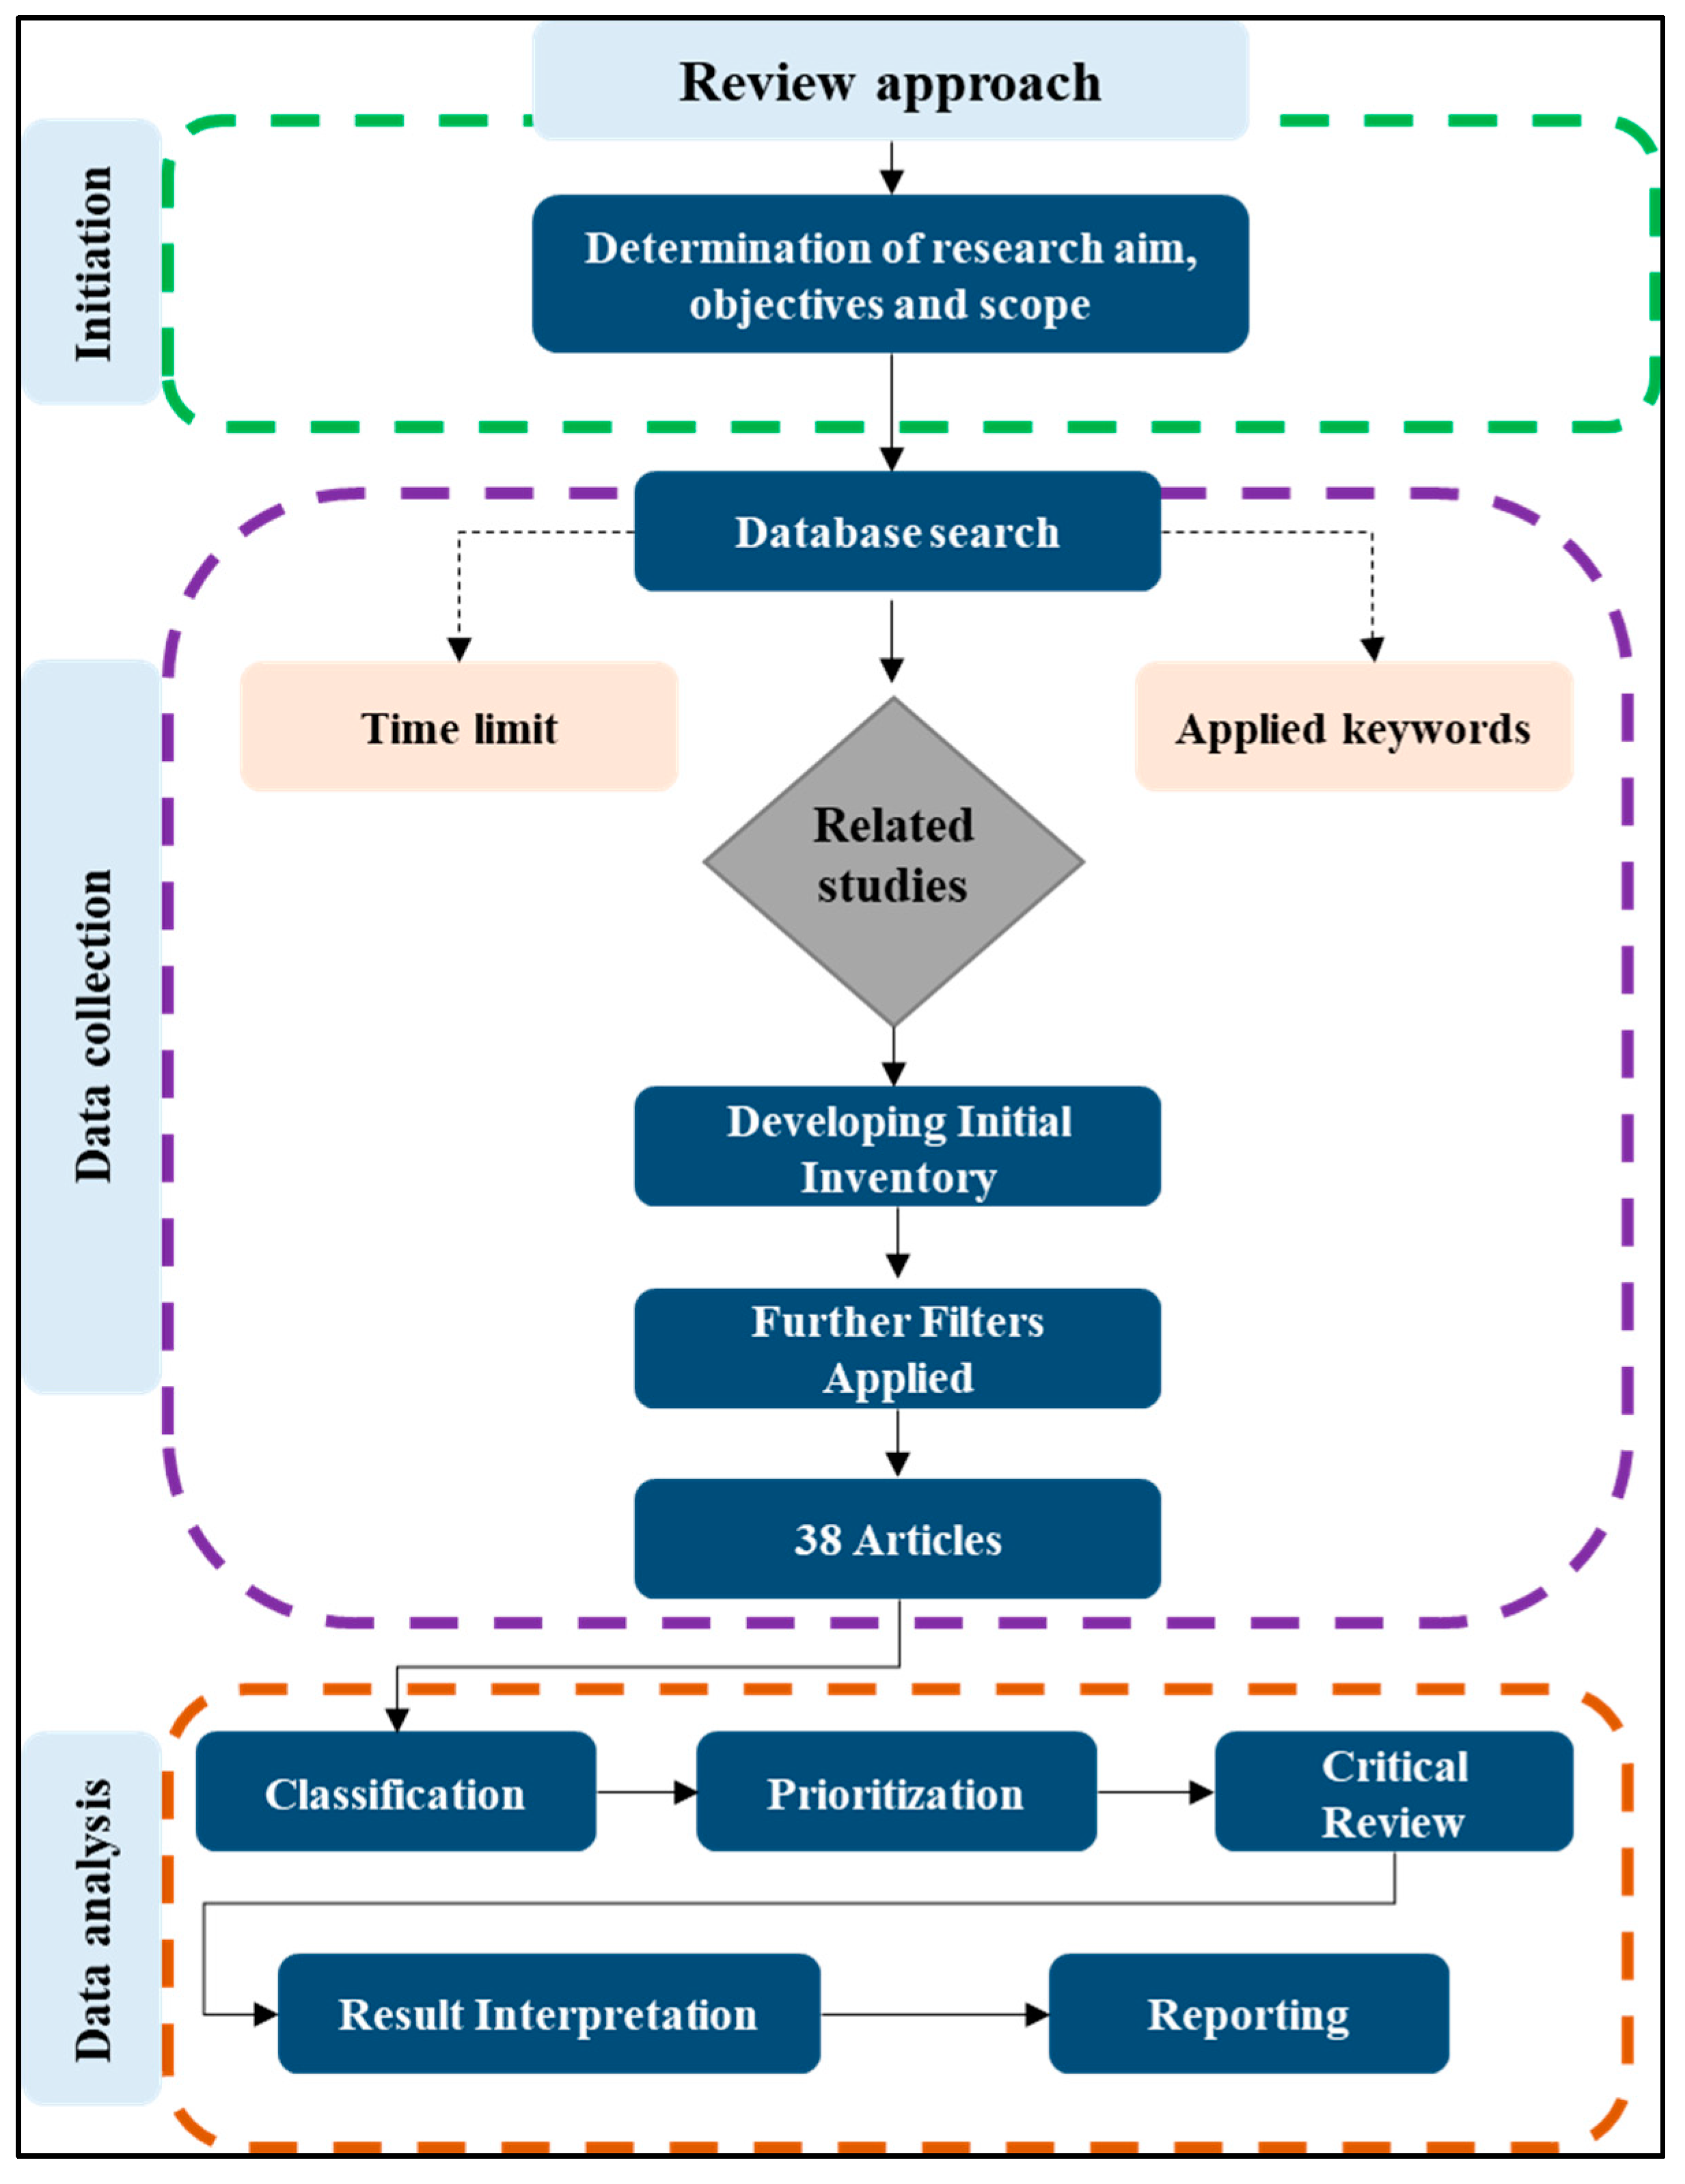
The overall methodological approach of this research is illustrated in Figure 1. This paper adopts a systemic research approach to identify publication materials related to the methods applied to calculate material stock in the construction industry. A comprehensive searching exercise was carried out through Web of Science and Google Scholar upon determining the research aim and objectives. Using several databases ensures that the weakness of one database is compensated by the strength of the other, ensuring that the searching exercise is conducted comprehensively [10]. The use of these databases allows researchers to obtain access to a host of international articles, enabling them to systematically search through the platforms by applying different filters [11]. The initial search was performed using the keywords “material stock” in conjunction with the “construction”, “Buildings”, “Roads”, “Infrastructure”, “non-metallic minerals”, “stock and flow accounting methodology”, “dynamic stocks and flows modeling”, “material flow analysis”, “resource efficiency”, “built environment”, “construction industry”, and “mass flow” by applying the AND combination for each set. The searched materials were limited to only “articles” and “review paper”, while the time span was set between 2000 and 2019. As a result, 47 articles that met the initial searching criteria were identified.
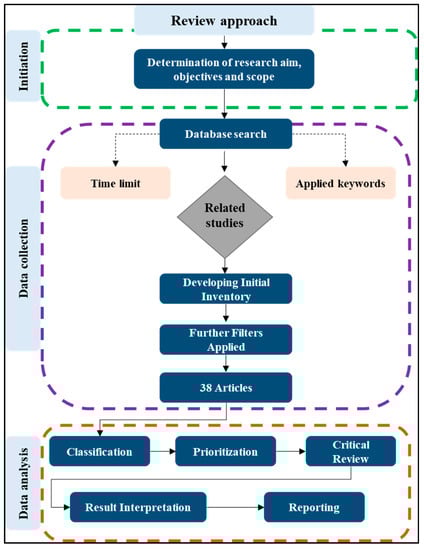
Figure 1.
Research approach.
Upon building up the initial inventory, the retrieved materials were screened by scrutinizing their respected titles, abstracts, and conclusions in order to weed out those falling out of the research scope. In this regard, publications that were written in any language other than English were excluded, as well as the articles that were deemed to be non-peer- reviewed. The consideration of these criteria led to reducing the number of collected publications to 38 articles. Subsequently, the identified materials were qualitatively analyzed, and the archived results were reported.
In the next step, critical data was extracted from the articles with the help of the review form. The review form had the information about the article title, journal, published year, methodology, research approach, data sources, findings, and limitations. It ensured that differences in the articles studied could be analyzed. The data analyzed was presented through descriptive and content analysis. The descriptive analysis aims to illustrate the article’s published date, the journal in which they were published, and the country of the research area. Subsequently, the content analysis provides an overview of the methodology used, the scale of the research area, and the type of project selected for material stock analysis. Afterward, the content analysis further explains in detail the articles reviewed by explaining the articles reviewed.
3. Results
3.1. Descriptive Analysis
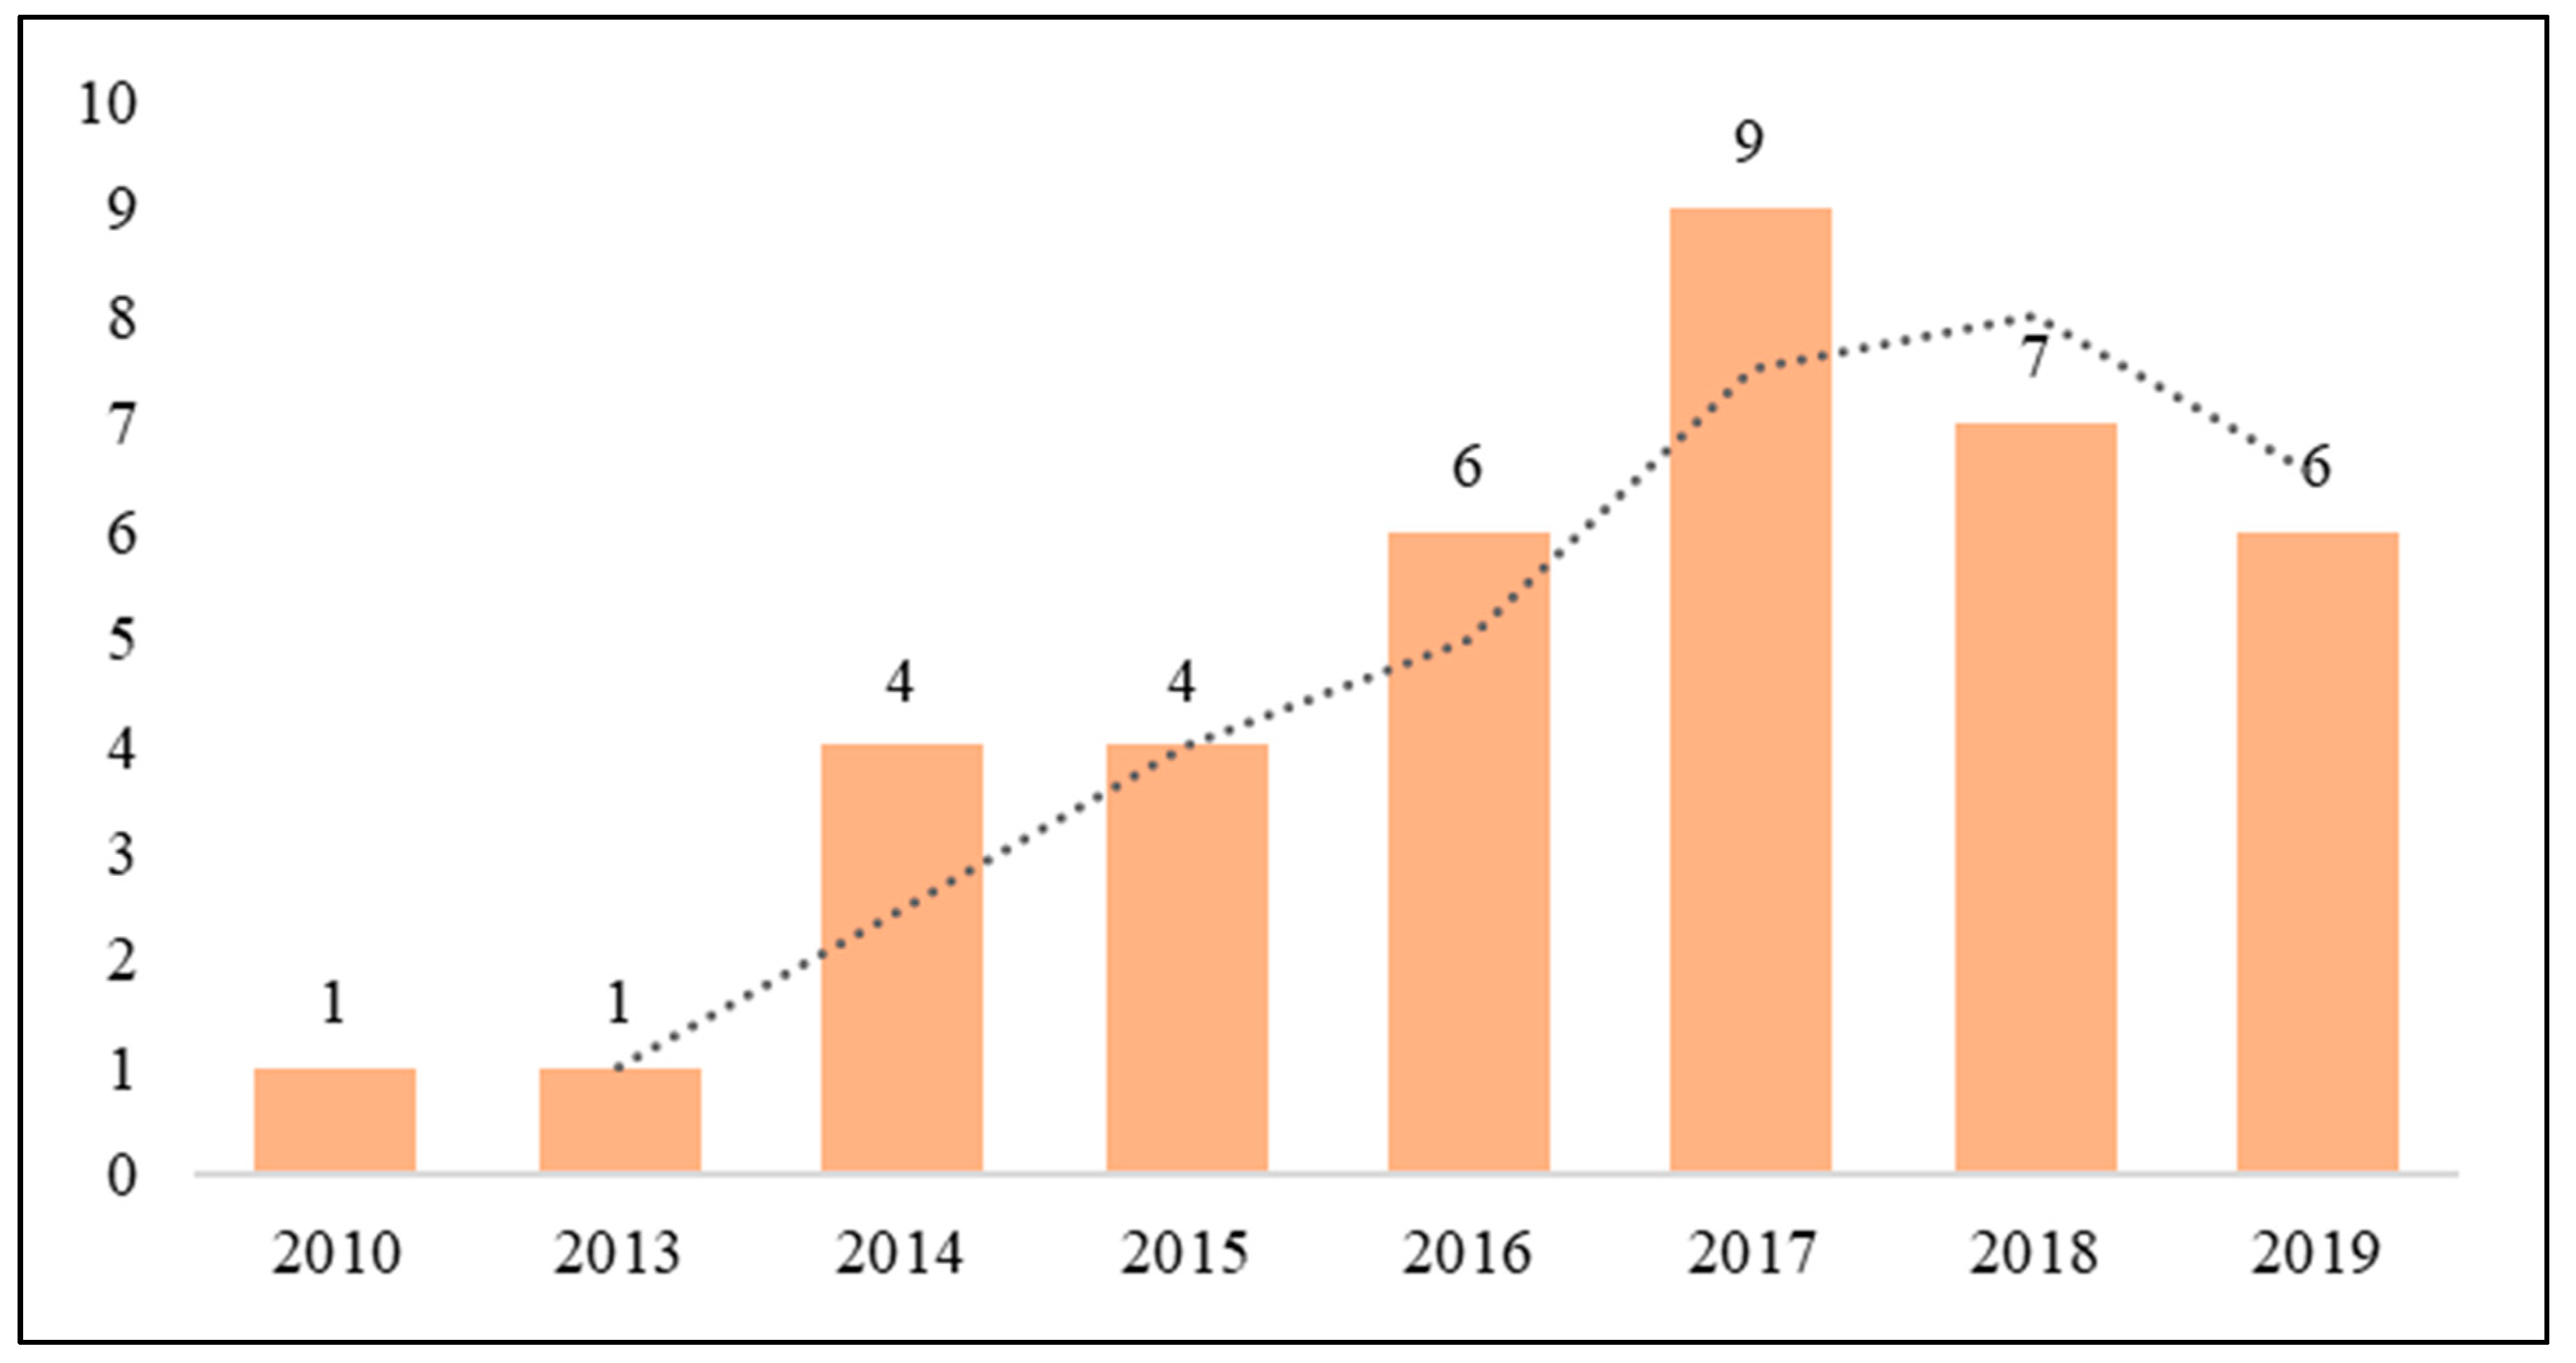
This section aims to provide a descriptive analysis of the identified articles. To this end, the studies are analyzed with respect to the number of articles published per year, the publishing journals, and the country that was subject to the research. Figure 2 illustrates the number of articles published each year. As shown, the number of articles began to rise after 2014, and it continued until 2017. This indicates the increasing attention being paid to this topic in the built environment, which can be attributed to the increasing demand for developing innovative ways to measure the material stock. After 2017 the number of articles started to decrease.

Figure 2.
Number of articles published per year.
Figure 3 represents the number of papers published in different journals. Most of the articles are published in journals with the scope related to construction waste management, namely “Journal of Industrial Ecology” and “Resource, Conservation, and Recycling”, “Journal of Cleaner Production” and “Building Research & Information”. It can also be seen that the majority of journals are in the first quartile (i.e., Q1), indicating the high publishability of the topic.
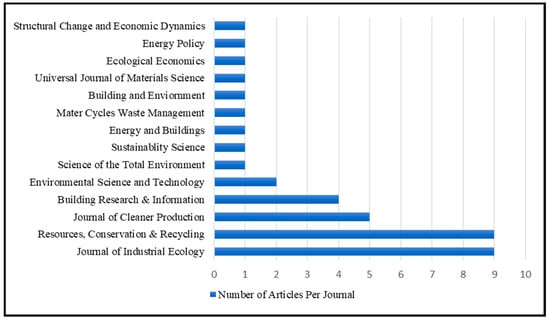
Figure 3.
Number of articles published in the journal.
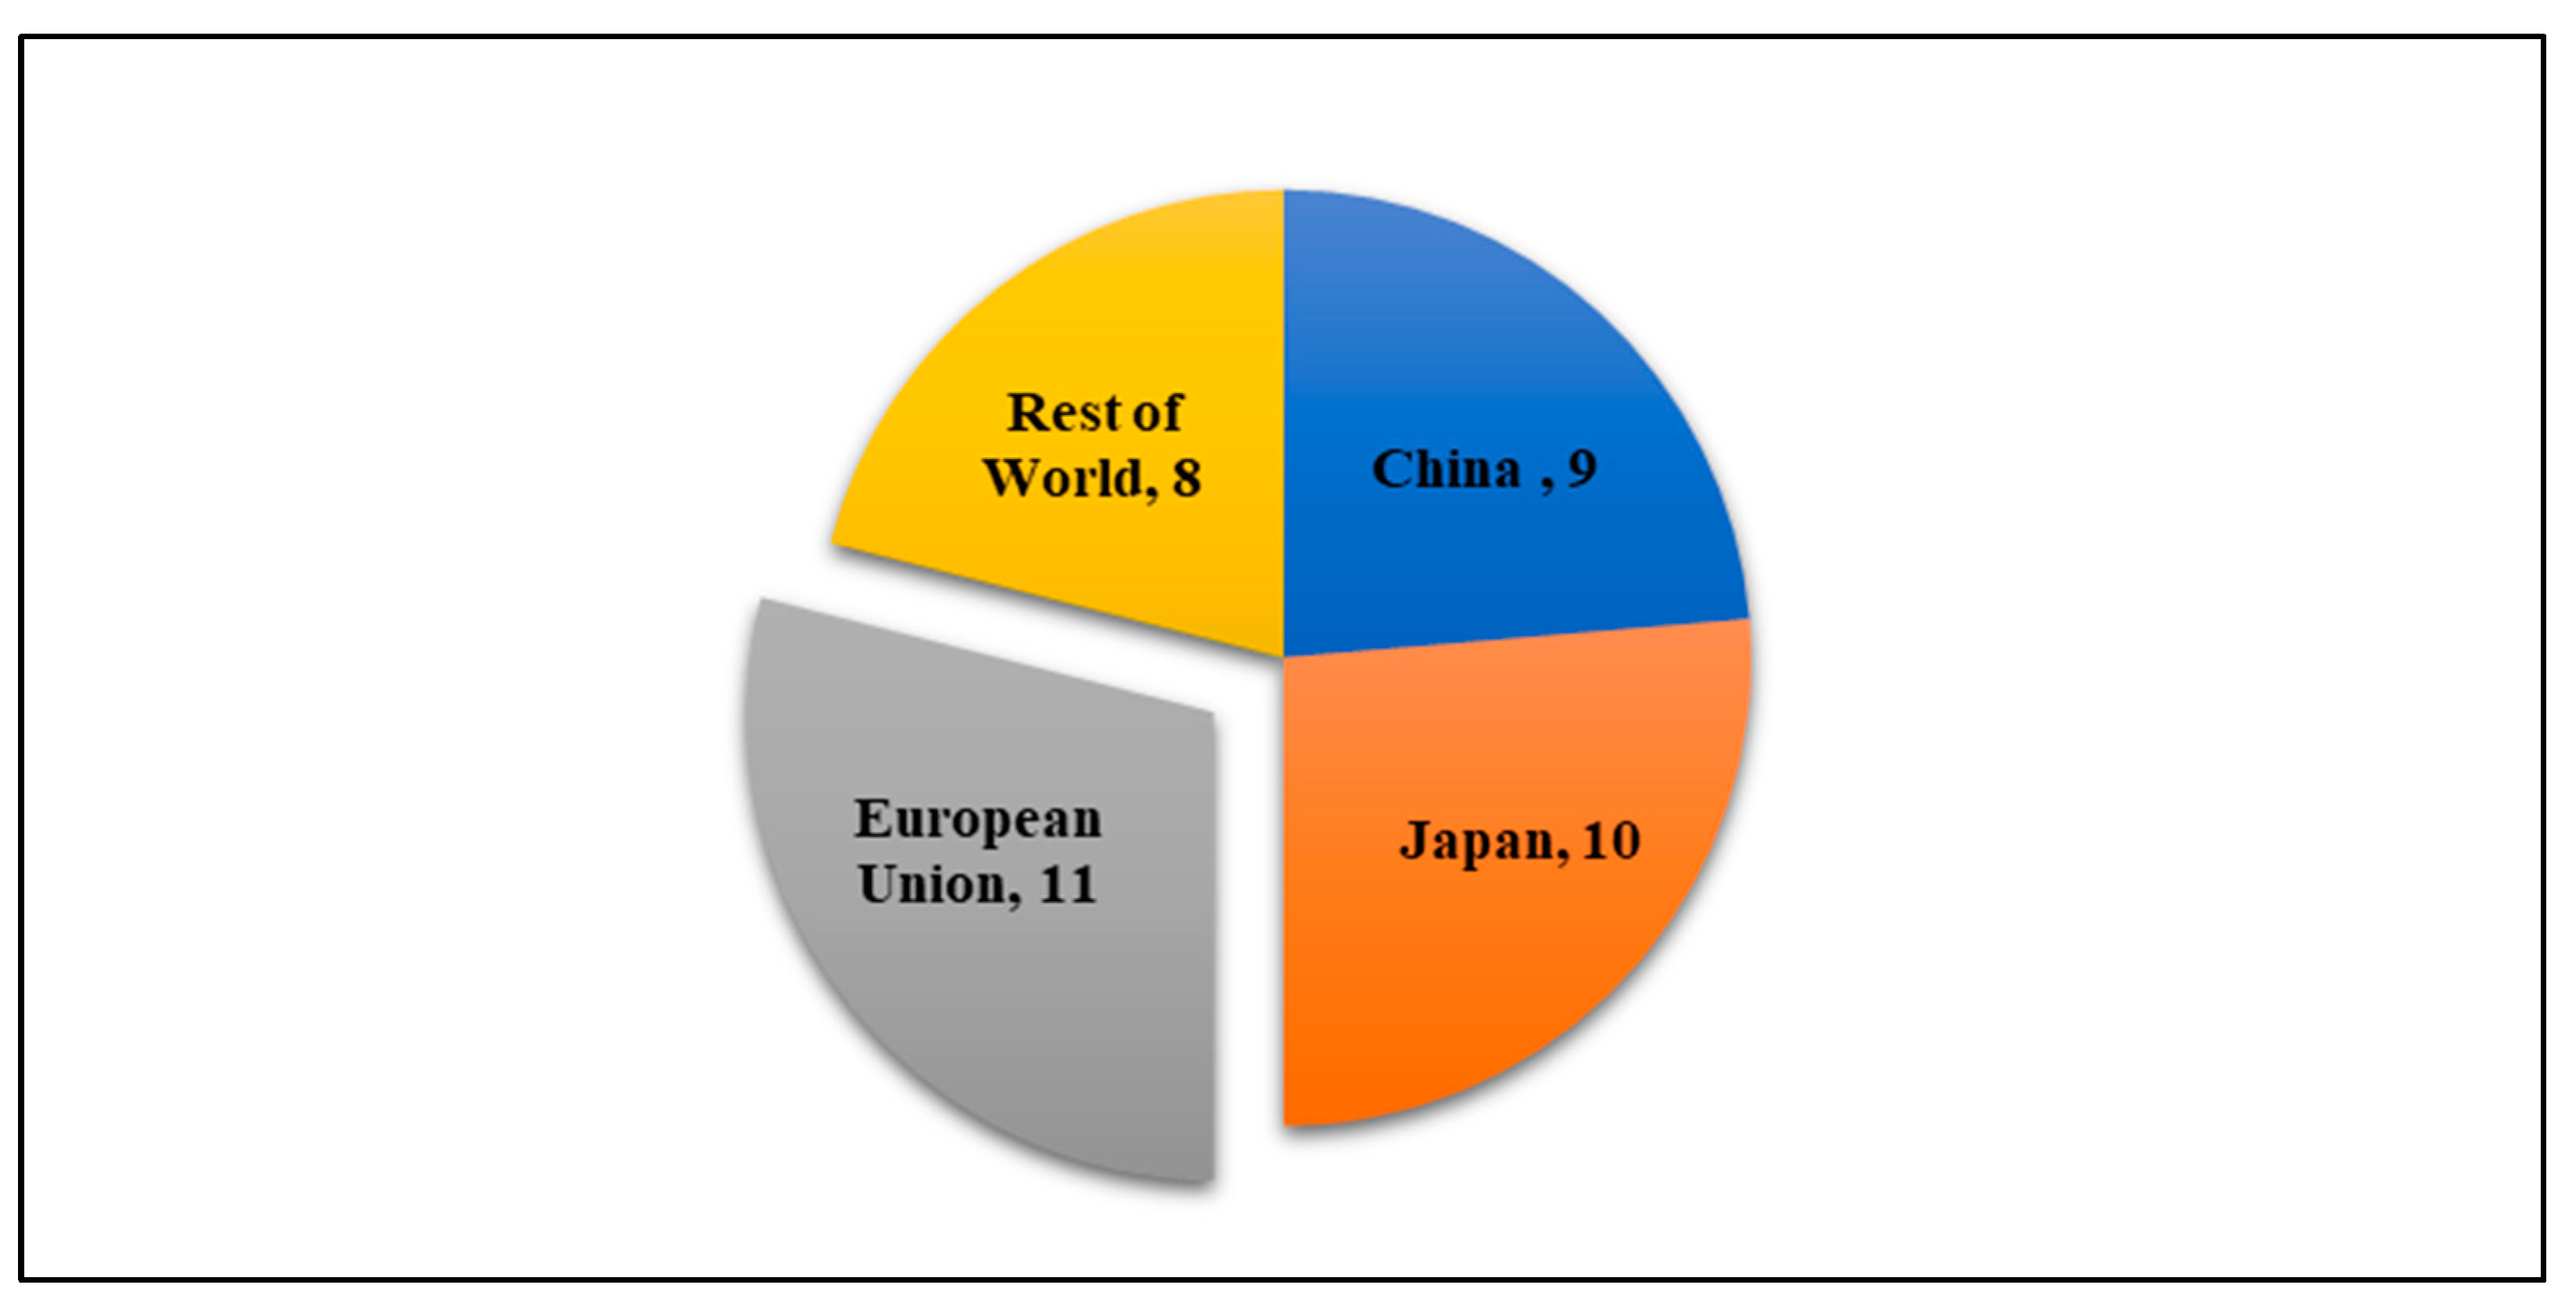
Figure 4 illustrates the distribution of the countries subjected to research. As indicated, the majority of the studies are carried out in the European Union (EU) countries (i.e., 11). It is also shown that Japanese and Chinese researchers are the second and third in publishing articles related to the calculation of material sock in the construction industry, respectively. Researchers from other countries have also published 8 articles collectively in this area between 2000 and 2021.

Figure 4.
Percentage of articles published for the country.
3.2. Content Analysis
Content analysis has been extensively used in qualitative research. There are three types of qualitative content analysis, namely conventional (to describe the phenomena), directed (when the research is incomplete or would benefit from further research), and summative (Identifying or quantifying certain words in the text) content analysis [12]. This research is a directed content analysis as it studies the fragmented knowledge of the construction material stock, which would benefit from further research. This research follows the process mentioned by Elo and Kyngas [13]. It follows both inductive (when the existing knowledge is fragmented) and the deductive (when the structure of the paper is based upon previous research) approach.
This section aims to provide an in-depth analysis of the identified studies with regard to the methods employed to calculate the material stock, the material stock dynamics involved, and related research from the material stock. Table 1 provides an overview of the analyzed studies.

Table 1.
Summary of the analyzed studies.
3.2.1. An Overview of the Analysed Studies
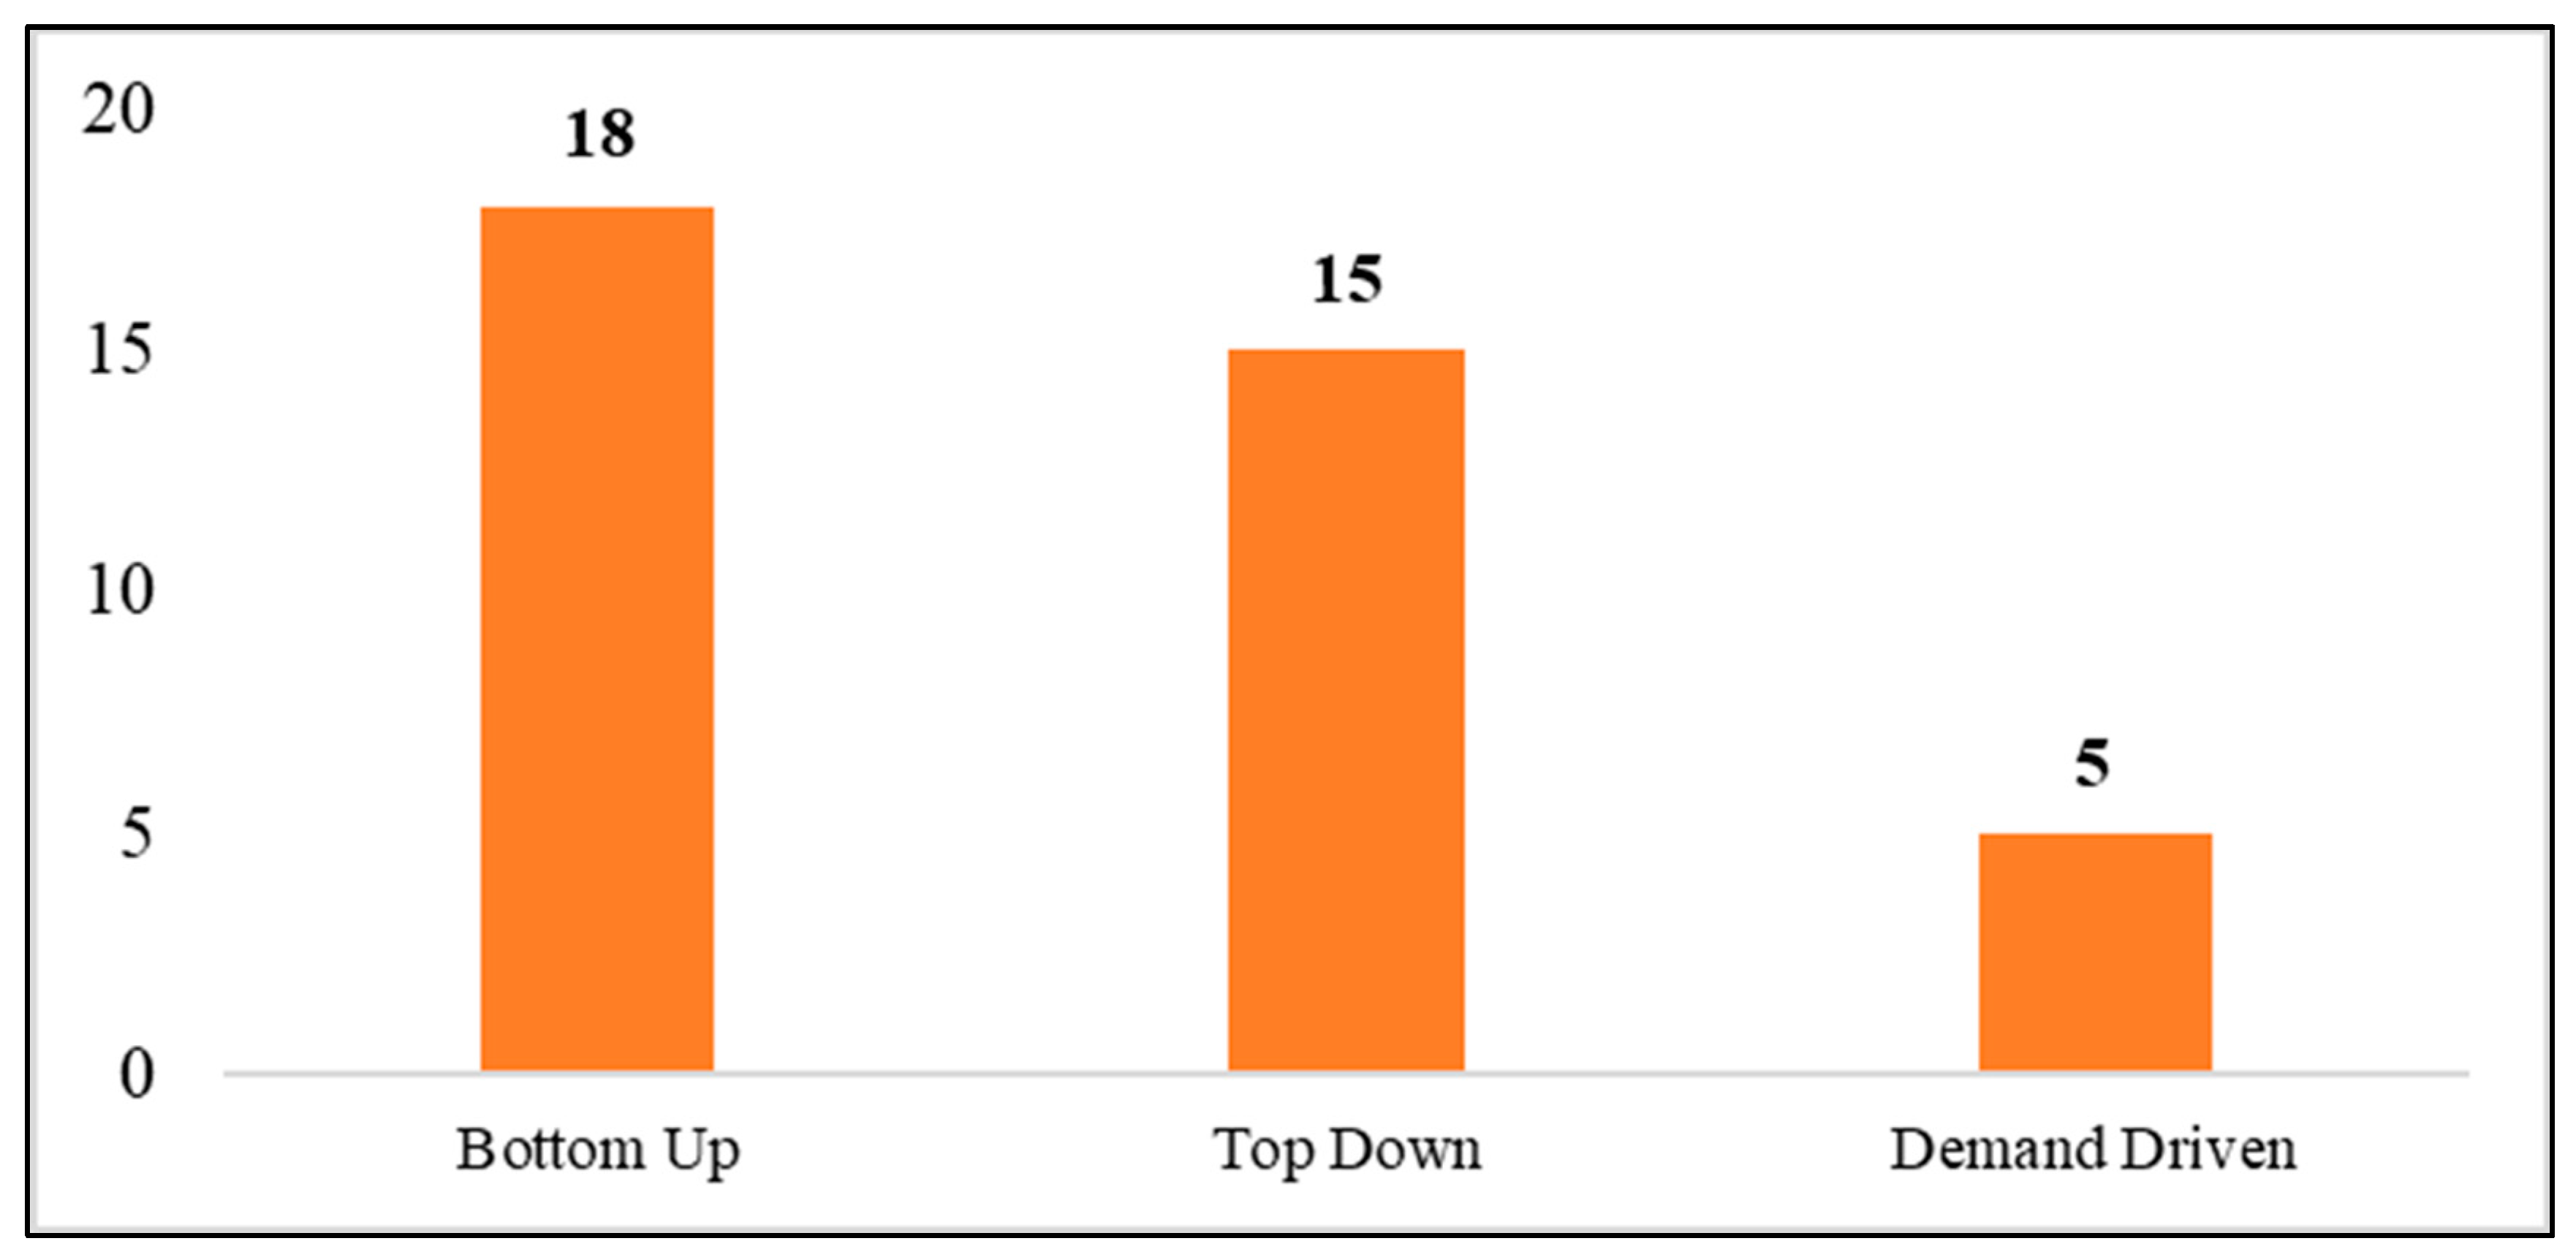
This review identifies three calculation methods utilized by the studies reviewed for estimation of construction material stock, namely bottom-up, top-down, and demand-driven. Figure 5 shows the type of methods used to estimate the material stock. As shown, the bottom-up methodology has been used more in the studies reviewed compared to top-down and demand-driven methods.

Figure 5.
Methodology used by analyzed studies.
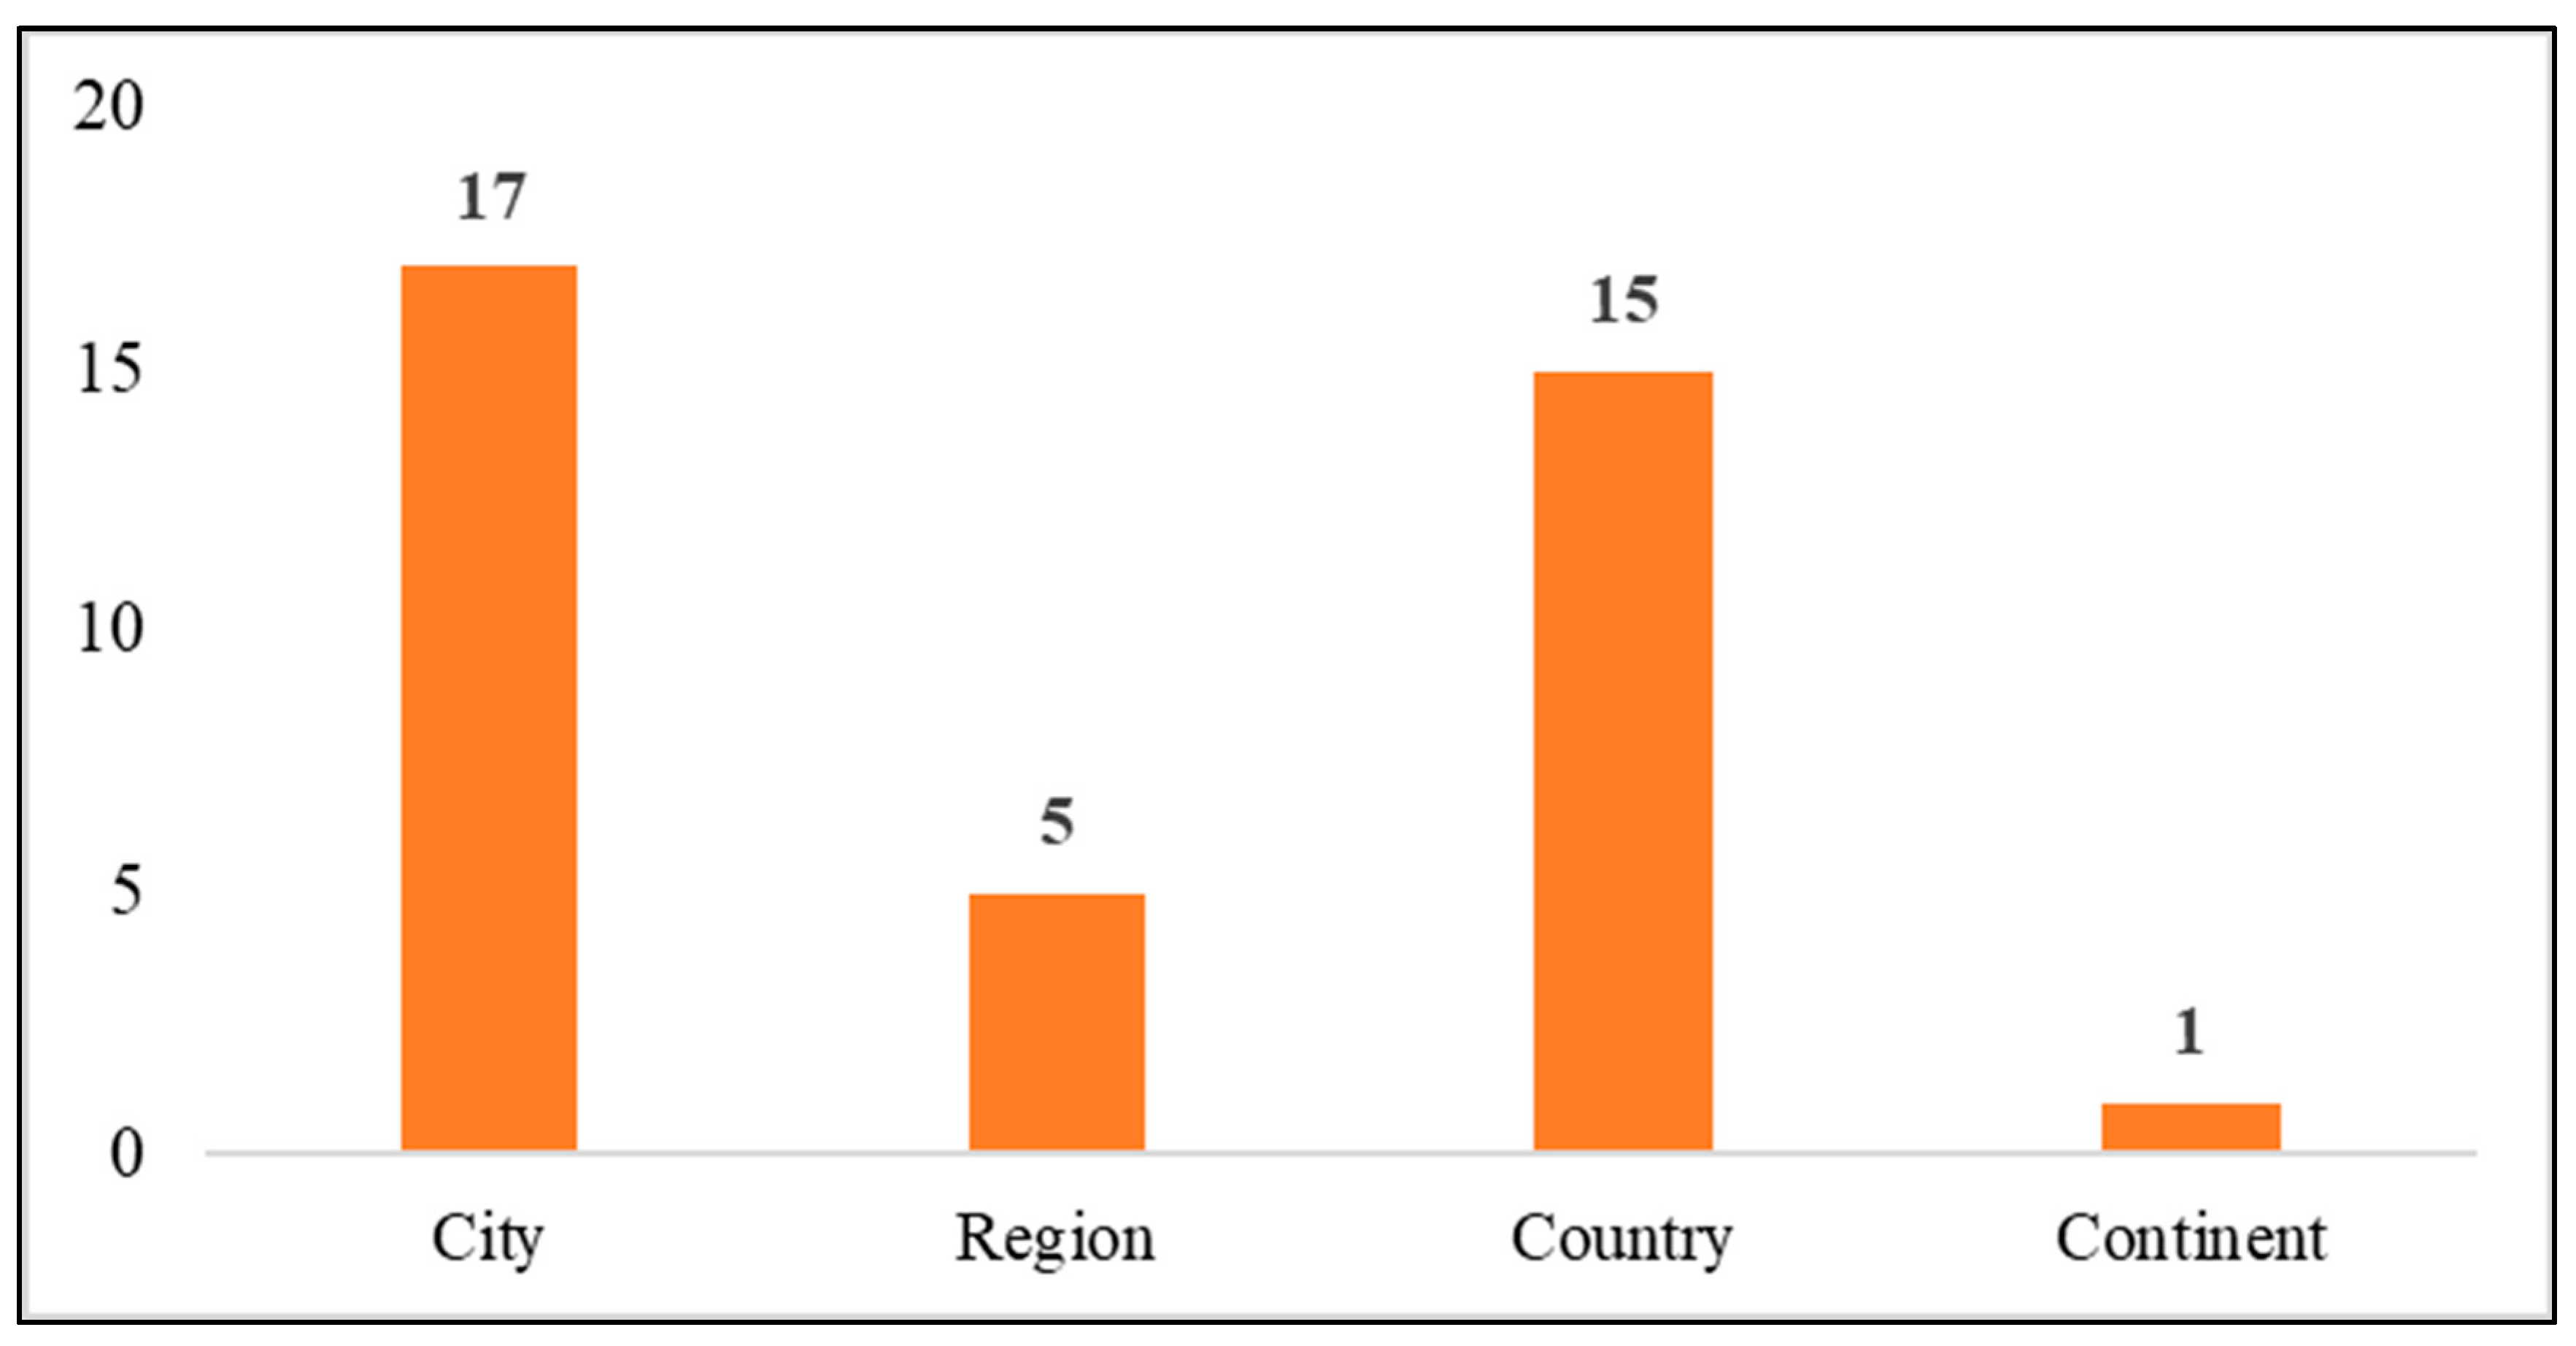
Figure 6 shows the scale of the study area researched by the articles. The city level is the smallest study area, while the regional level is a part of the country. The figure shows that most of the studies considered performing material stock calculations at the city and country levels. The investigation of material stocks at regional and continental levels has been done less frequently, highlighting the potential topics for future research.

Figure 6.
Scale of the study area researched.
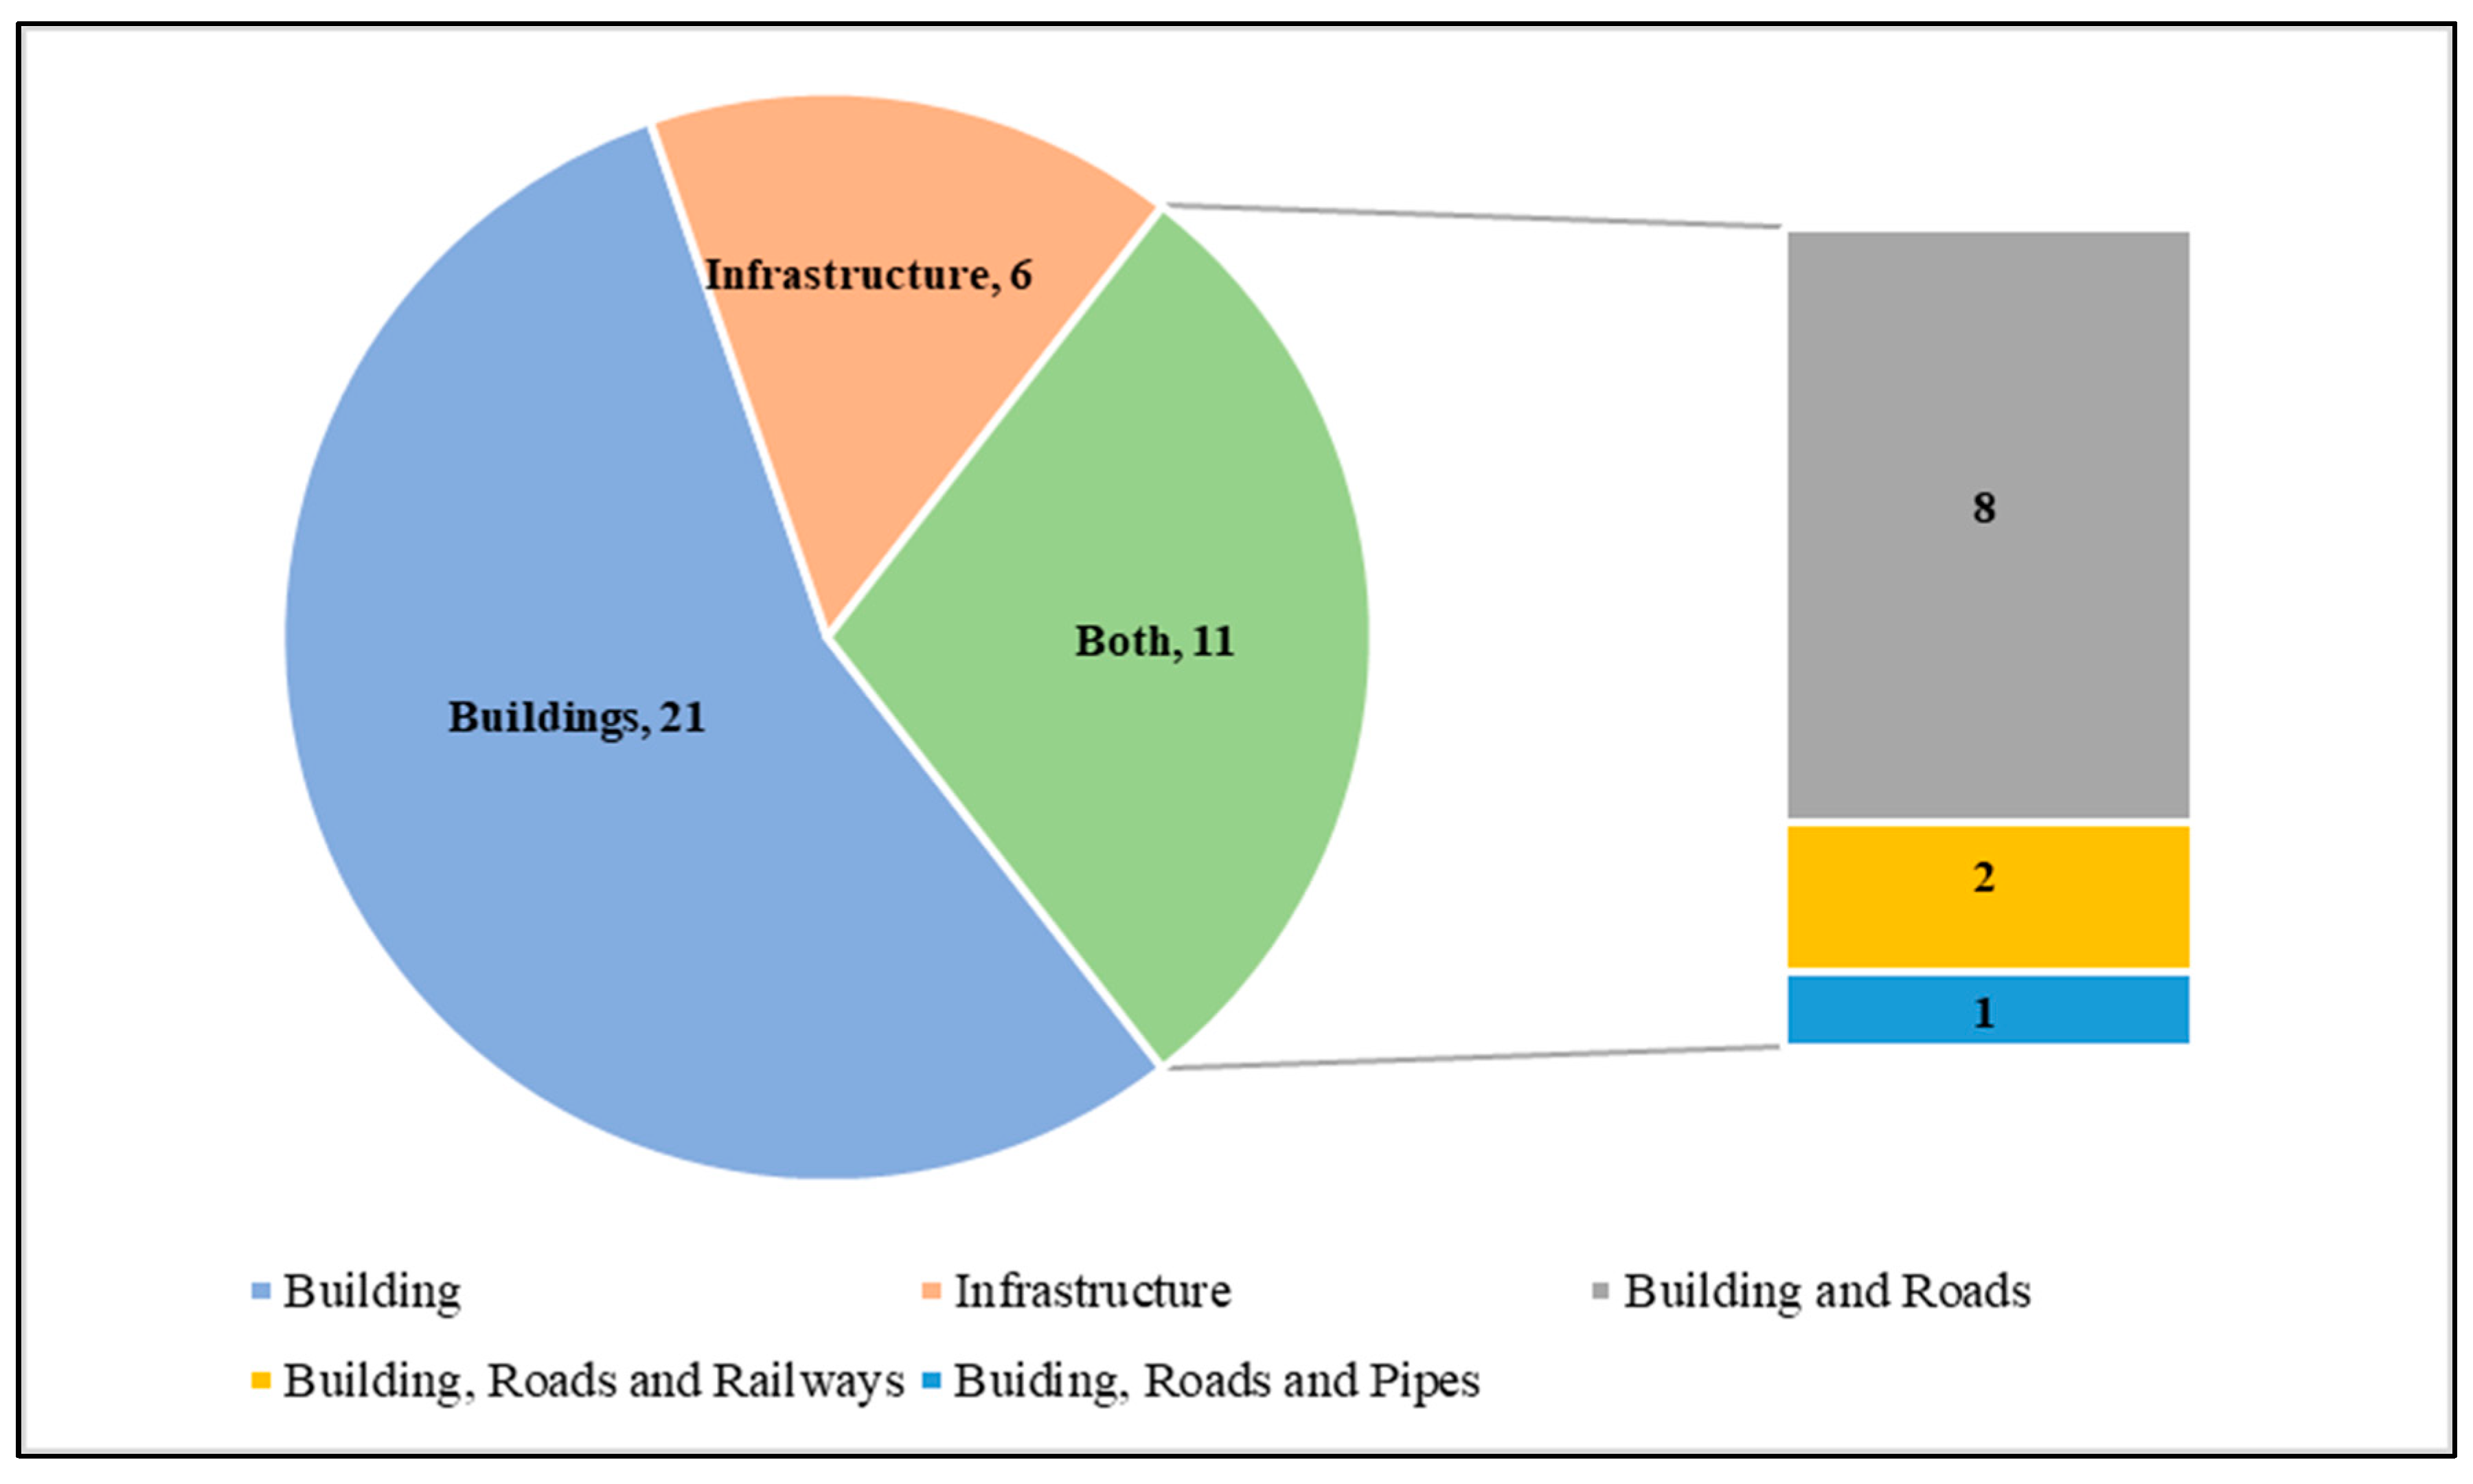
From the review, it is found that the aforementioned methods are employed to evaluate the material stock in two types of projects, namely buildings and infrastructure projects (Figure 7). The building includes both residential and non-residential buildings, similarly, the infrastructure includes roads, pipes, and railway infrastructure. As illustrated, these methods are commonly used for the estimation of material stock in buildings rather than infrastructure projects. It is also revealed that the reviewed studies estimated material stocks associated with both metallic and non-metallic materials. Metallic materials refer to inorganic substances that are morphed via combining metallic elements such as iron, titanium, aluminum, and gold. Steel, aluminum alloys, magnesium alloys, copper alloys, titanium alloys, and carbon steel are examples of metallic materials. Contrarily, non-metallic materials are organic substances that are structurally brittle such as concrete, glass, wood etc. The differences in estimating metallic and non-metallic materials are attributed to gathering data, the study area’s size, the assumption made, and the procedures adopted in applying these methods [2]. Regarding infrastructure projects, five articles assessed materials stocks of road projects only. Eleven studies used a much comprehensive approach investigating the materials stock for both building and infrastructure projects. The use of such a holistic approach may potentially increase the accuracy of the estimation of material stocks; however, it can be highly data intensive. The findings of this study also noted a lack of study in calculating material stock of other types of infrastructure projects, e.g., boundary walls.
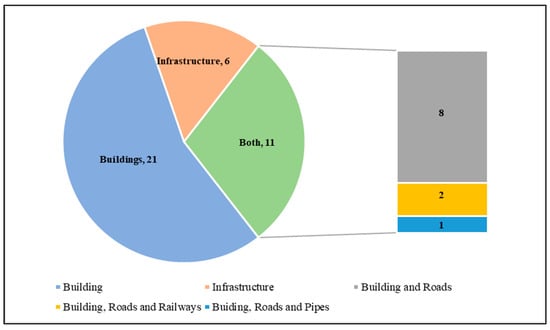
Figure 7.
Type of Project studied for material stock.
3.2.2. Material Stock Calculation Methods
The review shows that three methods, namely bottom-up, top-down, and demand-driven methods, were commonly applied by the studies analyzed in order to calculate material stock. The following sections further elaborate on each identified method.
Bottom-Up Methodology
The bottom-up methodology is used where extensive details of the project are available [7]. This method has been primarily used where the region is small and greater accuracy is required [7]. The bottom-up method has been used differently in different studies. The summary of different techniques used to find the material stock using the bottom-up methodology is shown in Table 2.
Table 2.
Methodology for bottom-up calculation.
This review realized that more studies employed the bottom-up method to estimate construction material stock. For example, Stephan and Athanassiadis [17] aimed to spatially quantify the material stock and their embodied environmental requirements of the City of Melbourne. The study modeled each building on expert opinion based on land use, height, and age to find its bill of quantities. The embodied energy, water, and greenhouse gas emissions were calculated using a comprehensive hybrid analysis technique. The results showed that rebuilding Melbourne would require 904 kt of material per km2, 10 PJ/km2, 17.7 million m3 of embodied water/km2, and would emit 605 ktCO2e/km2. In another study, Surahman et al. [8] evaluated the current building material stock and future demolition waste for buildings in Jakarta and Bandung, focusing primarily on unplanned houses. The paper further aimed to find the embodied energy and CO2 emission. The study used the actual on-site measurement of 297 houses in Jakarta and 247 houses in Bandung to estimate the material inventory and used the input-output analysis method to find CO2 emission. The result showed a material intensity of 2.67 ton/m2 in Jakarta and 2.54 ton/m2 in Bandung. Based upon the reuse and reduce rates, the waste material was found between 2.1–123.9 million tonnes, embodied energy between 192.1–247.8 Peta Joule, and CO2 emissions from 19.2–24.3 million tons. The approach of measuring on-site was a difficult task, as only some buildings could be investigated. However, since the design of the slums is similar, so the approach of sampling would have less sample errors. The actual measurement approach is the most accurate one because there could be discrepancies in the design and actual construction.
In another study, Ortlepp et al. [26] estimated the material stock and flows for domestic buildings in Germany. The study categorized residential buildings into different categories based upon the type of construction and the year constructed. Thereafter, the total material stocks were estimated using the material intensity of each building type. It was shown that there were 8.5 million tons of inflow and 3.0 million tons of outflow between 1991 and 2010. Contrarily, Arora et al. [19] attempted to calculate the material stock and flows of buildings using the bottom-up approach at the component level, not the material level in Singapore. The calculation of the components and material ratio in a building was done based on the historical data and designs. Results showed that the city had 125.7 million tons of non-metallic minerals, 6.52 million tons of steel, 6.45 million windows, 8.61 million doors, 1.97 million toilet accessories, 15.33 million lighting fixtures, 0.99 million kitchen accessories, and 52.54 million m2 of tiles. The per capita material stock was 27.4 tons of non-metallic minerals and 1.4 tons of steel. The average inflow had been 1.94 million tons of concrete and 0.1 million tons of steel, while outflow was 0.31 million tons of concrete and 0.02 million tons of steel. The material stock’s component level could be used to estimate the waste reuse as it would be more accurate than the material level.
GIS had been extensively utilized in estimating the construction material stock. For instance, Tanikawa and Hashimoto [37] endeavored to estimate the spatial distribution of construction materials in two regions, namely an approximately 8 km2 urban area of Salford in Manchester, UK, and an 11 km2 of Wakayama City center, Japan. They attempted to assess the demolition curve of buildings based on characteristics of an area and clarify material accumulation from the viewpoint of recyclability. To this end, they applied four-dimensional Geographical Information Systems (4d-GIS) data at an urban scale. The results showed that the buildings’ lifespans for the two selected regions were less than the average national. In addition, it was found that 47% of total construction material was stocked in underground infrastructure in the Wakayama City center. The existing data of the region has also been used to make a model on GIS. For example, Stephan and Athanassiadis [30] proposed a framework to quantify and spatialize the future material replacement stock for the City of Melbourne from 2018 to 2030. By using the dynamic, stock-driven approach on the area, height, and age of each building in Melbourne gathered through the City of Melbourne database. The model of each building was made on GIS, and then the total material stock was estimated using the average material intensity. The results indicated that the plasterboard, carpet, timber, and ceramic have the highest replacement values. Overall replacing the nonstructural elements may lead to a significant flow of 26 kiloton/annum, 36 kg per capita annum, or 721 ton/km2. The future material stock requirement was also analyzed by Hong et al. [23]. The study aimed to find the growth, retirement, and retrofit of China’s residential and commercial building space between 2010 and 2050 using the scenario analysis approach. The results showed that China’s building space would increase from 47.7 billion m2 in 2012 to 90.7 billion m2 by 2050, with 805 of the population living in urban areas.
In addition, the existing GIS file of the research area containing attributed data of the buildings could be used. The existing GIS file could be developed by different parties such as the local government or third-party organizations. GIS use requires collating data related to the buildings’ characteristics such as the building height, building design, building floor area, and building construction date. For instance, Wang et al. [15] aimed to find the material stock and flow of the Longwu village to find its spatial and temporal features. The study estimated the village’s material stock using the historical GIS data, Google Earth, and field surveys. The use of such an approach enabled the researchers to obtain the building’s attributes in order to estimate the total material stocks. The results indicated that 290,000 metrics tons of building material would be consumed between 2006 and 2022, and 125 kilotons of waste would be subsequently generated. In another study, Guoa et al. [20] endeavored to quantify and spatially allocate the material stock currently in 14 developing Chinese metropoles. The study used only the building’s existing GIS data to find its attributes. Subsequently, the study estimated the buildings’ material intensity in the study area by reviewing the existing literature. Upon combining the results, Guoa et al. [20] estimated the total material stock. The results revealed that 7.9 Gigatons of building material was stored in 3790 km2, with an average material density of 2.1 Megaton/km2 and 283 ton/capita. Analogously, Mastrucci et al. [25] developed an approach for the characterization of the material stock and the LCA of end-of-life scenarios of buildings at the urban scale by using the GIS for digital surface model and digital terrain model. The methodology was put forward based on combining the GIS and digital elevation modeling of the council on the city of Esch-sur-Alzette (Luxembourg). The results showed that 54% of the material was embedded in buildings constructed prior to 1949. Moreover, an average reduction of 25.6% of abiotic depletion and 9.2% of global warming potential was estimated based on two scenarios involving 50% and 70% recycling materials. Heeren and Hellweg [27] also calculated the future material stock of Switzerland residential buildings using an approach similar to Mastrucii et al. [25]. They used a GIS model for georeferencing and combined it with a 3D model of the buildings to estimate the volumetric material stock. Using six different scenarios, the result showed that by 2035 the total material inflow will decrease by half while the outflow would double. While in 2055, the inflow and outflow would become equal.
Factors influencing the growth of material stock have been analyzed by different studies. For instance, Tao Zhang [28] aimed to find the material stock and its spatial and temporal distribution in China between 1997 and 2016. The study analyzed the possible increase of material stocks due to the changes that occurred in economic and population factors. Using the government sources data, the study compiled the total material stock. The results showed that the material stock increased more than 4.0 times during this time and spatially decreased from the coastal areas to the inland. The results also suggest that affluence is a major factor in increasing material stock. Similarly, Huang et al. [24] studied the material stock accounting for 10 materials in 6 major cities in Beijing, Tianjin, and Shanghai and probed the driving factors between 1978 and 2013. The study was conducted by a logarithmic mean division index decomposition method. It showed that the material stock growth was rapid during the 1980s, steady in the 1990s and again accelerated after the 2000s. The reason for such a fluctuation lay with a decoupling phenomenon between material stock and economy that was mostly caused by a decline in material intensity.
Regarding the infrastructure projects, Nguyen et al. [32] estimated the material stock of Vietnamese roads between 2003 and 2013 using the bottom-up method. To this end, the study combined multiple data sources such as the federal and provincial government highway departments, contractors, and the roads’ historical design in order to compute the total material stock. The results showed that 40% of the domestic material stock consumption was related to expanding and maintaining the material stock. Moreover, the material stock was assessed to be in the range of 1321 million metric tons in 2003 to 2660 million metric tons in 2012. Although the application of such an approach may increase the accuracy of calculations, it can be time-consuming since it involves massive data collections. In another study, Wang et al. [46] used the bottom-up material stock method to estimate the municipal water and sewage waste management system efficiency between 1980 and 2050. A dynamic model using the inflow and outflow of materials was first developed and further combined with the average material intensity to estimate the material stock. The results were indicative of an increase in the annual water supply capacity over the last 30 years from 11 to 100 km3, while the sewage capacity increased from 1.1 to 50 km3. Furthermore, it was conclusively stated that the material stock might increase more than double by 2050, which in turn requires 3.3 Gigatons (GT) of construction materials containing 170 Megatons of Iron and Steel and 400 Megatons of cement.
The development of a road network on GIS can be a promising measure toward an accurate estimation of material stock of roads due to its capacity to capture real-life scenarios. For instance, Guo et al. [14] attempted to estimate the material stock of roads in Beijing. The study was conducted by making an integrated model that covered all types of roads, intersections, and ancillary facilities using the GIS. GIS was employed to avoid the issue of double-counting. The results showed that the total stock of roads was 159 million tons, of which 80% was stored in roads while 20% in ancillary facilities. It was also shown that Macadam was the largest stock with 111 million tons. In another study, Guo et al. [36] developed a more comprehensive model by using sensitivity analysis. They also included the inflows and outflows of material aiming to build a highway based on material metabolism (flows of construction material spatially over time). The results showed that the total material stock in the entire highway system was 1933.57 Megatons in 2013, where stones, fly ash, lime, cement, mineral powder, and asphalt comprised 99.8% of the stocks. Similarly, Miatto et al. [16] assessed long-term inflows, outflows, and materials accumulated in roads of the United States. The study utilized a bottom-up stock-driven model that included the inflow and outflow of US road construction material between 1905 and 2015. By using the road code literature, the study estimated the periodic refurbishment time and material dynamics. The results indicated that the current material stock of the road network was 15.1 billion tonnes, growing 21 times since 1905. In the 20th century, the material requirements of road construction in the overall economy declined from 35% to 15%.
Top-Down Methodology
The top-down method has been employed for the material stock calculation of the greater regions, where statistical data is usually used to estimate the material stock. This paper found that the top-down method has been used most for calculating the material stock of buildings. The application of this method requires having an accurate material intensity of the building under study. The material intensity coefficient depicts the average construction material in weight per length, area, or volume of the building [49]. Material intensity explains how much construction material such as concrete, steel, and glass is used in a particular type of project constructed in a period. Different techniques and methodologies have been used aiming to estimate the construction material stock via the top-down methodology (Table 3).
Table 3.
Methodology for top-down calculation.
The top-down method was mostly used to estimate material stock at a large scale, e.g., at the scale of a country. For example, Tanikawa et al. [7] carried out a study to map the construction materials in Japan from the 1940s until 2010 using GIS. The study used the top-down methodology by reviewing the previous research to find the total building area constructed. Afterward, material stock for the whole country of Japan was estimated using the average material intensity. The result showed that cement, aggregate, and asphalt were the major stocked material and comprised 95% of stocked materials. Overall, the study found that the material stock had increased from 3.1 billion tons to 16.5 billion tons between 1965 and 2010. In another study, Han and Xiang [31] investigated the material stock disparity in 31 provinces of China. The study estimated the stock of ten types of material stored in residential buildings, roads, railways, and water pipes between 1978 and 2008. The results showed that the total material stock increased to 42.5 billion in 2008, with per capita material stock increasing nine times. It was also shown that the material stock had spatially decreased from the coastline to inland areas.
This paper also found that the top-down method has also been applied for the calculation of material stock at the regional scale. The use of this method at the regional level requires the material intensity to be more detailed compared to the country-level application. Condeixa et al. [41] analyzed the flow of materials at use phase, construction, and demolition waste of the residential buildings in the city of Rio de Janerio in Brazil. They applied a top-down methodology to estimate the material stock by using the material intensities of different types of buildings constructed during different times of the year. The results suggested that the material stock of residential buildings in 2010 was 78,828,770 tons, with the material intensity between 2.58–0.74 t/m2. Ortlepp et al. [35] also quantified the material stock of nondomestic buildings in Germany. The study categorized the non-residential buildings into different types and calculated the average material intensity for each building type. The study estimated the total material stock by combining the average floor area for each building type and material intensity. The results showed that the total material stock of non-residential buildings in Germany was 6.8 billion tons constituting 44% of the entire building stock. Likewise, Schebek et al. [42] quantified the material stock of non-residential buildings in the Rhine-Main area in Germany. The study categorized the non-residential buildings into different types of use and age constructed, using the average material intensity found the total material stock using GIS. The results showed that the total material stock of non-residential buildings was approximately 65 million m3.
Using the top-down methodology, Bergsdal et al. [40] estimated the Polychlorinated biphenyls (PCBs) used in residential and non-residential buildings in Norway between the 1950s and 1980s. The PCBs can be deleterious to the environment once released and they can bioaccumulate in human and animal tissue [40]. The total amount of toxic plastic was estimated by combining the material intensity with the building’s total material stock. The results indicated that PCBs peaked around the 1980s then decreased as the government banned the application of PCBs. It was discovered that the PCBs presence was 156.2 and 231 tonnes in residential non-residential buildings, respectively. In another study, Tanikawa et al. [18] calculated the loss of material stock in Japanese buildings and roads due to the 9.0 earthquake and tsunami that struck eastern Japan in 2011. The study was conducted by reviewing the images of damaged buildings and the average material intensity from the literature. The total material stock lost was calculated by comparing the images before and after the tsunami and analyzing them using GIS. Results showed that the total material stock losses of buildings and roads were 31.8 and 2.1 million tonnes, respectively.
Further, this paper realized that GIS had been employed to estimate the material stock using the top-down method. GIS can be used to estimate the total building area, as well as categorizing different building types based upon the type of construction and year built. However, each building’s area individually, as in the case of the bottom-up methodology in the study area, is not estimated; instead, statistical estimates based upon the category of the building in the area of research are done. GIS is applied to georeference the aerial images of the study area. For instance, Miatto et al. [9], calculated the total material stock and demolition waste flow for Padua, a medium-sized Italian city, for the period 1902–2007. The study was conducted by using the photos of the different periods to estimate the new construction by georeferencing it on GIS. Using the statistical data of the average building life and buildings’ material intensity constructed, the study estimated the total material stock. It was found that the stock of building materials increased from 134 to 209 tonnes per capita between 1902 and 2007. It was also reported that waste flows accounted for 985 kg per capita in 2007 and were expected to rise to 1.9 tonnes per capita in 2030. Chen et al. [21] also presented an analytical method for urban building metabolism by using four-dimensional Geographical Information Systems (4d-GIS). The study was done by georeferencing the aerial images and CAD drawings on the GIS. The statistical data provided by government sources was employed to estimate the total floor area and the average material intensity. It was found that the material stock increased from 24,750 tons in 1970 to 927,552 tons in 2013.
GIS is also used to estimate the material stock by combining the building data about location, type, and year built gathered through different sources. Kleeman et al. [33] analyzed the material stock of buildings and their spatial distribution at the city level of Vienna. The study used the previous GIS data of individual buildings to calculate the material stock of the region. They managed to obtain GIS data of the previous construction from government sources. Afterward, the total material stock was estimated by combining the data with the average material intensity. The results showed that the material stock of Vienna was 380 million metric tons (t), which equals 210 tons per capita (t/cap). Mesta et al. [38] also analyzed the material stock in buildings and its spatial distribution of the city of Chiclayo in Peru. The study used the government census data to find the number of dwellings and the average floor area. Subsequently, the material intensity was found by using the drawings and expert opinions. The results showed that the total material stock of buildings in 2007 was 24.4 million tons (Mt) or 47 tonnes per capita. Similarly, Han et al. [39] integrated material flow analysis with the GIS map of Shanghai. The government sources were used to gather data about the number of dwellings and average floor areas of buildings. The data on the year built, length and width of roads, railways, and subways were also extracted from governmental sources. The findings showed that the material stock increased from 83 million tons to 561 million tons from 1980 to 2010. It was further found that the waste outputs were increased from 2 to 17 million tons during this time.
Gontia et al. [22] used the top-down methodology to calculate the infrastructure’s material stock. The study aimed to estimate the material stock of Gothenburg, Sweden using a cluster model. They developed an innovative approach to discovering material intensity at the neighborhood level via analyzing the similarity between various regions found in different clusters. The study was then able to find the material stock of buildings, roads, and pipelines of the entire city. The results suggested that the total material stock was 84 million metric tons. In this regard, buildings accounted for 73% of the stock, while road transports and pipes were 26% and 1%, respectively. In another study, Wiedenhofer et al. [43] modeled the stocks and flows of non-metallic minerals in residential buildings, roads, and railways in the European Union from 2004 to 2009. The study employed the typology of 72 buildings, four roads, and two railway types aiming to estimate the total material stock in the European Union. The results showed that the per capita non-metallic minerals stocks for roads were 128 tons, while it was 72 tons for residential buildings and 3 tons for railways in 2009.
Demand Driven
The demand-driven methodology estimates the material stock by using socio-economic indicators to model the demand for construction material. The methodology is used in the research where the material stock is estimated based upon the assumption that the demand of construction material is dependent upon economic, population, and social reasons in the society. Demand-driven has been a less commonly used method compared to others. The summary of the demand-driven methodology is shown in Table 4.
Table 4.
Methodology for Demand-Driven Calculation.
In a comprehensive study, Fishman [44] endeavored to identify the material stock accumulation and the speed of material stock accumulation around the world historically. The study reviewed the literature and found material stock accumulation, speed, and acceleration throughout 1950 to 2010 for forty different countries. The results suggest that the growth of material stock follows four archetypal patterns. Almost 600 Gigatons were accumulated from 1970 to 2010, of which more than half were added in the last 13 years. In another study, however, Fishman [48], modeled the national material stock of Japan and the US. The model used the historical data of average floor area and material intensity; then, analyzed the reasons for the differences in the material stock. Results showed that there exist different patterns of material stock accumulation around the world. Similarly, between 1930 and 2005, the material stock per capita was higher for the US. However, both countries almost reached a similar material stock per capita in 2005, i.e., 310 tons for Japan and 375 tons for the US.
Fishman et al. [47] investigated stock dynamics in Japan in relation to population and economic drivers using panel regression and IPAT (Impact = Population*Affluence*Technology) analyses from the past five decades. The key characteristic changes in different regions with the potential influence on material stock growth were critically reviewed to carry out the research. The results suggested that economic growth, population growth, and migrations caused material stock growth. Vasquez et al. [45] also presented a demand-driven stock modeling approach that considered demographic aspects, lifestyle-related issues, and building-specific characteristics for energy reduction strategies in buildings. The study was conducted on dwelling stocks in Germany and the Czech Republic. The results showed that the current regulations were sufficient to achieve the 20% energy efficiency goal by 2020 but not to reach the 2050 energy and GHG-emission goals. In contrast, Yoshida et al. [34] proposed an automatic detection of the anthropogenic disturbance of soil and earth from excavation and mining sites. They used GIS and digital elevation modeling to pinpoint the location and amount of excavation in Japan as a case study. The results indicated that the ratio of unused extraction to used extraction may exceed 1:1 for construction minerals in Japan. Additionally, the environmental effects of anthropogenic activity were more significant than natural soil disturbance by several orders of magnitude.
3.2.3. Advantages and Disadvantages of the Methods
This review has comprehensively analyzed the approaches of the selected studies in terms of their chosen methodologies. Table 5 comparatively tabulates advantages and disadvantages concerned with each method discussed before. Regarding the bottom-up method, the use of this methodology minimizes the possibility for final results to be affected by “sample error”, leading to the attainment of results with high accuracy. Sample error refers to when the sample statistics differ from the statistics of the entire research area [50]. Nevertheless, the application of the bottom-up method can be time-consuming, particularly for large-scale projects, since each material must be individually calculated. The top-down methodology is deemed to be easier to use compared to the bottom-up methodology. The data regarding material intensity and total floor area can be readily accessible from local government sources. However, this method has a lower accuracy while being susceptible to sample error due to its dependency on average material intensity. On the other hand, the demand-driven methodology is less time-consuming compared to the bottom-up and top-down methodology. This method can be employed when the socio-economic impacts on the material stock need to be analyzed. The drawback of the demand-driven methodology pertains to its limited application when the scale of the area is smaller than the country.
Table 5.
Advantages and disadvantages of the three methods.
3.2.4. Related Research Based on the Material Stock Method
Researchers use the material stock of a study area as data to conduct further research such as estimating its future construction demolition waste, buildings’ environmental impacts, and urban analysis. For instance, Surahman et al. [8] used the material stock dynamics data to predict the future demolition waste. The future waste demolition could be estimated using the average lifecycle of different construction materials and combining them with the material stock dynamics. Similarly, Miatto et al. [9] researched to estimate the waste demolition potential. Using the material stock’s GIS model and integrating it with the average demolition period estimated through the regression model, the waste demolition could be estimated.
Similar to waste generation, the overall environmental impact has also been researched thoroughly. For example, Mastrucci et al. [25] developed a framework to characterize the building stock and quantify the potential environmental impact at the end of the life cycle assessment to support the waste management decisions. Similarly, Stephan and Athanassiadis [17] calculated the embodied energy of the material stock. A region’s total embodied energy was estimated by calculating the total material stock and embodied energy of an individual material used in construction. Hong et al. [23] also conducted similar research, the author investigated the material stock’s future material and energy requirements. The research estimated the future growth and retrofits in the residential and commercial buildings. Based on the average material intensity and material energy, the research estimated future material energy requirements. In another study, Vásquez, [45] used a similar technique; however, the author proposed reducing energy consumed in constructing the building.
The material stock dynamics methodology was employed in the study conducted by Tanikawa et al. [18] to estimate the material loss due to the tsunami and earthquake in Japan. Before and after images of the tsunami were taken for analysis. It was an innovative technique to use the material stock for damage assessment. Similarly, Wang et al. [46] used the material stock method to analyze the sewage system’s underutilization and inefficiency. The study proved that material stock could help to compare sewage systems between different regions and proved which one is more efficient.
Urban planners need to know about the material stock density and per capita material stock since both indicators represent the behavior of the urban metropolis. Guoa et al. [20] found the material density and per capita material stock of different cities in eastern China. Then using the results, the authors made suggestions for the urban planners. It is also essential to know about the future material stock demands for policy purposes as it would ensure the availability of essential raw materials. Contrastingly, Han and Xiang [31] used the material stock’s spatial and temporal results to show China’s regional disparity. The study demonstrated that the material stock could also be used as an indicator of regional disparity apart from economic indicators as it shows the consumption of construction material.
It is essential to know about the future material stock requirements so that the urban planners could plan accordingly. For instance, Fishman [44] analyzed the historically found material stock accumulation, speed, and acceleration over the period for different countries worldwide and then predicted future material stock requirements using different case scenarios. Another study Fishman [48], predicted the US and Japan’s future material stock requirements using the historical material stock data and comparing them to predict the future based on similarities and differences. Similarly, Fishman et al. [47], in another study, demonstrated the relation of material stock with economic and population growth. The study concluded that the increased demand follows economic and population growth.
Similar to previous research on estimating the future material stock Heeren and Hellweg [27] predicted the future material stock using the probabilistic method by making different scenarios. In the same way, Huang et al. [24] conducted similar research by studying the patterns and changes in the material stock from 1978–2013. The study demonstrated periods of rapid growth and acceleration and the social and economic reasons for it. However, Stephan and Athanassiadis [30] specifically developed a framework to estimate future material stock consumption and spatially distribute it.
4. Discussion
4.1. Procedure to Calculate Material Stock
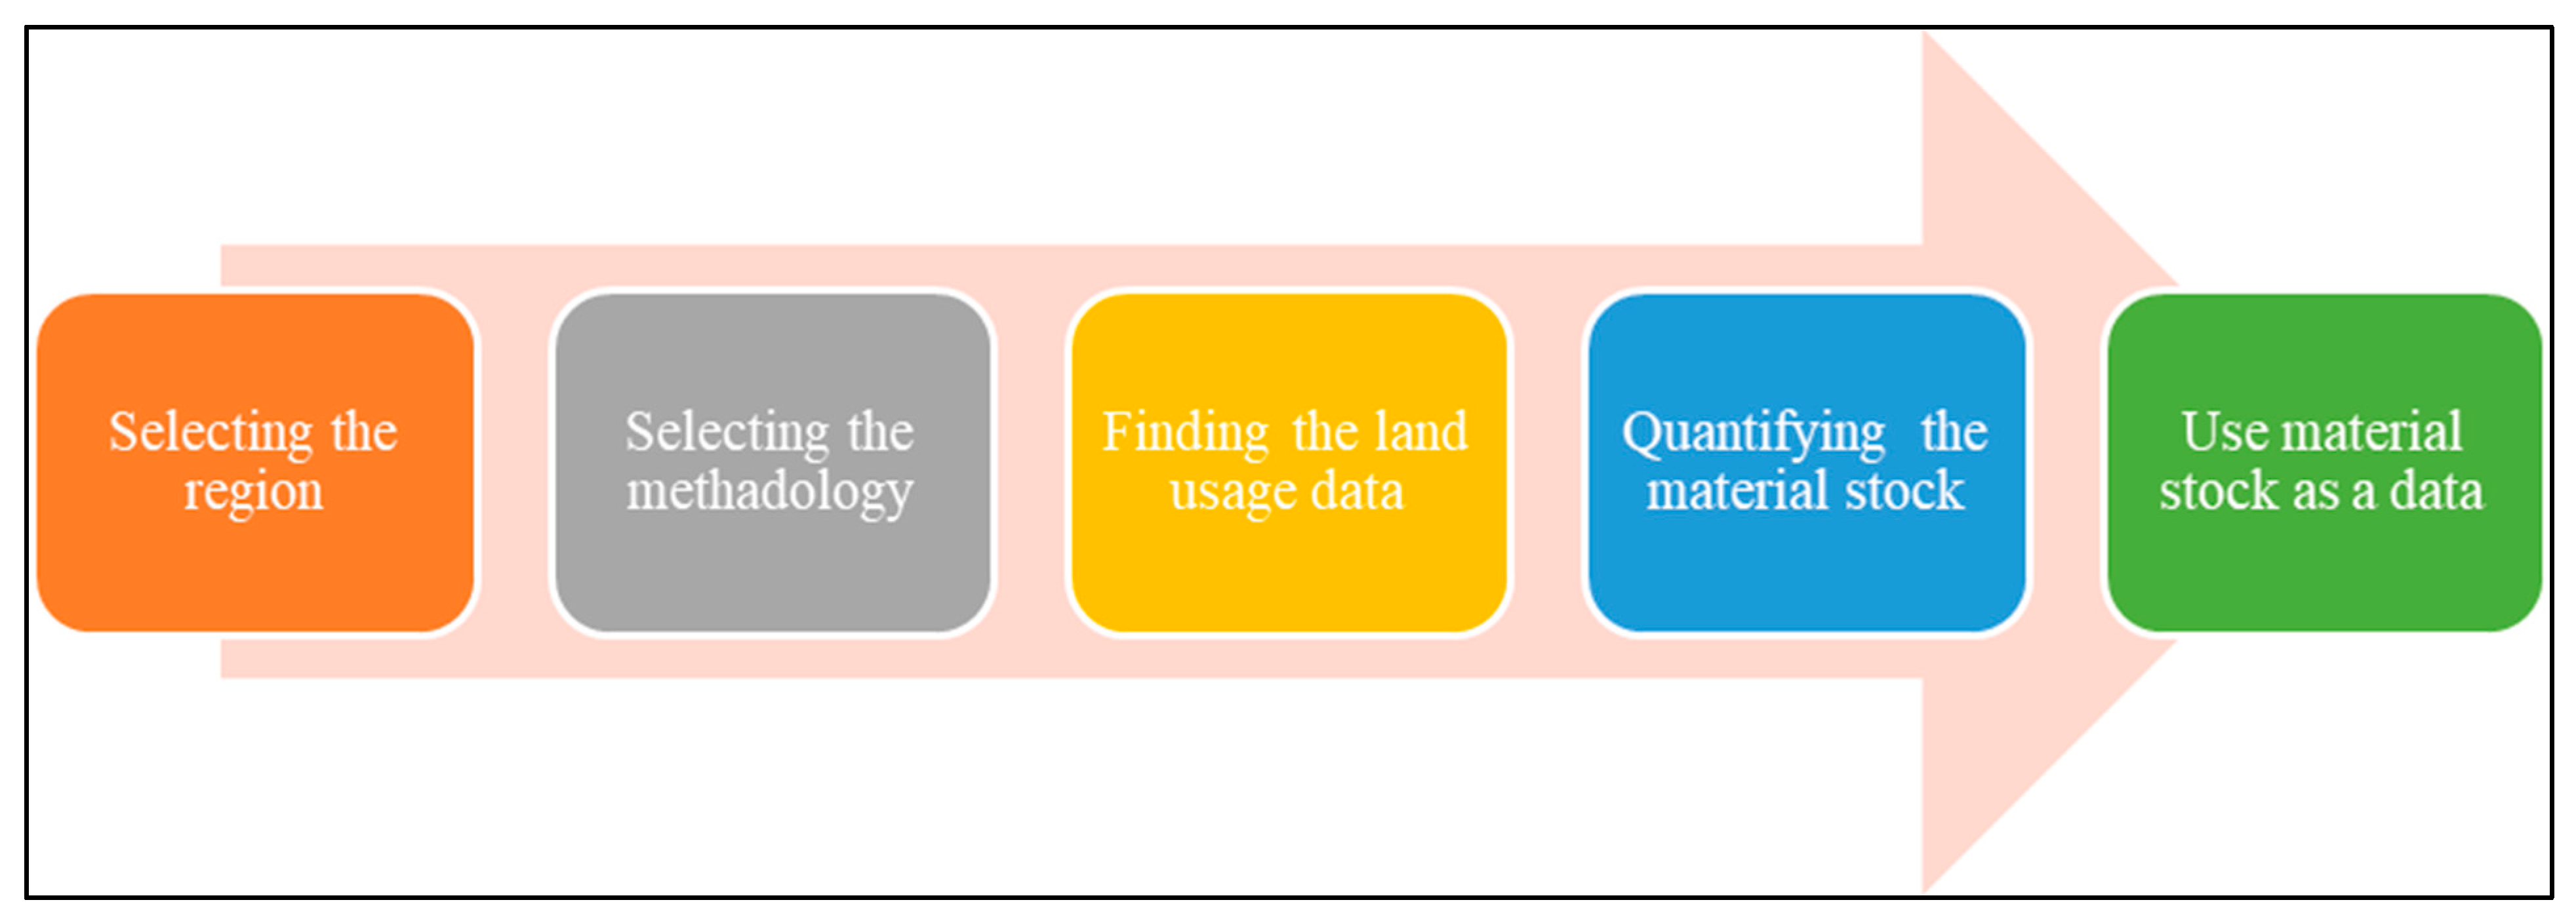
The accurate estimation of construction material stock is essential to assure achieving reliable results. However, the quality and availability of data vary significantly among countries, making it almost impossible to define a standard procedure [2]. Correspondingly, this paper intends to put forward comprehensive guidance for the appropriate selection of methodology and recommend data input requirements to calculate material stock calculation. The construction material cadaster is made from different types of material, resources, and resources. The proposed framework is developed based upon the amalgamation of the analyzed studies’ approaches towards material estimation (Figure 8). This framework removes the ambiguity on how to estimate the material stock and what are the available resources in finding the data.
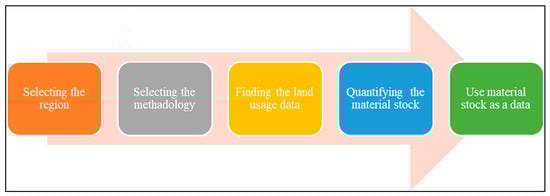
Figure 8.
Proposed methodology.
4.1.1. Selecting the Region
The first step in estimating the material stock is to select the project area. The area selected should be based on the research aims and objectives. For example, to estimate future waste generation using the building material stock, the project area selected should have buildings that have completed their lifespan. However, if the research objective is to estimate future material stock requirements, the project area should be developing steadily. Similarly, the necessary data should be available. For instance, in bottom-up methodology, extensive details such as construction drawings, materials used, and methodologies adopted should be known. However, in the case of top-down methodology, extensive statistical data of the projects similar to the project area should be available. Similarly, for demand-driven methodology, socio-economic data should be available.
4.1.2. Selecting the Methodology
The choice of the methodology depends on the size of the project area, data availability, and accuracy of the results required [7]. As discussed before, the top-down method is suitable for calculating material stocks on a large scale. However, for small project areas, the bottom-up methodology is preferred. Similarly, for a vast project area, both top-down and demand-driven methodologies should be considered. However, the methods are flexible and could vary based upon the data availability and time constraints. For instance, if details of the building projects are available in a GIS file of every building in the city, it could estimate the total material stock using the bottom-up methodology [36]. Table 6 shows the suggested methodology based upon the size of the study area.
Table 6.
Method Suggested based on Study Area.
4.1.3. Finding the Land Usage Data
Finding the land usage data depends on the study area’s circumstances, both primary sources and secondary sources to gather data. The primary sources include project drawings, technical specifications, and contract documents [8,18]. The secondary sources include government sources, existing GIS files, or other primary research documents [17,33].
The land usage data that needs to be gathered are the type of construction project, such as a residential or non-residential building. Similarly, the floor area of the project must be reviewed. The details depend upon the type of methodology selected. For instance, more details are required in bottom-up methodology, while statistical analysis is required in top-down methodology. The other data that is required is the construction and the material intensity data. Similarly, the other data required depends upon the objectives of the study. For instance, if future construction waste and demolition generation need to be studied, the expected demolition time of the project needs to be reviewed. Table 7 shows how the relevant data should be gathered based upon the literature reviewed above.
Table 7.
Suggested Method to Gather the Land Data.
4.1.4. Quantifying the Material Stock
Material stock could be estimated by combining the total volume of construction material of different projects with the material intensity. The calculation could be done either manually or with the help of software. For example, Nguyen et al. [32] and Surahman et al. [8] used manual techniques to estimate the study’s material stock. Similarly, an existing GIS file could be used to estimate the overall material stock. As Tanikawa (2010) [37] and Wang et al. [46] calculated the material stock using the existing GIS data.
After calculating the material stock, it could be helpful to spatially distribute the results by georeferencing, for which GIS is a useful tool. For instance, Mesta et al. [38] and Miatto et al. [9] spatially distributed their results with the help of GIS. Similarly, temporal distribution explaining the time for material stock changes could also be explained with the help of GIS. For instance, Condeixa et al. [41] and Tanikawa [37] used the temporal feature to explain how the urban areas have witnessed changes in material stocks over time.
4.1.5. Using the Material Stock Data
The material stock estimated could be further used as data to conduct further research, such as waste management. For instance, Surahman et al. [8] and Miatto et al. [9] estimated the future construction waste generation in the study area. Similarly, the environmental impact of building such as material stock was also estimated by Stephan and Athanassiadis [17], and Mastrucci et al. [25]. Finding the environmental impact helps to create a sustainable construction.
Material stock could also be used as data to estimate the material stock density, material stock per capita or future material stock demand. Such research helps urban planners to ensure that urban spaces are managed appropriately. For instance, Guoa et al. [20] estimated the construction material density and per capita material stock of different cities in China. It guides the urban planners on where to invest in infrastructure. Similarly, Heeren and Hellweg [27] predicted the future material stock. Knowing the future growth of material stock encourages making policies that ensure sustainable and adequate resources. By analyzing the future demolition and material stock requirements, appropriate policies could be made to recycle and reuse the material.
4.2. Future Directions for Research
Based on the review conducted, this study highlights potential directions for future research.
- Diverse study areas: Based upon the articles reviewed, the study found that most of the studies were performed in certain countries such as China, Japan, and Europe. Considering the significant contribution of the construction industry in developing countries, the contribution from these countries is insignificant. Research in material stock from developing countries would ensure that the material intensity of different regions could be compared based upon economic and population numbers. Also, the research could be done on how much material stock is necessary to sustain economic growth in developing countries. Similarly, differences in waste generation and energy consumptions could also be investigated between different regions in the world.
- Simulation tools: There remains a need for investment in developing simulation tools that can proceed with data available from Google Earth. Such tools would be readily available and would reduce the extensive work of estimating material stock. Developing such tools would further encourage research in areas where such extensive research data is not available, as in most developing countries. Similarly, as discussed in the study, few studies research both buildings and infrastructure as it is data intensive. However, it is necessary to understand urban areas better. Therefore, appropriate software tools and databases should be researched in which both buildings and infrastructure could be researched simultaneously without making it complicated. It would help the researchers to compare different urban centers to understand the similarities and differences in material stock consumption.
- Integrating material passports: Research should also be done on incorporating the building’s material passports into estimating the material stock of the regions. The material passport is a set of data that describes the characteristics of the material in products that give them value for recovery and reuse [52]. Therefore, the total material stock can be estimated by combining the data from the material passports. Moreover, the material passport could be used to calculate future waste and pollution generated. Such research would further enhance the prospects of research in the construction material circular economy.
- Infrastructure material stock: Material stock estimation of the allied infrastructure has not been researched thoroughly. For instance, based upon the articles reviewed only Wang et al. [15] estimated the material stock of the sewage pipes. However, other allied infrastructures such as walkways need to be researched further. Similarly, the top-down method for estimation of the road material stock has only been done by Gontia et al. [22]. Thus, there remains a gap to further research road material stock using the top-down methodology as the cross-section of the same type of roads is similar, ensuring that the material intensity is more accurately measured.
- Uncertainty in models: Material stock is estimated by making models of the research area. However, there remains a question on the accuracy of material intensity. In building construction, the material intensity of structural elements could be accurately estimated as they follow the industry trends. However, the finished items depend upon user choice increasing its uncertainty [17]. Therefore, there is a need to research into improving models that would have higher accuracy for the building finishes.
5. Conclusions
The material stock is estimated using bottom-up, top-down, and demand-driven methods. Selecting the correct methodology and applying it accurately is a crucial step in material stock estimation. However, the current body of knowledge is fragmented. This paper systematically reviewed and compared bottom-up, top-down, and demand-driven methodologies used in the material stock calculation. Then, it reviewed how further research such as construction waste management and urban management could be done by using the material stock as data. Afterward, guidance was provided on estimating the material stock for future research by providing a list of the data required, their common sources, and the step-by-step process. Lastly, research gaps in the field of material stock were provided.
Based upon the articles reviewed, it could be concluded that the methodologies have been applied innovatively. The bottom-up methodology is the most used method for research as compared to top-down and demand-driven methods. Also, buildings are more researched than the infrastructure. GIS has been extensively used to estimate the material stock accurately to geo-reference the projects. Similarly, GIS has also been used to spatially distribute the results over a certain period. The guidance provided in this paper would help the researchers in selecting the correct methodology and adopting the correct process.
The review shows that the research has been limited to certain countries. Furthermore, there is a need to improve the statistical calculation for the top-down methodology’s material intensity and floor area. Also, the estimation process needs to be simplified by using simulation tools so that research could be conducted in areas where extensive data is not available. Further research should be done on comparing the results of different countries and investigating their relationship with the economy and population.
This paper would help in creating a circular economy in the construction industry as estimating the material cadaster is an essential step to know the quantity of material that could be recycled. The limitation of this paper is that it has reviewed only peer-reviewed articles published in English. Adding conference papers about material stock could further enhance the understanding of the methodologies.
Author Contributions
Conceptualization, U.N.; methodology, U.N.; writing—original draft preparation, U.N.; writing—review and editing, U.N., R.C. and H.O.; supervision, R.C. and H.O. All authors have read and agreed to the published version of the manuscript.
Funding
This research received no external funding.
Institutional Review Board Statement
Not applicable.
Informed Consent Statement
Not applicable.
Data Availability Statement
Data sharing not applicable.
Acknowledgments
This work is based on the master thesis of Usman Nasir, in the Master of Construction Management that is completed in 2021 at the School of Architecture and Built Environment, The University of Adelaide, Adelaide, Australia, under the supervision of Ruidong Chang.
Conflicts of Interest
The authors declare no conflict of interest.
References
- Wang, G.; Li, Y.; Zuo, J.; Hu, W.; Nie, Q.; Lei, H. Who drives green innovations? Characteristics and policy implications for green building collaborative innovation networks in China. Renew. Sustain. Energy Rev. 2021, 143, 110875. [Google Scholar] [CrossRef]
- Augiseau, V.; Barles, S. Studying construction materials flows and stock: A review. Resour. Conserv. Recycl. 2017, 123, 153–164. [Google Scholar] [CrossRef]
- Fischer-Kowalski, M.; Krausmann, F.; Giljum, S.; Lutter, S.; Mayer, A.; Bringezu, S.; Moriguchi, Y.; Schütz, H.; Schandl, H.; Weisz, H. Methodology and Indicators of Economy-wide Material Flow Accounting. J. Ind. Ecol. 2011, 15, 855–876. [Google Scholar] [CrossRef]
- Brunner, P.; Rechburger, H. Practical Handbook of Material Flow Analysis, 1st ed.; Lewis Publishers: Boca Raton, FL, USA, 2004; Volume 1. [Google Scholar]
- Thomsen, A.; Van Der Flier, K. Replacement or renovation of dwellings: The relevance of a more sustainable approach. Build. Res. Inf. 2009, 37, 649–659. [Google Scholar] [CrossRef]
- Cheng, J.C.P.; Ma, L.Y.H. A BIM-based system for demolition and renovation waste estimation and planning. Waste Manag. 2013, 33, 1539–1551. [Google Scholar] [CrossRef]
- Tanikawa, H.; Fishman, T.; Okuoka, K.; Sugimoto, K. The Weight of Society Over Time and Space: A Comprehensive Account of the Construction Material Stock of Japan, 1945–2010. J. Ind. Ecol. 2015, 19, 778–791. [Google Scholar] [CrossRef]
- Surahman, U.; Higashi, O.; Kubota, T. Evaluation of current material stock and future demolition waste for urban residential buildings in Jakarta and Bandung, Indonesia: Embodied energy and CO2 emission analysis. J. Mater. Cycles Waste Manag. 2017, 19, 657–675. [Google Scholar] [CrossRef]
- Miatto, A.; Schandl, H.; Forlin, L.; Ronzani, F.; Borin, P.; Giordano, A.; Tanikawa, H. A spatial analysis of material stock accumulation and demolition waste potential of buildings: A case study of Padua. Resour. Conserv. Recycl. 2019, 142, 245–256. [Google Scholar] [CrossRef]
- Omrany, H.; Soebarto, V.; Sharifi, E.; Soltani, A. Application of life cycle energy assessment in residential buildings: A critical review of recent trends. Sustainability 2020, 12, 351. [Google Scholar] [CrossRef] [Green Version]
- Omrany, H.; Soebarto, V.; Zuo, J.; Sharifi, E.; Chang, R. What leads to variations in the results of life-cycle energy assessment? An evidence-based framework for residential buildings. Energy Built Environ. 2021, 2, 392–405. [Google Scholar] [CrossRef]
- Hsieh, H.-F.; Shannon, S.E. Three Approaches to Qualitative Content Analysis. Qual. Health Res. 2005, 15, 1277–1288. [Google Scholar] [CrossRef]
- Elo, S.; Kyngäs, H. The qualitative content analysis process. J. Adv. Nurs. 2008, 62, 107–115. [Google Scholar] [CrossRef]
- Guo, Z.; Hu, D.; Zhang, F.; Huang, G.; Xiao, Q. An integrated material metabolism model for stocks of urban road system in Beijing, China. Sci. Total Environ. 2014, 470–471, 883–894. [Google Scholar] [CrossRef]
- Wang, H.; Chen, D.; Duan, H.; Yin, F.; Niu, Y. Characterizing urban building metabolism with a 4D-GIS model: A case study in China. J. Clean. Prod. 2019, 228, 1446–1454. [Google Scholar] [CrossRef]
- Miatto, A.; Schandl, H.; Wiedenhofer, D.; Krausmann, F.; Tanikawa, H. Modeling material flows and stocks of the road network in the United States 1905–2015. Resour. Conserv. Recycl. 2017, 127, 168–178. [Google Scholar] [CrossRef]
- Stephan, A.; Athanassiadis, A. Quantifying and mapping embodied environmental requirements of urban building stocks. Build. Environ. 2017, 114, 187–202. [Google Scholar] [CrossRef]
- Tanikawa, H.; Managi, S.; Lwin, C.M. Estimates of Lost Material Stock of Buildings and Roads Due to the Great East Japan Earthquake and Tsunami. J. Ind. Ecol. 2014, 18, 421–431. [Google Scholar] [CrossRef]
- Arora, M.; Raspall, F.; Cheah, L.; Silva, A. Residential building material stocks and component-level circularity: The case of Singapore. J. Clean. Prod. 2019, 216, 239–248. [Google Scholar] [CrossRef]
- Guo, J.; Miatto, A.; Shi, F.; Tanikawa, H. Spatially explicit material stock analysis of buildings in Eastern China metropoles. Resour. Conserv. Recycl. 2019, 146, 45–54. [Google Scholar] [CrossRef]
- Chen, C.; Shi, F.; Okuoka, K.; Tanikawa, H. The metabolism analysis of urban building by 4d-GIS–a useful method for new-type urbanization planning in China. Univers. J. Mater. Sci. 2016, 4, 40–46. [Google Scholar] [CrossRef]
- Gontia, P.; Thuvander, L.; Ebrahimi, B.; Vinas, V.; Rosado, L.; Wallbaum, H. Spatial analysis of urban material stock with clustering algorithms: A Northern European case study. J. Ind. Ecol. 2019, 23, 1328–1343. [Google Scholar] [CrossRef] [Green Version]
- Hong, L.; Zhou, N.; Feng, W.; Khanna, N.; Fridley, D.; Zhao, Y.; Sandholt, K. Building stock dynamics and its impacts on materials and energy demand in China. Energy Policy 2016, 94, 47–55. [Google Scholar] [CrossRef]
- Huang, C.; Han, J.; Chen, W.-Q. Changing patterns and determinants of infrastructures’ material stocks in Chinese cities. Resour. Conserv. Recycl. 2017, 123, 47–53. [Google Scholar] [CrossRef]
- Mastrucci, A.; Marvuglia, A.; Popovici, E.; Leopold, U.; Benetto, E. Geospatial characterization of building material stocks for the life cycle assessment of end-of-life scenarios at the urban scale. Resour. Conserv. Recycl. 2017, 123, 54–66. [Google Scholar] [CrossRef]
- Ortlepp, R.; Gruhler, K.; Schiller, G. Materials in Germany’s domestic building stock: Calculation model and uncertainties. Build. Res. Inf. 2018, 46, 164–178. [Google Scholar] [CrossRef]
- Heeren, N.; Hellweg, S. Tracking Construction Material over Space and Time: Prospective and Geo-referenced Modeling of Building Stocks and Construction Material Flows. J. Ind. Ecol. 2019, 23, 253–267. [Google Scholar] [CrossRef] [Green Version]
- Zhang, T.; Liu, L.; Lv, X. The change in the material stock of urban infrastructures in China. Struct. Chang. Econ. Dyn. 2019, 51, 24–34. [Google Scholar] [CrossRef]
- Miatto, A.; Schandl, H.; Tanikawa, H. How important are realistic building lifespan assumptions for material stock and demolition waste accounts? Resour. Conserv. Recycl. 2017, 122, 143–154. [Google Scholar] [CrossRef]
- Stephan, A.; Athanassiadis, A. Towards a more circular construction sector: Estimating and spatialising current and future non-structural material replacement flows to maintain urban building stocks. Resour. Conserv. Recycl. 2018, 129, 248–262. [Google Scholar] [CrossRef]
- Han, J.; Xiang, W.-N. Analysis of material stock accumulation in China’s infrastructure and its regional disparity. Sustain. Sci. 2013, 8, 553–564. [Google Scholar] [CrossRef]
- Nguyen, T.C.; Fishman, T.; Miatto, A.; Tanikawa, H. Estimating the Material Stock of Roads: The Vietnamese Case Study. J. Ind. Ecol. 2019, 23, 663–673. [Google Scholar] [CrossRef]
- Kleemann, F.; Lederer, J.; Rechberger, H.; Fellner, J. GIS-based Analysis of Vienna’s Material Stock in Buildings. J. Ind. Ecol. 2017, 21, 368–380. [Google Scholar] [CrossRef]
- Yoshida, K.; Fishman, T.; Okuoka, K.; Tanikawa, H. Material stock’s overburden: Automatic spatial detection and estimation of domestic extraction and hidden material flows. Resour. Conserv. Recycl. 2017, 123, 165–175. [Google Scholar] [CrossRef]
- Ortlepp, R.; Gruhler, K.; Schiller, G. Material stocks in Germany’s non-domestic buildings: A new quantification method. Build. Res. Inf. 2016, 44, 840–862. [Google Scholar] [CrossRef]
- Guo, Z.; Shi, H.; Zhang, P.; Chi, Y.; Feng, A. Material metabolism and lifecycle impact assessment towards sustainable resource management: A case study of the highway infrastructural system in Shandong Peninsula, China. J. Clean. Prod. 2017, 153, 195–208. [Google Scholar] [CrossRef]
- Tanikawa, H.; Hashimoto, S. Urban stock over time: Spatial material stock analysis using 4d-GIS. Build. Res. Inf. 2009, 37, 483–502. [Google Scholar] [CrossRef]
- Mesta, C.; Kahhat, R.; Santa-Cruz, S. Geospatial Characterization of Material Stock in the Residential Sector of a Latin-American City. J. Ind. Ecol. 2019, 23, 280–291. [Google Scholar] [CrossRef] [Green Version]
- Han, J.; Chen, W.-Q.; Zhang, L.; Liu, G. Uncovering the Spatiotemporal Dynamics of Urban Infrastructure Development: A High Spatial Resolution Material Stock and Flow Analysis. Environ. Sci. Technol. 2018, 52, 12122–12132. [Google Scholar] [CrossRef] [PubMed]
- Bergsdal, H.; Brattebø, H.; Müller, D.B. Dynamic material flow analysis for PCBs in the Norwegian building stock. Build. Res. Inf. 2014, 42, 359–370. [Google Scholar] [CrossRef]
- Condeixa, K.; Haddad, A.; Boer, D. Material flow analysis of the residential building stock at the city of Rio de Janeiro. J. Clean. Prod. 2017, 149, 1249–1267. [Google Scholar] [CrossRef]
- Schebek, L.; Schnitzer, B.; Blesinger, D.; Köhn, A.; Miekley, B.; Linke, H.J.; Lohmann, A.; Motzko, C.; Seemann, A. Material stocks of the non-residential building sector: The case of the Rhine-Main area. Resour. Conserv. Recycl. 2017, 123, 24–36. [Google Scholar] [CrossRef]
- Wiedenhofer, D.; Steinberger, J.K.; Eisenmenger, N.; Haas, W. Maintenance and Expansion: Modeling Material Stocks and Flows for Residential Buildings and Transportation Networks in the EU25. J. Ind. Ecol. 2015, 19, 538–551. [Google Scholar] [CrossRef] [Green Version]
- Fishman, T.; Schandl, H.; Tanikawa, H. Stochastic analysis and forecasts of the patterns of speed, acceleration, and levels of material stock accumulation in society. Environ. Sci. Technol. 2016, 50, 3729–3737. [Google Scholar] [CrossRef]
- Vásquez, F.; Løvik, A.N.; Sandberg, N.H.; Müller, D.B. Dynamic type-cohort-time approach for the analysis of energy reductions strategies in the building stock. Energy Build. 2016, 111, 37–55. [Google Scholar] [CrossRef]
- Wang, T.; Shi, F.; Zhang, Q.; Qian, X.; Hashimoto, S. Exploring material stock efficiency of municipal water and sewage infrastructures in China. J. Clean. Prod. 2018, 181, 498–507. [Google Scholar] [CrossRef]
- Fishman, T.; Schandl, H.; Tanikawa, H. The socio-economic drivers of material stock accumulation in Japan’s prefectures. Ecol. Econ. 2015, 113, 76–84. [Google Scholar] [CrossRef]
- Fishman, T.; Schandl, H.; Tanikawa, H.; Walker, P.; Krausmann, F. Accounting for the Material Stock of Nations. J. Ind. Ecol. 2014, 18, 407–420. [Google Scholar] [CrossRef] [Green Version]
- Gontia, P.; Nägeli, C.; Rosado, L.; Kalmykova, Y.; Österbring, M. Material-intensity database of residential buildings: A case-study of Sweden in the international context. Resour. Conserv. Recycl. 2018, 130, 228–239. [Google Scholar] [CrossRef]
- Brittanica. Model Assisted Survey Sampling. 2021. Available online: https://www.britannica.com/science/sampling-error (accessed on 16 May 2021).
- Barles, S. L’écologie territoriale et les enjeux de la dématérialisation des sociétés: L’apport de l’analyse des flux de matières. Économie Géographie Politique Droit Sociologie 2014, 5. [Google Scholar] [CrossRef] [Green Version]
- BAMB. Materials Passports. 2020. Available online: https://www.bamb2020.eu/topics/materials-passports/ (accessed on 3 March 2021).

Publisher’s Note: MDPI stays neutral with regard to jurisdictional claims in published maps and institutional affiliations. |
© 2021 by the authors. Licensee MDPI, Basel, Switzerland. This article is an open access article distributed under the terms and conditions of the Creative Commons Attribution (CC BY) license (https://creativecommons.org/licenses/by/4.0/).