Article

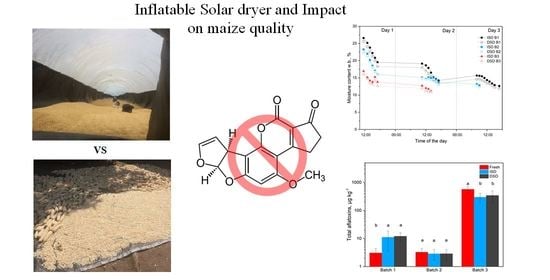
Performance Evaluation of an Inflatable Solar Dryer for Maize and the Effect on Product Quality Compared with Direct Sun Drying

1
Tropics and Subtropics Group, Institute of Agricultural Engineering, University of Hohenheim, 70599 Stuttgart, Germany
2
Alliance of Bioversity International and the International Center for Tropical Agriculture (CIAT), Africa Hub, Nairobi P.O. Box 823-00621, Kenya
3
Department of Agricultural and Biosystems Engineering, Makerere University, Kampala P.O. Box 7062, Uganda
*
Author to whom correspondence should be addressed.
Dedicated to the memory of author Noble Banadda, who passed away during the preparation of this manuscript.
Appl. Sci. 2021, 11(15), 7074; https://doi.org/10.3390/app11157074
Submission received: 28 June 2021 / Revised: 23 July 2021 / Accepted: 28 July 2021 / Published: 30 July 2021
(This article belongs to the Special Issue Renewable Energy in Agriculture Ⅱ)

Abstract

:

Featured Application

Postharvest handling, drying, food safety, renewable energy.

Abstract

Maize is an important staple in Africa, which necessitates immediate drying to preserve the postharvest quality. The traditional drying of maize in the open sun is prone to adverse weather and extraneous contamination. In this study, the drying performance of an inflatable solar dryer (ISD) was compared to direct sun drying (DSD) in Gombe Town, Wakiso District (Uganda) by analysing the moisture content, yeasts, moulds, aflatoxin, and colour. The maximum temperature inside the ISD reached 63.7 °C and averaged 7 °C higher than the ambient temperature. Maize was dried using both methods to a moisture content below 14% after two days. In one of the received maize lots that was already heavily contaminated after harvest, drying with DSD and ISD reduced the aflatoxin content from 569.6 µg kg−1 to 345.5 µg kg−1 and 299.2 µg kg−1, respectively. Although the drying performance in terms of drying time and product quality regarding colour, yeast, and mould was similar for both drying methods, the advantage of ISD in reducing the risk of spoilage due to sudden rain is obvious. A strategy for the early detection of aflatoxins in maize is recommended to avoid contaminated maize in the food chain.

Graphical Abstract

1. Introduction

Maize (Zea mais) is the most cultivated cereal crop in Uganda, with an annual production of 2.9 million tons cultivated on 1.1 million hectares [1]. Improving the quality of the produce and reducing the postharvest losses is a major objective of agricultural research [2]. Furthermore, better food quality and quantity contributes to the food security, nutrition, and economy of the country. The district of Wakiso, in the Lake Victoria Crescent agro-ecological zone (AEZ), is one of the main maize-producing districts in Uganda. Farmers in this district and across the country face several postharvest challenges leading to losses of maize. Most of the postharvest losses are mainly a result of poor storage management that causes the infestation of yeasts and moulds, as well as with insects and rodents [3]. In humid tropical regions like Uganda, the infestation with moulds results in the production of mycotoxins that have detrimental consequences on human health and affect the economy [4]. An estimated 25–40% of cereal grains worldwide are contaminated by mycotoxins [5]. The tropical regions are classified as the most conducive regions for mycotoxin contaminations [6]. Similar issues were revealed in research on the effect of storage time on the contamination of maize in different AEZs of Uganda [7]. It was found that most farmers could hardly dry maize to the required storage moisture content of <14%. At the same time, it was determined that the contamination levels with aflatoxins were higher with longer storage times, with an average contamination level of 30.2 µg kg−1, especially in humid zones. In East Africa, the maximum limit for an aflatoxin contamination of maize was fixed at 10 µg kg−1 [8]. The European Union Commission set the maximum limit of total aflatoxins to 10 µg kg−1 for maize intended for sorting and processing, but this limit is 4 µg kg−1 when maize is intended for direct consumption [9]. The USA Food and Drugs Administration set, on the other hand, a limit of 20 µg kg−1 for the total aflatoxins in maize [10]. A study on the level of exposure of the Ugandan population to aflatoxin showed that the exposure was ubiquitous among the rural population and that this exposure was suspected to be related to the consumption of contaminated food products like posho (also called ugali, a stiff porridge made of maize flour) and groundnuts [11,12]. Aflatoxins are a group of mould metabolites produced by strains of Aspergillus flavus and Aspergillus parasiticus [13]. There are four major aflatoxins: B1, B2, G1, and G2, and B1 is the major aflatoxin produced by toxigenic A. flavus strains [14,15]. A. flavus contamination can occur in the field, as well as during storage, but happens most commonly in storage under favourable conditions. These are the moisture content of the grains, the storage temperature, and the relative humidity in the storage facility all related to the water activity (aw) [6]. Another essential quality parameter for maize, which is affected by drying, is the grain colour. The colour of maize is evaluated using the CIE Lab colour space. It was shown that slight changes in maize colour could occur during an extended drying time for maize [16].
Maize producers in the tropical and subtropical regions face difficulty in drying the harvested maize to the desired moisture content for storage [17]. High humidity and frequent rainfall during the harvesting season delay the drying process and can result in a loss of quality by enhancing mould infestation [7,18]. A moisture content of <14% is necessary to keep the aw of maize grain below the safe storage level of 0.6 [19]. In humid and sub-humid tropical regions, maize is harvested with a moisture content around 30% w.b., necessitating drying before safe storage. In the district of Wakiso, conventional sun drying is a common practice for maize drying, which is done by spreading grains on a mat to expose them to sunlight [20]. The shortcomings of this method are an uneven moisture removal; exposure to insects, rodents, birds and dust; and failure to reach a safe moisture content due to a high dependency on the weather conditions [21]. An alternative and affordable method for smallholder farmers is the use of solar dryers. There are different types of solar driers used to dry cereals in Africa, but due to economic and technological constraints, their application has been obscured [22]. The solar tunnel dryer is a forced–convection direct- type solar dryer that was developed at the University of Hohenheim [23]. It was first applied to dry fruits and showed advantages by significantly reducing the drying time and mass loss while protecting the crops from dust, rain, animals, and insects [24]. Its application in cereal drying, initially with paddy rice, was promising, but improvements were needed, such as the ability to mix the grains to achieve a homogeneous drying process [25]. The inflatable solar dryer was developed in collaboration with the International Rice Research Institute (IRRI) as an improved version, which is adapted to cereal crops in tropical regions [26,27]. Asemu et al. [28] conducted experiments on the use of an inflatable solar dryer to dry maize. Assuming a thin layer drying model, they proved that the diffusion approach fitted their results better.
The objective of this study was to assess the performance of an inflatable solar dryer (ISD) compared to open sun drying, referred to as direct sun drying (DSD), for maize drying with regard to the product quality. The quality parameters assessed were the moisture content, mycotoxins (total aflatoxins), yeasts, and moulds, as well as maize colour. The results of this research allowed us to draw conclusions on the use of an inflatable solar dryer in the postharvest handling of maize and recommendations on the future actions for maize handling to avoid contamination in the value chain.

2. Materials and Methods

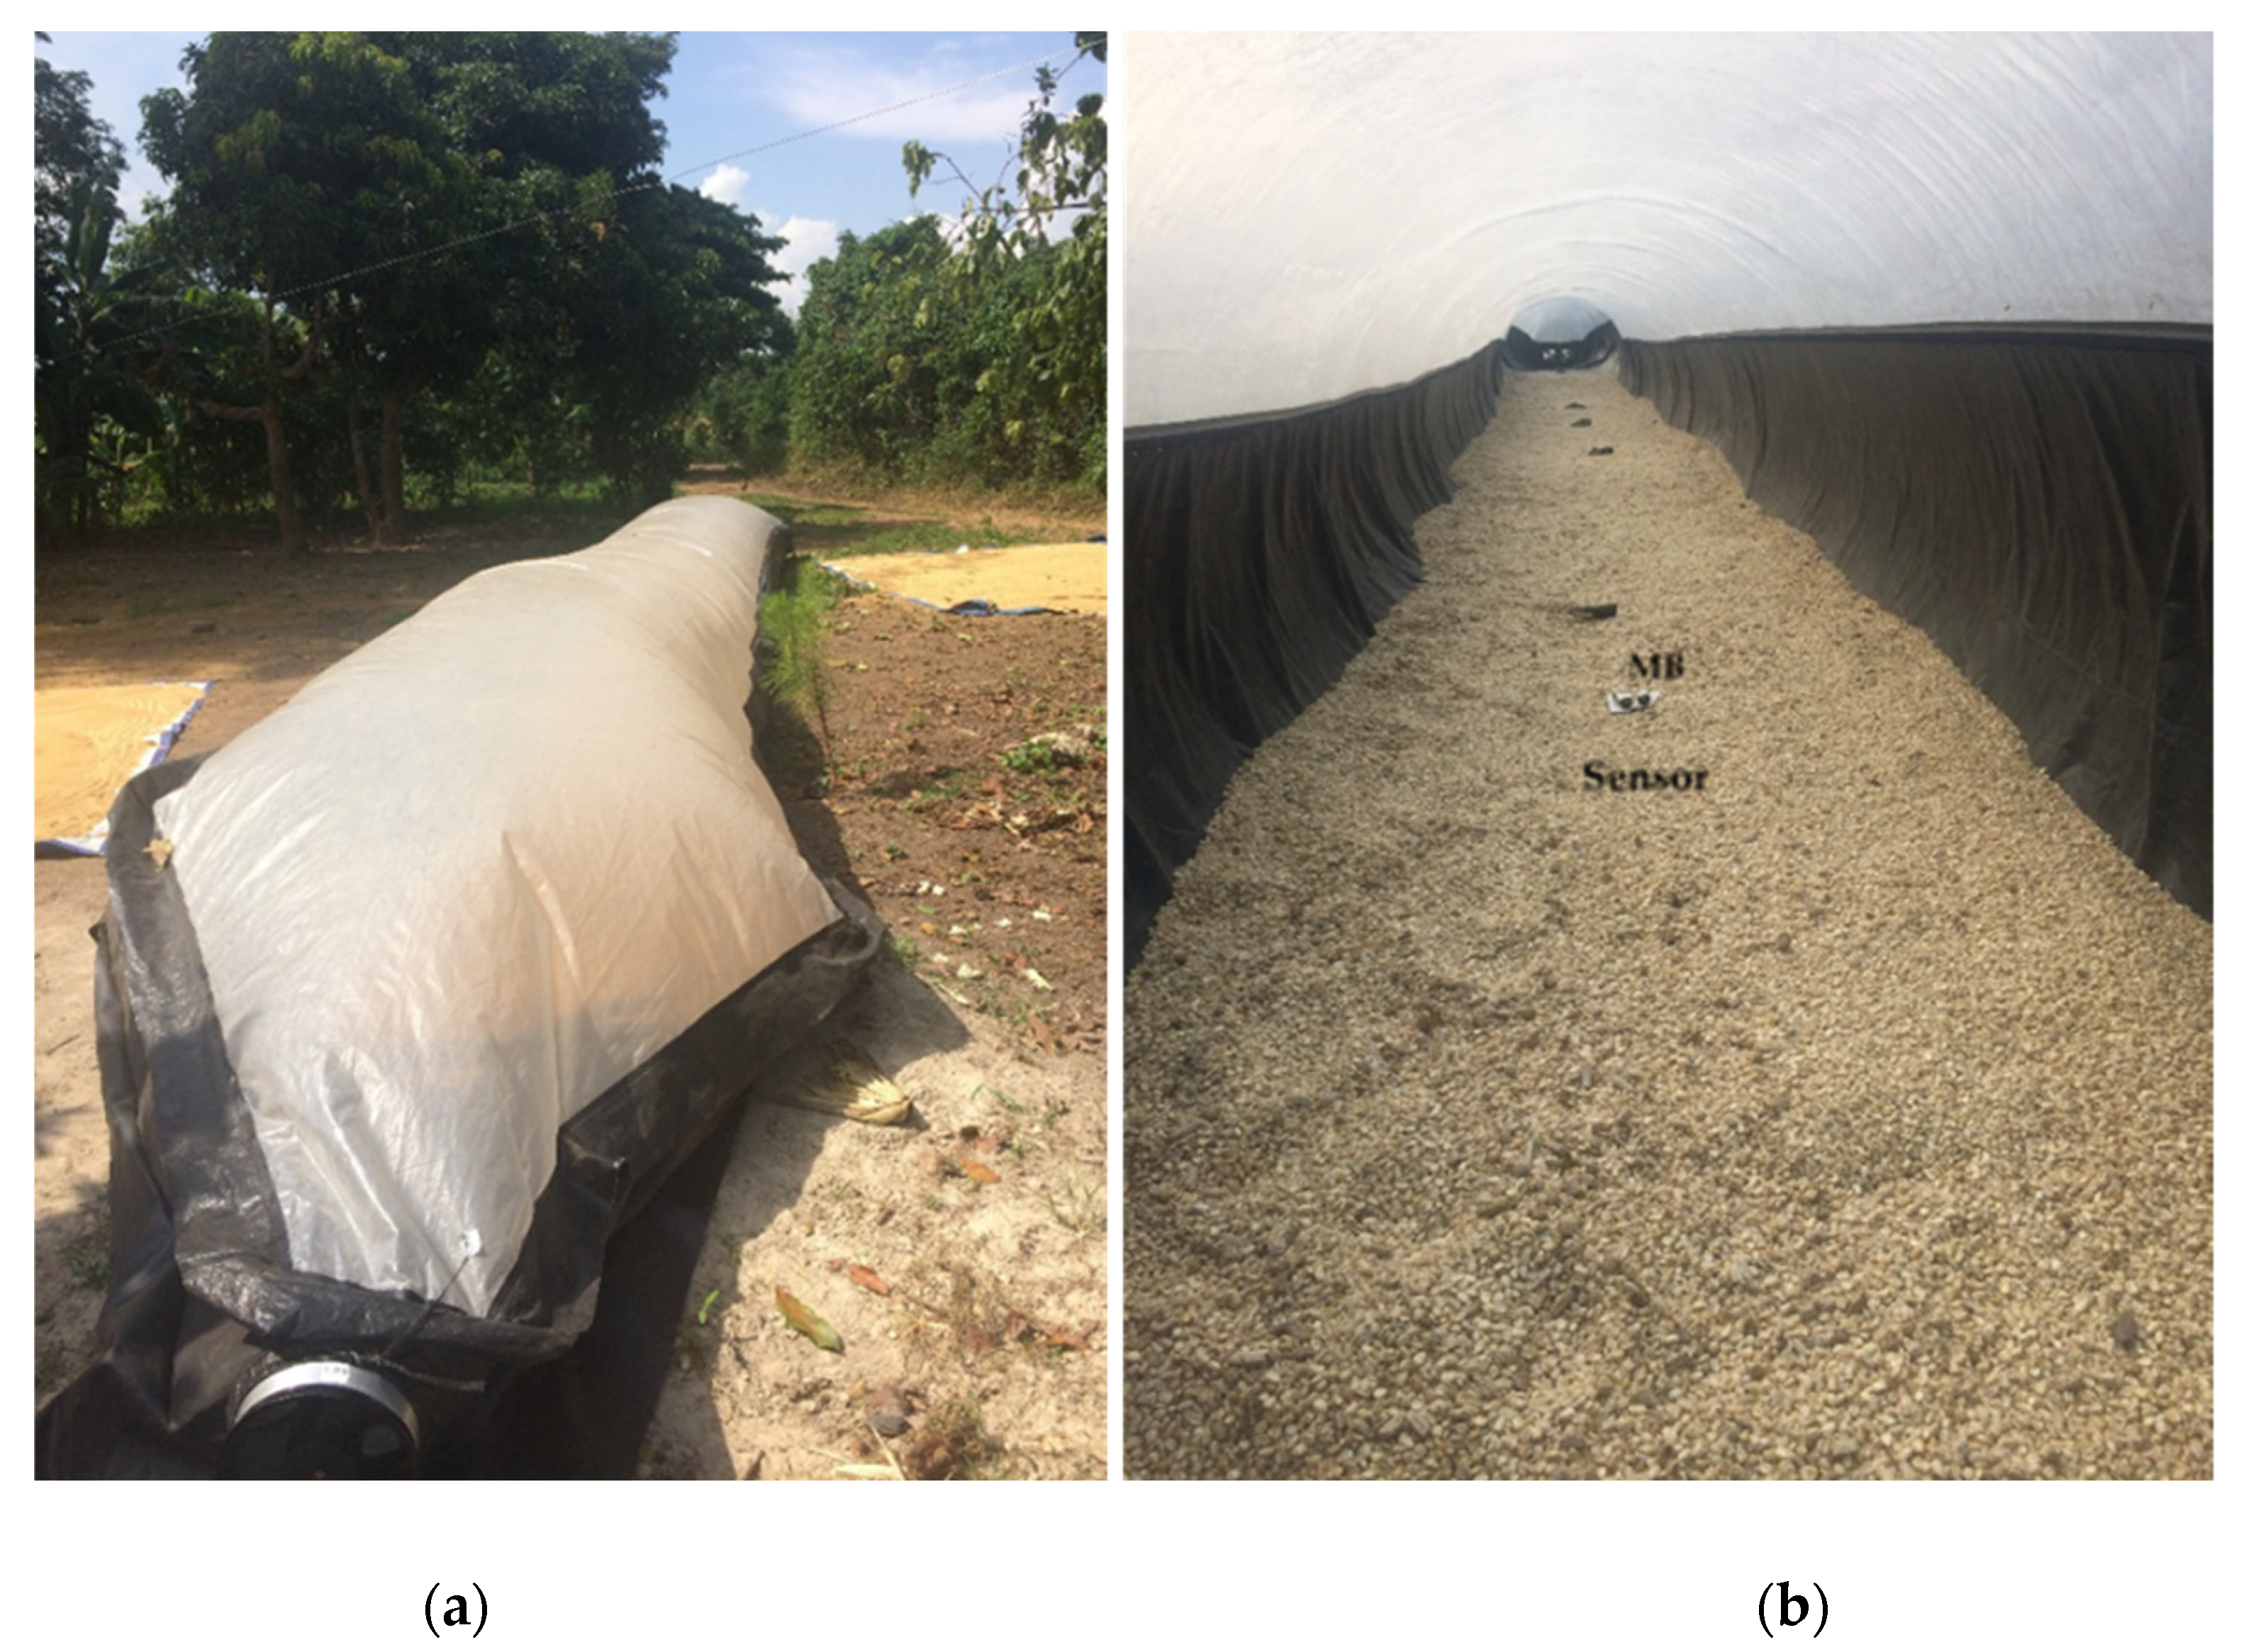
2.1. Inflatable Solar Dryer (ISD)

The ISD (SBD 25, GrainPro Inc., Zambales, the Philippines) was used for the drying experiments, with the two main components used to manufacture the ISD being a UV-stabilized transparent polyethylene (PE) film (150 µm thick), which is used for the top part of the dryer; and a reinforced black polyvinyl chloride (PVC) film as the bottom of the dryer, both connected by a zipper [26]. The dryer had a length of 26 m and a width of 2 m. Figure 1 shows pictures of the dryer during the experiments.
The air flow was produced by one 12-V DC axial flow fan (RDF2589B12N18S, Runda Electronics CO., LTD, Shenzhen, China) powered by one 100-W peak solar panel and a 75-Ah solar battery. The recorded average air velocity during the drying experiments was 4.13 m s−1. Maize was spread on a tarpaulin next to the ISD for direct sun drying (DSD).

2.2. Drying Experiments

2.2.1. Experimental Site and Raw Material

Three experimental batches of maize were dried using both an ISD and under direct sun (DSD) near the city of Gombe in the Wakiso District of Uganda. The experimental site is located at coordinates 0°32′01.2″ S and 31°37′39.0″ E. The experiments took place during the months of July and August, the driest months in the Lake Victoria Crescent AEZ, with an average 67 mm of rainfall. The average solar radiation of 438.4 W m−2 was measured throughout the experiments using a solar data logger (DL-131 LUX, Voltcraft, Hirschau, Germany). Maize was supplied by local farmers in bags and was loaded into the ISD and spread on the bottom surface in a 2-to-3-cm-thick layer. For DSD, maize was spread on a tarpaulin with the same grain layer thickness next to the ISD. The experiments were conducted during the daytime and ended when the moisture content of the grains reached the recommended level (14% w.b.). The moisture content was measured at the beginning of the drying experiment (to account for the difference in the moisture content as they were harvested at different periods of time) and at constant intervals until the end of the experiment.

2.2.2. Performance Evaluation

Miniature USB data loggers for the temperature and relative humidity (DL-181THP, DL-210 TH, and DL-111K; Voltcraft, Hirschau, Germany) were placed at different locations inside the ISD, as well as on the tarpaulin for DSD to monitor the drying process (see Figure 1). The sensors were collecting temperature and relative humidity data at constant intervals during each experimental period for each batch. For monitoring of the moisture content of the grains, mesh bags were placed inside the ISD and weighed every hour. Three samples per batch were collected at the beginning of the experiments, as well as at the end for the quality analysis. At the beginning of each experiment, the samples were collected randomly in different bags supplied by farmers. At the end of drying, the samples were also collected randomly from different positions in the dryer. The samples were then thoroughly mixed to make an aggregate sample. They were finally transported to the laboratory and stored at −18 °C in sealed bags before analysis.

2.2.3. Absolute Humidity Calculation

Temperature and relative humidity data were used to calculate the absolute humidity x, expressed in g kg−1, using Equation (1):
x = 0.622 · φ / 100 · p s p φ / 100 · p s
where φ is the relative humidity in %, p is the ambient pressure in hPa, and ps is the saturation pressure in hPa, which was calculated using the formula given by Tetens, shown in Equation (2) [29]:
p s = 1.33   ×   10 ( 7.5   ·   ϑ ϑ + 237.3   +   0.66 )
where ϑ is the temperature of the air in °C.

2.2.4. Moisture Content Analysis

The moisture content of maize samples was measured using the oven method. The sample was ground and homogenized. From the sample, 10 g was placed in weighed crucibles and dried in an oven (Memmert UM 700, Memmert GmbH & Co. KG, Schwabach, Germany) for 24 h at 105 ℃, and the final weight was taken. The moisture content MCwb (%) was calculated using Equation (3):
MC wb = m i   m f m i · 100
where mi (g) is the initial mass before drying, and mf (g) is the final mass after drying.
To compare the drying experiments with different initial MC, the moisture ratio MRt (-) was calculated using Equation (4):
MR t = MC t   MC eq MC in     MC eq
where MCt (d.b.) is the moisture content at time t, MCin (d.b.) is the initial moisture content, and MCeq. (d.b.) is the equilibrium moisture content.

2.3. Quality Analysis

2.3.1. Yeasts and Moulds Enumeration

For yeasts and moulds enumeration, the pour plate method was used as suggested in the standard method [30]. The test sample was extracted in a stomacher (BagMixer 400 SW, Interscience, Saint Nom la Brétèche, France) with peptone water. The extract (1/10) was further diluted to a dilution of 10−6. A 1-mL droplet of each dilution was transferred to a Petri dish, and approximately 20 mL of agar (Dichloran Rose-bengal Chloramphenicol) were added and left to solidify. The Petri dishes were incubated at 25 °C for 1 week with intermediary colony counting after four days. Petri dishes with countable colonies were considered for the log yeasts and moulds colony count N divided by the sample dry weight, expressed as CFU g−1 dry weight, using Equation (5) [31]:
N = log 10 ( C w . ( n 1 + 0.1 · n 2 ) · d )
where ∑C is the sum of the colonies counted on the considered plates, n1 is the number of plates counted in the first dilution, n2—is the number of plates counted in the second dilution, w—is the dry weight, and d—the dilution from which the first count was obtained.

2.3.2. Total Aflatoxins Analysis

A competitive enzyme immunoassay method by RIDASCREEN® was used for the quantitative determination of the total aflatoxins. A ground and homogenized sample of 2 g was extracted with 100 mL of 70% methanol, and the extract was filtered with No. 1 filter paper. The filtrate was diluted to the ratio of 1:7 and 50 µL of the extract, and the standards were added to their respective wells for total aflatoxins determination. A conjugate, as well as the antibodies, were added to each well and left to react for 30 min at room temperature (20–25 °C). The liquid was poured out of the wells, and they were washed with buffer solution three times. Chromogen was added to each well and left to incubate for 15 min at room temperature. A stop solution was then added. The measurements were performed at 450 nm with a UV photometric microwell reader (Epoch, BioTek, Winooski, VT, USA). The percentage absorbances of the different standards were calculated from the zero standard and drawn on a semi-logarithmic graph against the aflatoxin concentration to obtain a calibration curve. The concentrations contained in the samples were read on the curve and further multiplied by the corresponding dilution factor to obtain the concentration that was corrected to be reported on a dry basis.

2.3.3. Colour Measurement

Colour measurements were taken using a reflectance colorimeter (CR–400 Minolta Co, Ltd., Chiyoda, Japan) with a 2° observer that closely matched the CIE 1931 standards observer [32]. A standard white plate with D65 illumination (Ύ = 93.7, x = 0.3158, and y = 0.3324) was used to calibrate the instrument prior to the measurements. The measurements were taken in triplicate and randomly on different maize kernels spread on a plate by placing the instrument on top of the kernel. The colour parameters were expressed in terms of L* related to the lightness (L* = 0 for black and L* = 100 for white), a*, which represents the intensity in green–red (a* < 0 for green and a* > 0 for red), and b*, which describes the intensity in blue–yellow (b* < 0 for blue and b* > 0 for yellow). From the a* and b* values, the chroma and hue were computed. Chroma (C*) indicates the colour saturation, which is proportional to its intensity and is calculated using Equation (6):
C * = a * 2 + b * 2
For the hue, an angle of 0° indicates a red hue, while the angles of 90°, 180°, and 270° indicate yellow, green, and blue hues, respectively. To obtain the hue, Equation (7) was used.
h o = arctan ( b * a * )
Colour alterations were estimated and expressed as the total colour difference ∆E* of the samples before and after drying using Equation (8):
Δ E * = Δ L * 2 + Δ a * 2 + Δ b * 2

2.4. Statistical Data Analysis

Significant differences were determined by an analysis of variance (ANOVA) using the Generalized Linear Model (GLM) procedure of SAS® 9.4 (SAS Institute Inc., Cary, NC, USA). The least square difference (LSD) option was used to evaluate the differences among the means. Graphs were constructed with the software Origin Pro version 2019a (OriginLab® Corporation, Northampton, MA, USA).

3. Results

3.1. Performance Evaluation

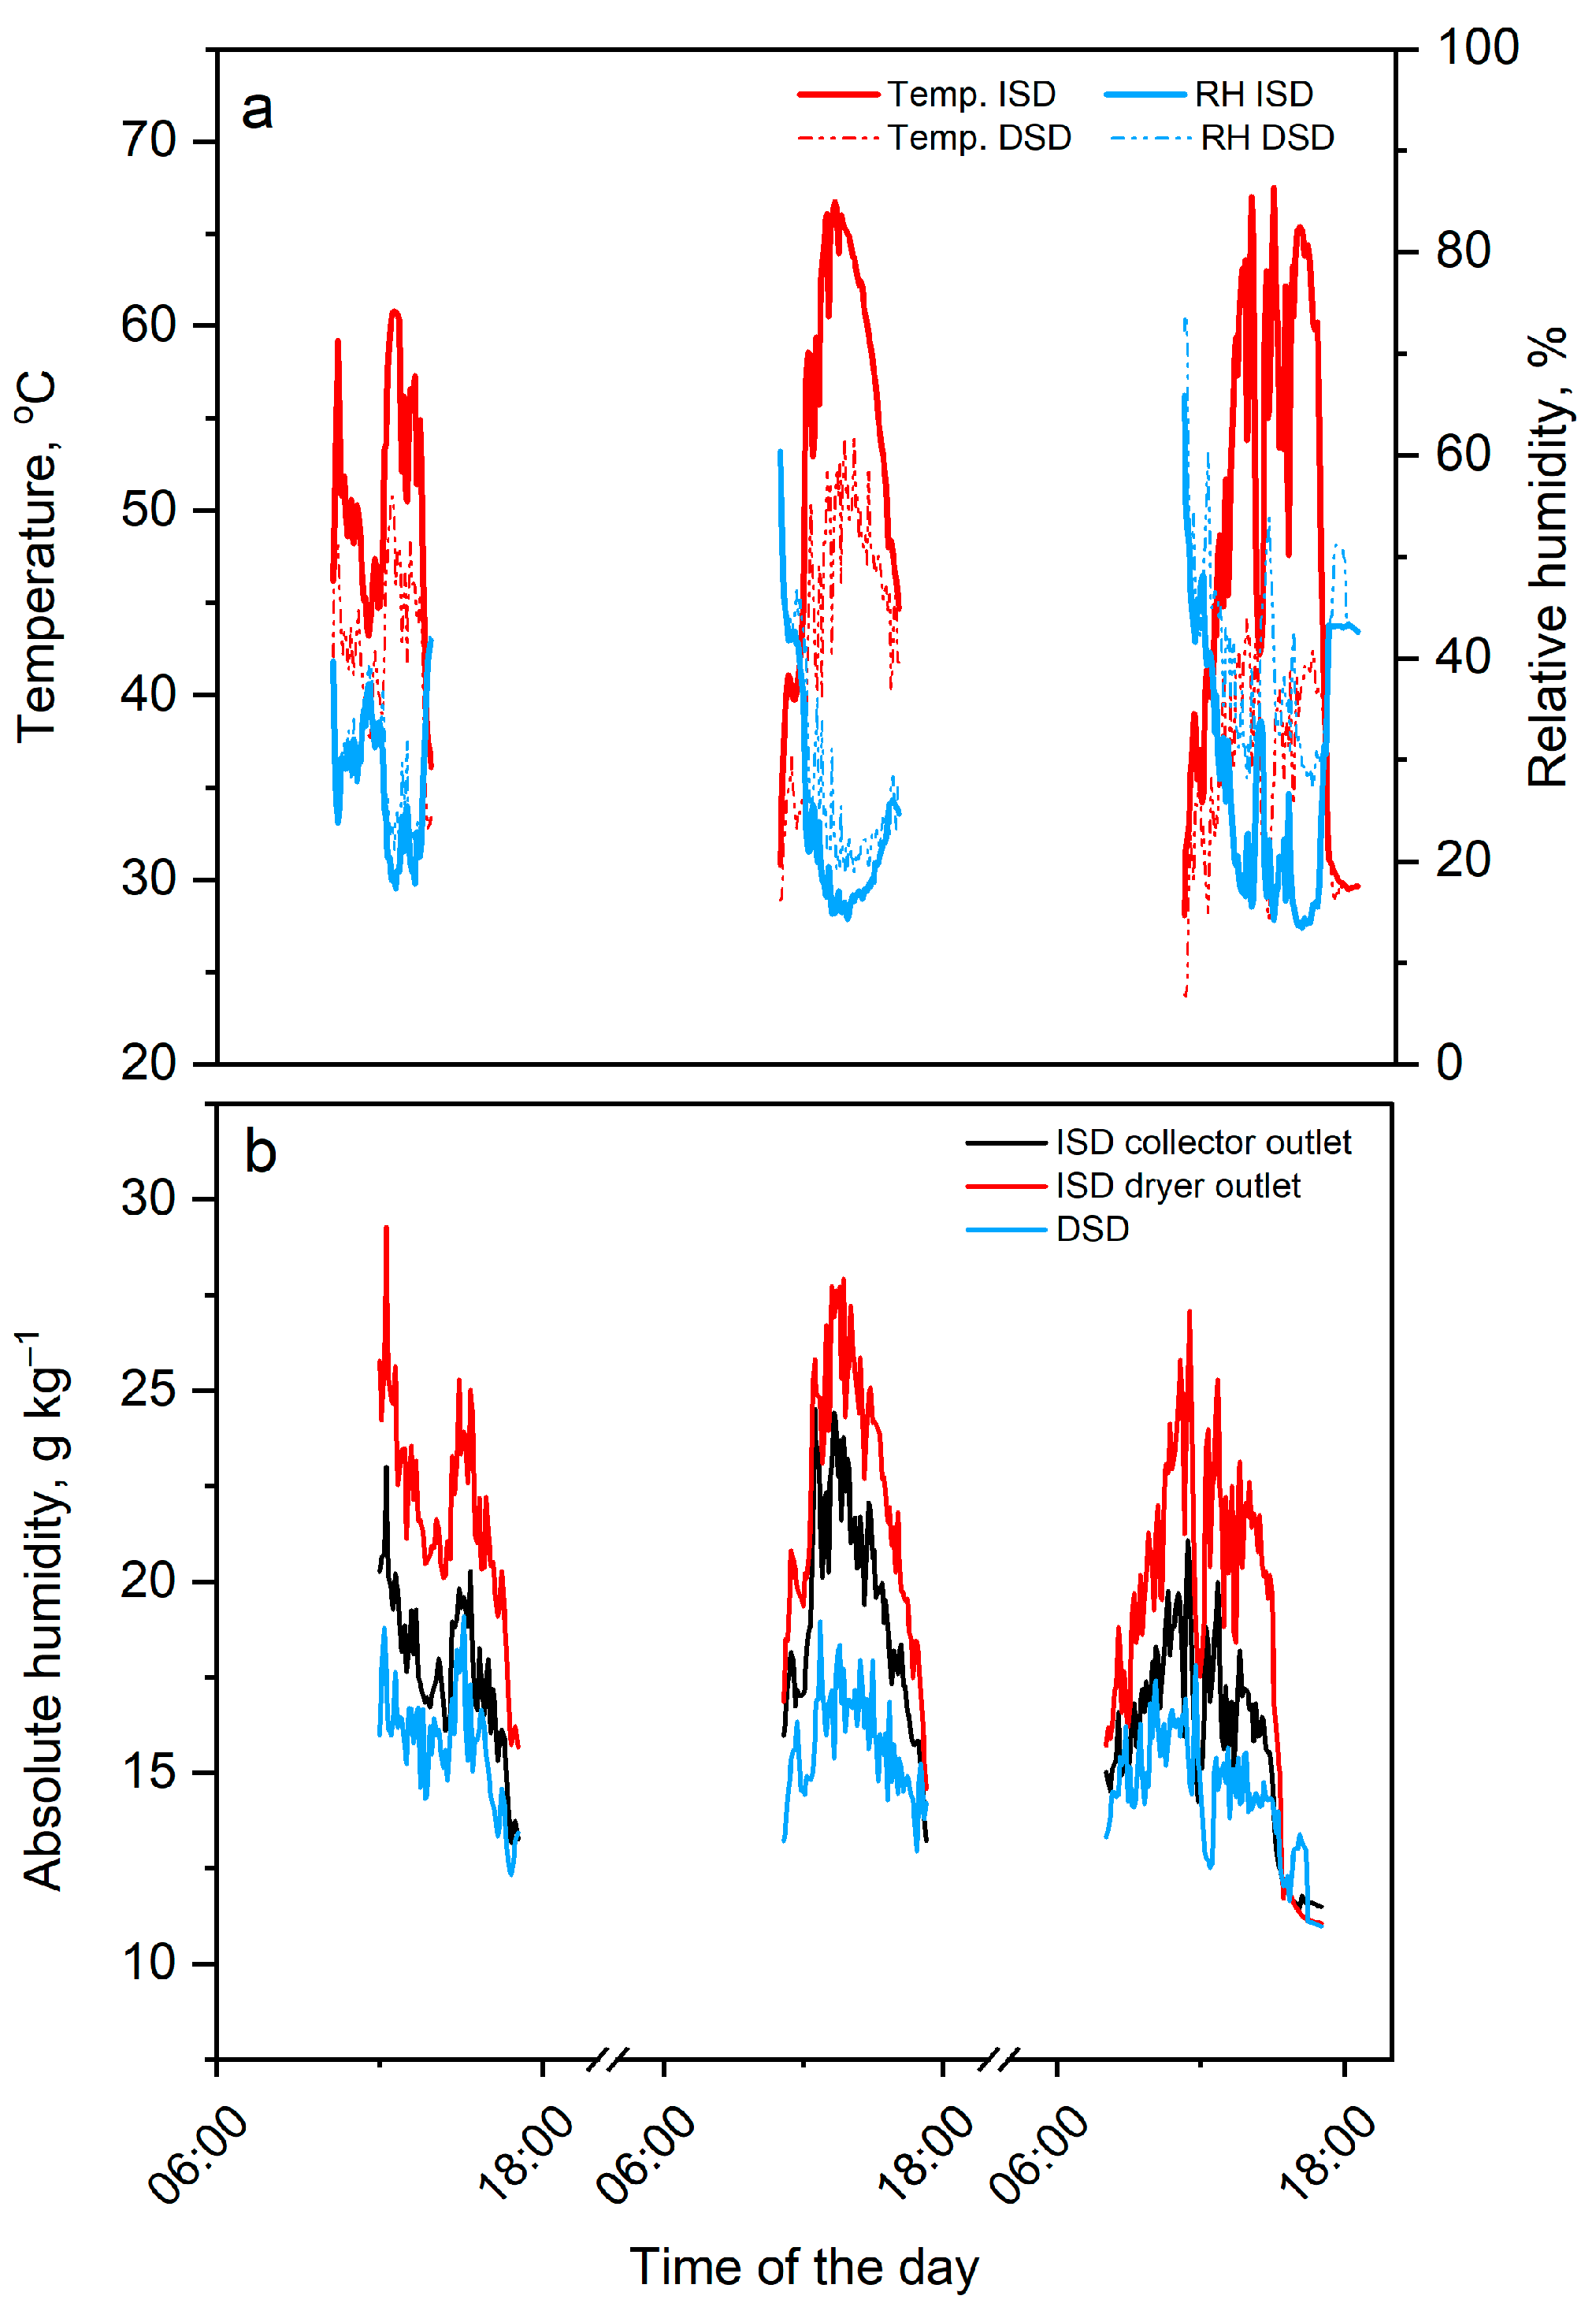
3.1.1. Temperature, Relative Humidity, and Water Content in Air

The results of the temperature and relative humidity collected by the sensors installed inside the ISD and on the tarpaulin for DSD are presented in Figure 2, together with the calculated absolute humidity (water content in the air) for batch 1.
A significant higher temperature was recorded in the ISD compared to the conditions under DSD (pα≤0.05 = 0.0001). An average temperature of 47 °C was recorded in the ISD, 7 °C higher than the temperature under DSD. The maximum temperature in the ISD was reached at 13:30 on the second day of the drying experiment with a temperature of 63.7 °C, while, for DSD, the maximum temperature was only 54 °C. An average relative humidity of 28% was recorded in the ISD, and for DSD, the average relative humidity was 34%. The minimum relative humidity of 14% was recorded inside the ISD at the same time when the temperature was highest, while, for the DSD, the minimum relative humidity was 19%. The change of the relative humidity in the ISD and for DSD is a typical characteristic of a psychometric heating process where the increase in air temperature at a constant humidity results in a reduction of the relative humidity [29].
The absolute humidity, which is the measurement of the amount of water vapour in the air; inside the ISD, it was higher than the one observed for DSD. This is explained by the uptake of vapour from the evaporation of water in the maize grains. For the same reason, the absolute humidity was higher at the outlet of the dryer compared to the outlet of the solar collector. The maximum absolute humidity of 27.37 g kg−1 was recorded at 13:00 at the outlet of the ISD, the time when the temperature was highest. The saturation deficit was 10% lower than the one recorded for sun drying, an indicator of an efficient drying process. A similar pattern in absolute humidity was observed in maize drying by Sanghi et al. [33], which was attributed to a higher drying rate, as the temperature was higher inside the ISD.

3.1.2. Drying Curves

The variation of the moisture content during the drying process of maize in the three batches with use of ISD and direct sun drying is shown in Figure 3.
The total drying time for the maize in the ISD was 19.9 h and 10.3 h distributed over 3 days for batches 1 and 2, respectively. For batch 3, it required only 9.5 h to dry the maize to the required moisture content. The starting moisture content for the ISD was 26.6% for batch 1 and 23.6% for batch 2, and the final moisture content was 11.9% and 12.3% for batch 1 and 2, respectively.
For batch 3, the starting moisture content was 17%, and a final moisture content of 11% was reached in 2 days. A small re-humidification of the maize in batch 1 was observed on the third day of the experiment, as a result of the humid conditions prevailing during the night on that day. Due to the difference in the initial moisture content, the moisture ratio was used for a better comparison of the different treatments.
Table 1 shows the t-test comparison of the moisture content of the samples dried by both methods among the three batches.
The starting moisture content for maize dried in the ISD was 23.5% for batch 1 and 21.3% for batch 2, and the final moisture content was 11.9% and 13.2% for batches 1 and 2, respectively. For the maize in batch 3, the starting moisture content was 15.1%, and a final moisture content of 12.5% was reached in 2 days. The significance t-test did not show a difference in the moisture content among the different drying methods (t-test, α = 0.05), except for batch 3. The drying temperature was sufficient to reduce the moisture content to the recommended level within a reasonably short period [33].

3.2. Quality of the Dried Maize

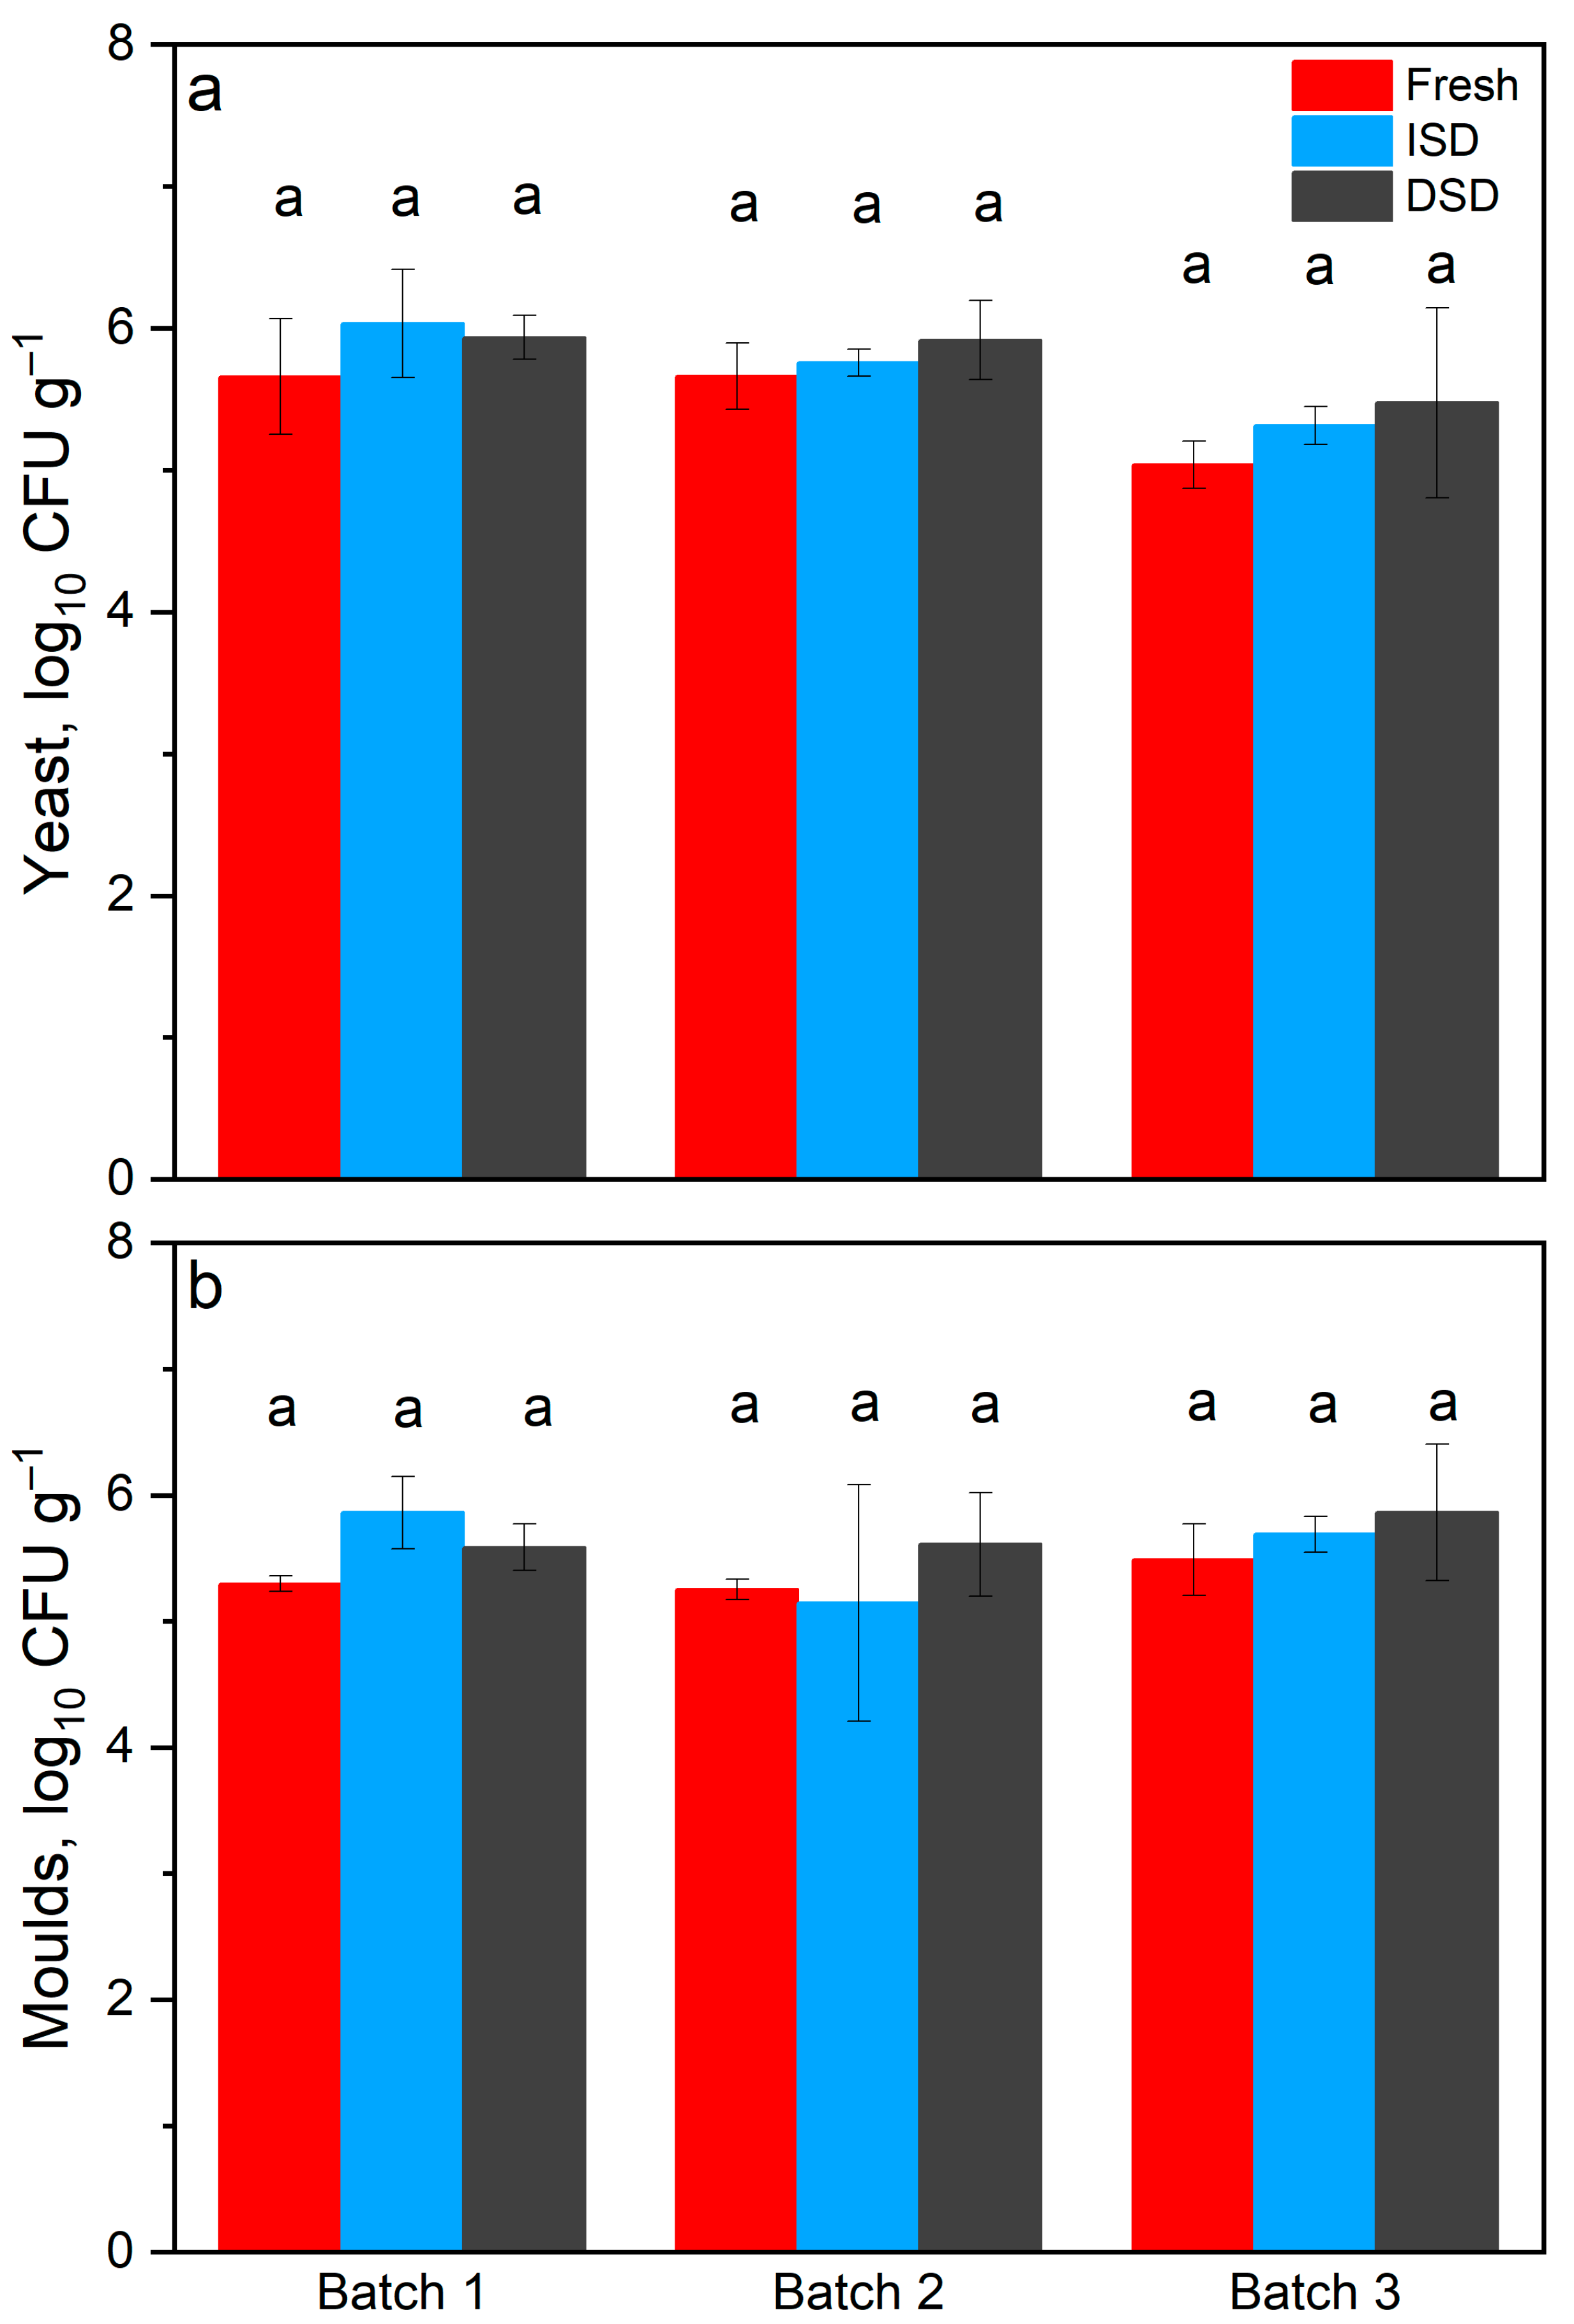
3.2.1. Yeasts and Moulds

The results of the yeast and moulds analysis for different drying treatments of the three batches are summarised in Figure 4.
The yeast log10 colony count ranged from 5.0 to 6.0 CFU g−1, and the moulds log10 colony count ranged from 5.2 to 5.8 CFU g−1, with no significant differences among treatments. The average yeast log10 count was 5.5 ± 0.4 CFU g−1, 5.7 ± 0.4 CFU g−1, and 5.7 ± 0.4 CFU g−1 for fresh maize and maize dried with ISD and DSD, respectively. Similar results were observed for moulds where the log10 colony count ranged from 4.4 to 6.3 CFU g−1. The mean log10 colony count in the three treatments was 5.4 ± 0.2 CFU g−1, 5.7 ± 0.6 CFU g−1, and 5.6 ± 0.6 CFU g−1 for fresh maize and maize dried with ISD and DSD, respectively. The short time of drying was not sufficient for the moulds to develop significantly.

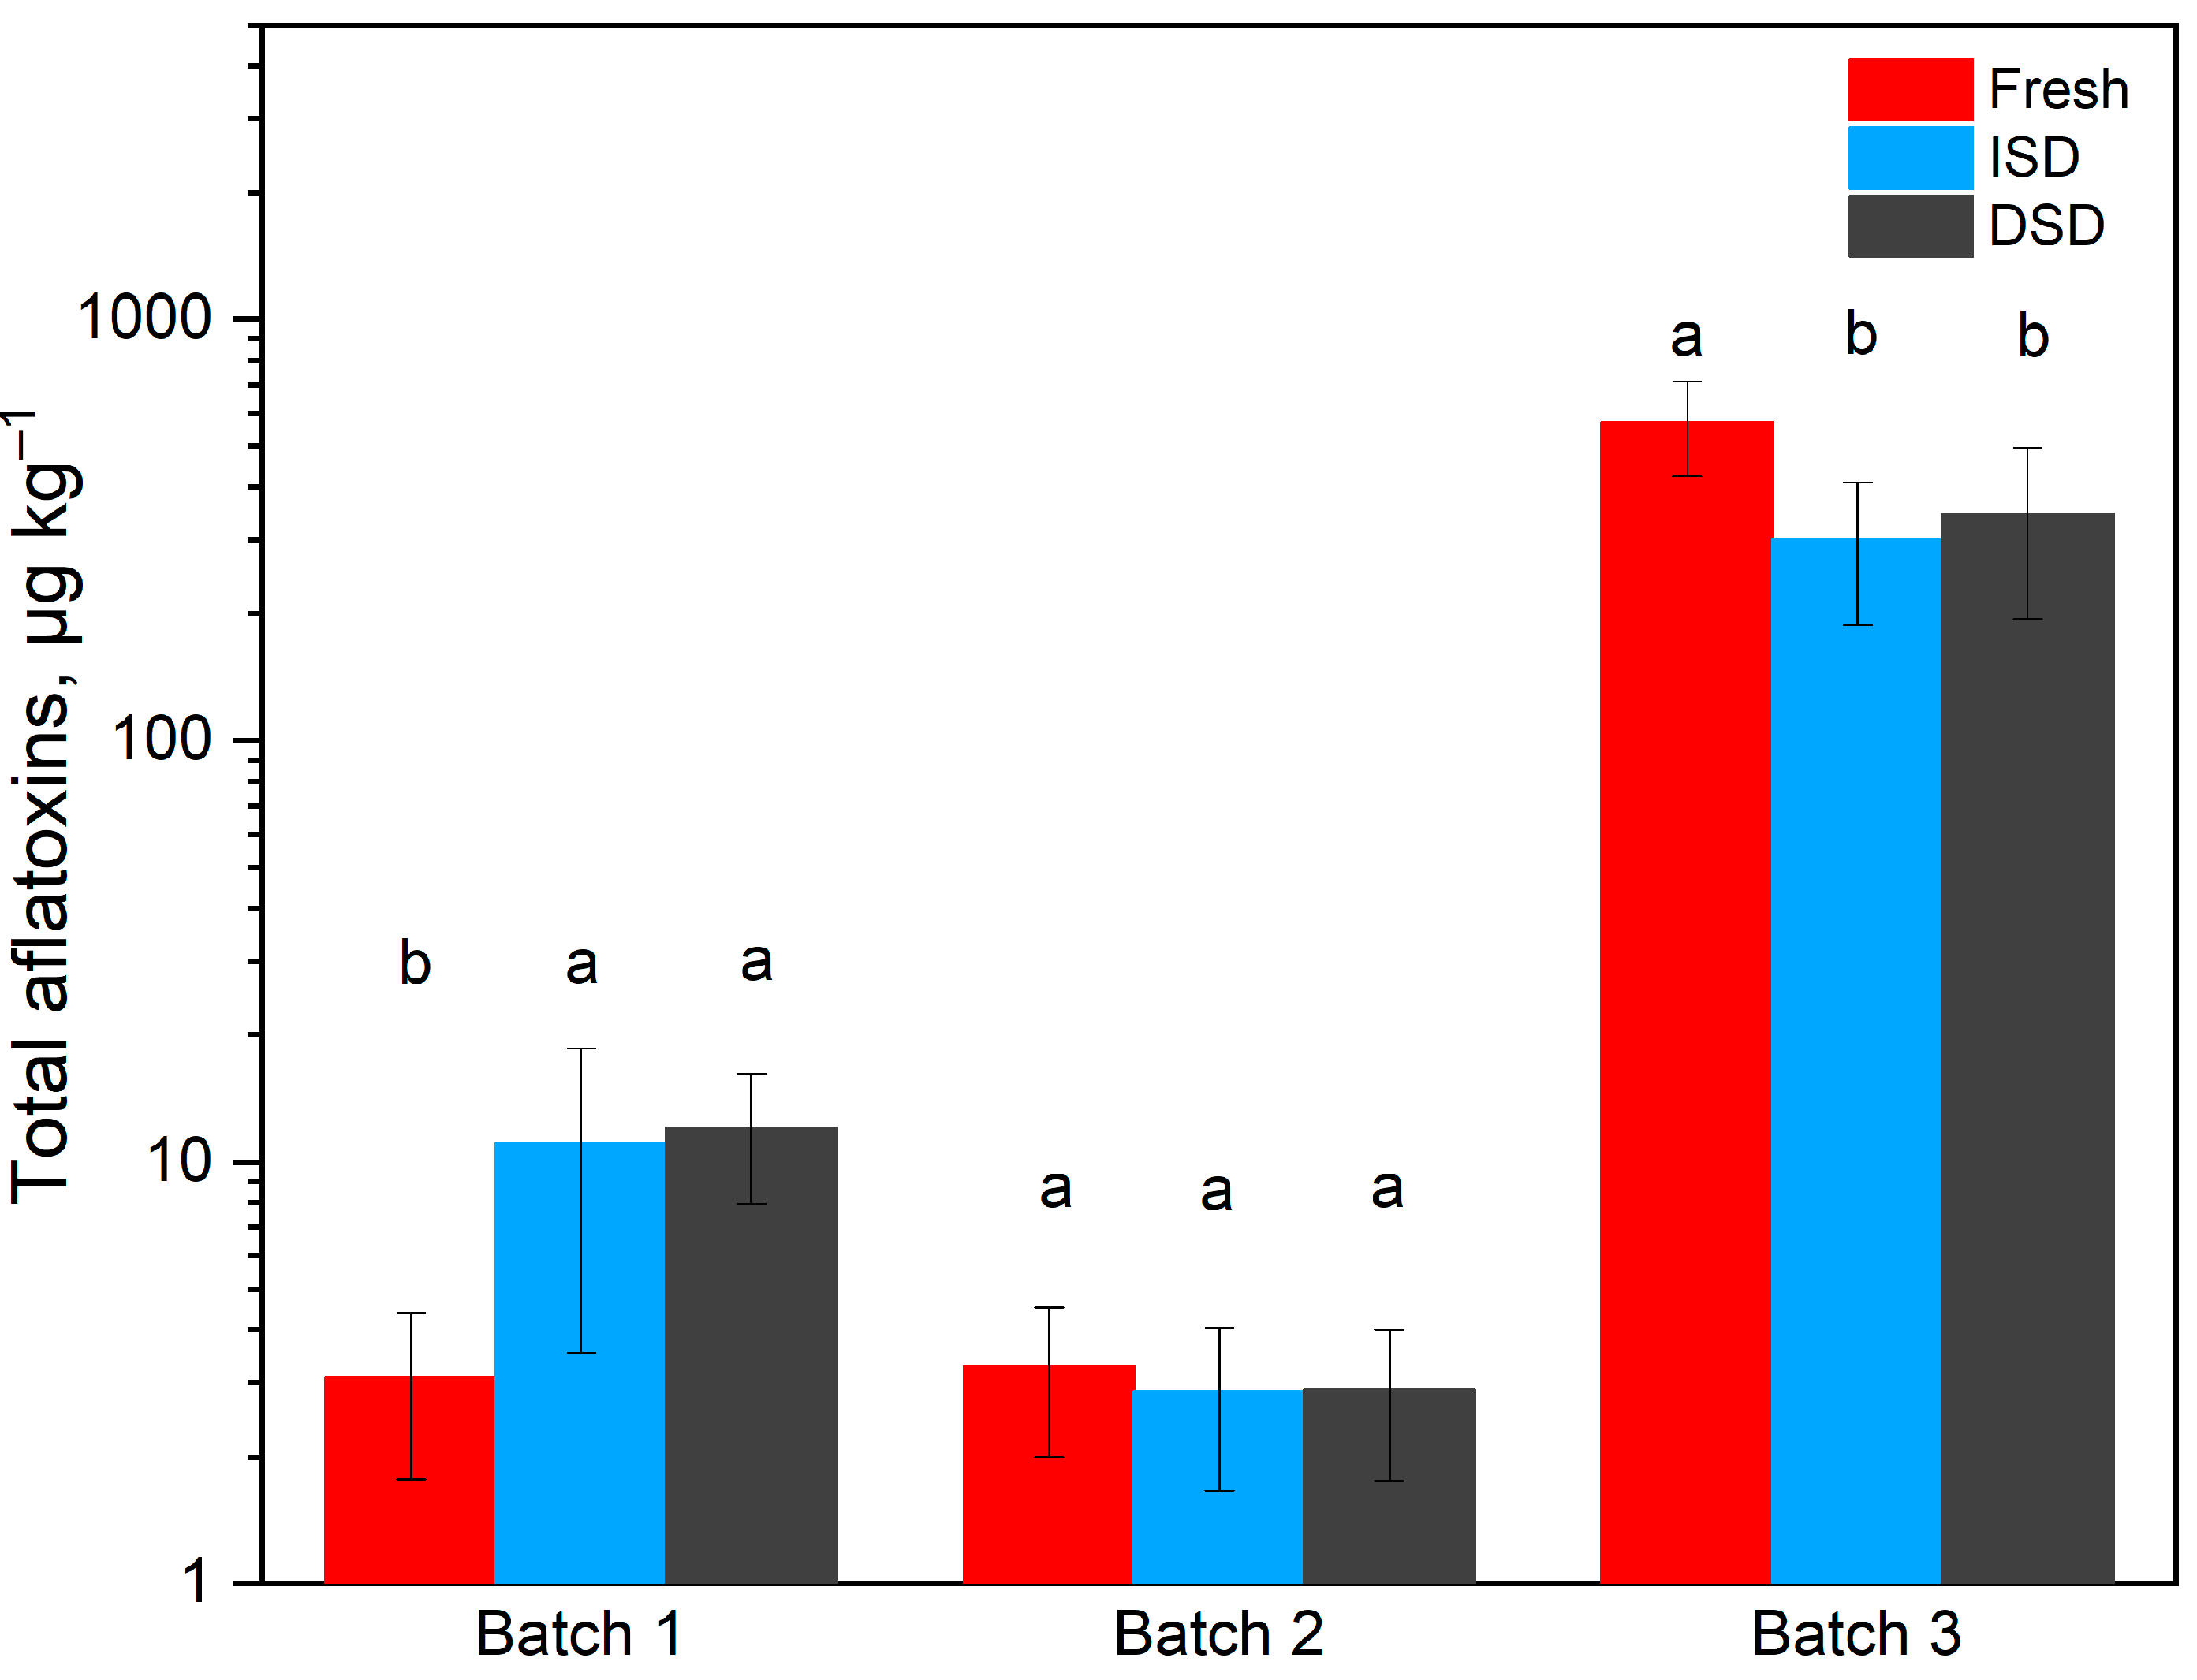
3.2.2. Total Aflatoxin Content

The results of the analysis of the total aflatoxin in fresh maize and maize dried under direct sun and with ISD are presented in Figure 5.
The total aflatoxins analysis showed a high variation in contamination among the batches of fresh maize that were delivered by different farmers. Whereas batches 1 and 2 were well-below the threshold of 10 µg kg−1 fixed by the East African Standard maize specification, and batch 3 was severely contaminated prior to drying, reaching a value of 569.6 µg kg−1. The lower initial MC compared to the other batches suggests that an uncontrolled drying occurred before delivery to the experimental site, resulting in a high production of aflatoxins. During drying, the aflatoxin content in batch 3 could be significantly reduced to 345.5 µg kg−1 for DSD and to 299.2 µg kg−1 for ISD. However, these values were still far above the level for safe consumption. In batch 2, the aflatoxin content of fresh maize of 3.3 µg kg−1 was not affected by drying, whereas, in batch 1, the initial aflatoxin content of 3.1 µg kg−1 significantly increased to 12.1 µg kg−1 for DSD and to 11.1 µg kg−1 for ISD. The reason might be the higher MC during the first night as compared to batch 2 that favours the production of aflatoxins in a humid atmosphere. As a consequence, drying should start in the early morning to reduce the MC sufficiently before sunset.

3.2.3. Colour of Dried Maize

The mean values for the L*, a*, b*, chroma, hue, and total colour difference for maize before drying (fresh); maize dried in an inflatable solar dryer (ISD); and direct sun drying (DSD) are presented in Table 2.
The results show that there was no significant difference in colour due to the drying method. The L* a* b* values for the grains show that the maize was white in colour, as L* was high, with a slight tendency towards pale clean. The b* value, which indicates the variation from yellow to blue, was positive, an indication of the yellow tendency of maize grains [34]. The relatively higher ∆E* value of grains treated by DSD means that there was a slight effect of drying on the colour. However, this change was not statistically significant. Experiments in another study showed that temperatures of 120 °C and higher had a significant influence on maize lightness, redness, and yellowness [19]. Our results are consistent with those of Prachayawarakorn, Soponronnarit, Wetchacama and Chinnabun [16], who analysed the impact of different drying methods on the colour of maize and found that the impact was not significant. Several other scientific publications have also indicated the minor impact of solar drying on a product’s colour [35].

4. Discussion

Inflatable solar dryers have recently become popular in tropical regions, but there is a lack of research on their performance and their effect on the quality of dried products. In this research, the performance of an inflatable solar dryer was compared with direct sun drying (DSD), and the impact on maize quality was evaluated. Five maize quality attributes were evaluated: moisture content, mycotoxins (total aflatoxins), yeasts, and moulds, as well as colour. The temperature in the solar collector was, on average, significantly higher compared to the ambient temperature (Figure 2). The observed drying temperatures were suitable for drying maize with a batch drier. For maize grain intended for flour milling, a maximum temperature of 65 °C is recommended in order to avoid that the high temperature affects the chemical structure and deteriorates the quality [36]. A higher temperature was associated with a lower relative humidity and resulted in higher drying rates. Salvatierra-Rojas, Nagle, Gummert, de Bruin and Müller [26] developed an ISD for drying paddy rice, and the experiments showed that rice was dried to a moisture content of 8% and 12% in dry and rainy seasons, respectively. Asemu, Habtu, Delele, Subramanyam and Alavi [28] evaluated the drying characteristics of maize grain dryed in a solar bubble dryer, where the moisture content reached a safe storage moisture content after 40 h. Comparable performances were achieved for our experiments in terms of the moisture content and drying time. The cascades observed in these curves are characteristic for solar drying systems. They are caused by the diurnal cycle of solar radiation, which, in turn, affects the air temperature [37]. In terms of moisture content reduction, there was no significant difference in the moisture content reduction in maize dried in the ISD compared to the DSD method, because maize reaches the recommended storage moisture content at a comparable time with both methods. Numerous experiments on maize grain storage have shown that maize with an initial moisture content below 14% w.b. could keep the quality attributes like germination capacity, low ethanol and acetic acid contents, and low microbial count under long-term hermetic storage [38]. To stay below this threshold in our experiment, <14%, was considered as a safe moisture content for storage, and drying was stopped when the moisture content reached this level (Figure 3).
The quality parameters analysed showed a slight effect on the maize quality, mostly on the yeast and moulds and the total aflatoxins (Figure 4 and Figure 5). The total aflatoxins was, on average, higher compared to the standard level of 10 µg kg−1 [8]. The results of the yeast and moulds in Figure 4 showed a nonsignificant (p ≤ 0.05) effect of the treatment on the contamination level. Schemminger et al. [39] modelled the impact of ambient air drying on mould growth using a batch dryer. The results showed a mould colony count of up to 107 CFU g−1 in the uppermost layer after 400 h of drying [40]. This is a high level of colony count in comparison to the maximum 1.5 × 10⁶ CFU g−1 observed in maize dried under ISD in 3 days. The mould count could not be reduced, but the risk of an increase in the colony count is the minimum, because the maize was dried to a low moisture content, which does not allow further mould growth. Kaaya and Kyamuhangire [7] reported that mould infection rate varied with the length of storage and dryness of the region, with a highest rate of 50% of the total analysed samples found in the moist mid-altitude regions of Uganda. In Figure 5, a high variation in the total aflatoxin contamination levels of the different samples analysed was observed. The high prevalence of the total aflatoxins in maize in Uganda was previously reported [7,9,10]. In their cross-sectional survey conducted in five major markets in Kampala on different staple crops, Osuret et al. [41] found that 40% of the analysed samples were contaminated by aflatoxins. They also proved that maize samples that were within the permissible safe storage levels of moisture content were less prone to aflatoxin contamination. Raters and Matissek [40] investigated the thermal stability of aflatoxins and showed that Aflatoxin B1 was completely degraded at 150 °C when in the protein matrix. The experimental results in our research showed a slight reduction in the aflatoxin contents in drying treatments compared to fresh maize for batch 3, which might be because of the exposure to high temperatures inside the dryer or under sun drying. Evidences exist of up to a 30% aflatoxin reduction in contaminated maize exposed to the sun for a prolonged period [42]. The contamination level in batch 1, on the other hand, increased from 3.1 µg kg−1 to 12.1 µg kg−1 and 11.1 µg kg−1 for DSD and ISD, respectively. Battilani et al. [43] showed that aflatoxin production is the maximum at temperature between 25 and 30 °C and, mostly, aw above 0.9. Drying with ISD should be planned as best as possible to maximise the solar energy and prevent contamination by mycotoxins. Experiments on rice in Burkina Faso also showed that the ISD dried rice had less aflatoxins and impurities compared to conventional sun-dried rice [27]. This slight effect observed for maize in our research was not significant enough to reduce the contamination level of aflatoxins.

5. Conclusions

In this research, three batches of maize at different moisture contents were successfully dried both by ISD and DSD. The temperature, relative humidity, and moisture content were monitored throughout the experiments. The temperature reached a level sufficient to dry maize with insignificant damage to the quality and was enough to dry maize to the recommended moisture content. The maximum temperature inside the ISD was 63.7 °C, with an overall average of 47 °C. A moisture content below the recommended level of <14% was reached. The original aflatoxin contamination was very high in one of the received maize lots, and a minor reduction by drying was observed in this case. The colour was not significantly affected by the drying process. Although the drying performance in terms of drying time and product quality was similar for both drying methods, the advantage of ISD in reducing the risk of spoilage due to sudden rain was obvious. To maximise the drying performance and minimise the risk of contamination during drying, it is recommended start drying early in the morning to reduce the moisture content sufficiently before sunset. The effect on the aflatoxins was not enough to reach the standard recommendations when the original contamination was high; thus, a rapid and non-destructive method to determine the mycotoxin content of maize ought to be developed to detect contamination at an early stage of the value chain before drying.

Author Contributions

Conceptualisation, J.N., S.S. and S.R.; methodology, J.N. and S.S.; validation, J.M.; formal analysis, J.N.; investigation, J.N., G.A. and S.S.; writing—original draft preparation, J.N.; writing—review and editing, S.S., S.R., C.G.K.C., N.B., G.A. and J.M.; visualisation, J.N.; supervision, J.M.; project administration, S.S. and funding acquisition, S.S., C.G.K.C. and J.M. All authors have read and agreed to the published version of the manuscript.

Funding

This research was financially supported by the German Federal Ministry for Economic Cooperation and Development (BMZ) through the project 15.7860.8-001.00 “Making Value Chains Work for Food and Nutrition Security of Vulnerable Populations in East Africa”, led by the International Centre for Tropical Agriculture (CIAT). The main author was supported by scholarships awarded by DAAD.

Institutional Review Board Statement

Not applicable.

Informed Consent Statement

Not applicable.

Data Availability Statement

Not applicable.

Acknowledgments

The authors wish to acknowledge the Community Enterprises Development Organization (CEDO) in Uganda for their enormous support during the experimental period in Uganda. The authors appreciate the contribution of Sabine Nugent for language editing and the laboratory team of the Agriculture Engineering in the Tropic and Subtropics group for their contribution in the laboratory analysis. Special gratitude is also addressed to Luka Chupona for his assistance.

Conflicts of Interest

The authors declare no conflict of interest.

References

  1. FAO. Uganda-Maize Production Quantity 2018. Available online: http://www.fao.org/faostat/en/#country/226 (accessed on 20 September 2019).
  2. Goletti, F.; Samman, E. Post-Harvest Systems in World Agriculture. In Crop Post-Harvest: Science and Technology, Volume 1: Principles and Practice; Golob, P., Farrell, G., Orchard, J.E., Eds.; Blackwell Science Ltd.: Oxford, UK, 2002; Volume 1. [Google Scholar]
  3. Bradford, K.J.; Dahal, P.; Van Asbrouck, J.; Kunusoth, K.; Bello, P.; Thompson, J.; Wu, F. The dry chain: Reducing postharvest losses and improving food safety in humid climates. Trends Food Sci. Technol. 2018, 71, 84–93. [Google Scholar] [CrossRef]
  4. Lukwago, F.B.; Mukisa, I.M.; Atukwase, A.; Kaaya, A.N.; Tumwebaze, S. Mycotoxins contamination in foods consumed in Uganda: A 12-year review (2006–18). Sci. Afr. 2019, 3, e00054. [Google Scholar] [CrossRef]
  5. Kumar, D.; Kalita, P. Reducing Postharvest Losses during Storage of Grain Crops to Strengthen Food Security in Developing Countries. Foods 2017, 6, 8. [Google Scholar] [CrossRef] [Green Version]
  6. Wilson, D.M.; Payne, G.A. Factors Affecting Aspergillus flavus Group Infection and Aflatoxin Contamination of Crops. In The Toxicology of Aflatoxins; Academic Press: Cambridge, MA, USA, 1994; pp. 309–325. [Google Scholar] [CrossRef]
  7. Kaaya, A.N.; Kyamuhangire, W. The effect of storage time and agroecological zone on mould incidence and aflatoxin contamination of maize from traders in Uganda. Int. J. Food Microbiol. 2006, 110, 217–223. [Google Scholar] [CrossRef]
  8. EAC. Maize Grains Specification; EAS: Assam, India, 2013.
  9. European Commission. Commision Regulation (EC) Setting Maximum Levels for Certain Contaminants in Foodstuffs; 364/365-324; European Commission: Brussels, Belgium, 2006. [Google Scholar]
  10. Udomkun, P.; Wiredu, A.N.; Nagle, M.; Bandyopadhyay, R.; Müller, J.; Vanlauwe, B. Mycotoxins in Sub-Saharan Africa: Present situation, socio-economic impact, awareness, and outlook. Food Control 2017, 72, 110–122. [Google Scholar] [CrossRef]
  11. Asiki, G.; Seeley, J.; Srey, C.; Baisley, K.; Lightfoot, T.; Archileo, K.; Agol, D.; Abaasa, A.; Wakeham, K.; Routledge, M.; et al. A pilot study to evaluate aflatoxin exposure in a rural Ugandan population. Trop. Med. Int. Health 2014, 19, 592–599. [Google Scholar] [CrossRef]
  12. Kang, M.-S.; Nkurunziza, P.; Muwanika, R.; Qian, G.; Tang, L.; Song, X.; Xue, K.; Nkwata, A.; Ssempebwa, J.; Lutalo, T.; et al. Longitudinal evaluation of aflatoxin exposure in two cohorts in south-western Uganda. Food Addit. Contam. Part A 2015, 32, 1322–1330. [Google Scholar] [CrossRef] [Green Version]
  13. Pitt, J.I.; Hocking, A.D. Fungi and Food Spoilage, 3rd ed.; Springer: Boston, MA, USA, 2009; p. 520. [Google Scholar]
  14. Bennett, J.W.; Klich, M. Mycotoxins. Clin. Microbiol. Rev. 2003, 16, 497–516. [Google Scholar] [CrossRef] [Green Version]
  15. Squire, R. Ranking animal carcinogens: A proposed regulatory approach. Science 1981, 214, 877–880. [Google Scholar] [CrossRef]
  16. Prachayawarakorn, S.; Soponronnarit, S.; Wetchacama, S.; Chinnabun, K. Methodology for enhancing drying rate and improving maize quality in a fluidised-bed dryer. J. Stored Prod. Res. 2004, 40, 379–393. [Google Scholar] [CrossRef]
  17. FAO. Crop Calendar—An Information Tool for Seed Security. Available online: www.fao.org/agriculture/seed/cropcalendar/welcome.do (accessed on 29 October 2019).
  18. Wamatsembe, I.M.; Asea, G.; Haefele, S.M. A Survey: Potential Impact of Genetically Modified Maize Tolerant to Drought or Resistant to Stem Borers in Uganda. Agronomy 2017, 7, 24. [Google Scholar] [CrossRef] [Green Version]
  19. Mühlbauer, W.; Müller, J. Maize (Zea mays L.). In Drying Atlas; Mühlbauer, W., Müller, J., Eds.; Woodhead Publishing: Sawston, UK, 2020; pp. 75–84. [Google Scholar]
  20. Kaminski, J.; Christiaensen, L. Post-harvest loss in sub-Saharan Africa—What do farmers say? Glob. Food Secur. 2014, 3, 149–158. [Google Scholar] [CrossRef] [Green Version]
  21. Fudholi, A.; Sopian, K.; Ruslan, M.; Alghoul, M.; Sulaiman, M. Review of solar dryers for agricultural and marine products. Renew. Sustain. Energy Rev. 2010, 14, 1–30. [Google Scholar] [CrossRef]
  22. Udomkun, P.; Romuli, S.; Schock, S.; Mahayothee, B.; Sartas, M.; Wossen, T.; Njukwe, E.; Vanlauwe, B.; Müller, J. Review of solar dryers for agricultural products in Asia and Africa: An innovation landscape approach. J. Environ. Manag. 2020, 268, 110730. [Google Scholar] [CrossRef] [PubMed]
  23. Lutz, K.; Mühlbauer, W.; Müller, J.; Reisinger, G. Development of a multi-purpose solar crop dryer for arid zones. Sol. Wind Technol. 1987, 4, 417–424. [Google Scholar] [CrossRef]
  24. Lutz, K.; Mühlbauer, W. Solar tunnel dryer with integrated collector. Dry. Technol. 1986, 4, 583–603. [Google Scholar] [CrossRef]
  25. Djokoto, I.K.; Maurer, R.; Mühlbauer, W. A solar tunnel dryer for drying paddy. Agric. Mech. Asia Afr. Lat. Am. 1989, 20, 41–43. [Google Scholar]
  26. Salvatierra-Rojas, A.; Nagle, M.; Gummert, M.; de Bruin, T.; Müller, J. Development of an inflatable solar dryer for improved postharvest handling of paddy rice in humid climates. Int. J. Agric. Biol. Eng. 2017, 10, 269–282. [Google Scholar] [CrossRef]
  27. Romuli, S.; Schock, S.; Somda, M.K.; Müller, J. Drying Performance and Aflatoxin Content of Paddy Rice Applying an Inflatable Solar Dryer in Burkina Faso. Appl. Sci. 2020, 10, 3533. [Google Scholar] [CrossRef]
  28. Asemu, A.M.; Habtu, N.G.; Delele, M.A.; Subramanyam, B.; Alavi, S. Drying characteristics of maize grain in solar bubble dryer. J. Food Process. Eng. 2019, 43, e13312. [Google Scholar] [CrossRef]
  29. Mühlbauer, W. Handbuch der Getreidetrocknung: Grundlagen und Verfahren; Agrimedia: Clenze, Germany, 2009; p. 523. [Google Scholar]
  30. International Organization for Standardization. Microbiology of Food and Animal Feeding Stuffs—General Requirements and Guidance for Microbiological Examinations; EN ISO 7218; International Organization for Standardization: Geneva, Switzerland, 2007; Volume 66. [Google Scholar]
  31. International Organization for Standardization. Microbiology of Food and Animal Feeding Stuffs—Horizontal Method for the Enumeration of Yeast and Moulds; ISO 21527-2; International Organization for Standardization: Geneva, Switzerland, 2008; pp. 1–9. [Google Scholar]
  32. Argyropoulos, D.; Müller, J. Kinetics of change in colour and rosmarinic acid equivalents during convective drying of lemon balm (Melissa officinalis L.). J. Appl. Res. Med. Aromat. Plants 2014, 1, e15–e22. [Google Scholar] [CrossRef]
  33. Sanghi, A.; Ambrose, R.P.K.; Maier, D. CFD simulation of corn drying in a natural convection solar dryer. Dry. Technol. 2017, 36, 859–870. [Google Scholar] [CrossRef]
  34. Floyd, C.D.; Rooney, L.W.W.; Bockholt, A.J.; Bockholt, A.J. Measuring Desirable and Undesirable Color in White and Yellow Food Corn. Cereal Chem. 1995, 72, 488–490. [Google Scholar]
  35. Gunasekaran, S.; Paulsen, M.R. Breakage Resistance of Corn as a Function of Drying Rates. Trans. ASAE 1985, 28, 2071–2076. [Google Scholar] [CrossRef]
  36. Sacilik, K.; Keskin, R.; Elicin, A.K. Mathematical modelling of solar tunnel drying of thin layer organic tomato. J. Food Eng. 2006, 73, 231–238. [Google Scholar] [CrossRef]
  37. Müller, J.; Mühlbauer, W. Solar Drying. In Modern Drying Technology, 1st ed.; Tsotsas, E., Mujumdar, A.S., Eds.; Wiley-VCH Verlag GmbH & Co. KGaA: Weinheim, Germany, 2012; pp. 199–243. [Google Scholar]
  38. Weinberg, Z.; Yan, Y.; Chen, Y.; Finkelman, S.; Ashbell, G.; Navarro, S. The effect of moisture level on high-moisture maize (Zea mays L.) under hermetic storage conditions—In vitro studies. J. Stored Prod. Res. 2008, 44, 136–144. [Google Scholar] [CrossRef]
  39. Schemminger, J.; Mbuge, D.; Hofacker, W. Ambient air cereal grain drying—Simulation of the thermodynamic and microbial behavior. Therm. Sci. Eng. Prog. 2019, 13, 100382. [Google Scholar] [CrossRef]
  40. Raters, M.; Matissek, R. Thermal stability of aflatoxin B1 and ochratoxin A. Mycotoxin Res. 2008, 24, 130–134. [Google Scholar] [CrossRef] [PubMed]
  41. Osuret, J.; Musinguzi, G.; Mukama, T.; Halage, A.A.; Nati, A.K.; Ssempebwa, J.C.; Wang, J.-S. Aflatoxin Contamination of Selected Staple Foods Sold for Human Consumption in Kampala Markets, Uganda. J. Biol. Sci. 2015, 16, 44–48. [Google Scholar] [CrossRef] [Green Version]
  42. Rustom, I.Y. Aflatoxin in food and feed: Occurrence, legislation and inactivation by physical methods. Food Chem. 1997, 59, 57–67. [Google Scholar] [CrossRef]
  43. Battilani, P.; Leggieri, M.C.; Rossi, V.; Giorni, P. AFLA-maize, a mechanistic model for Aspergillus flavus infection and aflatoxin B1 contamination in maize. Comput. Electron. Agric. 2013, 94, 38–46. [Google Scholar] [CrossRef]
Figure 1. Inflatable solar dryer (ISD): (a) view from outside fully loaded with 1000 kg of maize and (b) inside view during the drying experiment showing the location of different sensors and mesh bags (MB).
Applsci 11 07074 g001
Figure 2. Temperature and relative humidity (a) and absolute humidity (b) in the inflatable solar dryer (ISD) and for direct sun drying (DSD), shown exemplarily for batch 1 of the drying experiment.
Applsci 11 07074 g002
Figure 3. Moisture content (MC) (a) and moisture ratio (MR) (b) vs. time for drying maize in the inflatable solar dryer (ISD) and for direct sun drying (DSD) of three batches: B1, B2, and B3.
Applsci 11 07074 g003
Figure 4. Colony counts per g dry matter for yeast (a) and moulds (b) in maize before drying (fresh) dried in the inflatable solar dryer (ISD) and dried under direct sun (DSD); three batches (Treatments with same letters are not significantly different, p ≤ 0.05).
Applsci 11 07074 g004
Figure 5. Total aflatoxin content in fresh maize, maize dried in the inflatable solar dryer (ISD), and maize dried under direct sun (DSD) for the three batches (Treatments with same letters are not significantly different, p ≤ 0.05).
Applsci 11 07074 g005
Table 1. Moisture content (MC) before drying (fresh) and after drying in the inflatable solar dryer (ISD) and direct sun drying (DSD).
Batch 1Batch 2Batch 3
MCw.b% ± SDMCw.b% ± SDMCw.b% ± SD
ISD11.9 ± 0.4 a13.2 ± 0.3 a12.5 ± 0.5 a
DSD11.9 ± 0.1 a12.3 ± 0.3 a11.0 ± 0.0 b
Means followed by the same letter are not significantly different (p ≤ 0.05).
Table 2. Colour parameters of maize dried by ISD compared to DSD (means comparison t-test).
L*a*b*C*∆E*
Fresh63.4 ± 0.5 a1.9 ± 0.3 a15.3 ± 1.3 a15.4 ± 1.3 a1.5 ± 0.0 a-
ISD61.6 ± 2.4 a2.2 ± 0.1 a15.5 ± 0.6 a15.7 ± 0.6 a1.4 ± 0.0 a2.8 ± 1.73 a
DSD66.0 ± 5.3 a2.0 ± 0.2 a16.1 ± 2.3 a16.1 ± 2.3 a1.4 ± 0.0 a5.1 ± 3.0 a
LSD6.590.482.542.550.02311.26
Notes: Means followed by the same letter are not significantly different (p ≤ 0.05).
Publisher’s Note: MDPI stays neutral with regard to jurisdictional claims in published maps and institutional affiliations.

