
Examination of Photo-, Mixo-, and Heterotrophic Cultivation Conditions on Haematococcus pluvialis Cyst Cell Germination


Abstract
:1. Introduction
2. Materials and Methods
2.1. Chemicals and Solvents
2.2. Cultivation of H. pluvialis Cyst Cells
2.3. Germinatin of H. pluvialis Cyst Cells
2.4. Astaxanthin Extractability Analysis
2.5. Determination of the Biomass Concentration
2.6. Astaxanthin Quantification
2.7. Nitrate and Sugar Quantification
2.8. Statistical Analysis
3. Results and Discussion
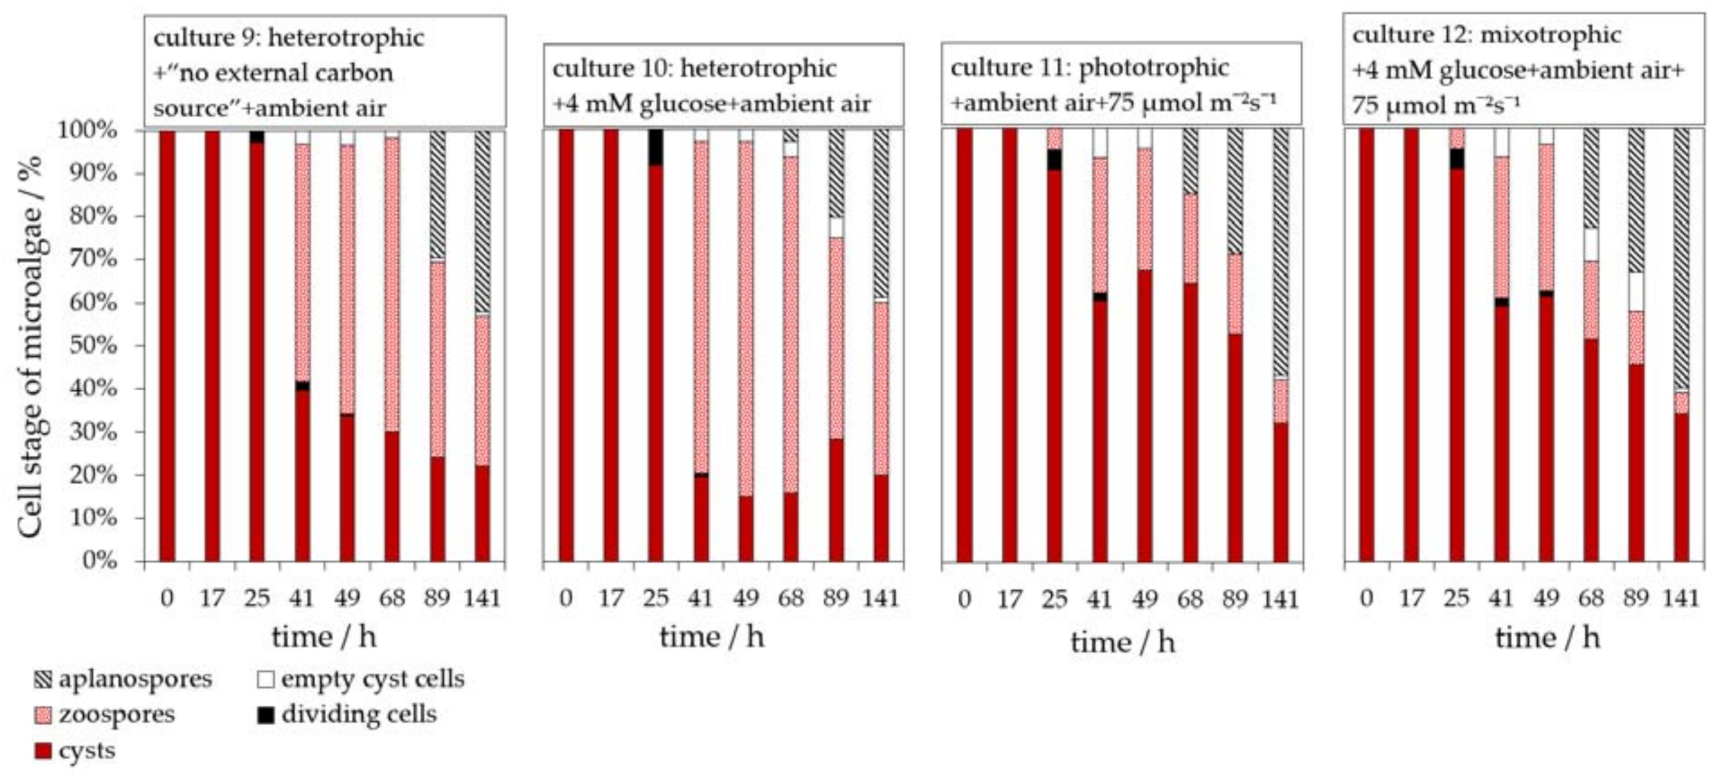
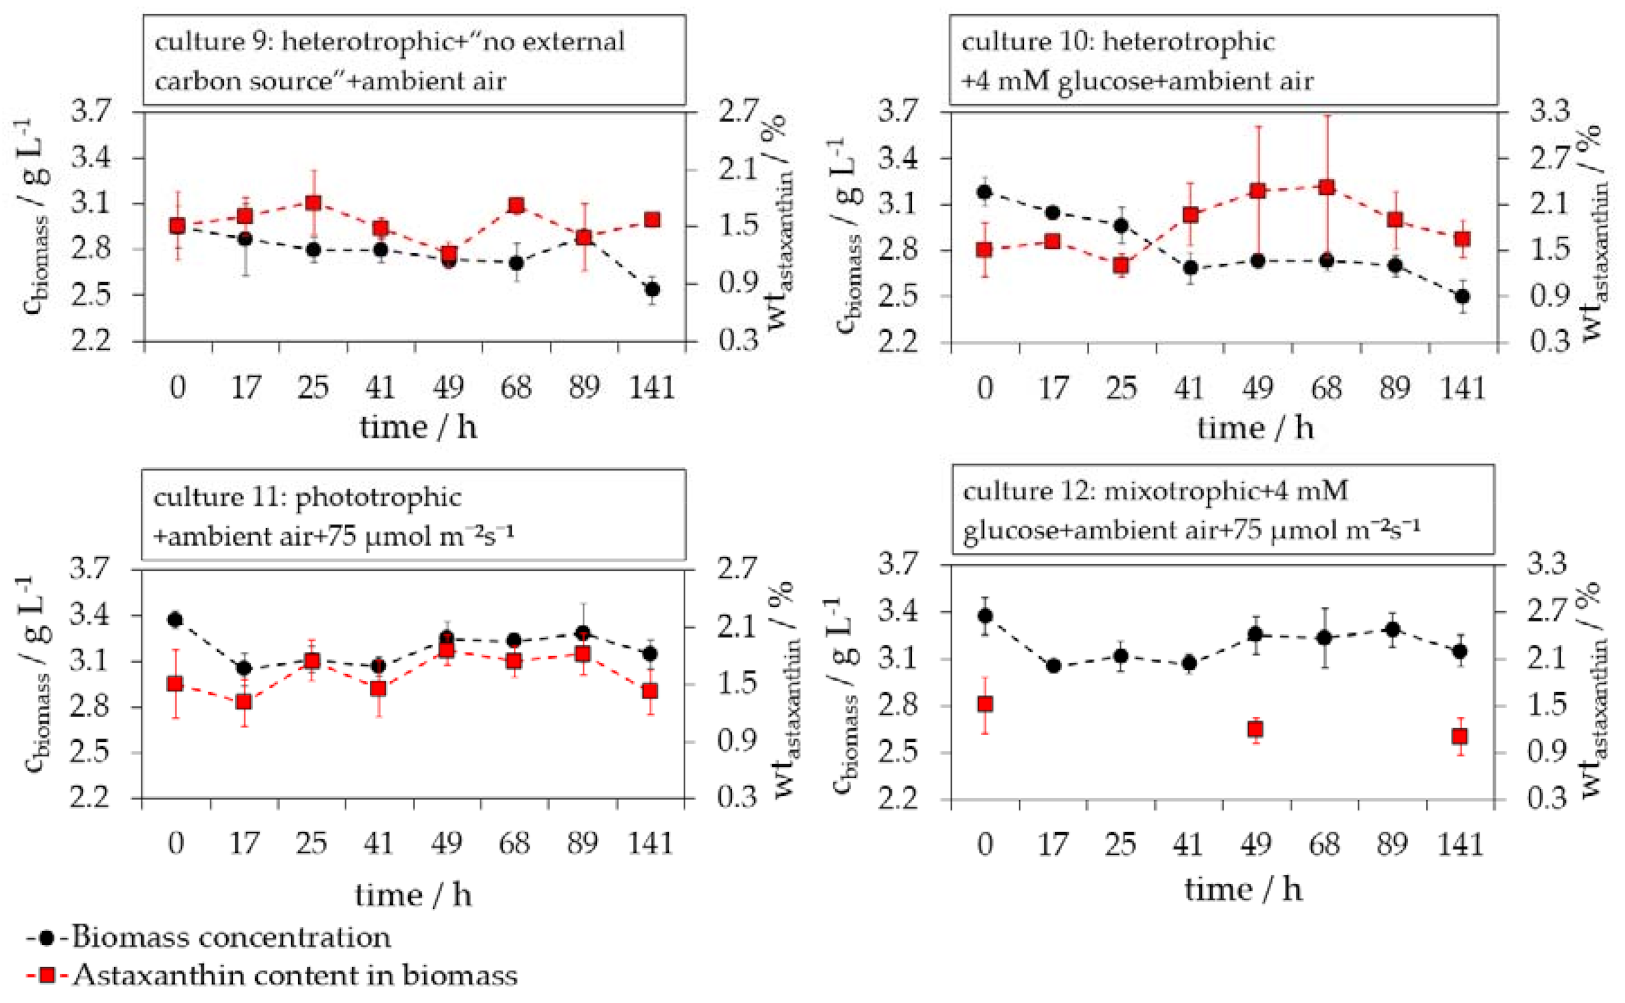
3.1. Evaluation of Phototrophic, Mixotrophic, and Heterotrophic Cultivation Conditions on the Germination of H. pluvialis Cyst Cells
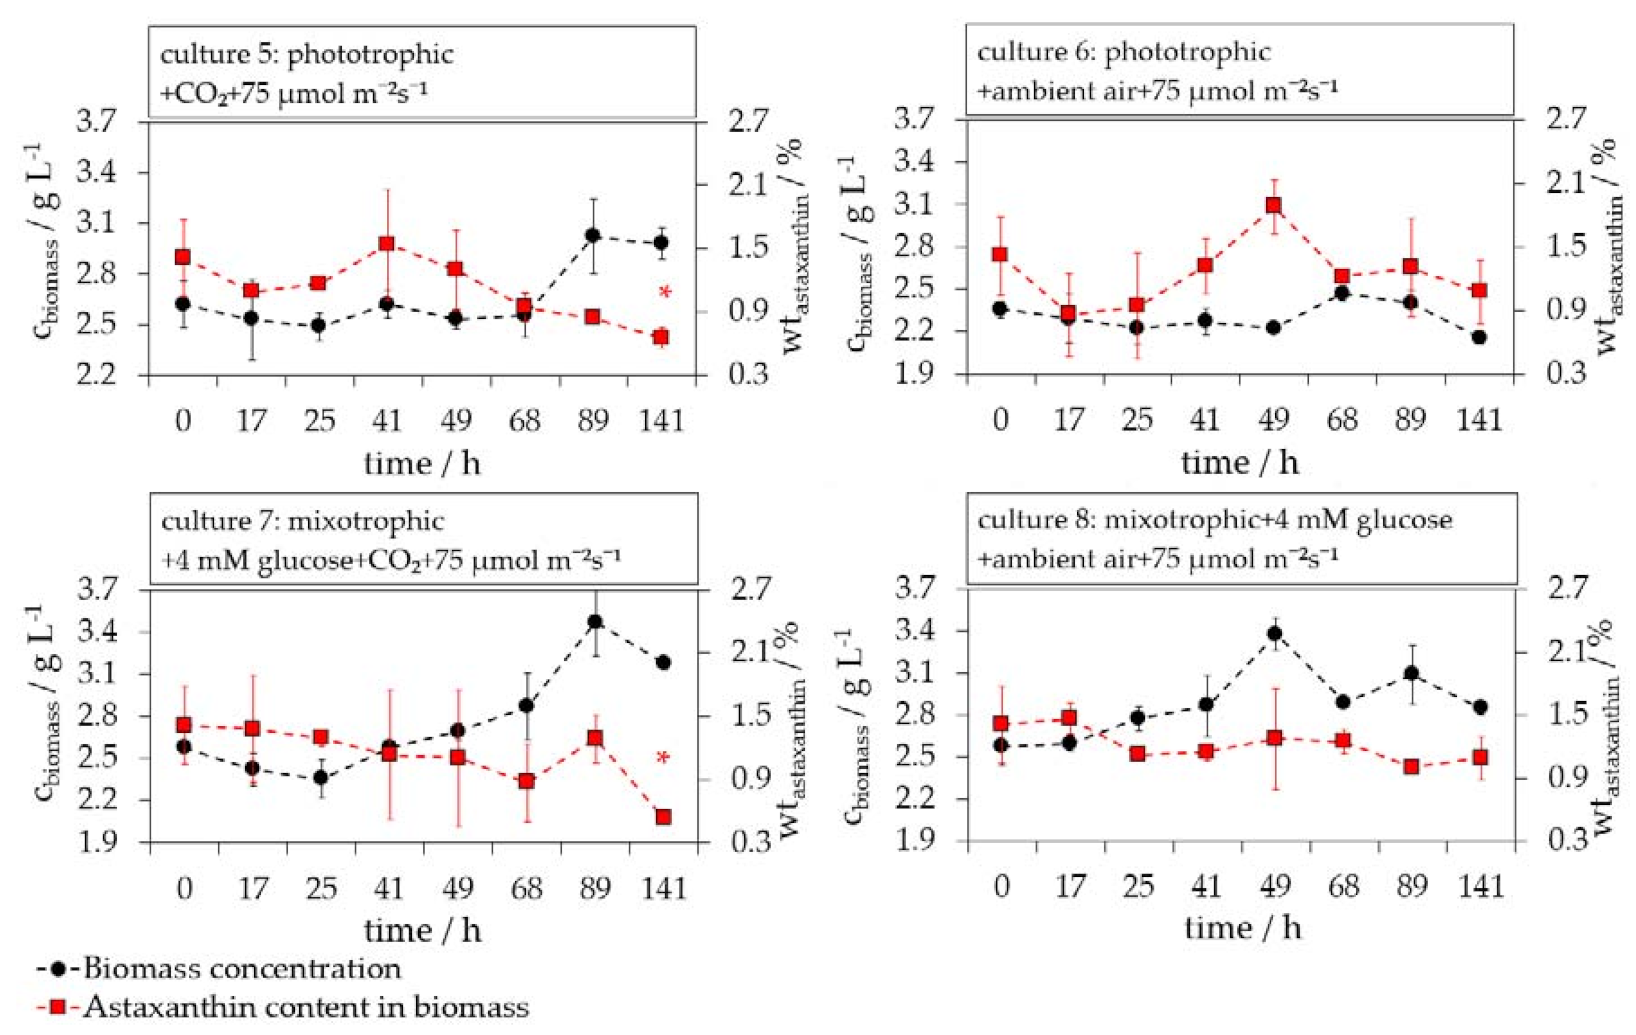
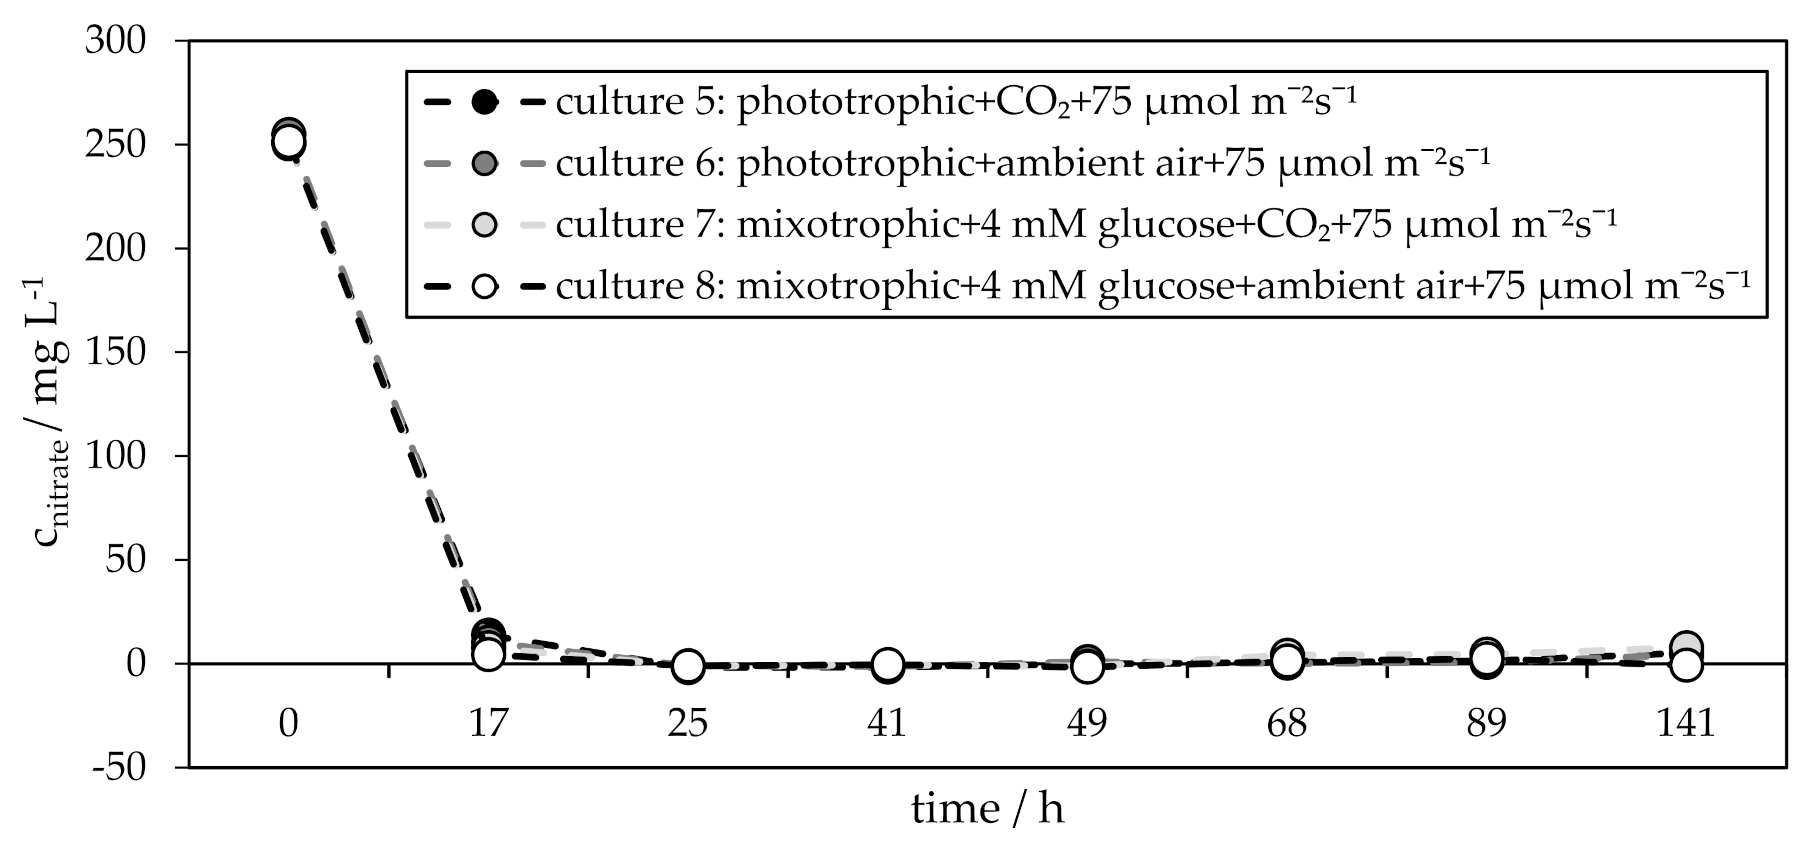
3.2. Influence of CO2 on Phototrophic and Mixotrophic H. pluvialis Cyst Cell Germination
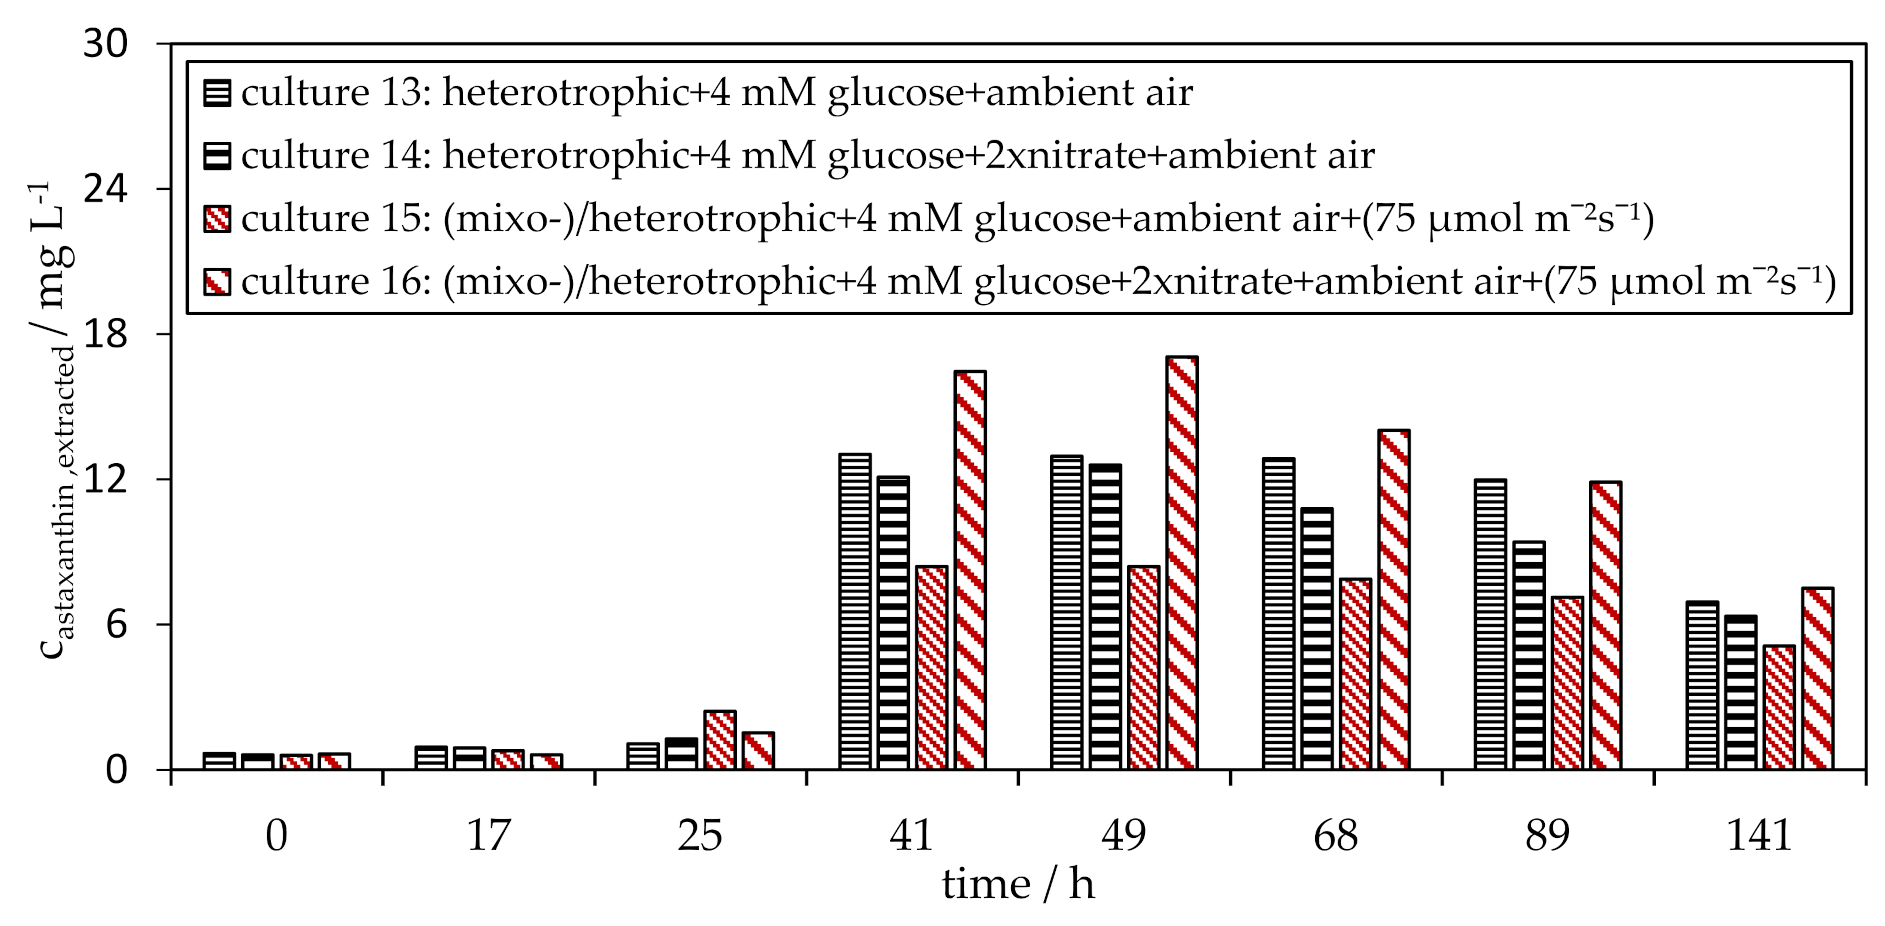
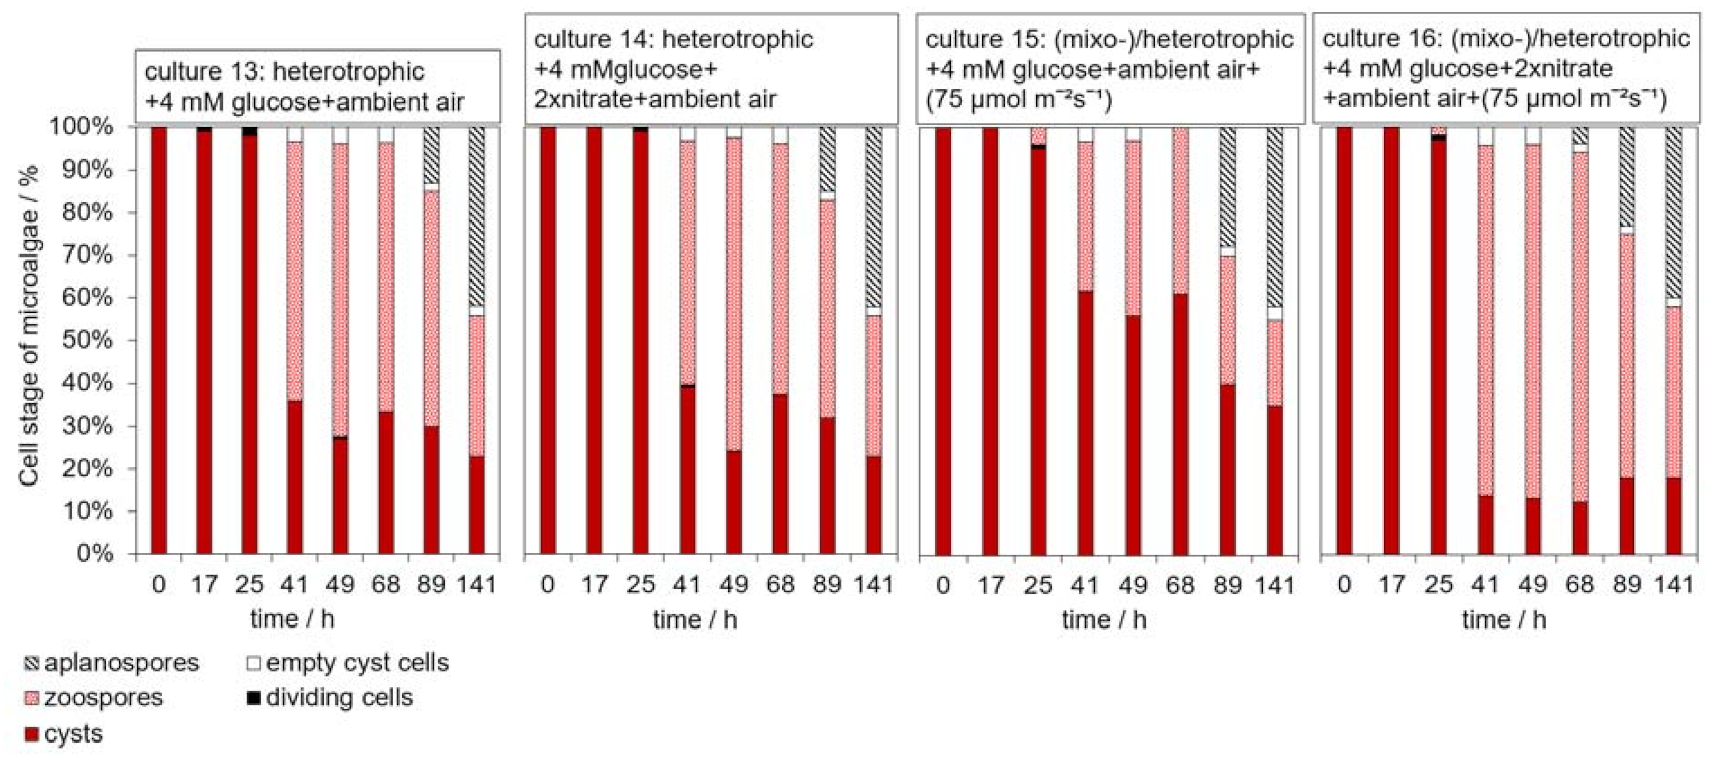
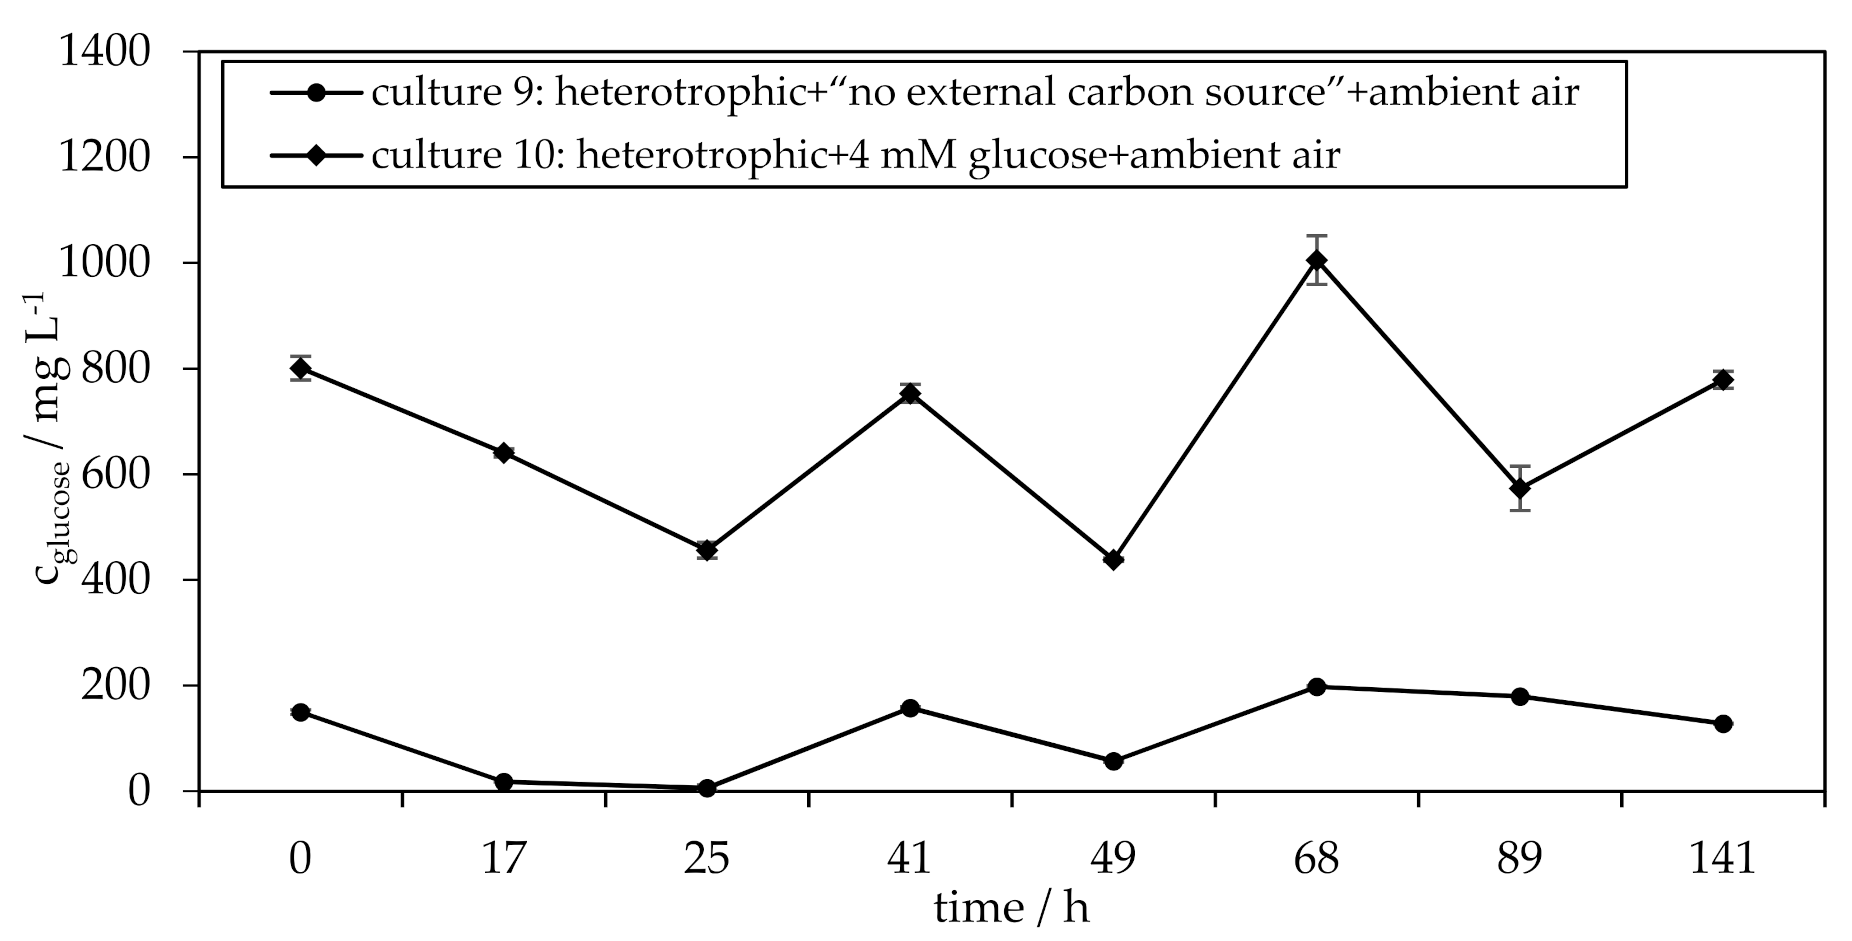
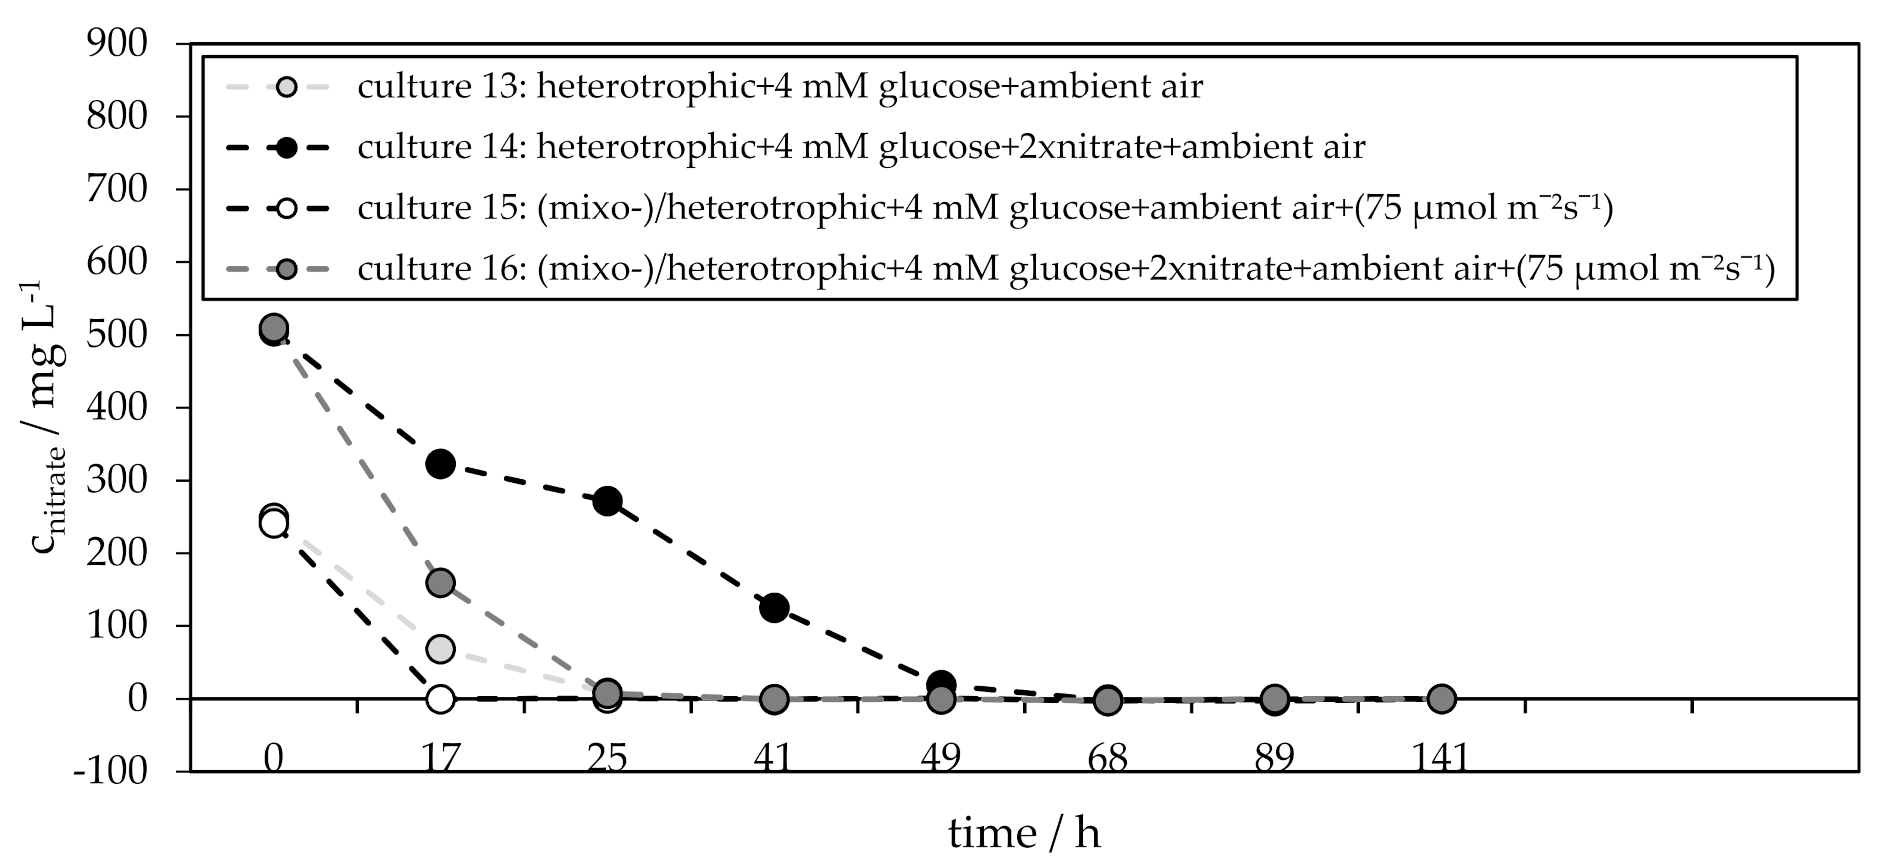
3.3. Influence of Glucose on the H. pluvialis Cyst Cell Germination
3.4. Influence of Light on the H. pluvialis Cyst Cell Germination
4. Conclusions
Supplementary Materials
Author Contributions
Funding
Institutional Review Board Statement
Informed Consent Statement
Conflicts of Interest
References
- Li, X.; Wang, X.; Duan, C.; Yi, S.; Gao, Z.; Xiao, C.; Agathos, S.N.; Wang, G.; Li, J. Biotechnological production of astaxanthin from the microalga Haematococcus pluvialis. Biotechnol. Adv. 2020, 43, 107602. [Google Scholar] [CrossRef]
- Shah, M.R.; Liang, Y.; Cheng, J.; Daroch, M. Astaxanthin-Producing Green Microalga Haematococcus pluvialis: From Single Cell to High Value Commercial Products. Front. Plant Sci. 2016, 7, 531. [Google Scholar] [CrossRef] [Green Version]
- Astaxanthin Market Size, Share & Trends Analysis Report By Source, by Product (Dried Algae Meal, Oil, Softgel), by Application (Nutraceutical, Cosmetics, Aquaculture and Animal Feed), and Segment Forecasts, 2020–2027. 2020. Available online: https://www.grandviewresearch.com/industry-analysis/global-astaxanthin-market (accessed on 17 February 2021).
- Richmond, A. (Ed.) Handbook of Microalgal Culture: Biotechnology and Applied Phycology; Blackwell Publishing Ltd.: Hoboken, NJ, USA, 2004. [Google Scholar]
- Czygan, F.C. Blood-rain and blood-snow: Nitrogen-deficient cells of Haematococcus pluvialis and Chlamydomonas nivalis. Arch. Mikrobiol. 1970, 74, 69–76. [Google Scholar] [CrossRef]
- Zhang, C.; Liu, J.; Zhang, L. Cell cycles and proliferation patterns in Haematococcus pluvialis. Chin. J. Oceanol. Limnol. 2016, 35, 1205–1211. [Google Scholar] [CrossRef]
- Hagen, C.; Siegmund, S.; Braune, W. Ultrastructural and chemical changes in the cell wall of Haematococcus pluvialis (Volvocales, Chlorophyta) during aplanospore formation. Eur. J. Phycol. 2002, 37, 217–226. [Google Scholar] [CrossRef]
- Bux, F.; Chisti, Y. (Eds.) Algae Biotechnology; Springer Science + Business Media: Berlin, Germany, 2016. [Google Scholar]
- Kobayashi, M.; Kakizono, T.; Yamaguchi, K.; Nishio, N.; Nagai, S. Growth and astaxanthin formation of Haematococcus pluvialis in Heterotrophic and Mixotrophic conditions. J. Ferment. Bioeng. 1992, 74, 17–20. [Google Scholar] [CrossRef]
- Wan, M.; Zhang, Z.; Wang, J.; Huang, J.; Fan, J.; Yu, A.; Wang, W.; Li, Y. Sequential Heterotrophy–Dilution–Photoinduction Cultivation of Haematococcus pluvialis for efficient production of astaxanthin. Bioresour. Technol. 2015, 198, 557–563. [Google Scholar] [CrossRef]
- Hu, J.; Nagarajan, D.; Zhang, Q.; Chang, J.-S.; Lee, D.-J. Heterotrophic cultivation of microalgae for pigment production: A review. Biotechnol. Adv. 2018, 36, 54–67. [Google Scholar] [CrossRef] [PubMed]
- Boyle, N.R.; Morgan, A.J. Flux balance analysis of primary metabolism in Chlamydomonas reinhardtii. BMC Syst. Biol. 2009, 3, 4. [Google Scholar] [CrossRef] [Green Version]
- Dong, Q.-L.; Zhao, X.-M. In situ carbon dioxide fixation in the process of natural astaxanthin production by a mixed culture of Haematococcus pluvialis and Phaffia rhodozyma. Catal. Today 2004, 98, 537–544. [Google Scholar] [CrossRef]
- Gong, X.-D.; Chen, F. Rapid detection of heterotrophic growth of Haematococcus pluvialisusing indirect conductimetry. Biotechnol. Tech. 1997, 11, 841–844. [Google Scholar] [CrossRef]
- Oncel, S.S.; Sukan, F.V.; Imamoglu, E.; Gunerken, E. Comparison of different cultivation modes and light intensities using mono-cultures and co-cultures of Haematococcus pluvialis and Chlorella zofingiensis. J. Chem. Technol. Biotechnol. 2010, 86, 414–420. [Google Scholar] [CrossRef]
- Cheirsilp, B.; Torpee, S. Enhanced growth and lipid production of microalgae under mixotrophic culture condition: Effect of light intensity, glucose concentration and fed-batch cultivation. Bioresour. Technol. 2012, 110, 510–516. [Google Scholar] [CrossRef]
- Pang, N.; Chen, S. Effects of C5 organic carbon and light on growth and cell activity of Haematococcus pluvialis under mixotrophic conditions. Algal Res. 2017, 21, 227–235. [Google Scholar] [CrossRef]
- Nahidian, B.; Ghanati, F.; Shahbazi, M.; Soltani, N. Effect of nutrients on the growth and physiological features of newly isolated Haematococcus pluvialis TMU1. Bioresour. Technol. 2018, 255, 229–237. [Google Scholar] [CrossRef] [PubMed]
- Chekanov, K.; Schastnaya, E.; Solovchenko, A.; Lobakova, E. Effects of CO2 enrichment on primary photochemistry, growth and astaxanthin accumulation in the chlorophyte Haematococcus pluvialis. J. Photochem. Photobiol. B Biol. 2017, 171, 58–66. [Google Scholar] [CrossRef] [PubMed]
- Katsuda, T.; Lababpour, A.; Shimahara, K.; Katoh, S. Astaxanthin production by Haematococcus pluvialis under illumination with LEDs. Enzym. Microb. Technol. 2004, 35, 81–86. [Google Scholar] [CrossRef] [Green Version]
- Xi, T.; Kim, D.G.; Roh, S.W.; Choi, J.-S.; Choi, Y.-E. Enhancement of astaxanthin production using Haematococcus pluvialis with novel LED wavelength shift strategy. Appl. Microbiol. Biotechnol. 2016, 100, 6231–6238. [Google Scholar] [CrossRef] [PubMed]
- Sun, H.; Kong, Q.; Geng, Z.; Duan, L.; Yang, M.; Guan, B. Enhancement of cell biomass and cell activity of astaxanthin-rich Haematococcus pluvialis. Bioresour. Technol. 2015, 186, 67–73. [Google Scholar] [CrossRef]
- Panis, G.; Carreon, J.R. Commercial astaxanthin production derived by green alga Haematococcus pluvialis: A microalgae process model and a techno-economic assessment all through production line. Algal Res. 2016, 18, 175–190. [Google Scholar] [CrossRef] [Green Version]
- Praveenkumar, R.; Lee, J.; Vijayan, D.; Lee, S.Y.; Lee, K.; Sim, S.J.; Hong, M.E.; Kim, Y.-E.; Oh, Y.-K. Morphological Change and Cell Disruption of Haematococcus pluvialis Cyst during High-Pressure Homogenization for Astaxanthin Recovery. Appl. Sci. 2020, 10, 513. [Google Scholar] [CrossRef] [Green Version]
- Choi, Y.Y.; Hong, M.-E.; Sim, S.J. Enhanced astaxanthin extraction efficiency from Haematococcus pluvialis via the cyst germination in outdoor culture systems. Process. Biochem. 2015, 50, 2275–2280. [Google Scholar] [CrossRef]
- Bauer, A.; Minceva, M. Direct extraction of astaxanthin from the microalgae Haematococcus pluvialis using liquid–liquid chromatography. RSC Adv. 2019, 9, 22779–22789. [Google Scholar] [CrossRef] [Green Version]
- Minceva, M.; Bauer, A. Method of Extracting a Pigment from Microalgae. Patent WO2020089173, 7 May 2020. [Google Scholar]
- Praveenkumar, R.; Lee, K.; Oh, Y.-K. Breaking dormancy: An energy-efficient means of recovering astaxanthin from microalgae. Green Chem. 2015, 17, 1226–1234. [Google Scholar] [CrossRef]
- Fábregas, J.; Domínguez, A.; Maseda, A.; Otero, A. Interactions between irradiance and nutrient availability during astaxanthin accumulation and degradation in Haematococcus pluvialis. Appl. Microbiol. Biotechnol. 2003, 61, 545–551. [Google Scholar] [CrossRef]
- Ma, R.; Thomas-Hall, S.R.; Chua, E.T.; Eltanahy, E.; Netzel, M.E.; Netzel, G.; Lu, Y.; Schenk, P.M. Blue light enhances astaxanthin biosynthesis metabolism and extraction efficiency in Haematococcus pluvialis by inducing haematocyst germination. Algal Res. 2018, 35, 215–222. [Google Scholar] [CrossRef]
- Vidhyavathi, R.; Venkatachalam, L.; Kamath, B.S.; Sarada, R.; Ravishankar, G.A. Differential expression of carotenogenic genes and associated changes in pigment profile during regeneration of Haematococcus pluvialis cysts. Appl. Microbiol. Biotechnol. 2007, 75, 879–887. [Google Scholar] [CrossRef]
- Alfonsi, K.; Colberg, J.; Dunn, P.J.; Fevig, T.; Jennings, S.; Johnson, T.A.; Kleine, H.P.; Knight, C.; Nagy, M.A.; Perry, D.A.; et al. Green chemistry tools to influence a medicinal chemistry and research chemistry based organisation. Green Chem. 2007, 10, 31–36. [Google Scholar] [CrossRef]
- Green Chemistry at Pfizer. Available online: https://www.dbu.de/media/130508051211a525.pdf (accessed on 10 March 2021).
- Berechnung der Verfahrensstandardabweichung und Nachweis-, Erfassungs- und Bestimmungsgrenze aus einer Kalibrierung gemäß DIN 32645. Available online: https://www.uni-due.de/imperia/md/content/iac/git_erw_1.pdf (accessed on 10 January 2021).
- American Public Health Association. APHA Method 4500-NO3: Standard Methods for the Examination of Water and Wastewater; American Public Health Association: Washington, DC, USA; American Water Works Association: Denver, CO, USA; Water Environment Federation: Alexandria, VA, USA, 1992. [Google Scholar]
- Dubois, M.; Gilles, K.A.; Hamilton, J.K.; Rebers, P.A.; Smith, F. Colorimetric Method for Determination of Sugars and Related Substances. Anal. Chem. 1956, 28, 350–356. [Google Scholar] [CrossRef]
- Li, K.; Cheng, J.; Lu, H.; Yang, W.; Zhou, J.; Cen, K. Transcriptome-based analysis on carbon metabolism of Haematococcus pluvialis mutant under 15% CO2. Bioresour. Technol. 2017, 233, 313–321. [Google Scholar] [CrossRef] [PubMed]
- Zhao, Y.; Hou, Y.; Chai, W.; Liu, Z.; Wang, X.; He, C.; Hu, Z.; Chen, S.; Wang, W.; Chen, F. Transcriptome analysis of Haematococcus pluvialis of multiple defensive systems against nitrogen starvation. Enzym. Microb. Technol. 2020, 134, 109487. [Google Scholar] [CrossRef]
- Tibocha-Bonilla, J.D.; Zuñiga, C.; Godoy-Silva, R.D.; Zengler, K. Advances in metabolic modeling of oleaginous microalgae. Biotechnol. Biofuels 2018, 11, 241. [Google Scholar] [CrossRef]
- Pick, U.; Zarka, A.; Boussiba, S.; Davidi, L. A hypothesis about the origin of carotenoid lipid droplets in the green algae Dunaliella and Haematococcus. Planta 2018, 249, 31–47. [Google Scholar] [CrossRef] [PubMed]
- Morales-Sánchez, D.; Martinez-Rodriguez, O.A.; Kyndt, J.; Martinez, A. Heterotrophic growth of microalgae: Metabolic aspects. World J. Microbiol. Biotechnol. 2014, 31, 1–9. [Google Scholar] [CrossRef]
- Li, Q.; Zhang, L.; Liu, J. Examination of carbohydrate and lipid metabolic changes during Haematococcus pluvialis non-motile cell germination using transcriptome analysis. Environ. Biol. Fishes 2018, 31, 145–156. [Google Scholar] [CrossRef]
- Tunçay, H.; Findinier, J.; Duchêne, T.; Cogez, V.; Cousin, C.; Peltier, G.; Ball, S.; Dauvillée, D. A Forward Genetic Approach in Chlamydomonas reinhardtii as a Strategy for Exploring Starch Catabolism. PLoS ONE 2013, 8, e74763. [Google Scholar] [CrossRef] [PubMed] [Green Version]


| Name | Germination Conditions |
|---|---|
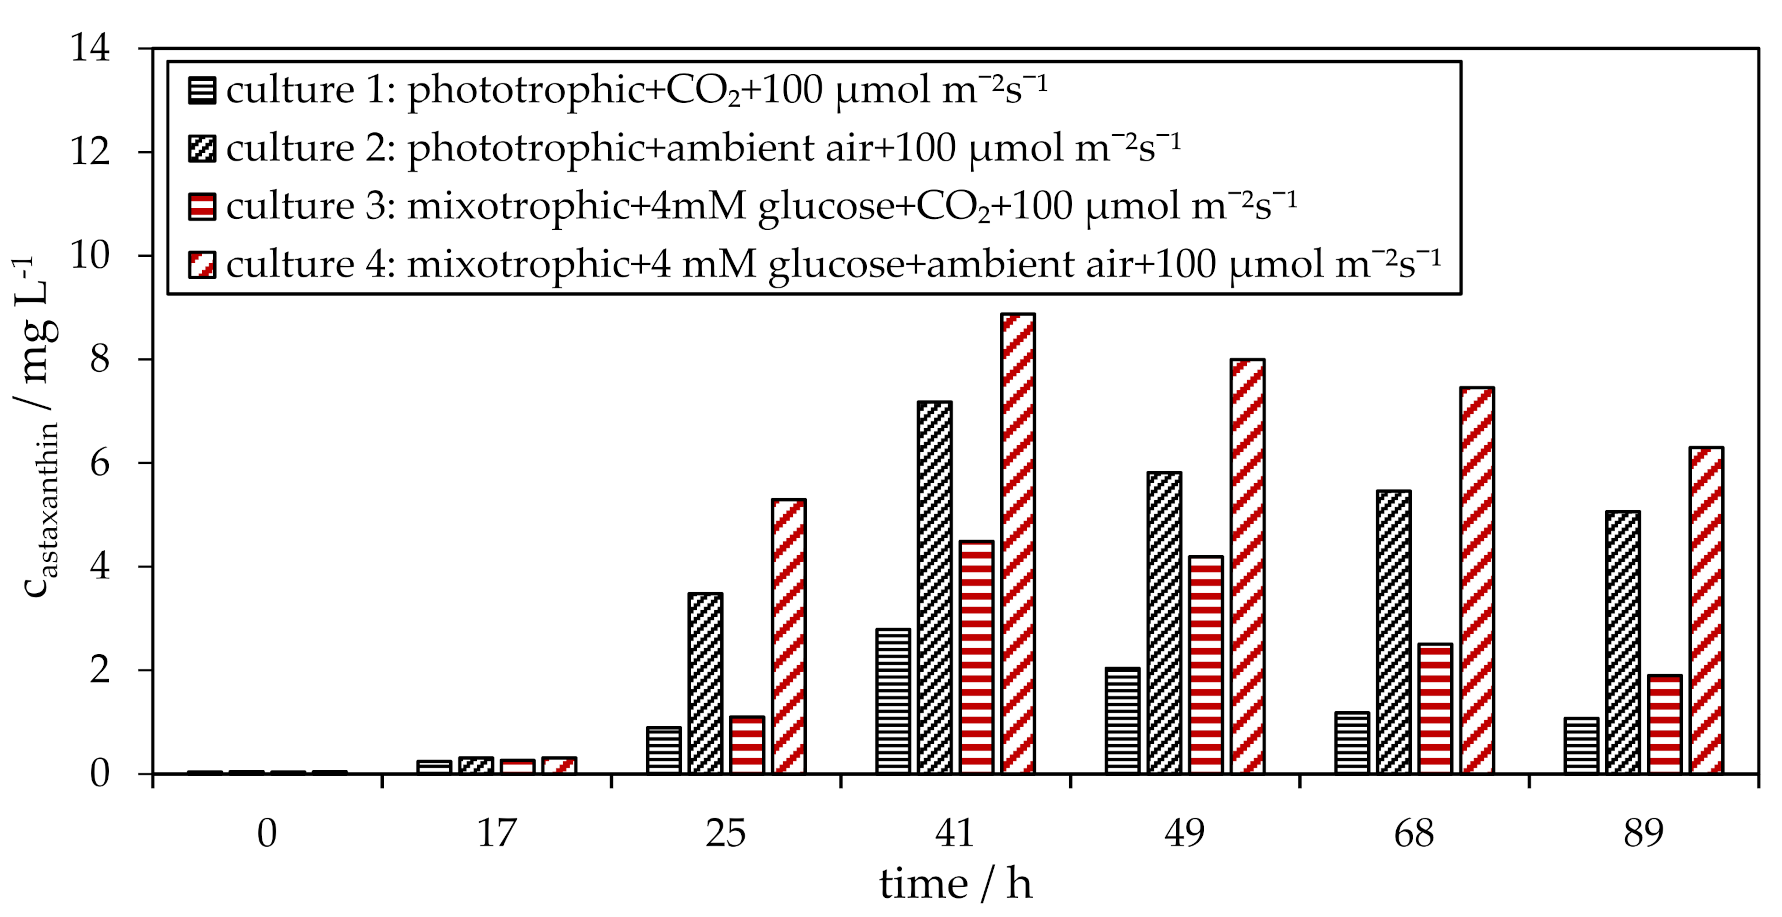
| culture 1 culture 2 | phototrophic + CO2 + 100 µmol m−2 s−1 phototrophic + ambient air + 100 µmol m−2 s−1 |
| culture 3 culture 4 | mixotrophic + 4 mM glucose + CO2 + 100 µmol m−2 s−1 mixotrophic + 4 mM glucose + ambient air + 100 µmol m−2 s−1 |
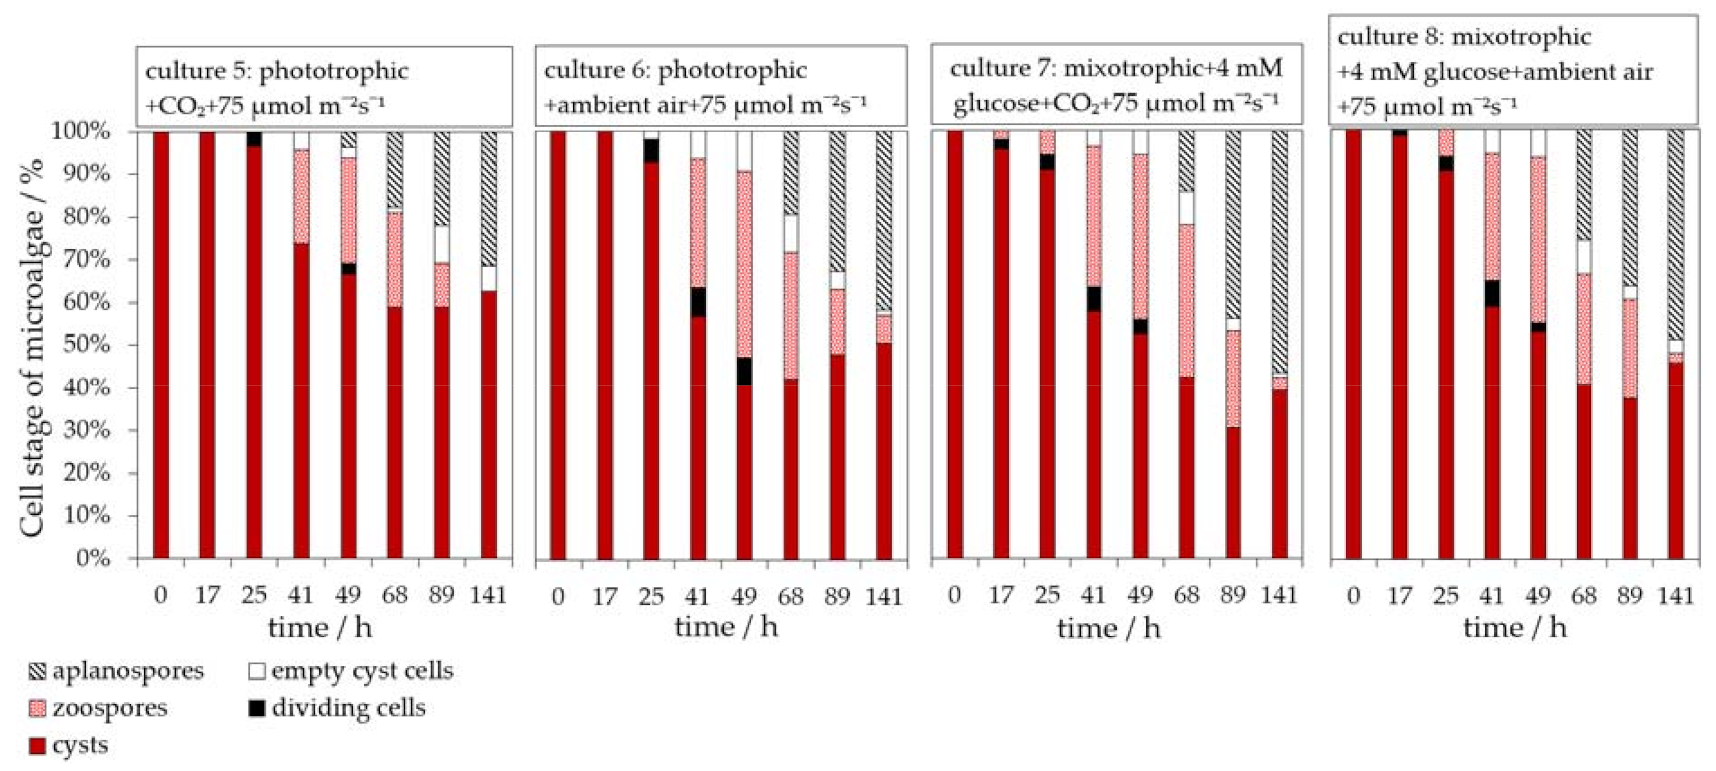
| culture 5 culture 6 | phototrophic + CO2 + 75 µmol m−2 s−1 phototrophic + ambient air + 75 µmol m−2 s−1 |
| culture 7 culture 8 | mixotrophic + 4 mM glucose + CO2 + 75 µmol m−2 s−1 mixotrophic + 4 mM glucose + ambient air + 75 µmol m−2 s−1 |
| culture 9 culture 10 | heterotrophic + “no external carbon source” + ambient air heterotrophic + 4 mM glucose + ambient air |
| culture 11 culture 12 | phototrophic + ambient air + 75 µmol m−2 s−1 mixotrophic + 4 mM glucose + ambient air + 75 µmol m−2 s−1 |
| culture 13 culture 14 | heterotrophic + 4 mM glucose + ambient air heterotrophic + 4 mM glucose + 2xnitrate + ambient air |
| culture 15 culture 16 | mixo-/heterotrophic + 4 mM glucose + ambient air + (75 µmol m−2 s−1) mixo-/heterotrophic + 4 mM glucose + 2xnitrate + ambient air + (75 µmol m−2 s−1) |
Publisher’s Note: MDPI stays neutral with regard to jurisdictional claims in published maps and institutional affiliations. |
© 2021 by the authors. Licensee MDPI, Basel, Switzerland. This article is an open access article distributed under the terms and conditions of the Creative Commons Attribution (CC BY) license (https://creativecommons.org/licenses/by/4.0/).
Share and Cite
Bauer, A.; Minceva, M. Examination of Photo-, Mixo-, and Heterotrophic Cultivation Conditions on Haematococcus pluvialis Cyst Cell Germination. Appl. Sci. 2021, 11, 7201. https://doi.org/10.3390/app11167201
Bauer A, Minceva M. Examination of Photo-, Mixo-, and Heterotrophic Cultivation Conditions on Haematococcus pluvialis Cyst Cell Germination. Applied Sciences. 2021; 11(16):7201. https://doi.org/10.3390/app11167201
Chicago/Turabian StyleBauer, Andreas, and Mirjana Minceva. 2021. "Examination of Photo-, Mixo-, and Heterotrophic Cultivation Conditions on Haematococcus pluvialis Cyst Cell Germination" Applied Sciences 11, no. 16: 7201. https://doi.org/10.3390/app11167201