
Carbon Dioxide Adsorption on Carbon Nanofibers with Different Porous Structures

Abstract
:1. Introduction
2. Materials and Methods
2.1. Preparation of Electrospun Nanofibers
2.2. Characterizations
2.3. CO2 Adsorption Isotherms
2.4. CO2 Adsorption Column Experiments
3. Results and Discussion
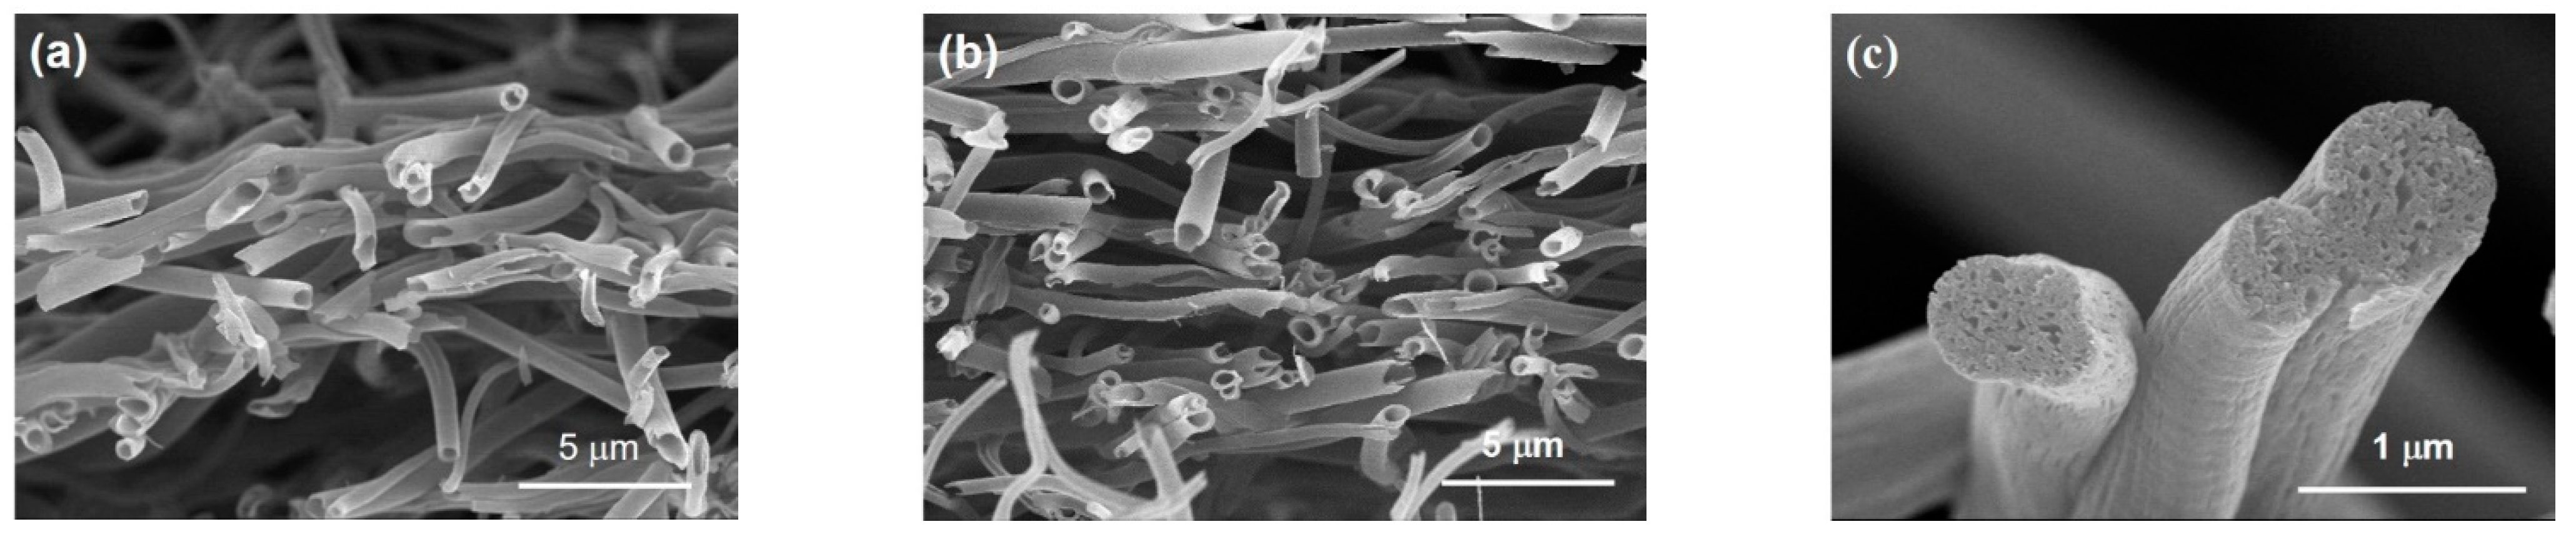
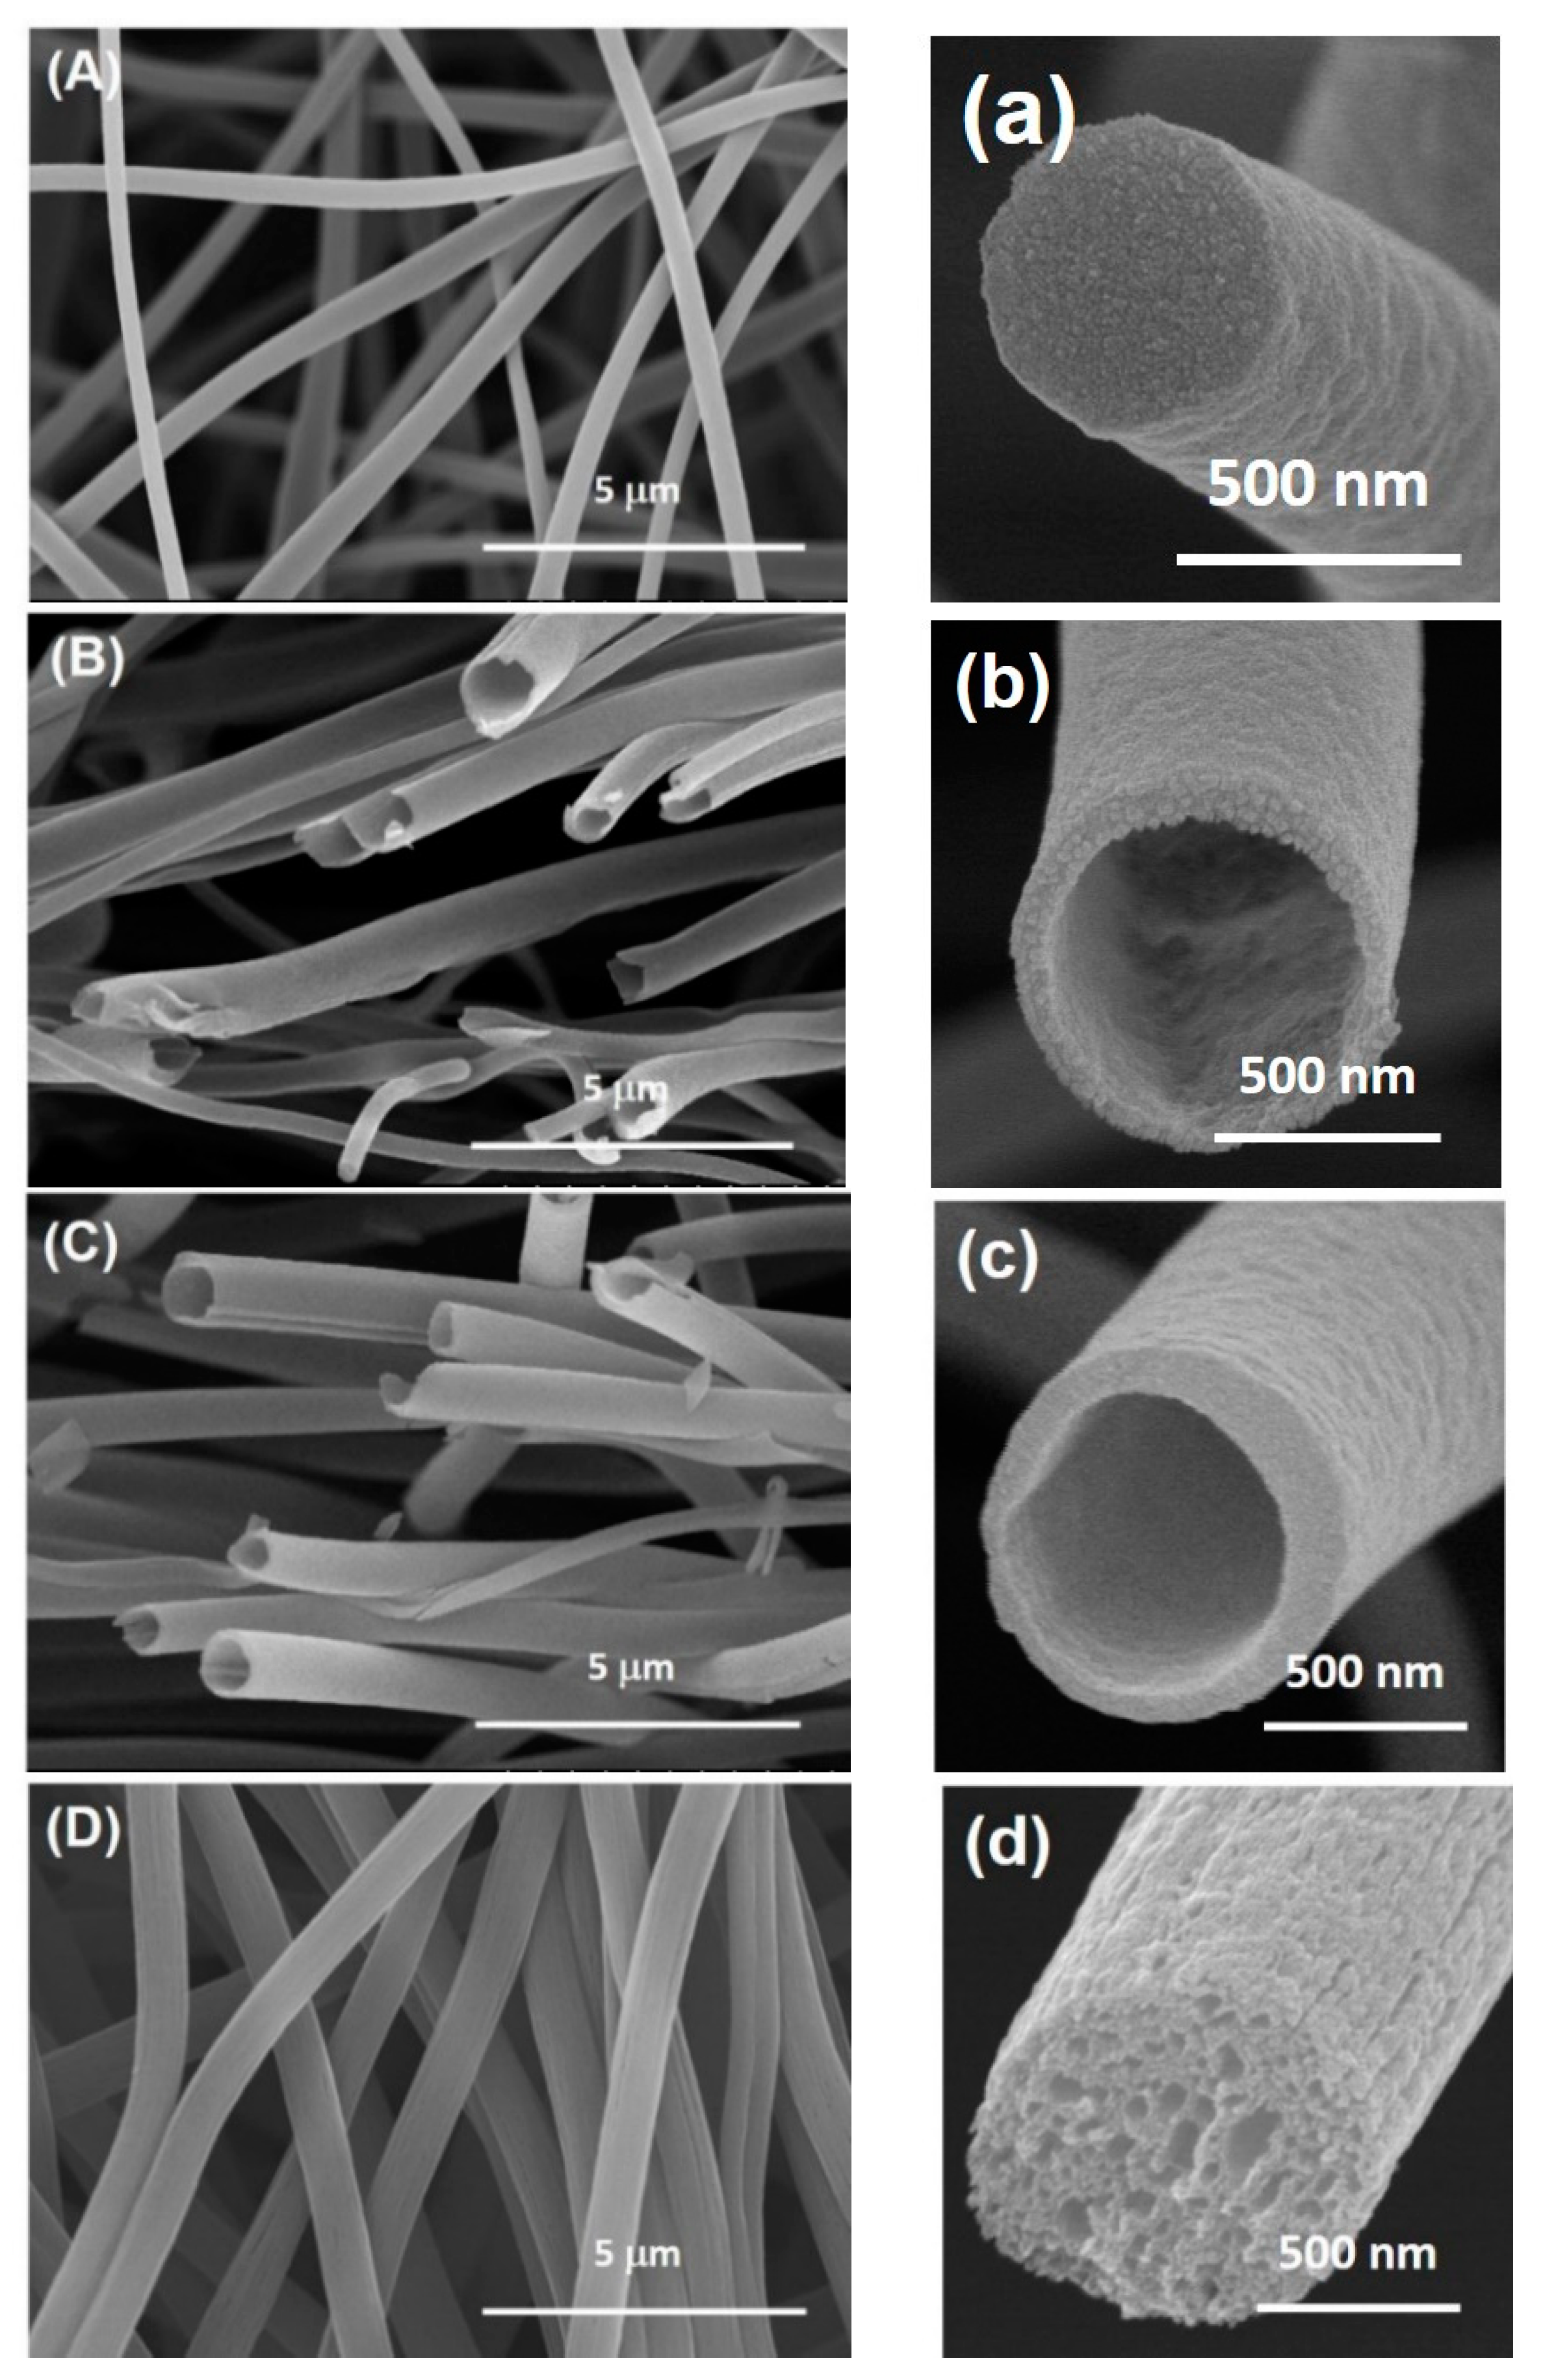
3.1. FESEM Images
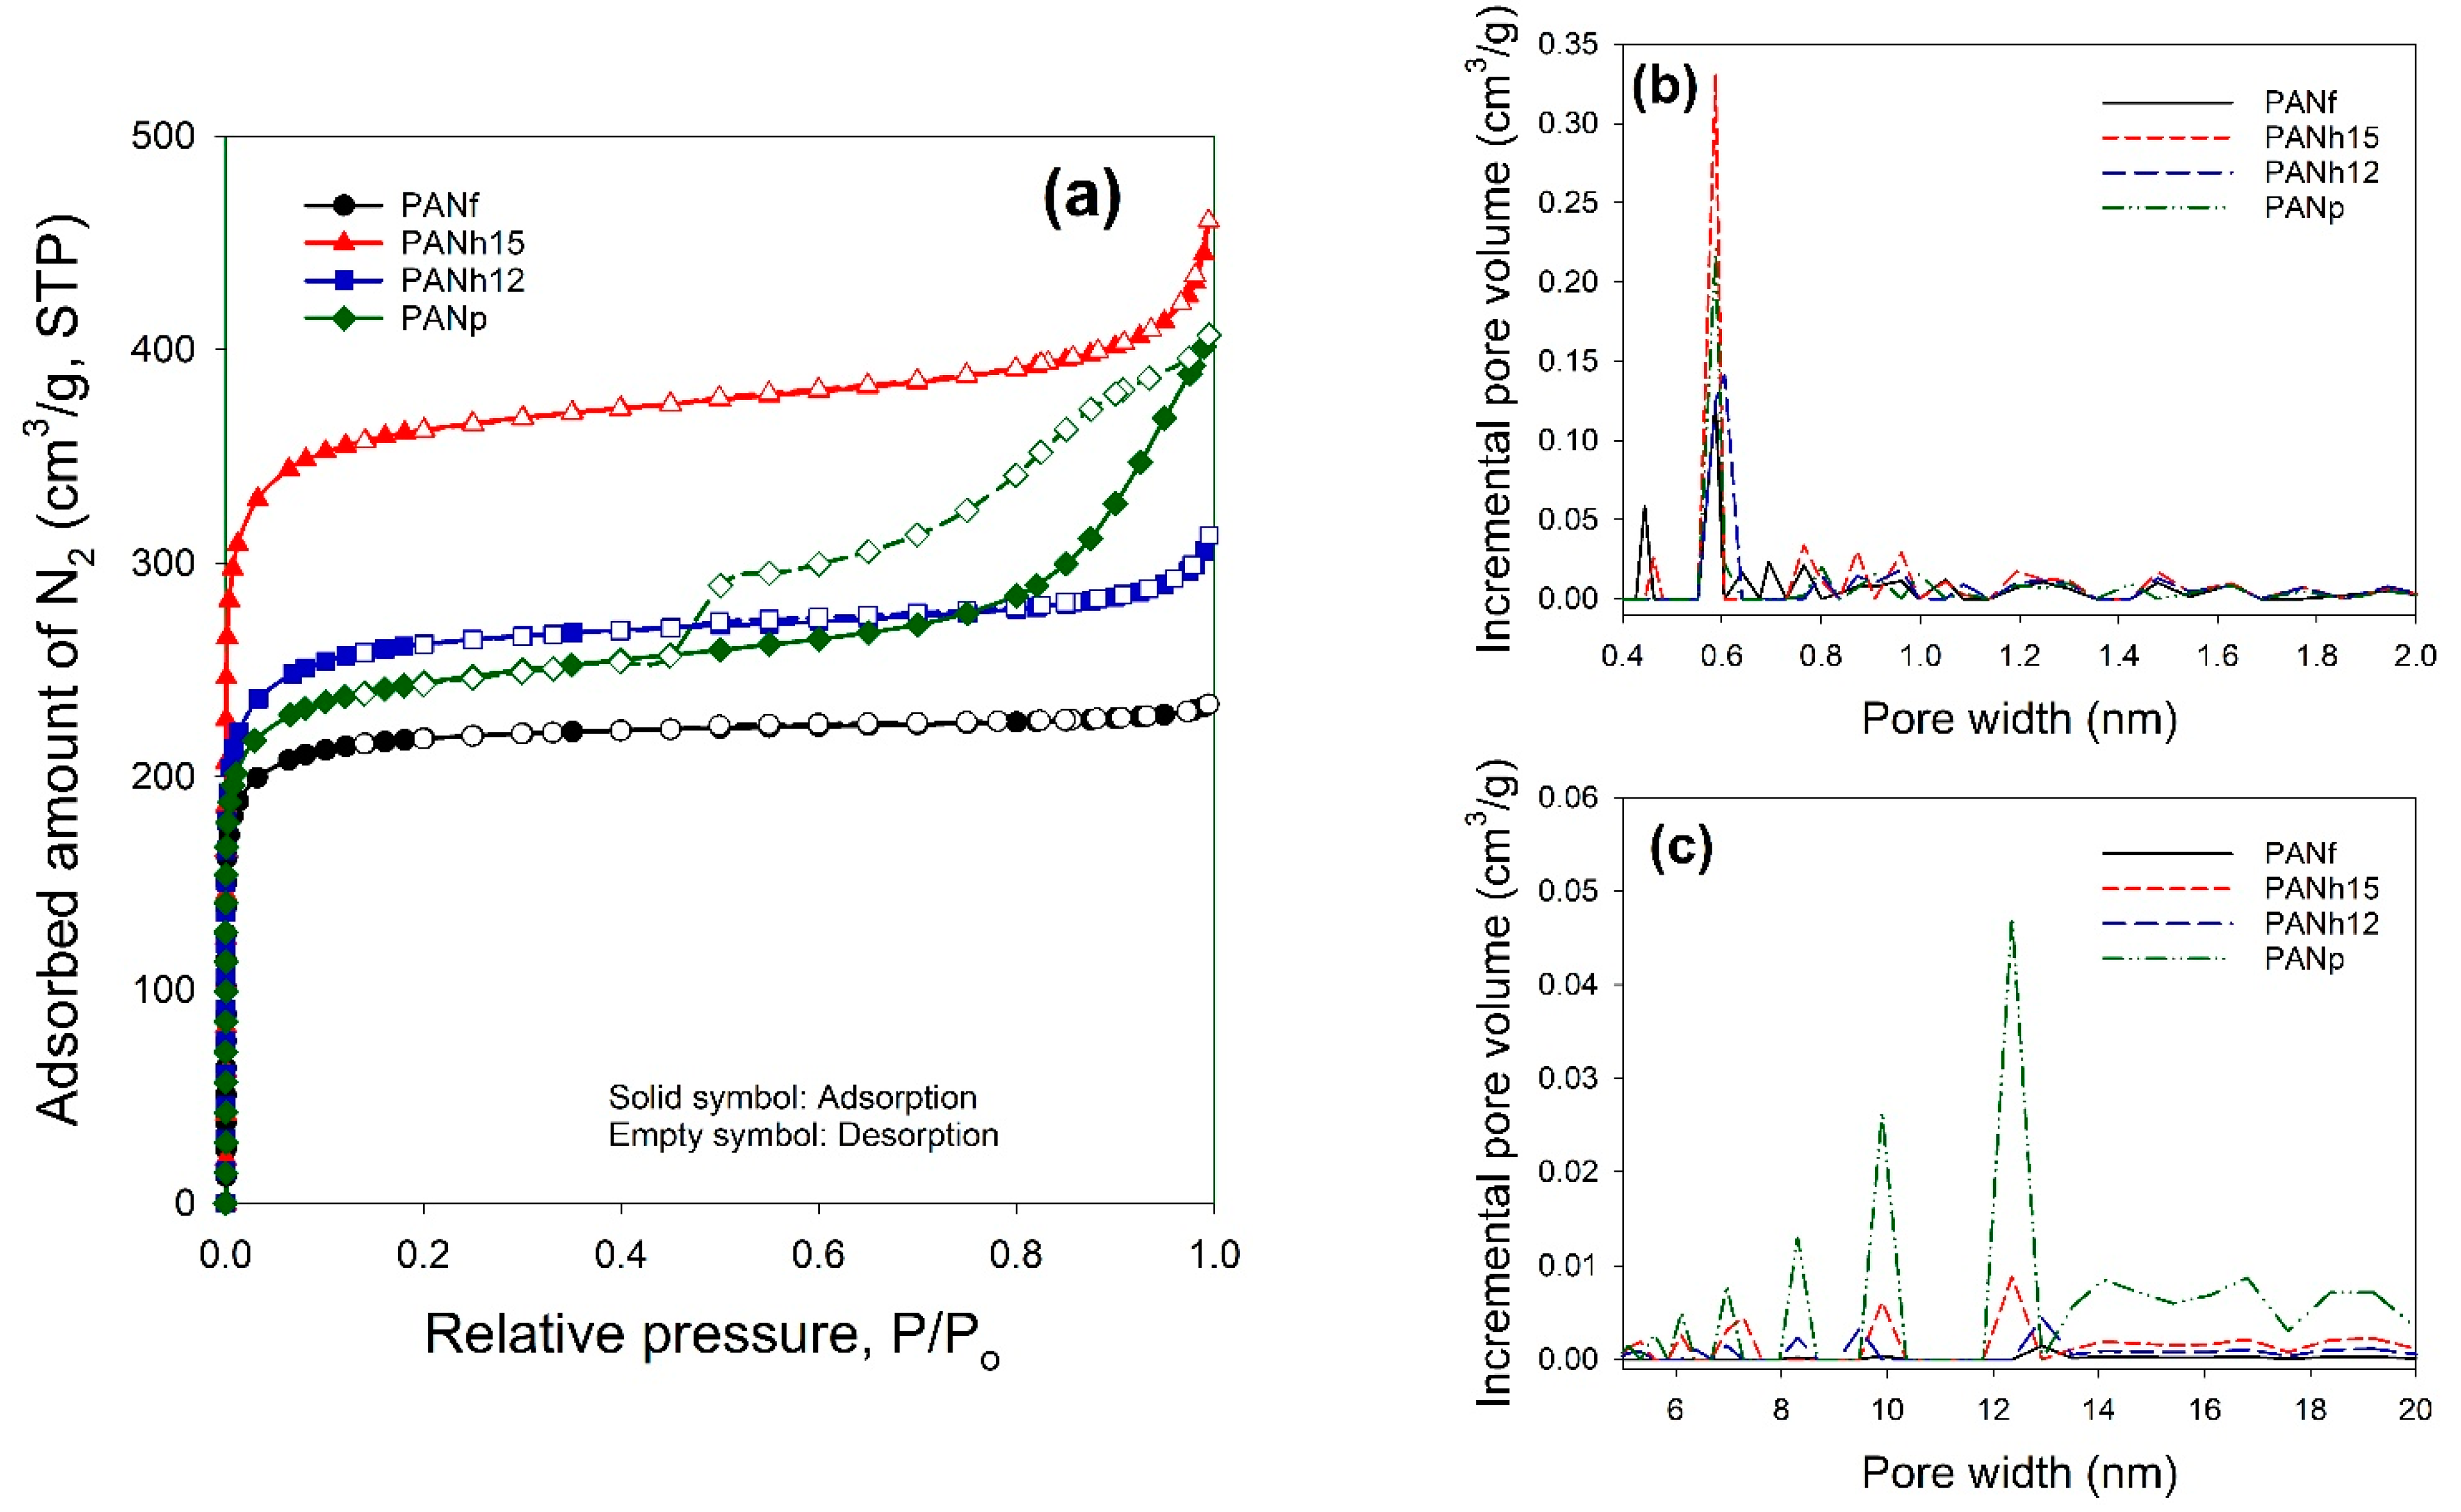
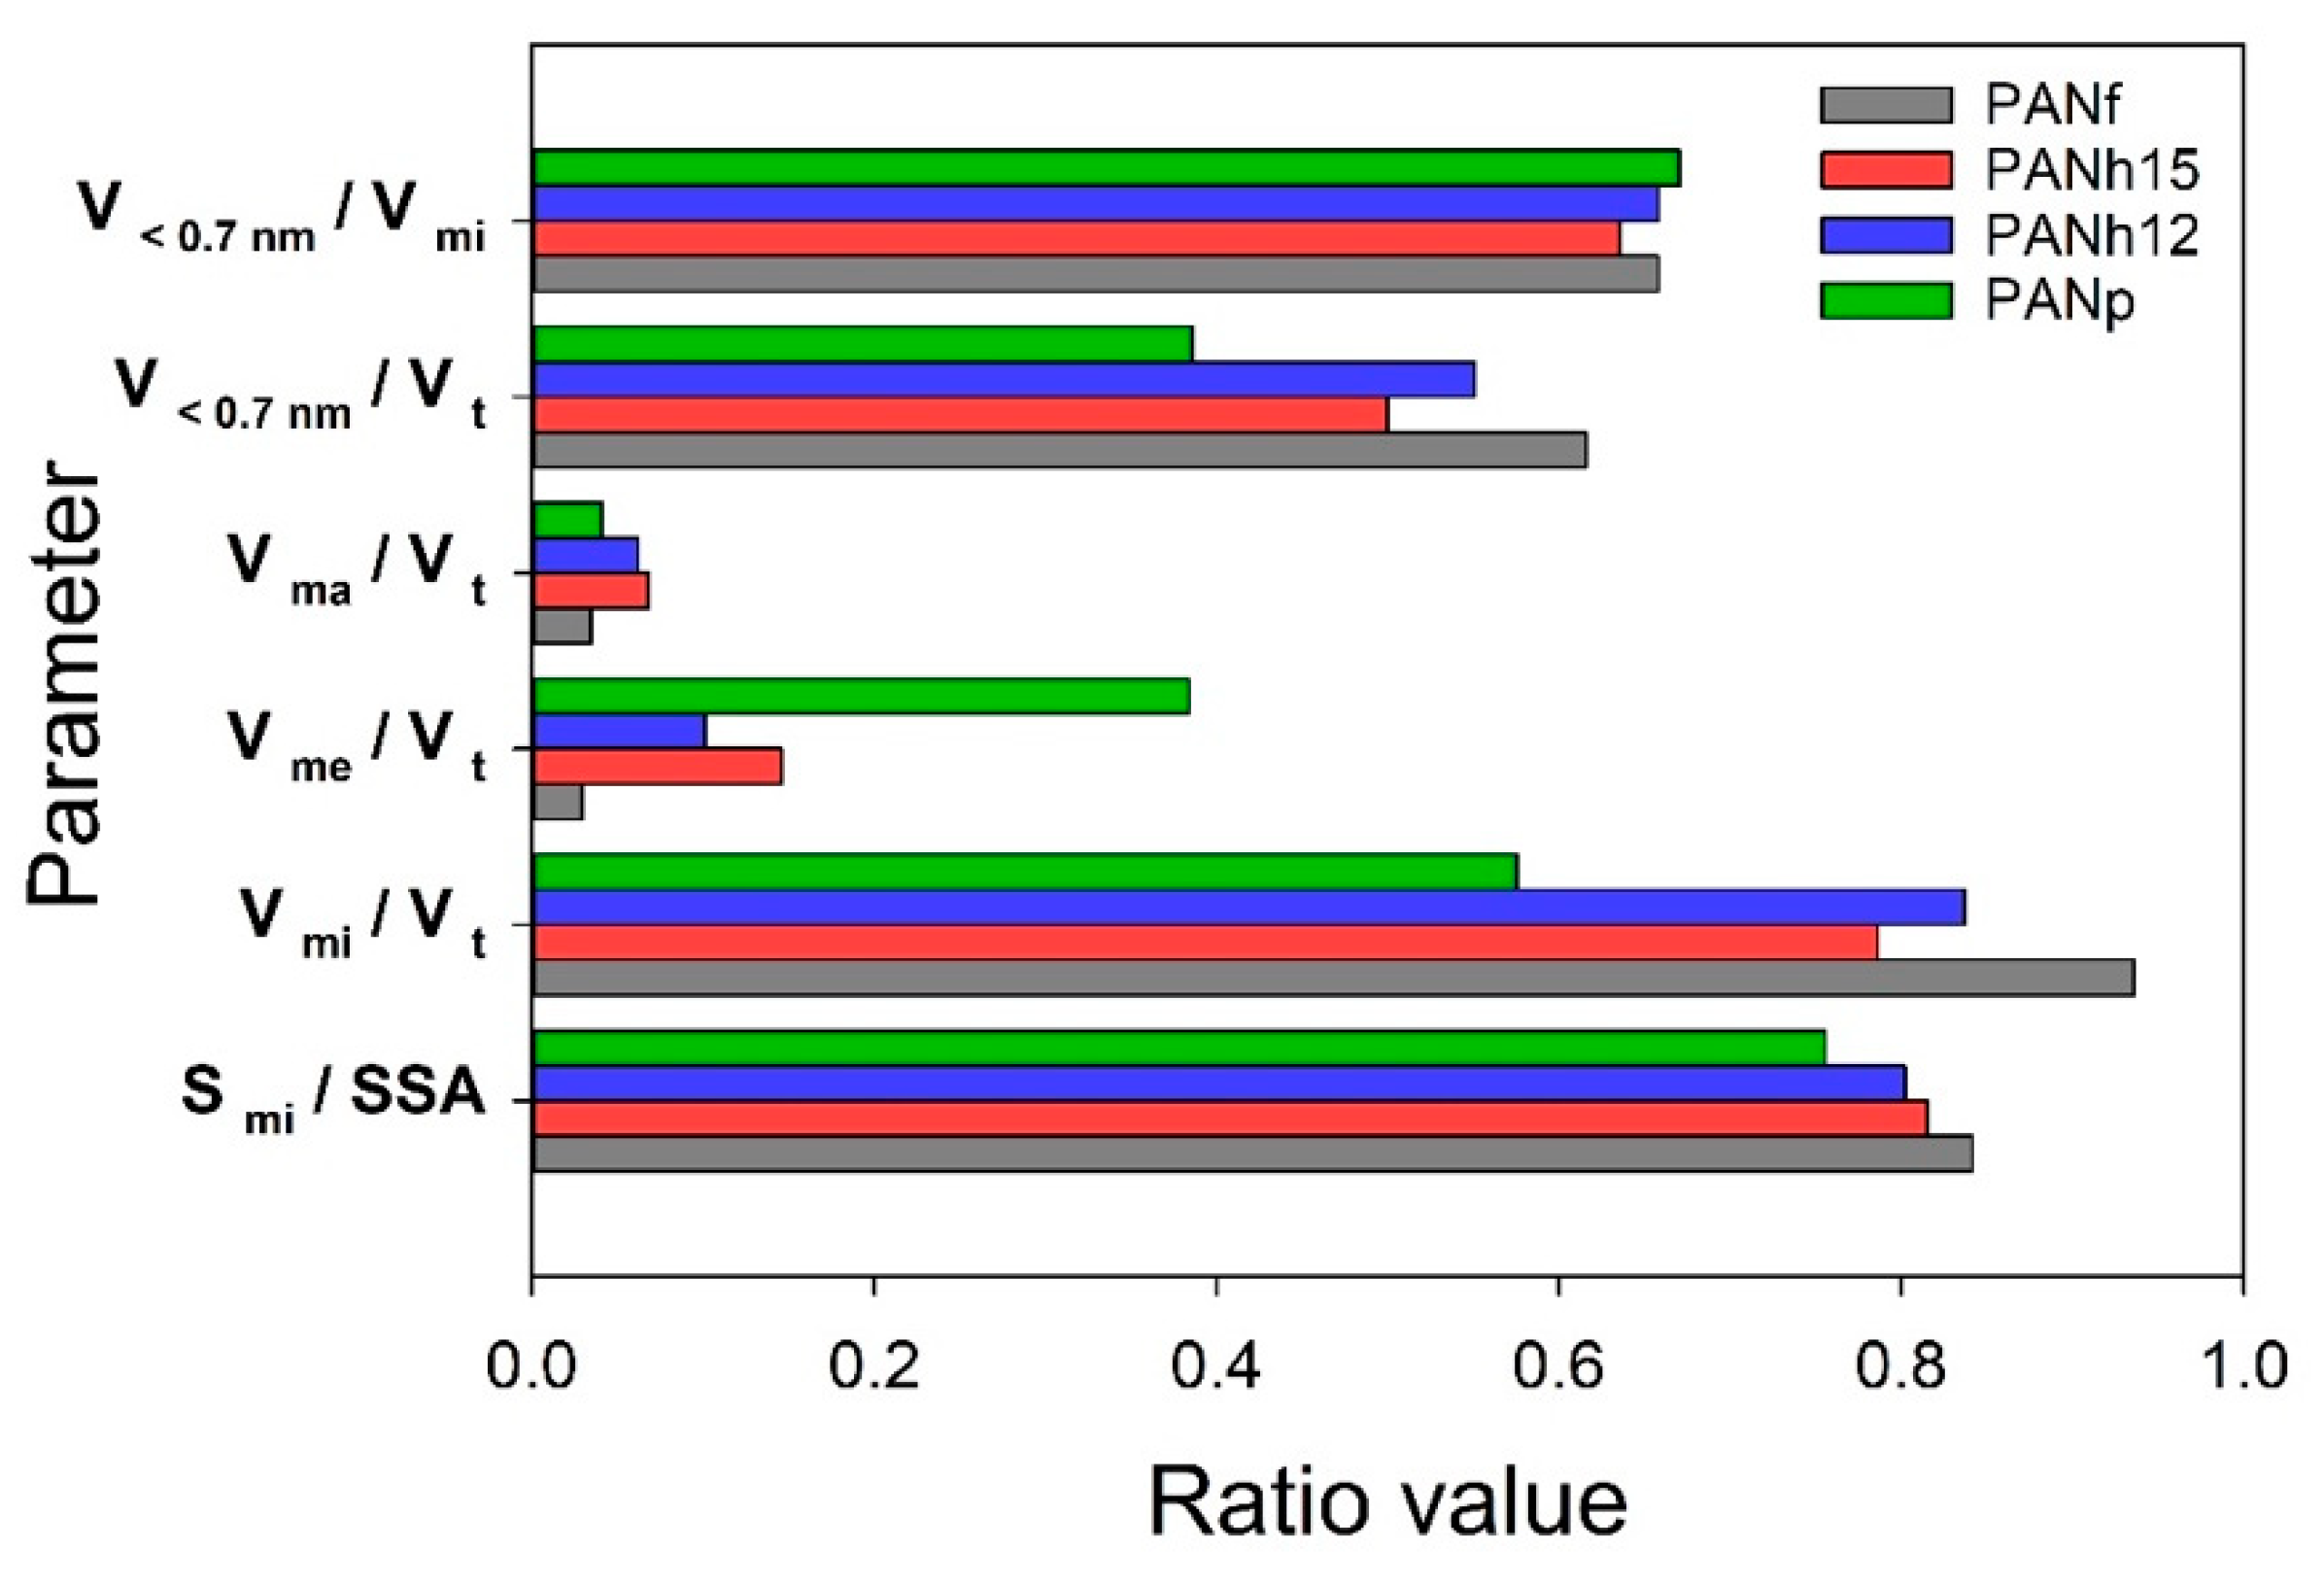
3.2. ASAP Data
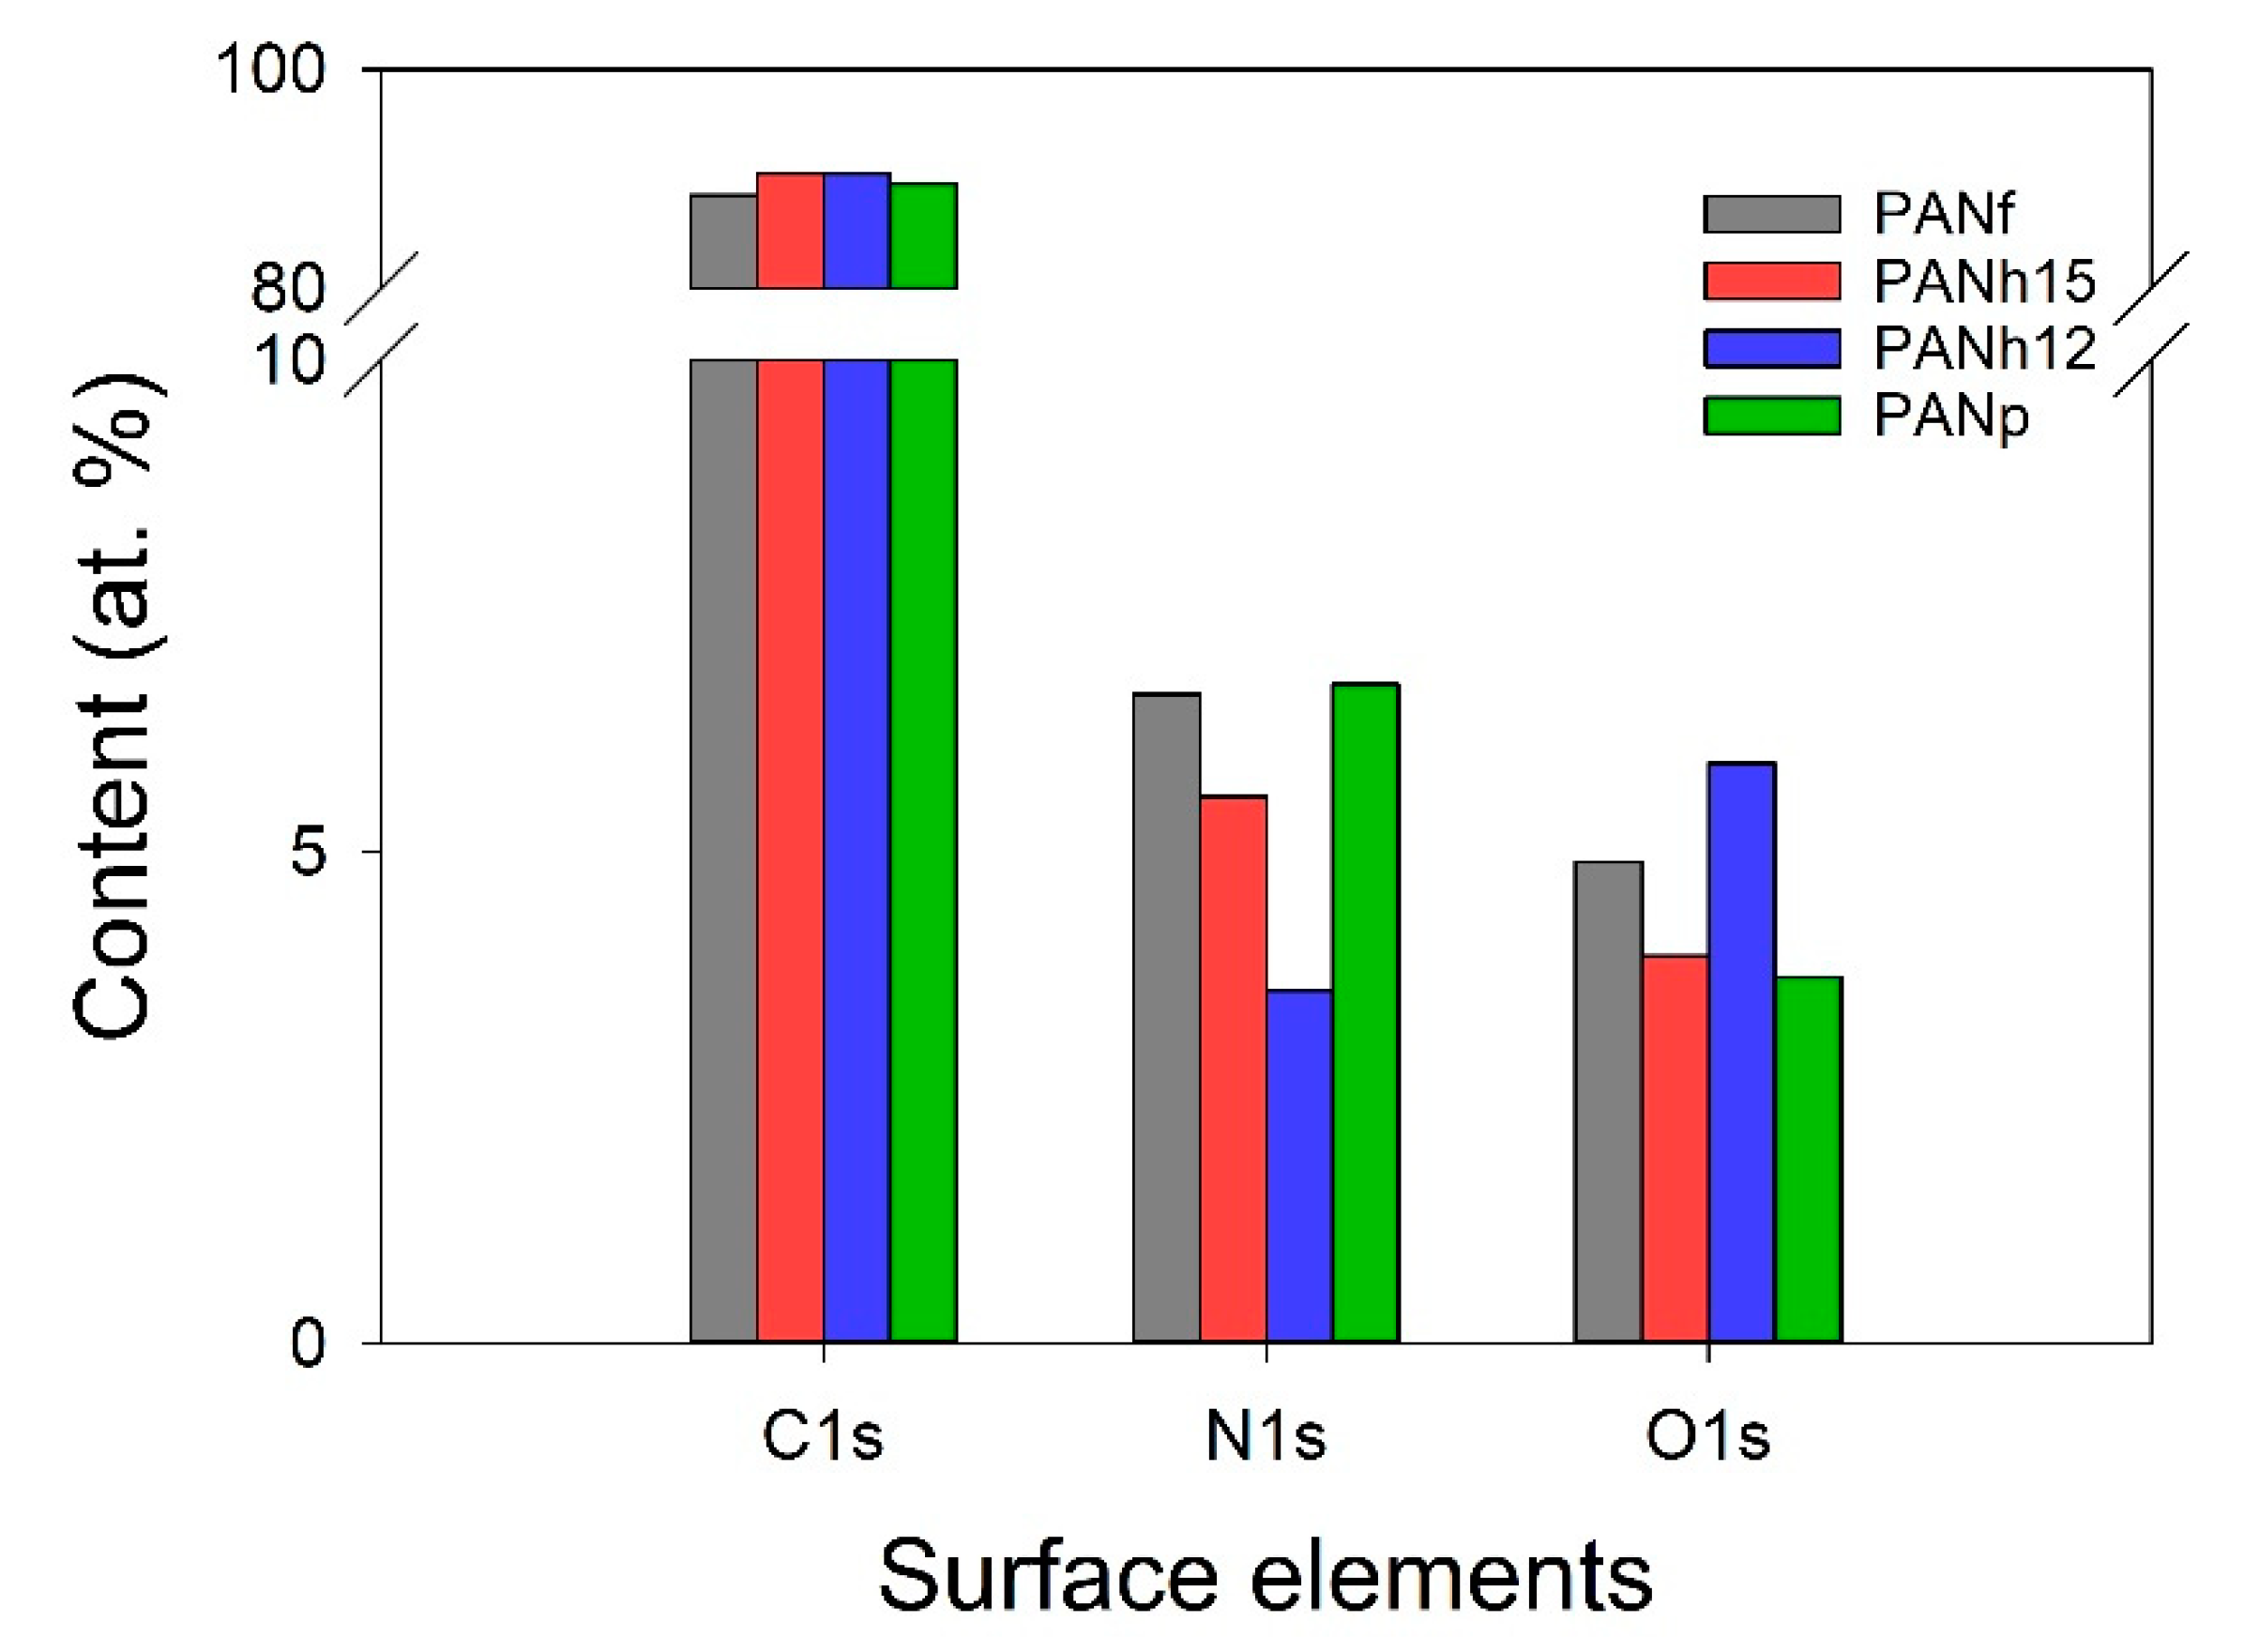
3.3. XPS Data
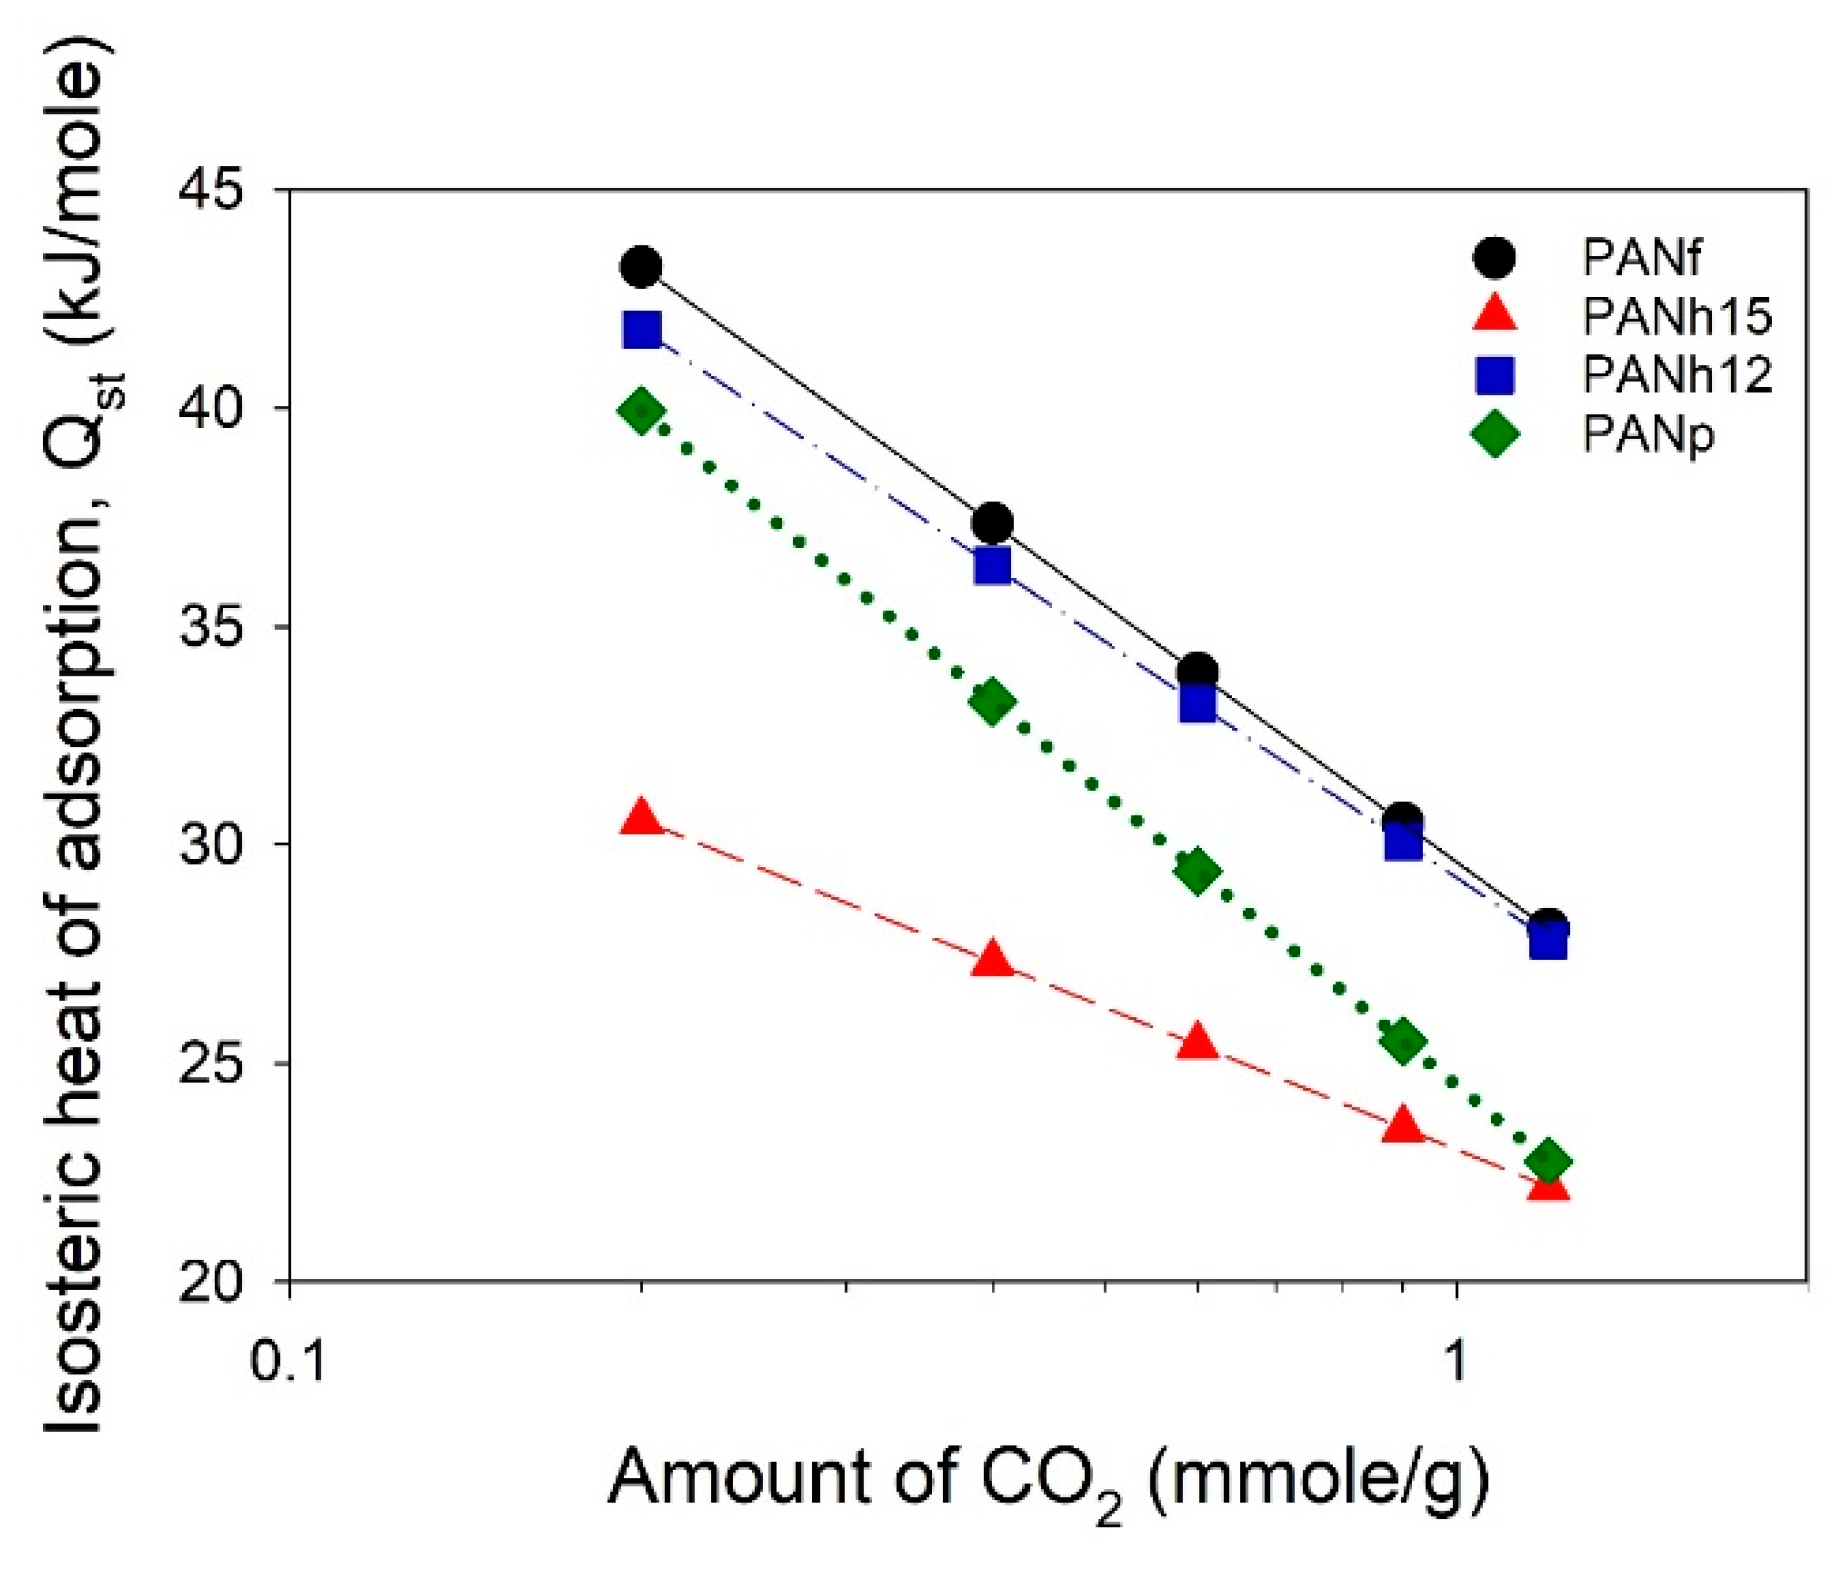
3.4. CO2 Adsorption Equilibrium
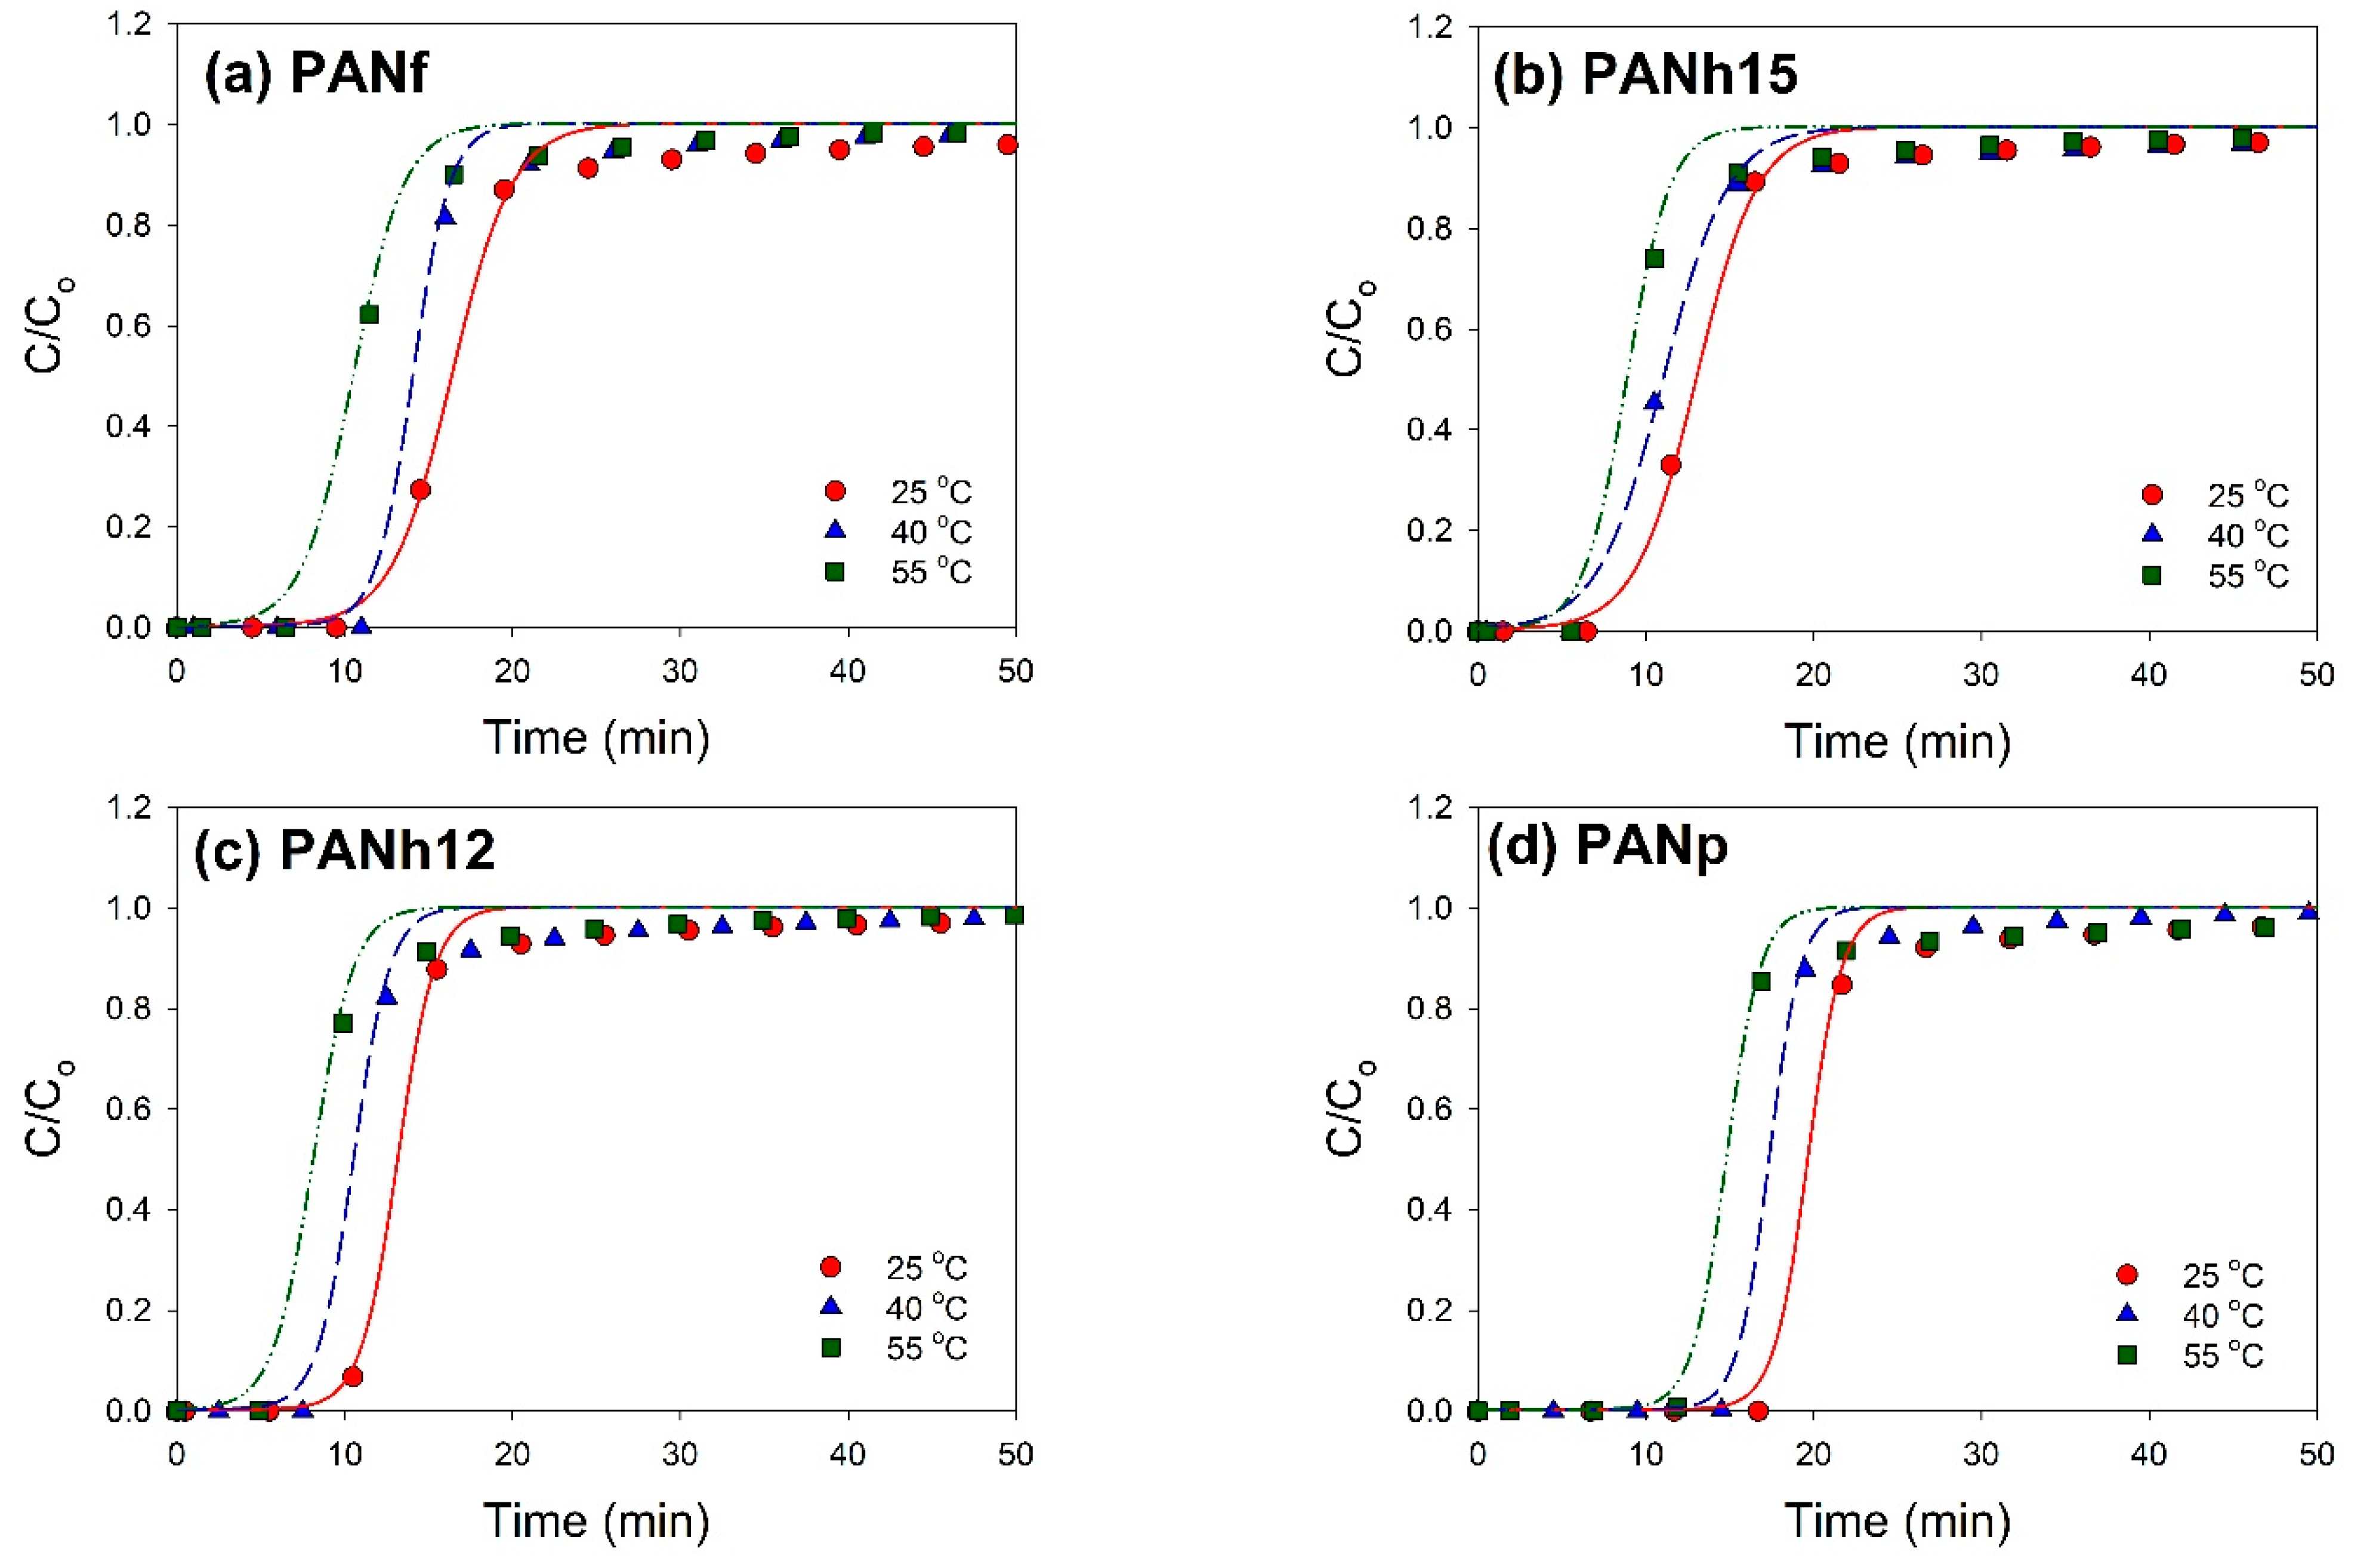
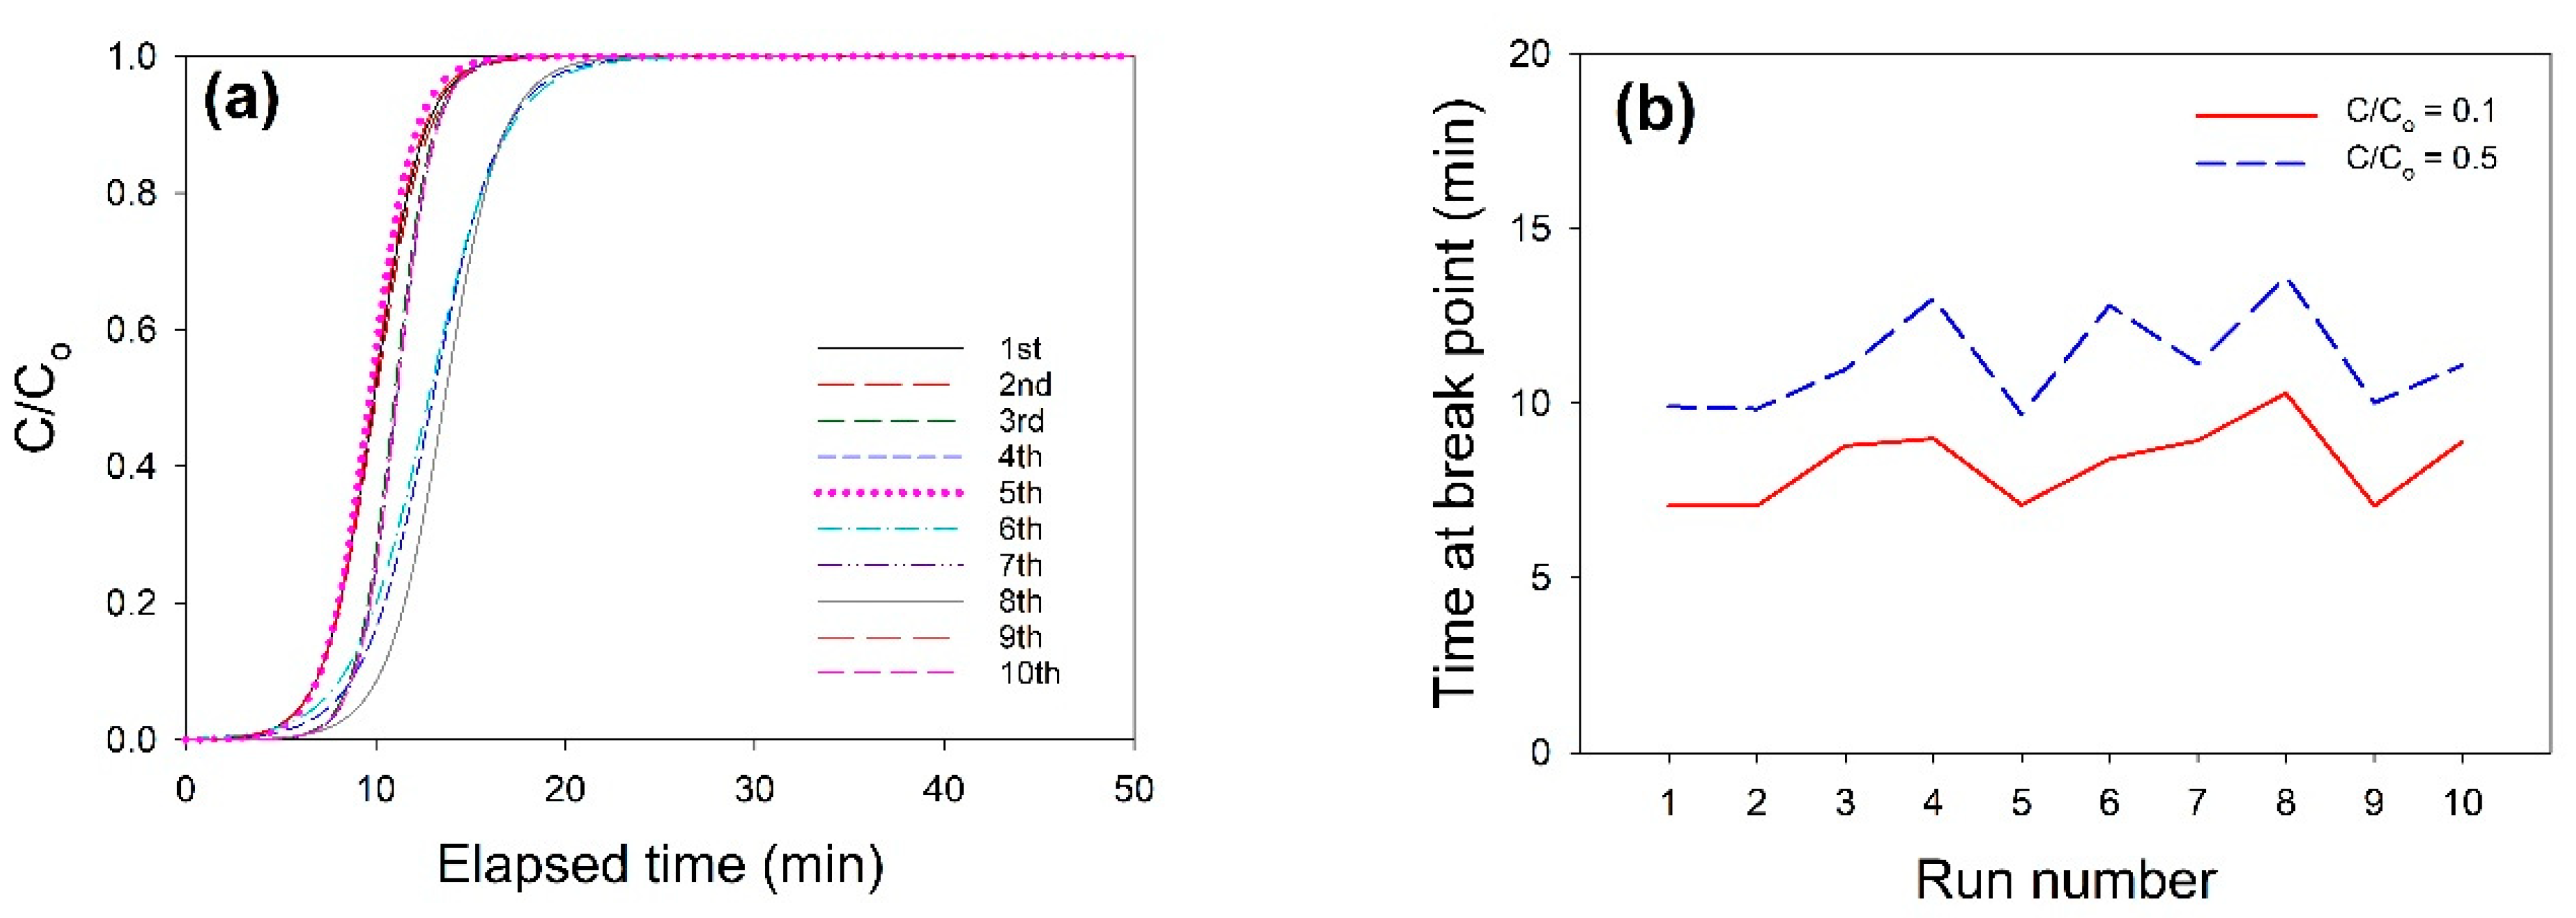
3.5. CO2 Adsorption Breakthrough Curves
4. Conclusions
Author Contributions
Funding
Institutional Review Board Statement
Informed Consent Statement
Data Availability Statement
Acknowledgments
Conflicts of Interest
References
- Huang, Z.M.; Zhang, Y.Z.; Kotaki, M.; Ramakrishna, S. A review on polymer nanofibers by electrospinning and their applications in nanocomposites. Compos. Sci. Technol. 2003, 63, 2223–2253. [Google Scholar] [CrossRef]
- Nasouri, K.; Shoushtari, A.M.; Kaflou, A. Investigation of polyacrylonitrile electrospun nanofibres morphology as a function of polymer concentration, viscosity and Berry number. Micro Nano Lett. 2012, 7, 423–426. [Google Scholar] [CrossRef]
- Ondarçuhu, T.; Joachim, C. Drawing a single nanofiber over hundreds of microns. Eur. Phys. Lett. 1998, 42, 215–220. [Google Scholar] [CrossRef]
- Yang, X.; Liu, Y.; Li, J.; Zhang, X. Influence of thermal decomposition on morphologies and magnetic properties of iron nanofibres via electrospinning. Micro Nano Lett. 2011, 6, 967–970. [Google Scholar] [CrossRef]
- Xing, X.; Wang, Y.; Li, B. Nanofiber drawing and nanodevice assembly in poly(trimethylene terephthalate). Opt. Express 2008, 16, 10815–10822. [Google Scholar] [CrossRef]
- Feng, L.; Li, S.H.; Li, H.J.; Zhai, J.; Song, Y.; Jiang, L.; Zhu, D. Super hydrophobic surface of aligned polyacrylonitrile nanoflbers. Angew. Chem. Int. Edit. 2002, 41, 1221–1223. [Google Scholar] [CrossRef]
- Martín, J.; Maiz, J.; Sacristan, J.; Mijangos, C. Tailored polymer-based nanorods and nanotubes by “template synthesis”: From preparation to applications. Polymer 2012, 53, 1149–1166. [Google Scholar] [CrossRef] [Green Version]
- Ma, P.X.; Zhang, R. Synthetic nano-scale fibrous extracellular matrix. J. Biomed. Mater. Res. 1999, 46, 60–72. [Google Scholar] [CrossRef] [Green Version]
- Liu, G.; Ding, J.; Qiao, L.; Guo, A.; Dymov, B.P.; Gleeson, J.T.; Hashimoto, T.; Saijo, K. Polystyrene-block-poly(2-cinnamoylethyl methacrylate) nanofibers preparation, characterization, and liquid crystalline properties. Chem. Eur. J. 1999, 5, 2740–2749. [Google Scholar] [CrossRef]
- Wang, J.; Ouyang, Z.; Ren, Z.; Li, J.; Zhang, P.; Wei, G.; Su, Z. Self-assembled peptide nanofibers on graphene oxide as a novel nanohybrid for biomimetic mineralization of hydroxyapatite. Carbon 2015, 89, 20–30. [Google Scholar] [CrossRef]
- Doshi, J.; Reneker, D.H. Electrospinning process and applications of electrospun fibers. J. Electrostat. 1995, 35, 151–160. [Google Scholar] [CrossRef]
- Zhang, L.; Aboagye, A.; Kelkar, A.; Lai, C.; Fong, H. A review: Carbon nanofibers from electrospun polyacrylonitrile and their applications. J. Mater. Sci. 2014, 49, 463–480. [Google Scholar] [CrossRef]
- Greiner, A.; Wendorff, J.H. Electrospinning: A fascinating method for the preparation of ultrathin fibers. Angew. Chem. Int. Ed. 2007, 46, 5670–5703. [Google Scholar] [CrossRef]
- Ahmadian, A.; Shafiee, A.; Aliahmad, N.; Agarwal, M. Overview of nano-fiber mats fabrication via electrospinning and morphology analysis. Textiles 2021, 1, 206–226. [Google Scholar] [CrossRef]
- Koski, A.; Yim, K.; Shivkumar, S. Effect of molecular weight on fibrous PVA produced by electrospinning. Mater. Lett. 2004, 58, 493–497. [Google Scholar] [CrossRef]
- Gupta, P.; Elkins, C.; Long, T.E.; Wilkes, G.L. Electrospinning of linear homopolymers of poly(methyl methacrylate): Exploring relationships between fiber formation, viscosity, molecular weight and concentration in a good solvent. Polymer 2005, 46, 4799–4810. [Google Scholar] [CrossRef]
- Shenoy, S.L.; Bates, W.D.; Frisch, H.L.; Wnek, G.E. Role of chain entanglements on fiber formation during electrospinning of polymer solutions: Good solvent, non-specific polymer–polymer interaction limit. Polymer 2005, 46, 3372–3384. [Google Scholar] [CrossRef]
- Hsu, C.M.; Shivkumar, S. Nano-sized beads and porous fiber constructs of poly(1′-caprolactone) produced by electrospinning. J. Mater. Sci. 2004, 39, 3003–3013. [Google Scholar] [CrossRef]
- Zussman, E.; Yarin, A.L.; Bazilevsky, A.V.; Avrahami, R.; Feldman, M. Electrospun polyacrylonitrile/poly(methyl methacrylate)-derived turbostratic carbon micro-/nanotubes. Adv. Mater. 2006, 18, 348–353. [Google Scholar] [CrossRef]
- Xie, W.; Khan, S.; Rojas, O.J.; Parsons, G.N. Control of micro- and mesopores in carbon nanofibers and hollow carbon nanofibers derived from cellulose diacetate via vapor phase infiltration of diethyl zinc. ACS Sustain. Chem. Eng. 2018, 6, 13844–13853. [Google Scholar] [CrossRef]
- Zhang, L.; Hsieh, Y.L. Carbon nanofibers with nanoporosity and hollow channels from binary polyacrylonitrile systems. Eur. Polym. J. 2009, 45, 47–56. [Google Scholar] [CrossRef]
- Kaerkitcha, N.; Chuangchote, S.; Sagawa, T. Control of physical properties of carbon nanofibers obtained from coaxial electrospinning of PMMA and PAN with adjustable inner/outer nozzle-ends. Nanoscale Res. Lett. 2016, 11, 186. [Google Scholar] [CrossRef] [Green Version]
- Gbewonyo, S.; Carpenter, A.W.; Gause, C.B.; Mucha, N.R.; Zhang, L. Low thermal conductivity carbon fibrous composite nanomaterial enabled by multi-scale porous structure. Mater. Des. 2017, 134, 218–225. [Google Scholar] [CrossRef]
- Zhou, Z.; Liu, T.; Khan, A.U.; Liu, G. Block copolymer–based porous carbon fibers. Sci. Adv. 2019, 55, 6852. [Google Scholar] [CrossRef] [Green Version]
- Qu, H.; Wei, S.; Guo, Z. Coaxial electrospun nanostructures and their applications. J. Mater. Chem. A 2013, 1, 11513–11528. [Google Scholar] [CrossRef]
- El-Deen, A.G.; Barakat, N.A.M.; Khalild, K.A.; Kim, H.Y. Hollow carbon nanofibers as an effective electrode for brackish water desalination using the capacitive deionization process. New J. Chem. 2014, 38, 198–205. [Google Scholar] [CrossRef]
- Park, S.H.; Jung, H.R.; Lee, W.J. Hollow activated carbon nanofibers prepared by electrospinning as counter electrodes for dye-sensitized solar cells. Electrochim. Acta 2013, 102, 423–428. [Google Scholar] [CrossRef]
- Wu, Y.; Gao, M.; Li, X.; Liu, Y.; Pan, H. Preparation of mesohollow and microporous carbon nanofiber and its application in cathode material for lithium–sulfur batteries. J. Alloy. Compd. 2014, 608, 220–228. [Google Scholar] [CrossRef]
- Peng, Y.T.; Lo, C.T. Electrospun porous carbon nanofibers as lithium ion battery anodes. J. Solid State Electrochem. 2015, 19, 3401–3410. [Google Scholar] [CrossRef]
- Zhang, T.; Qu, H.; Sun, K. Development of polydopamine coated electrospun PAN/PMMA nanofibrous membrane as composite separator for Lithium-ion batteries. Mater. Lett. 2019, 245, 10–13. [Google Scholar] [CrossRef]
- Zhao, W.; Yamamoto, Y.; Tagawa, S. Regulation of the thermal reactions of polyacrylonitrile by c-irradiation. Chem. Mater. 1999, 11, 1030–1034. [Google Scholar] [CrossRef]
- Qin, X.H. Structure and property of electrospinning PAN nanofibers by different preoxidation temperature. J. Therm. Anal. Calorim. 2010, 99, 571–575. [Google Scholar] [CrossRef]
- Lee, J.S.; Kim, J.H.; Kim, J.T.; Suh, J.K.; Lee, J.M.; Lee, C.H. Adsorption equilibria of CO2 on zeolite 13X and zeolite X/activated carbon composite. J. Chem. Eng. Data 2002, 47, 1237–1242. [Google Scholar] [CrossRef]
- ASTM D5160-95. Standard Guide for Gas.-Phase Adsorption Testing of Activated Carbon; ASTM International: West Conshohocken, PA, USA, 2019. [Google Scholar]
- Granite, E.J.; Pennline, H.W. Photochemical removal of mercury from flue gas. Ind. Eng. Chem. Res. 2002, 41, 5470–5476. [Google Scholar] [CrossRef]
- Chou, C.T.; Chen, C.Y. Carbon dioxide recovery by vacuum swing adsorption. Sep. Purif. Technol. 2004, 39, 51–65. [Google Scholar] [CrossRef]
- Huang, Z.H.; Kang, F.; Liang, K.M.; Hao, J. Breakthrough of methyethylketone and benzene vapors in activated carbon fiber beds. J. Hazard. Mater. B 2003, 98, 107–115. [Google Scholar] [CrossRef]
- Biniak, S.; Szymanski, G.; Siedlewski, J.; Swiatkowski, A. The characterization of activated carbons with oxygen and nitrogen surface groups. Carbon 1997, 35, 1799–1810. [Google Scholar] [CrossRef]
- Pamula, E.; Rouxhet, P.G. Bulk and surface chemical functionalities of Type III PAN-based carbon fibers. Carbon 2003, 41, 1905–1915. [Google Scholar] [CrossRef]
- Raymundo-Pinero, E.; Cazorla-Amoros, D.; Linares-Solano, A. The role of different nitrogen functional groups on the removal of SO2 from flue gases by N-doped activated carbon powders and fibers. Carbon 2003, 41, 1925–1932. [Google Scholar] [CrossRef]
- Chiang, Y.C.; Hsu, W.L.; Lin, S.Y.; Juang, R.S. Enhanced CO2 adsorption on activated carbon fibers grafted with nitrogen-doped carbon nanotubes. Materials 2017, 10, 511. [Google Scholar] [CrossRef]
- Toth, J. Isotherm equations for monolayer adsorption of gases on heterogeneous solid surfaces. In Fundamentals of Adsorption; Myers, A., Belfort, G., Eds.; Engineering Foundation: New York, NY, USA, 1984; pp. 657–665. [Google Scholar]
- To, J.W.F.; He, J.; Mei, J.; Haghpanah, R.; Chen, Z.; Kurosawa, T. Hierarchical N-doped carbon as CO2 adsorbent with high CO2 selectivity from rationally designed polypyrrole precursor. J. Am. Chem. Soc. 2016, 38, 1001–1009. [Google Scholar] [CrossRef]
- Chiang, Y.C.; Lee, S.T.; Leo, Y.J.; Tseng, T.L. Importance of pore structure and surface chemistry in carbon dioxide adsorption on electrospun carbon nanofiber. Sens. Mater. 2020, 32, 2277–2288. [Google Scholar]
- Xiong, L.; Wang, X.F.; Li, L.; Jin, L.; Zhang, Y.G.; Song, S.L.; Liu, R.P. Nitrogen-enriched porous carbon fiber as CO2 adsorbent with superior CO2 selectivity by air activation. Energy Fuels 2019, 33, 12558–12567. [Google Scholar] [CrossRef]
- Heo, Y.J.; Zhang, Y.; Rhee, K.Y.; Park, S.J. Synthesis of PAN/PVDF nanofiber composites-based carbon adsorbents for CO2 capture. Composites B 2019, 156, 95–99. [Google Scholar] [CrossRef]
- Jeong, D.; Jie, W.; Adelodun, A.A.; Kim, S.; Jo, Y. Electrospun melamine-blended activated carbon nanofibers for enhanced control of indoor CO2. J. Appl. Polym. Sci. 2019, 136, 47747. [Google Scholar] [CrossRef]
- Ojeda-López, R.; Esparza-Schulz, J.M.; Pérez-Hermosillo, I.J.; Hernández-Gordillo, A.; Domínguez-Ortiz, A. Improve in CO2 and CH4 adsorption capacity on carbon microfibers synthesized by electrospinning of PAN. Fibers 2019, 7, 81. [Google Scholar] [CrossRef] [Green Version]
- Chiang, Y.C.; Wu, C.Y.; Chen, Y.J. Effects of activation on the properties of electrospun carbon nanofibers and their adsorption performance for carbon dioxide. Sep. Purif. Technol. 2020, 233, 116040. [Google Scholar] [CrossRef]
- Brasquet, C.; Cloirec, P.L. Adsorption onto activated carbon fibers: Applications to water and air treatments. Carbon 1997, 35, 1307–1313. [Google Scholar] [CrossRef]


| Sample | SSA α (m2/g) | Smi β (m2/g) | Vt γ (cm3/g) | Vma φ (cm3/g) | Vme η (cm3/g) | Vmi η (cm3/g) | V<0.7 nm η (cm3/g) | rp ξ (nm) | (mmol/g) at 25 °C | |
|---|---|---|---|---|---|---|---|---|---|---|
| 0.15 atm | 1 atm | |||||||||
| PANf | 733 | 617 | 0.3616 | 0.0125 | 0.0106 | 0.3385 | 0.2227 | 0.457 | 0.97 | 2.95 |
| PANh15 | 1222 | 996 | 0.7121 | 0.0485 | 0.1038 | 0.5598 | 0.3558 | 0.476 | 0.86 | 3.04 |
| PANh12 | 884 | 709 | 0.4840 | 0.0299 | 0.0490 | 0.4050 | 0.2665 | 0.503 | 0.94 | 3.16 |
| PANp | 825 | 624 | 0.6293 | 0.0256 | 0.2415 | 0.3622 | 0.2429 | 0.735 | 0.88 | 2.86 |
| Sample | Binding Energy (eV) | ||||||
|---|---|---|---|---|---|---|---|
| 395.7 | 398.4 | 400.1 | 401.2 | 402.4 | 404 | 405 | |
| Aromatic N-imines | Pyridine -Type N | Pyrrole or Pyridone | Quarternary N | Pyridine- N oxides | Shake-Up Satellites | NO2 | |
| PANf | — | 21.8 | 20.5 | 18.4 | 10.3 | 1.2 | 27.8 |
| PANh15 | 8.0 | 20.6 | 29.1 | 16.7 | 11.9 | — | 13.7 |
| PANh12 | 0.3 | 37.2 | 7.7 | 22.4 | 14.2 | — | 18.2 |
| PANp | 6.2 | 32.2 | 15.3 | 19.5 | 9.4 | 2.8 | 14.7 |
| Adsorbent | Precursor | SSA (m2/g) | Conc. of CO2 | Temp. (°C) | CO2 Uptake (mmol/g) | Reference |
|---|---|---|---|---|---|---|
| Hollow ACNFs α | PAN | 884 | 1 atm 0.15 atm | 25 | 3.16 0.94 | This study |
| ACNFs | PAN | 872 | 1 atm 0.15 atm | 25 | 3.47 1.01 | [44] |
| CNFs β | PAN | 306 | 1 atm 0.15 atm | 25 | 2.52 1.11 | [44] |
| ACNFs | PAN | 486 | 1 bar 0.15 bar | 25 | 2.25 1.09 | [45] |
| CNFs | PAN | 12 | 1 bar | 25 | 0.55 | [46] |
| ACNFs | PAN, polyvinylidene fluoride | 925 | 1 bar | 25 | 2.21 | [46] |
| ACNFs | PAN | 412 | 1 bar | 25 | 0.92 | [47] |
| ACNFs | PAN Melamine | 547 | 1 bar | 25 | 1.44 | [47] |
| CNFs | PAN | 966 | 1 bar | 25 | 2.9 | [48] |
| ACNFs | PAN | 897 | 1 atm 0.15 atm | 25 | 3.17 1.00 | [49] |
| ACFs γ | PAN | 966 | 1 atm | 25 | 2.33 | [41] |
| Sample | Temp. (°C) | τ (min) | K′ (1/min) | R2 |
|---|---|---|---|---|
| PANf | 25 | 16.40 | 0.553 | 0.99009 |
| 40 | 14.07 | 0.904 | 0.99453 | |
| 55 | 10.52 | 0.655 | 0.99294 | |
| PANh15 | 25 | 13.01 | 0.547 | 0.99352 |
| 40 | 11.04 | 0.515 | 0.99093 | |
| 55 | 8.87 | 0.779 | 0.99147 | |
| PANh12 | 25 | 13.17 | 0.895 | 0.99363 |
| 40 | 10.54 | 0.918 | 0.99206 | |
| 55 | 8.14 | 0.827 | 0.98918 | |
| PANp | 25 | 19.65 | 0.977 | 0.99107 |
| 40 | 17.34 | 1.057 | 0.99462 | |
| 55 | 14.80 | 0.980 | 0.98692 |
Publisher’s Note: MDPI stays neutral with regard to jurisdictional claims in published maps and institutional affiliations. |
© 2021 by the authors. Licensee MDPI, Basel, Switzerland. This article is an open access article distributed under the terms and conditions of the Creative Commons Attribution (CC BY) license (https://creativecommons.org/licenses/by/4.0/).
Share and Cite
Chiang, Y.-C.; Huang, C.-C.; Chin, W.-T. Carbon Dioxide Adsorption on Carbon Nanofibers with Different Porous Structures. Appl. Sci. 2021, 11, 7724. https://doi.org/10.3390/app11167724
Chiang Y-C, Huang C-C, Chin W-T. Carbon Dioxide Adsorption on Carbon Nanofibers with Different Porous Structures. Applied Sciences. 2021; 11(16):7724. https://doi.org/10.3390/app11167724
Chicago/Turabian StyleChiang, Yu-Chun, Chih-Cheng Huang, and Wei-Ting Chin. 2021. "Carbon Dioxide Adsorption on Carbon Nanofibers with Different Porous Structures" Applied Sciences 11, no. 16: 7724. https://doi.org/10.3390/app11167724