1. Introduction
The economic sectors are constituted of a series of diverse organizations, which are the basis of the economy. With reference to the 2019 version of the Global Competitiveness Report of the World Economic Forum (WEF), the economies with more potential are led by the United States of America jointly with Singapore, Germany, Switzerland, and Japan, while in the other extreme, Haiti, Yemen, and Chad are the less competitive economies. This report is not necessarily only associated with greater income competitiveness but also with outstanding economic results, including life satisfaction [
1]. México was positioned in 48th place according to this report, positioning it second place in Latin America below Chile [
2].
Acknowledging the extraordinary events that occurred in 2020, and the unified global effort required to confront the health crisis and its socioeconomic consequences, the WEF suspended spreading the Global Competitiveness Index rankings. Nevertheless, the 2021 edition will retake the comparative assessment, providing a renewed framework to direct future economic growth.
In México, the activities that have shown greater growth are those of the tertiary sector. The economic activities in the commercial and service sectors showed an annual increase of 3.6% in July 2019. This sector positively influenced the total economic activity in México, which increased by 2.8% in July 2019. Within the tertiary sector, commercial activity was in second place in economic expansion, which grew by 5.2% in the annual comparison [
3].
According to data of the Ministry of Agriculture, Livestock, Hydraulic Resources, Fishing and Aquaculture [
4], of the total exports, 73% were to the United States of America and Canada, the main commercial partners of México.
Sonora—the northwestern state in México bordering Arizona, USA—is first-place in the worldwide export of pecan nuts, third in crystal wheat and asparagus, and seventh in zucchini. At the national level, the state is the leader in the production of zucchini, watermelon, potato, wheat, grapes, and asparagus, and second place in pecan nuts.
In comparison with the rest of the country, the state stands out for producing all the food in the basic food basket. Additionally, in recent years, important growth has been observed in this sector, and sources of employment have strengthened [
5].
According to the information gathered by ProMéxico (Federal Government Organisation that coordinates strategies to strengthen the international economy), the main product that the State of Sonora negotiates is electrical manufacturing, with 19.7% of the total export value. Livestock and agriculture products are positioned in second place in the list with 9.8%, and the metal-mechanic industry is in third place with 8.8% of the total export value. Likewise, the main countries that received products from Sonora were the United States receiving 90.1% of the total export, followed by Japan with 3%, and in third place was Belgium with 0.9% [
6].
Export and import growth are due, in great measure, to the Treaty (T-MEC) between México, the United States (USMCA), and Canada (CUSMA), which allows dealing (buying-selling) between participating countries by eliminating customs tariffs. Knowing that the United States is the greatest destination to receive products from México, business is reciprocal, since the US is the main issuer of liquified petroleum (LP), natural gas, gasoline, poultry, apples, pears, clothing, shoes, and more (Proyecto Puente, 2018). One of the main regions in the southern part of the state of Sonora that produces wheat is Valle del Yaqui, located in Ciudad Obregón, where the Ministry of Agriculture, Livestock, Hydraulic Resources, Fisheries, and Aquaculture (SAGARPA) [
4] will be located, with the purpose of boosting farmland and breeding grounds and making good use of resources [
7].
1.1. Problematic Situation
The focus of study in this research is centered on dry, long shelf-life products used in the packaging process of a marketing company in the southern part of Sonora, México.
The organization where this study is performed is from the business subsector located in the tertiary sector because buying–selling activities are performed for greater or lesser products of the basic food basket, specifically shelf products (dry) such as oil, instant coffee, tuna fish, wheat cereal, rice, beans, and pasta (macaroni, spaghetti, and noodles). The focus of the study is in the area of product packaging (production) given that the activity of placing individual products is in containers that group together merchandise in a package. The trajectory of these articles performed by the enterprise is as follows: they go into pallets in packages for wholesale or retail (depending on the type of demand) and are taken to a warehouse.
Figure 1 represents the process to obtain the packages of the basic food basket.
When an order arrives at the organization, product picking (recollection) is performed in the warehouse, and it is placed in crates used in production to form the packages. Once ready they are passed on to be sheltered in the conservation area. If the order is wholesale, the products are taken directly to the warehouse. When the required packages are complete, they are inspected and transferred to the corresponding transport according to the demand.
The identification of the logistics performance indicators that support recognizing breaches in the production link is important. Starting from the indicators of the current demand of 25 packages per week, usage was found to be 1.38% and efficiency 1.66%, which were due to the organization not operating at its maximum capacity (83%). Ideally, 300 packages/day should have been made (data established by the decision-makers) However, with the resources available, such as labor, time available, and one-package processing time, only up to 250 packages/day could be produced.
1.2. Research Question and Objective
According to the previous discussion, the following research question for this study is established. What technological solution is required to evaluate the utilization of a packaging process for a shelf product in the function of the demand in an organization dedicated to marketing regional products?
Therefore, the objective in this case study is to develop a graphic interface that allows analyzing the usage of the shelf product packaging process in different scenarios considering demand and allowing decision-making based on data.
2. Literature Review
According to Ries [
8]—father of the Lean Startup methodology—the success of his methodology lies in creating products that the client needs and is willing to pay for, utilizing resources efficiently. The problem of the past business methodology is that they work with financing, creating the product but never taking the client’s opinion into account. Lean Startup is a methodology that implements innovative ideas, not in an enterprise, but in a human institution that creates new products under extreme conditions.
The value stream map (VSM) that supports visualizing what occurs, either a process, an enterprise, or a set of them, allows for observing the process flux simultaneously. Then, the opportunity areas of an enterprise in its current process are detected to opt for a change in the lean initiative, and after reading, the flux of data and materials are conceptualized in a process or between enterprises. All of this is performed to detect improvement areas by eliminating waste and implementing lean tools [
9,
10].
The main idea of these methodologies is to conceptualize and parametrize a system initially. A time horizon is set up in which performance can be assessed in the supply chain where different policies and decisions to observe future scenarios can be considered. In this sense, the system dynamics methodology allows for clarity in the VSM and simulating dynamic events in the function of variables and parameters that are related to knowing their behavior on time [
11,
12].
System dynamics are in charge of studying system data feedback and the means by which models are used for setting up and approaching problems, which are made with the purpose of showing the organization structure and observing how such variables interact in the success of the enterprise [
13]. From another point of view, different authors [
14,
15,
16,
17] have explained system dynamics as the behavior of a system adopting the methodology created [
13] where a language is used to simulate and model complex problems.
On the one hand, García [
16] mentioned that system dynamics, according to Forrester [
14], is the methodology that allows for understanding change and making use of equations to study complex phenomena. On the other hand, Senge [
18] defines a system as a totality, whose components gather because they affect reciprocally along time and work with a common purpose—the word originally meant “causing a union”. Through compiling different concepts, a system is a set of processes that work jointly for a common goal, which may be observed and analyzed by simulation.
Simulation is a process by which a mathematical model of a real aspect is established—all this by means of a computer [
14]. On their part, Mantufar et al. [
19] considered simulation a tool used to respond to questions about an uncertain future, sharing the idea that if the problem can be imagined, then it can be simulated. A scenario represents the creation of a set of actions that gives, as a result, a history to test business plans or projects, thus, supporting strategic decision-makers facing uncertainties that may happen [
20,
21]. Similarly, Vergara et al. [
22] agreed in their work, that a scenario is the description of a potential or possible future, including the detail of how to reach it and explore the effect of several events jointly.
The following empirical studies related to business process management (BPM) have been considered from a perspective that allows for observing the enterprise as an organization that analyzes the current state and identifies areas of performance improvement to create a more efficient and effective organization. The company takes a step back and looks at all of these processes as a whole and individually.
One of the most important and recent contributions is that of AlMulhim [
23], who explored the impact of digital transformation to evaluate business performance with the support of intelligent technologies. The main findings, starting from the application of 460 participants from 150 small and medium enterprises, demonstrated the importance of relating digital transformation and business performance.
The HORSE Project—where BPM was applied—investigated several of the new technologies to find novel ways to improve flexibility. The purpose was to develop a system integrating these new technologies to support efficient and flexible manufacturing based on the application and extension of BPM to manage dynamic manufacturing processes [
24].
On the other hand, Kremert et al. [
25] used a modeling process for intelligent enterprises starting from understanding strategic topics to observe future behavior and trends. Their main findings show that the Business Process Model and Notation (BPMN), Unified Modeling Language (UML), and Petri Net are the most relevant languages for smart manufacturing. The authors highlighted the need for developing new languages capable of representing the dynamics, interoperability, and multiple technologies to be considered.
A study developed in Germany by Kowalkiewicz et al. [
26] was based on BPM, where a particular process was modeled in a business to measure its dependence on the inflexibility of the traditional chart models, which has been considered as the main source of process rigidity.
One of the studies related to operational performance (OP) and the use of Lean Management (LM) techniques for the development of small and medium enterprises is that set out by Abdallah and Aljuaid [
27], who applied and analyzed 268 surveys; among their main findings were that the association of lean manufacturing techniques have a positive effect in operational performance. However, the effect of technical LM on both types of innovation was not significant. In addition, process and management innovations positively mediated the social LM–OP relationship.
Empirical studies have been developed with system dynamics related to the case study. For example, Perez and Parra [
28] improved an assemblage line of front car seats. They considered modification in quantity and distribution of human talent and operations using a simulation model that represented and identified two improvement strategies. The first one, with almost null investment, increased line productivity by 12% and reduced the idle time by 44%. The second one, called “integration of work centers”, broke production paradigms and allowed for obtaining still greater benefits [
28].
From another perspective, Cardiel, Baeza, and Lizarraga [
29] analyzed the complexity associated with the production systems to improve process yield through the Six Sigma philosophy, using a dynamic model; the results showed an improvement in process yield by increasing the Sigma level that allowed for validating the proposed approach.
The work of Amezquitas and Chamorro [
30] simulated the behavior of the main agribusiness productive chains that belong to the Department of Bolivar. The authors found different scenarios that were set out to determine the sensitivity and how these changes affected the productivity, employment, and usefulness of the actors. When 10% of increases and decreases showed in the participation percentages of the hectares harvested, all the actors experienced similar variations, either profits and/or losses.
Indeed, an informatics model conducted by Soto et al. [
31] allowed for simulating the effect of Knowledge Management on the corn production industry. The result achieved was due to the application of Knowledge Management production that increased through system stability. Another recommendation is to perform the same study with the same methodology but applied to other agribusiness environments.
Several works have focused—as is this research—on the study of the agri-food supply chain, such as Herrera and Orjuela [
32], who identified the implementation dynamics of traceability technologies in the fruit chain. As a result, the conclusion of the implementation effect of traceability technology in the fruit supply chain was reached, as well as the relationship with investment capacity and product quality. Toro and Becerra [
33] analyzed the cotton agri-chain in Colombia using system dynamics to identify potential improvements at the logistics and decision-making levels, considering growth and variables, such as the harvested area and the production of the cotton sector. Analysis and diagnosis of the cotton sector and scenarios started from different variables to create a model that generated improvement in these variables.
Indore et al. [
34] estimated the future demand of construction materials in Colombia and the necessary minerals to produce them using system dynamics and material flux analysis. The results indicated that 176.9 Mt of crushed aggregate, river sand, gray cement, dead rock, and fired ceramics were required, without considering secondary material supply from 2014 to 2017. For cement and concrete production, 15.4 Mt of limestone, 14.9 of gravel, 14.1 of gypsum, 13.3, 9.7, and 9.3 of clay, iron minerals, and sand, respectively, were also required.
3. Materials and Methods
The materials used to execute the project included the following software: Vensim PLE®, (Version 8.2.1, Ventana System Inc., Harvard, MA, USA, 2019) for causal loops diagrams; Stella Architect®, 2020 (Version 1.9.1, Isee Systems Inc., Lebanon, NH, USA, 2019) for flow and stock models, simulation, and graphical interfaces. This software was chosen because it included the module for designing graphical interfaces and could also run them online, which is not expensive for the final user.
Excel® (Microsoft, Redmond, WA, USA, 2018) was used to process data and information that did not need additional modules for specific statistics considerations; basic arithmetical functions were included in formulas.
Visio® (version 15.0.4623.100, Microsoft, Redmond, WA, USA, 2013) was used for flow diagrams and íGrafx® (version 17.8.1.816.3586, Tualatin, OR, USA, 2021) for VSM, which is one of the most popular software programs for creating Value Stream Maps.
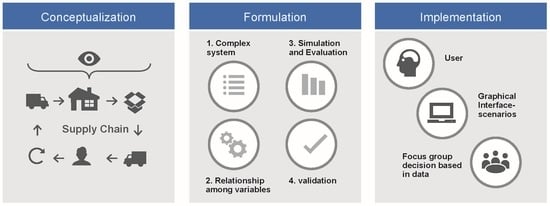
The method was followed in six steps according to Lagarda-Leyva [
11]: (1) Mapping the process being studied by means of a value stream map (VSM); (2) Creating a causal diagram; (3) Elaborating the stock and levels diagram, as well as the equations; (4) Validating the current model; (5) Simulating scenarios; (6) Creating the graphic interface. See
Figure 2.
As a suggestion for stage 5 of the method, open source software (OSS) could be considered since Stella Architect (Version 1.9.1, Isee Systems Inc., Lebanon, NH, USA, 2019) software has an elevated cost in the market and could be a limit in implementing the solution. The only option the company has for its use is one month with the limitation that the graphical interphase cannot be stored. Thus, simulators that integrate the graphical interface of the OSS type could be explored, one of which is Simul8 (Student version, Simul8 Corporation, Boston, MA, USA, 2021).
Simul8 is a very popular simulation software that enables organizations to make rapid and confident decisions. It is highly intuitive, affordable, and fast software with advanced features. It can be accessed online, using a desktop, or through a network license. Moreover, it can model processes of any scale and complexity. Precisely, it is an all-in-one solution that is extremely easy to use, flexible, and powerful.
4. Results
4.1. Mapping the Process under Study by a Value Stream Map
The packaging process of the basic basket dry products was characterized.
Figure 3 exemplifies the production area beside the warehouse and conservation areas that participate in the process. It also shows data related to the current capacity of the band, which at the moment of the study was 250 packages/day. However, only an average of 25 packages/week is demanded, which is operated by only one employee, who works eight h/day, with a production capacity of one package in 93.7 s.
Under the current production conditions, equipment utilization and operator efficiency were 1.38% and 1.66%, respectively, making the existing breach in the organization evident. On the other hand, information and material flow (
Figure 4) shows the existing relationship among the different links of the supply chain.
Figure 4 shows that the organization works within a pull production system because the production department carries out the orders made by the clients, which sets the pace of the final production stages, eliminating the end product inventory. On the other hand, waiting time is perceived to be at 10,200 s/package, which translates to the time required by the employee to fulfill his/her workload. It also shows that processing time is 93.7 s, where 46% represents transport time, indicating that an area of opportunity exists in the redistribution of facilities. Within the timeline shown in the VSM, the activity that requires greater time is product packaging. However, under the current situation of the company, this timing is still short.
4.2. Causal Diagram of the Process under Study
The following diagram represents the activities performed for package production, by which the variables that are related and have positive or negative influence loops in the process can be analyzed.
Figure 5 shows the run the products performed to make the package go from the dry product warehouse to distribution passing by picking, packaging, and inspecting stages. The variables and their interaction with one another are represented in the diagram, which shows that to start the process, a variable called “production order” is necessary, but it is only launched when a client demand exists. Furthermore, loops created according to the variable relationship are also shown in
Figure 5. The most representative for the process, in itself, starts with the existence of dry products, which indicate more picking, representing, at the same time, more packaging, followed by more inspection, more packages in the conservation warehouse, and more distribution. All these variables result in having fewer products in the warehouse, thus, closing a balance loop. The positive symbol (+) refers to cause-effect booster type relationships between one variable and the other one. For example, the increase (+) in demand increases (+) production orders. On the other hand, the negative (−) sign refers to balance relationships. For example, at greater (+) delays, the lower (−) productivity. The causal diagram can be positive or negative relationships, considering all of them cause-effect given among the variables that form the loop. In this case, there are two negative loops and one positive.
4.3. Forrester Diagram and Mathematical Equations
To create the Forrester diagram, the causal diagram was taken as a reference. The process performed to obtain package demand and the time required to comply with such demand are shown in
Figure 6. The packages offered by the organization are four, and each one is constituted by different products and quantities.
The packaging process is activated by a production order subjected to the demand ordered by the final consumer. This production order indicates the necessary kilograms of the set of products for each package. When the order is launched, picking is performed where only the products required are taken to subsequently carry out the demand. All merchandise goes through the packaging area with a unit in kilograms to convert them to products between those that each product weighs according to their characteristics. After that, the packages go through an inspection, and, finally, to the conservation area to be distributed on time and form. It is important to highlight that any type of package conveys the same process.
Package 1 is formed by noodles (400 g), spaghetti (400 g), elbow macaroni (400 g), rice (500 g), beans (1 kg), and canned tuna fish (280 g). Package 2 contains whole milk (2.1 L), fruit ring multigrain cereal (200 g), wheat cereal (150 g), and frosted corn flake cereal (200 g). Package 3 contains noodles (400 g), spaghetti (400 g), elbow macaroni (400 g), rice (500 g), beans (1 kg), canned tuna fish (280 g), coffee (50 g), and cooking oil (0.475 L). Lastly, Package 4 needs noodles (400 g), spaghetti (400 g), elbow macaroni (400 g), rice (1 kg), beans (1 kg), and canned tuna fish (420 g). To obtain the production order, the demand per weight of each item must be multiplied. In this manner, the total kilograms necessary to satisfy the order are known. Subsequently, the kilograms of each product are added, as well as adding the necessary kilograms of cold products. The order is only launched once a day.
Mathematical equations. Jointly with the Forrester diagram, the values of each variable are inserted to make the mathematical equation by the parameter and variable interaction. A segment of equations is described by type (auxiliary level, inflow, outflow, as well as some important parameters).
Level equations: Level equations are generated starting from the relationship and influence of the variables, parameters, and/or inflow on each one of the level variables. It should be made clear that each level variable and inflow are influenced by the increase in time (
dt) established in the model:
where:
Pi = Package inspection
P = Packages
Pfi = Packages inspected
Inflow and outflow equations: these flows of the level varieties (stock, conveyor, queue, oven) bring about information, in this case, the number of product kilograms to satisfy the order.
where:
Auxiliary variables: These variables have the function of making equations starting from the parameter variables, which may be arithmetic operations such as addition, subtraction, multiplication, and division up to the conditions for the model functioning and searching to resemble the process reality:
where:
Nt = Noodle total
Ni = Noodle i Kg
i = 0, 1, 2
Model parameters. This part is deterministic in the model. They are values that have been considered, such as: (1) Maintenance = MXP 31.666; (2) Working day = 6.5 h; (3) Electricity (light) = MXP 79.7157; (4) Sale price of Package_1 = MXP 212.52; (5) Cold product = 1.7 kg (the prices are in Mexican pesos (MXP)).
4.4. Validation of the Current Model
Three model validation forms were performed. First, an extreme condition test was considered where demand of zero packages and model run were obtained; no action was performed in any operation to obtain packages. The simulation of placing zero packages as demand is shown in the charts within the processes without activity, which shows that it complies with the test of extreme conditions [
35].
The second test consisted of units where the program Stella Architect Lab® (ISEE Systems, Lebanon, NH, USA) verifies that the model has zero errors in the units generated by the equations. The consistency of the units in the current dry production model refers to the equation units that have an agreement since the dimension of each one of the terms shows mathematical equality in all the algebraic expressions.
As a final test, the graphic interface of the model functioning is shown descriptively and clearly to the user for a better understanding of the parties interested. This test highlights that the simulated process is similar to the real process in structure and function.
4.5. Scenario Simulation
Values of the critical variables of the model are set, representing the conditions in which the organization may run into and, thus, know the behavior of the variables involved in the process.
Normal scenario: To carry out the simulation, the real variable values of the current process were set, and the process was run with consumer demand of 25 packages/day. The simulated production and model yielded 25 packages in the conservation warehouse for Type 1; the local production had a cycle time of 0.65 h. For package types 2 and 3, zero packages were obtained in the conservation warehouse, when currently these types of packages had not been ordered.
Pessimistic scenario: This scenario takes place when no consumer demand has been placed, that is, none of the packages were ordered, so no production order exists.
Optimistic scenario: On the one hand, to simulate the optimistic scenario, the VSM tool was used. Starting from the current VSM previously performed, a future was formulated, in which by the Lean Startup methodology the future of the company was visualized, taking as a basis all the Lean Manufacturing techniques. In the VSM outline under the current situation, a significant part of the process time was observed consumed by raw matter transport from the warehouse to the production area. After detecting this problem, the decision was taken to implement a supermarket close to the production area, which would contain the raw matter for a whole day and decrease the distances run by the material managers.
On the other hand, the decision was taken to separate dry and cold products, taking care of food innocuousness and the cold chain. This decision initiated the creation of a concentration area, whose function would be to gather the portions of the dry and cold products that form the final package. To avoid a bottleneck in the production lines, a supermarket of final products was established, where the operator would place a portion of dry products while waiting for the cold ones to concentrate them in the same package. It should be mentioned that during the creation of the new scenario, cold product packaging production was considered out of reach in the current project, but its inventory was considered, as shown in
Figure 7.
Figure 7 shows that to achieve the functioning of supermarkets, Kanban cards were used, either production, withdrawal, or withdrawal per lot cards. For better control of Kanban cards, a Heijunka box should be used, which functions by means of a pitch that refers to the time in which each Kanban card should be moved to use them efficiently. The movement of Kanban cards starts in the conservation area process where the employee in this area takes a withdrawal card from the Heijunka box, takes the quantity established by the card from the supermarket, and works with it. Once the supermarket is discharged, the production operator proceeds to take the production cards and performs what is required on the card, filling out again the supermarket from the concentration area. Once the packer uses all the raw matter by means of production cards, he/she performs picking from the supermarket the raw matter as indicated on the card.
To supply the supermarket with the raw matter, a Kanban card lot type is used, indicating that the supply is only once for the raw matter used for the whole day. This card is sent to the production and logistics area where they send the raw matter requirements to the supply link for the warehouse, closing, in this manner, the cycle of using Kanban cards.
One of the main improvements of the process is found in the processing times that decreased by 38.42%, achieving being able to establish them in 57.7 s. This result was due to the change of picking activity by implementing the raw matter supermarket. Another activity that benefitted was the packaging, with the reduction of 8 s in their work, which was achieved by using Kanban cards since they generate more organized work. The concentration area is an addition to the process, but because it is an activity of little labor load, it is not considered as critical variable. Another element that is favored is transportation time since it decreases by following a suggestion with the plant distribution. To carry out this scenario, a slight change in the company facilities is required as shown in
Figure 8.
To achieve implementing this improvement, shelves should be used as in supermarkets where different crates are placed with the products to be used for each package and a better understanding of the furniture to be used. Starting from the identified improvements in the future VSM, the Forrester diagram was modified (
Figure 9), separating dry and cold products, running each one by separate bands. The decision of placing a supermarket at the beginning of the process was to have the necessary articles to satisfy the demand of the day. After packaging the dry products, they are concentrated in the section for cold packages.
The process starts with picking the dry products and the cold ones separately. After that, they go through packaging and then to the waiting area. Next, they are sent to the concentration area where they are grouped in a package with the dry and cold products. Then, they pass to the inspection area and finally to be stored in the conservation area awaiting to be distributed. In this scenario, the optimistic demand of 300 packages/day was taken, simulating the model placing production orders of 75 packages per type of package. The total packages in the conservation area per package type were 75 packages of each type, thus, showing that the production order of each package was met. The cycle time for the package production order is package 1 in 1.2933 h; 2 in 1.1233 h; 3 in 1.2933 h; 4 in 1.64 h. By simulating the three scenarios, the behavior of the variables is possible to compare (
Table 1), besides predicting, and being alert about, the future of the organization at the moment of decision making.
Table 1 shows and compares variable behavior: demand, processing time, utility, cost, income, and total kilos of the different scenarios, showing that an optimistic scenario generates a greater utility, specifically, with the production and sale of package 4.
4.6. Creating the Graphical Interface
The graphical interface represents a mode of communication with the decision-maker. The purpose is to offer a better understanding of the parts interested, which is why the interface is shown in charts, tables, and buttons to facilitate the interpretation of the data obtained. The image in
Figure 10 shows the general utility by selling all the packages demanded, where all the costs associated with production intervene in the income generated.
In
Figure 11 the charts “Profit per package” represent the behavior of the utility generated by the four types of packages, separately; “Demands” allows changing the value of the demand and thus observing the behavior of the units; “Income vs. Cost” evidences how total income acts on total cost, generating total utility.
The pie chart symbolizes the production cost, such as labor, maintenance, electricity, and raw matter. Additionally, the tabs “Costs” and “Raw Materials Costs” allow for modifying the costs associated with production.
The optimistic scenario created another model, which generated a second interface that facilitates understanding the behavior of this new scenario. The screens in this interface are similar to those of the current model, changing only the behavior of the charts and variable values. Because of the separation of dry and cold production, two screens were also added, one showing the VSM future where the best proposals are shown, and the other one with the proposed layout.
The optimistic production behavior scheme (
Figure 12) is shown in the chart “Produced Packages” simulating the demand and packaging process behavior. In the “Demand” chart, the number of packages is placed to satisfy the production order.
The relevant information is cycle time and number of days required to satisfy the demand of each package type, number of required operators, and utility generated with the packages sold. Likewise, the process indicators reveal performance, which compared to the real situation, shows that, with the optimistic scenario, the indicators express better results.
Additionally, by means of this interface, the productive behavior of each type of package can be observed, as shown in
Figure 13.
The chart “Demand 1” allows for modifying the total value of the packages to be produced. The production behavior of the packages in demand can be observed in the chart and with it, know the cycle time and necessary day to satisfy the order. Likewise, income behavior and costs that generate package sale utility can be analyzed. Data found in this screen is equivalent for package types 2, 3, and 4.
5. Discussion
The project started by mapping the facilities by means of a layout, jointly with a value stream map (VSM) focused on data and material flux. Within this mapping, 43.21% of processing time was lost carrying out the material transfer. The following five considerations are raised for discussion:
After mapping, the organization proceeded to elaborate a causal diagram with the most critical variables and parameters. Then, taking the causal diagram as a basis, the Forrester diagram was created, where mathematical model equations were obtained explaining the results obtained;
Once the current model was established, model simulation and validation were carried out by means of consistency tests of units and extreme conditions. When the validated model was obtained, a sensitivity analysis was performed to obtain the optimistic and pessimistic models. It is worth mentioning that the pessimistic scenario appears to be the current situation that the company is going through because of the advanced situation of its business;
To obtain the optimistic scenario, the VSM was taken as a basis following the Lean Startup methodology that allows for idealizing the road for the company development placing as a priority the client needs. Thus, the company is obliged to change its way of supplying the production process, since it showed a loss of time in transfer, an activity that does add value to the final product;
To elaborate the new optimistic model, the products had to be divided into dry, fresh, and frozen in each package with the purpose of taking care of the cold chain and innocuousness;
All findings, including the experience of modeling with system dynamics methodology and knowledge about the exogenous and endogenous variables of the complex system are related to contributions [
36,
37,
38,
39,
40].
According to Richardson et al. [
41], the development of a graphical user interface using Stella
® Architect (Version 1.9.1, Isee Systems Inc., Lebanon, NH, USA, 2021) is an available option for organizations. However, two important facts should be considered: (1) a person with knowledge of the use of the software and the basic concepts of system dynamics methodology is required for future modifications of the model, based on new constraints, variables, or parameters; (2) the price of the software and of investing in licenses, which have a significant cost in the market, should be considered.
Another interesting reference is the methodology applied by Di Nardo et al. [
42], who redefined and reorganized the supply chain stock management from a logistic 4.0 environmental perspective to guarantee high levels of customer availability and reliability in an Industry 4.0 smart environment.
Future Work. The future work to be developed will be implementing the model to respond to real and future demand. Based on the capacity of the company, it should require continuous improvement processes. Another solution may be based on the physical Internet to keep products packed. In the Physical Internet approach, the goods are encapsulated in modular dimensions, reusable or recyclable, and smart containers [
43].
6. Conclusions
The completion of this project met the objective of developing a graphical user interface that would allow for analyzing the packaging process of shelf products in different scenarios, considering the demand and decision-making based on quantitative data. Thus, the purpose of solving the problem detected was achieved by finding the technological solution and observing the use of the packaging process in the function of the demand. With these detected actions, the company under study was able to understand how the most critical variables of the production link behave and close the gap in the lack of information for decision-making, which is based on empirical data, improving the development of the company, and from the perspective of previous empirical studies reviewed in this research. It is important to evaluate the purchase of Stella Architect Software.
Therefore, the scientific contribution of this study, from the perspective of the dynamic systems theory, is based on the use of mathematics, systemic thought, and general system theory. The purpose is to model, mathematically, and in cause–effect relationships, complex productive systems of non-linear behavior through dynamic simulation that allows for having information on future scenarios for decision-making based on endogenous and exogenous data and variables.


