1. Introduction
A diffraction grating, which has periodic fine pattern structures on its surface, is one of the most important optical components often employed in many scientific and industrial fields. A diffraction grating can be employed as the scale for measurement in an optical encoder, in which the relative displacement between an optical head and a diffraction grating can be measured [
1]. Since the fine pattern structures on a scale grating are employed as the graduations for measurement [
2,
3], the evaluation of the grating pitch is an important task to assure the performance of an optical encoder.
Many methods have been developed so far to evaluate the grating pitch of a scale grating. The observation of three-dimensional profiles of fine pattern structures on a scale grating by high-resolution measuring instruments such as critical-dimension (CD) scanning electron microscopes (SEMs) or atomic force microscopes (AFMs) is a direct and straightforward method [
4,
5,
6,
7]. However, this method is not suitable for the evaluation of the whole length of a scale grating due to the limited measurement throughput. On the other hand, a method utilizing the laser diffraction, in which the period of pattern structure can be evaluated by the angle of diffraction of a diffracted laser beams emanated from the grating surface under evaluation, is a promising one for the evaluation of the whole length of a scale grating [
8,
9,
10,
11,
12,
13]. Although the measurand capable of being evaluated in this method is limited to a mean of the grating period over the area where the measurement laser beam is irradiated (namely, this method is an indirect method for measurement of the pitch of a scale grating), it is suitable for the calibration of large area grating patterns due to its high measurement throughput and non-contact measurement apparatus. On the other hand, in the conventional methods based on the laser diffraction with a single-mode measurement laser beam, the information to be obtained in experiments are quite limited due to the nature of the laser diffraction; in most of the cases, a few-order diffracted beams can be obtained when projecting a measurement laser beam onto a scale grating. This limits the measurement accuracy of a grating pitch.
To address the aforementioned issues, a new concept for in-situ [
14] pitch measurement employing an optical frequency comb laser has been proposed. An optical frequency comb laser contains a lot of modes equally spaced in the optical frequency domain [
15]. Since each mode has a deterministic light wavelength, a group of the first-order diffracted beams having different angles of diffraction can be obtained. With the employment of a fiber detector and a spectrometer for the observation of the diffracted beams in the optical frequency domain, much more information can be obtained for the pitch evaluation based on laser diffraction. Stabile and accurate optical frequency of each optical mode in an optical frequency comb [
16] is also expected to contribute to the accuracy improvement of the in-situ pitch measurement. The feasibility of the proposed concept has been verified through some experiments with a developed prototype setup [
17]. However, there are some problems that need to be addressed for applying optical frequency comb as a light source for the laser diffraction method. Since an optical frequency comb has multiple frequency modes with a narrow spacing in the optical frequency domain, the neighboring diffracted beams overlap with each other, resulting in the difficulty of identifying each mode in a spectrometer [
18]. In the previous study by the authors [
17], a Fabry-Pérot etalon with a high free-spectral range was employed to expand the mode-spacing of the optical frequency comb so that each mode in the group of the first-order diffracted beams could be distinguished. However, this could reduce the information of the angles of diffraction of the diffracted beams, resulting in diminishing the benefit of the proposed concept. In addition, the misalignments of the measurement laser beam and a fiber detector composed of an objective lens and a single-mode fiber in the setup could be sources of uncertainty in measurement of the grating pitch. Theoretical investigation on the measurement uncertainty of the proposed concept is thus necessary while considering the influences of these optical misalignments, although it has remained a task to be addressed.
In this paper, following the previous study by the authors [
17], a major modification is made to the prototype setup by removing a Fabry-Pérot etalon, while applying a new signal processing technique based on the weight of mass method to the detection of a peak wavelength for measurement of the grating pitch. A mathematical model of the pitch measurement is also established based on the modified setup by including some parameters related to optical misalignments. By using the established mathematical model, a measurement uncertainty analysis is carried out based on the guide to the expression of uncertainty in measurement (GUM). It should be noted that, regarding the concept of the in-situ pitch measurement, all the experiments described in this paper have been carried out in an ordinary laboratory room condition where the optical setup is not shielded from external disturbances such as illumination with fluorescent lights.
2. Methods for In-Situ Measurement of the Grating Pitch with a Diffracted Optical Frequency Comb Laser
Methods for measurement of the grating pitch with diffracted laser beams are based on the light diffraction equation that can be expressed as follows [
19]:
where
P is the grating pitch,
θin is the angle of incidence of the measurement laser beam,
θdiff is the angle of diffraction of the
mth-order diffracted beam, and
λ is the light wavelength of the measurement laser beam. It should be noted that
θin and
θdiff are defined with respect to the normal of the grating surface.
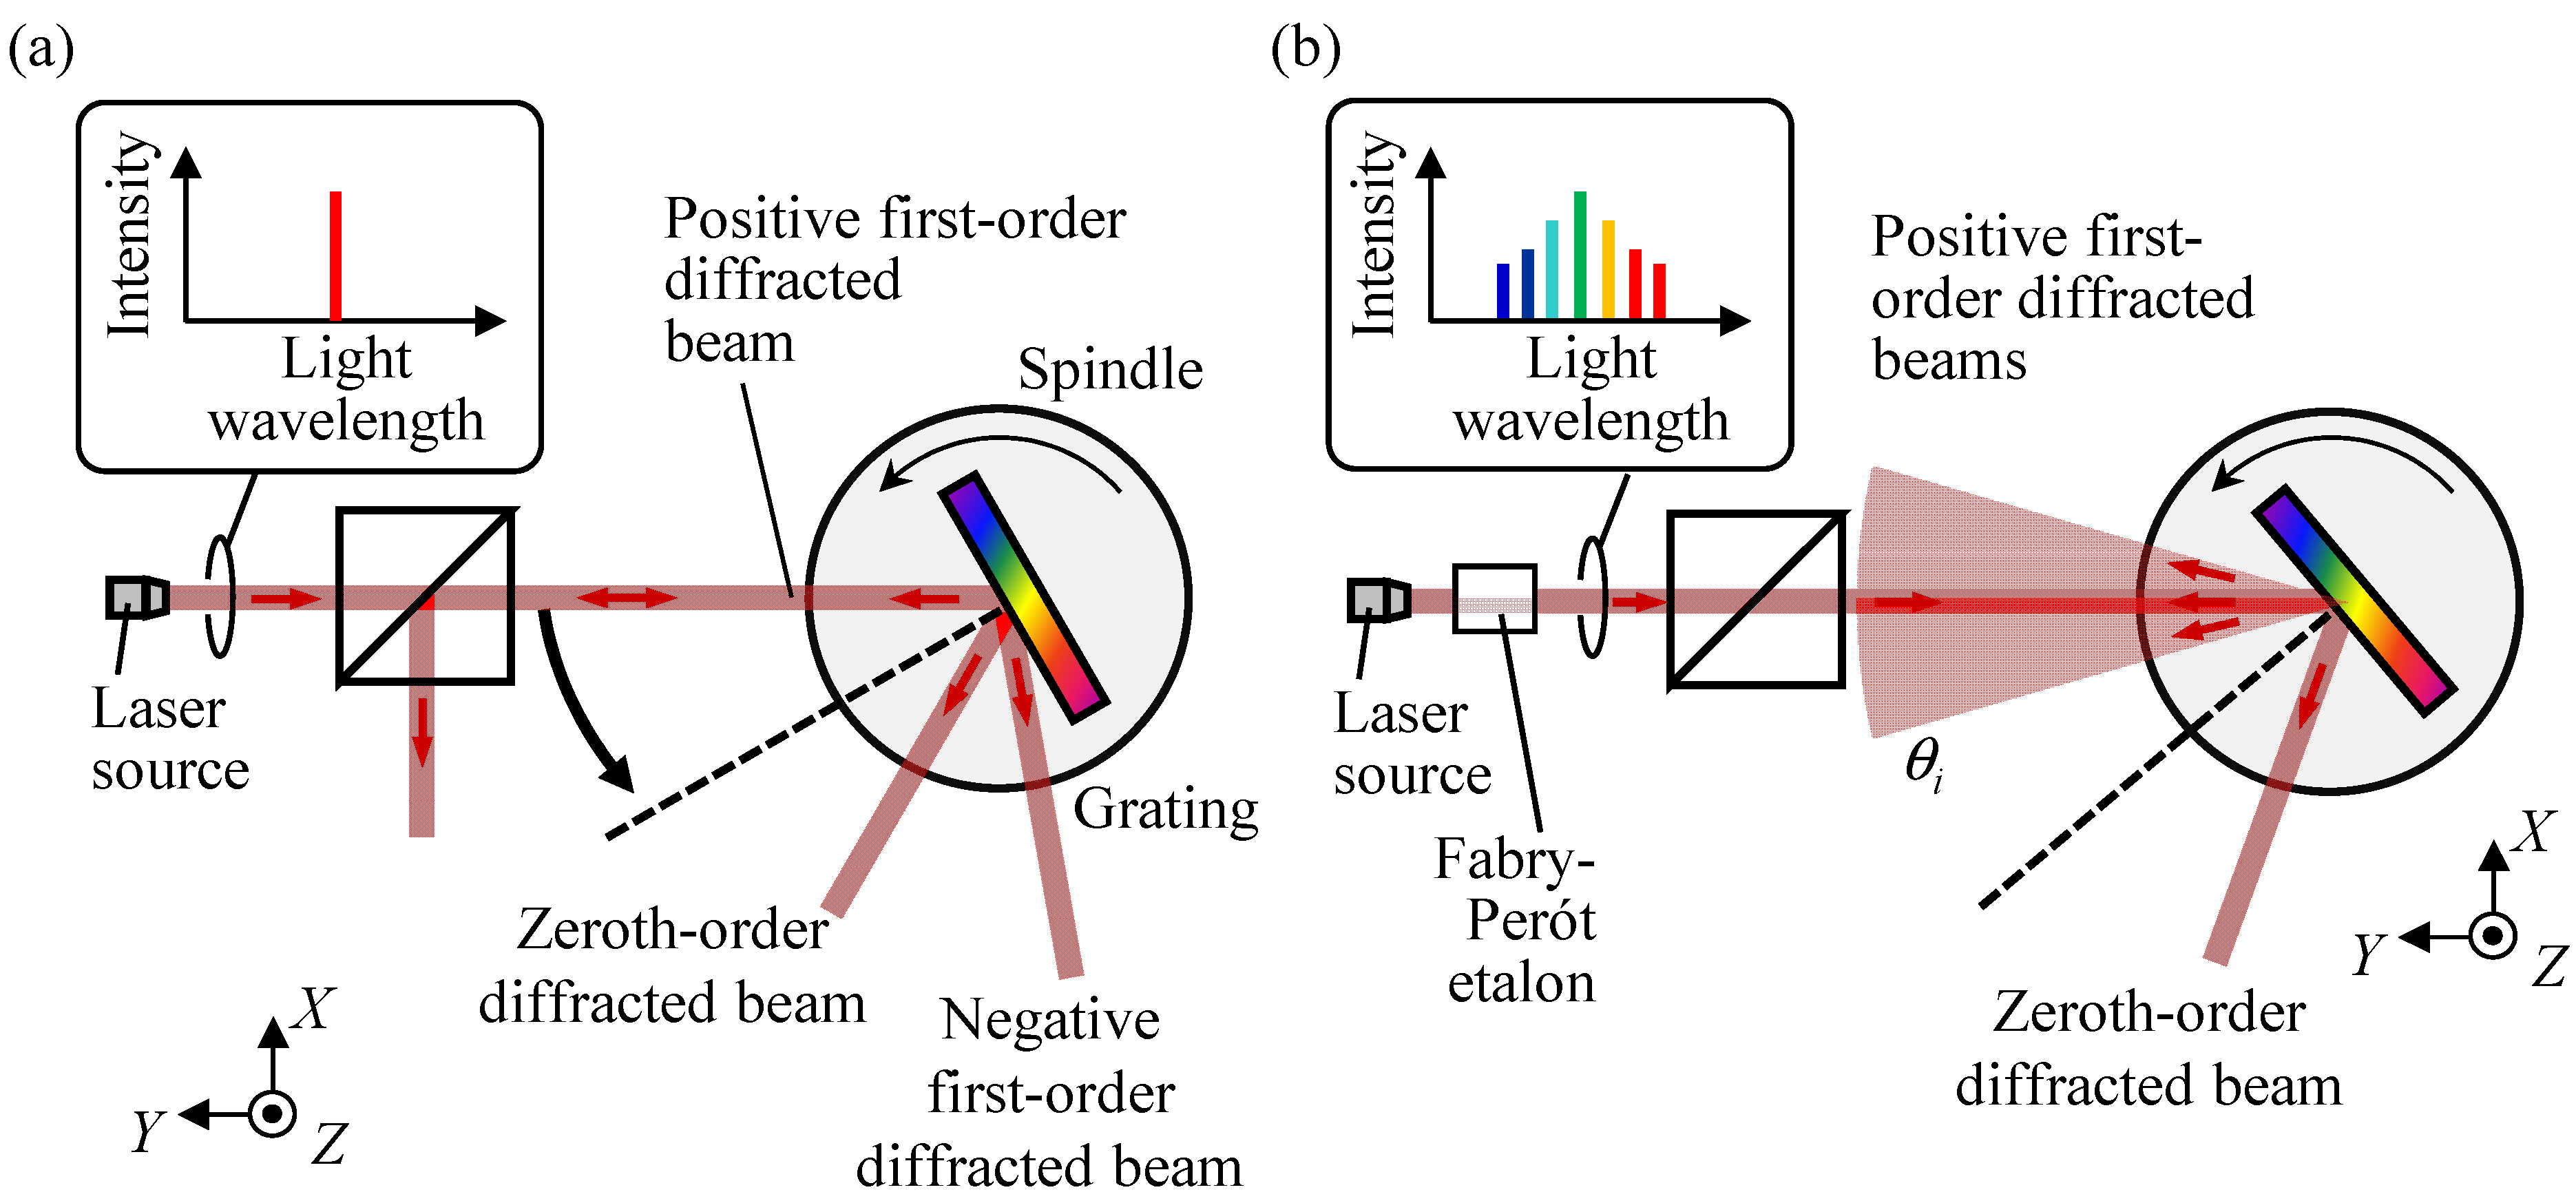
Figure 1a shows a schematic of the setup for measurement of the pitch deviation of a grating. The setup is mainly composed of a monochromatic laser source, a rotary table equipped with a high-precision rotary encoder, and a detector unit (not indicated in the figure). A scale grating can be mounted on the rotary table for pitch measurement. In the setup, a collimated laser beam from the laser source is projected onto the grating surface to generate diffracted beams. The configuration where
θin becomes equal to
θdiff, as shown in
Figure 1a, is referred to as the Littrow configuration [
20]. Under the condition of the
mth-order Littrow configuration with the Littrow angle
θm,
θin =
θdiff =
θm, and the following equation can be obtained from Equation (1):
According to the above equation, the parameters need to be obtained for the calculation of P, θm and λ. Since λ can be treated as a known parameter, the grating pitch P can be evaluated by measuring θm in experiments. By rotating the grating under inspection with a rotary table equipped with a high-precision rotary encoder, multiple diffracted beams can be observed. For the detection of diffracted beams, image sensors such as a charge-coupled device (CCD) are often employed in the detector unit. In most cases, the number of diffracted beams available for pitch measurement is quite limited when employing a monochromatic laser source. For example, in the case where a scale grating having a nominal pitch of 1000 nm is evaluated with a laser beam having a light wavelength of 633 nm, the maximum m becomes 3; namely, only six diffracted beams (three positive diffracted beams and three negative diffracted beams) can be obtained. It should also be noted that the area to be irradiated by the measurement laser beam could vary with the increase of m. Namely, the grating pitch P evaluated by the diffracted beams with different diffraction orders could be from a different area on the scale grating.
These issues can be addressed by the method with an optical frequency comb laser [
17].
Figure 1b shows a schematic of the optical setup for pitch measurement with an optical frequency comb laser. When the collimated laser beam of an optical frequency comb is projected onto a scale grating, the group of the positive first-order diffracted beams emanating from the projected area can be obtained [
21]. It should be noted that the group of the negative first-order diffracted beams and those of the higher-order diffracted beams are not indicated in the figure for the sake of simplicity. The Littrow angle
θm,i of the
ith mode in the
mth-order diffracted beam can be expressed by the following equation:
where ν
i is the optical frequency of the ith mode, which can be represented by using the pulse repetition frequency ν
rep and the carrier offset frequency ν
CEO as ν
i = i·ν
rep + ν
CEO. Since a lot of Littrow angles can be obtained in the same diffraction order, the improvement of the measurement uncertainty with the averaging effect can be expected.
It should be noted that the diffracted laser beams should be observed in the optical frequency domain so that the light wavelength of each mode in the Littrow configuration can be determined. In the previous work by the authors [
17], a Fabry-Pérot etalon with a high free-spectral range was employed so that each mode could be distinguished in the optical frequency domain. In this paper, a major modification is made to the optical setup; instead of separating the modes with the Fabry-Pérot etalon, a single-mode optical fiber was placed on the optical axis to specify the light wavelength mode corresponding to the Littrow configuration from the overlapped neighboring modes as shown in
Figure 2. When a group of the diffracted beams was made incident to the optical fiber, the beams propagated through the core of the optical fiber by reflection on the boundary surface with the shelter part named clad. Due to the loss of the intensity from the reflection, the intensity spectrum consequently shows Gaussian distribution in which the light mode made parallelly incident to the optical axis shows the highest intensity. The spectrum of propagated beams within the mode field diameter (MFD), determined by the fall of the intensity to e
−2, was then detected by the optical spectrum analyzer, and the peak wavelength was determined by the weight of mass method. This modification enables the setup to fully utilize the information of the modes in the group of the diffracted beams.
Figure 3a shows a three-dimensional drawing of the setup shown in
Figure 1b. With the employment of a polarizing beam splitter (PBS) and a quarter-wave plate (QWP), the diffracted beams can be guided to the detector unit without going back to the laser source. The detector unit consists of an objective lens and a single-mode fiber, one side of which is connected to an optical spectrum analyzer (OSA). In the setup, the normal of the grating is aligned to be parallel with the
X-axis when the angular position of the spindle is set to
θ = 0°. However, the measurement laser beam and the detector unit have angular misalignments with respect to the optical axis as shown in
Figure 3b. Thus, variable
α is given to the angular misalignment of the measurement laser beam about the
Z-axis with respect to the
X-axis, and variable
β is given to that of the optical axis of the detector unit about the
X-axis with respect to the
Z-axis. Regarding these misalignments in the setup, the diffraction equation in Equation (2) for the first-order diffracted beams can be modified as follows:
where
λ is the wavelength of the measurement beam, Δ
θ±1 is the angular position of the spindle, α is the angular misalignment of the measurement laser beam about the
Z-axis with respect to the
X-axis, and β is the angular misalignment of the optical axis of the detector unit about the
X-axis with respect to the
Z-axis.
Based on Equations (4) and (5), the influences of
α and
β on measurement of the pitch deviation are estimated quantitatively.
Figure 4a,b show the difference between the calculated pitch
Pc obtained based on Equations (4) and (5) and the nominal pitch
P due to the angular misalignments
α and
β, respectively. Calculations are carried out under the condition of
P = 833.33 nm and an angular position of the spindle of 28°. The influence of
α is estimated to be approximately −32 pm under the condition of
α = 1°, while that of
β is estimated to be approximately 13.7 nm under the condition of
β = 1°. From these results, it can be concluded that the corrections of
α and
β are necessary for accurate pitch measurement.
3. Design and Development of the Optical Setup and Verification Experiment
A schematic of the setup employed in the following experiments is shown in
Figure 5a. A fiber-based mode-locked femtosecond laser with a pulse repetition frequency
νrep of 100 MHz was employed as the laser source. The laser beam from the laser source was guided into the setup by using an optical fiber. The laser beam from the edge of the fiber was collimated by a collimating lens, and was then projected onto a grating mounted on a spindle. It should be noted that a half-wave plate was placed just after the collimating lens in the optical path of the laser beam so that the polarization direction of the laser beam could be controlled. A pair of a quarter-wave plate and a polarizing beam splitter was employed as an optical isolator to prevent the diffracted beam from going back to the laser source. The diffracted laser beams, whose propagating directions were changed by the polarizing beam splitters, were captured by a detector unit composed of an objective lens and a single-mode fiber with a mode-field diameter of approximately 10.8 μm. One end of the single-mode fiber was placed at the focal plane of the objective lens, while the other was connected to a commercial optical spectrum analyzer (AQ6370D, Yokogawa Co., Ltd., Tokyo, Japan) so that the captured diffracted laser beams could be analyzed in the optical frequency domain.
Figure 5b shows a photograph of the setup employed in the following experiments.
The detection of the angular position of the grating in the developed setup could strongly affect the pitch measurement by the proposed method. Therefore, at the beginning of the following experiments, the stability of the reading of the rotary encoder embedded in the spindle in the developed setup was evaluated. A variation of the rotary encoder reading was observed while the spindle was kept stationary at the positive and negative first-order Littrow configurations.
Figure 6a,b show the variations of the rotary encoder reading at the angular positions
θ = 28.08° and −28.08°, respectively, in a period of two hours. A sampling frequency of the encoder reading was set to be 10 Hz. Standard deviations of the rotary encoder reading were evaluated to be 0.06054 arc-second and 0.06475 arc-second for the positive and negative Littrow configurations, respectively. From these results, the spindle was confirmed to have positioning stability within the specification of the spindle (1 arc-second).
Alignments of the optical setup can be carried out by using the zeroth and first-order diffracted beams.
Figure 7a shows a schematic of the setup. A retroreflector, which has the ability to reflect the laser beam to its source, is placed in front of the scale grating, while a beam profiler is placed at the focal plane of the objective lens. The reflected measurement laser beam is then focused on the detector plane at a point P
M in the beam profiler, and its
Y-position is recorded. After that, the retroreflector is removed from the setup where the angular position of the spindle is set to
θ = 0°; this operation makes the zeroth-order diffracted beam from the scale grating be focused on the beam profiler at a point P
0. Meanwhile, with the existence of the angular misalignment α, the focused laser beam is made to shift along the
Y-direction. According to the principle of laser autocollimation [
22], the
Y-directional spot displacement Δ
d on the beam profiler due to
α can be expressed by the following equation:
Since the focal length F of the objective lens was known to be 31 mm, α can be evaluated by detecting Δd with the beam profiler.
Figure 8 shows the variations of the
Y-positions of the measurement laser beam and the zeroth-order diffracted beam focused on the beam profiler in a period of 20 s. As the target grating, a holographic-type grating with a line density of 1200/mm was employed. From the mean values, Δ
d was evaluated to be 1.143 μm, and
α was thus evaluated to be 7.579 arc-seconds based on Equation (6).
After the verification of the angular misalignment
α, the alignment of the single-mode fiber in the fiber detector unit was carried out while the angular position of the spindle was kept stationary at
θ = 0°.
Figure 9 shows the spectrum of the zeroth-order diffracted beam captured by the detector unit. The alignment of the single-mode fiber was carried out so that the total laser power to be detected by the detector unit became maximum while observing the spectrum of the captured laser beam. As can be seen in the figure, a non-uniform spectrum of the optical frequency comb laser was successfully observed.
Meanwhile, the detector unit had a small angular misalignment
β about the
X-axis even after the alignment; this can be evaluated in experiments by using the positive and negative first-order diffracted beams.
Figure 10a,b show the variations of the spectra of the positive and negative first-order diffracted beams captured by the same detector unit when rotating the scale grating. In the figures, the spectra obtained at the angular position |
θ| ranging from 27.48° to 27.52° in a step of 0.01° are plotted. As can be seen in the figure, the spectra of the negative first-order diffracted beams were found to shift toward the shorter light wavelength; this was mainly due to the influence of
β, regarding Equations (4) and (5).
The grating pitch
P can be evaluated by detecting the peak wavelength of the spectrum at each angular position of the spindle
θ. In this paper, a weight-of-mass method based on the following equation was employed to detect the peak wavelength
λcenter in a spectrum:
where
λi is the
ith sampled wavelength, and
Iλi is the light intensity of the light wavelength component
λi.
Figure 11a shows the grating pitch calculated based on Equations (4) and (5) by the series of
λcenter obtained at different angular positions
θ of the spindle. It should be noted that the parameter
β was set to be 0°. As can be seen in the figure, a discrepancy mainly due to the misalignment
β was found between the grating pitches
Ppos_i and
Pneg_i obtained from the positive and negative first-order diffracted beams, respectively. To compensate for the influence of
β, calculations based on Equations (4) and (5) were repeated by changing
β in a step of 0.0001°.
Figure 11b shows the sum of |
Ppos_i −
Pneg_i| at each
β. By performing fitting by sixth-order function approximation and finding the extremum,
β that minimizes Σ|
Ppos_i −
Pneg_i| was evaluated to be 0.001212° (4.363 arc-seconds).
Figure 11c shows
Ppos_i and
Pneg_i calculated based on Equations (4) and (5) under the condition of
β = 4.363 arc-seconds. As can be seen in the figure, a good agreement can be found between
Ppos_i and
Pneg_i after the compensation of the influence of
β.
It should be noted that the optical frequency comb laser employed in this paper had a non-uniform spectrum, as can be seen in
Figure 9. The non-uniform spectrum of the light source could affect the calculation of the peak wavelength based on the weight-of-mass method, resulting in the degradation of the uncertainty in pitch measurement. Compensation of the influence of the non-uniform spectrum of the mode-locked femtosecond laser beam employed in the setup was thus carried out by using the observed spectrum of the zeroth-order diffracted beam shown in
Figure 9. In the compensation process, the spectrum of the first-order diffracted beam
I±1(
λi) obtained at each angular position of the spindle was divided by the spectrum of the zeroth-order diffracted beam
I0(
λi) to obtain the normalized spectrum
Inorm(
λi).
Figure 12a,b shows the grating period
Pneg_i calculated by using the spectra
I-1(
λi) and
Inorm(
λi) of 100 optical modes observed in experiments, respectively. By the compensation process, the deviation of the calculated grating period
Pneg_i obtained from the spectra in the wavelength range of 770 nm to 800 nm was reduced from 94.76 pm to 74.34 pm. This result demonstrated the effectiveness of the compensation process for the reduction of the uncertainty of pitch measurement. It should be noted that a slight difference can still be observed between
Ppos_i and
Pneg_i; The possible root causes contain the influence of the chromatic aberration of the optical components in the setup, as well as the instability of the spectrum of the mode-locked femtosecond laser beam, and further detailed investigation is required for the better understanding of the results.
4. Uncertainty Analysis
Measurement uncertainty analysis is also carried out based on the guide to the expression of uncertainty in measurement (GUM) [
23] to verify the feasibility of the proposed method with the employment of an optical frequency comb laser. Since the mean of pitch values evaluated from multiple angles of diffraction of diffracted modes is evaluated in the proposed method, at first, the uncertainty of evaluating the pitch by a specific diffracted mode is evaluated. Then, the probability distribution of pitches from the angles of diffraction of entire modes was obtained to evaluate the measurement uncertainty of the proposed method.
Equations (4) and (5) can be modified as follows by considering the refractive index of air
nair:
In the following, the contribution of each parameter in the equations is evaluated.
- (a)
Angular misalignment α of the measurement laser beam about the Z-axis with respect to the X-axis (u(α))
At first, the contribution of
α was evaluated. As described in the previous section of this paper,
α was evaluated by using the zeroth-order diffracted beam reflected from the retroreflector; the
Y-directional displacement of the focused laser beam on the CCD image sensor was converted into the angle
α based on the principle of laser autocollimation [
22]. Denoting the
Y-positions of the focused laser beam on the image sensor when measuring the reflected beam from the retroreflector and the zeroth-order diffracted beam from the diffraction grating as
Yretro and
Y0, respectively, Equation (6) can be rewritten as follows:
Then, the standard uncertainty
u(
α), which is the contribution of
α, can be evaluated by the following equation:
where
uYretro,
uY0 and
uF are the standard uncertainties of
Yretro,
Y0 and
F, respectively, while
cYretro,
cY0 and
cF are the sensitivity coefficients of
Yretro,
Y0 and
F, respectively.
Table 1 summarizes the contributions of each parameter on
uα. The
Y-position of the focused retroreflected beam and zeroth-order beam on the profiler was obtained as a mean of 200 repetitive trials with a standard deviation of 0.333 μm and 0.299 μm, respectively. From Equation (10), the sensitivity coefficients
cYretro,
c0 and
cY can be derived as follows:
By applying mean values of
Yretro (−186.160 μm),
Y0 (−187.303 μm) and a nominal value of
F of 31.1 mm,
cYretro,
c0 and
cY were evaluated as shown in
Table 1. It should be noted that the misalignment of the image sensor with respect to the objective lens was considered to be within ±0.5 mm. By evaluating the contribution of each uncertainty source,
u(
α) was evaluated to be 3.862 × 10
−3 arcsecond.
- (b)
Angular misalignment β of the detector unit about the X-axis with respect to the Z-axis (u(β))
The contribution of
β was then estimated. As shown in
Figure 11b, Σ|
Ppos_i − Pneg_i| corresponding to the change of
β in a step of 0.0001° was calculated, then
β which minimize Σ|
Ppos_i −
Pneg_i| was selected by taking the extremum of the data curve obtained by sixth-order polynomial approximation fitting. However, as shown in
Figure 11c,
Ppos_i and
Pneg_i did not perfectly match by this fitting process, and |
Ppos_i − Pneg_i| at each angular position of the spindle could contribute to the uncertainty
u(
β) of evaluating
β by polynomial approximation fitting. The deviation of
βi, which was obtained by the
ith positive and negative Littrow angles was evaluated as shown in
Figure 13. A standard deviation of |
β-βi| was evaluated to be 1.875 arc-second. Since, 100 sets of
Ppos_i and
Pneg_i were employed, by applying a divisor of
,
u(
β) was evaluated to be 0.1875 arc-second.
- (c)
Uncertainty of the detection of the angle θi of the ith-mode positive or negative first-order diffracted beam (u(θi))
In the proposed method, the
ith-mode first-order Littrow angle
θi was obtained from the readings of the optical rotary encoder embedded to the precision air-bearing spindle. Therefore, the resolution, stability and uncertainty of the reading of the optical rotary encoder could contribute to the uncertainty
u(
θi) of detecting the
ith-mode first-order Littrow angle of the positive or negative first-order diffracted beam. The contribution of the resolution (
ures) was estimated from the information in the specification sheet of the rotary encoder provided by the encoder manufacturer. Meanwhile, the contribution of the stability of the encoder reading (
ustb) could somehow be affected by the stability of the developed setup, and was then evaluated by using experimental results. As can be seen in
Figure 6a,b, standard deviations of the encoder reading when the scale grating was kept stationary at the angular positions of the positive and negative first-order Littrow configuration were evaluated to be 0.06054 arc-second and 0.06475 arc-second, respectively. Since a mean of 200 encoder readings at each angular position of the grating was employed as
θi, by applying a divisor of
to the worse case (0.06475 arc-second),
ustb was evaluated to be 4.579 × 10
−3 arc-second.
Table 2 summarizes the contribution of each uncertainty source to
u(
θi).
- (d)
Uncertainty of the light wavelength detected at each Littrow configuration (u(λi))
In the proposed method, the light wavelength
λpos_i or
λneg_i for pitch measurement is evaluated based on Equation (7) as the peak wavelength of the obtained spectrum. Therefore, light intensity fluctuation at each light wavelength and the uncertainty of the reading in the optical spectrum analyzer could contribute to the uncertainty
u(
λi) of the light wavelength detected at each Littrow configuration. In this study, a value (7.10 × 10
−4 nm) from the previous work by the authors’ team [
24] was employed as
u(
λi).
- (e)
Uncertainty of the refractive index in air nair (u(nair))
The contribution of
nair was then estimated. Since the experiment had been conducted in a laboratory environment, the contributions of the atmospheric pressure, air temperature, and humidity in the room atmospheric range should be considered. It should be noted that a lot of work has been made so far to evaluate the contribution of
nair. In this study, taking a value from the literature [
25,
26,
27,
28],
u(
nair) was estimated to be ±5 × 10
−8 [
26].
Regarding the contribution of each uncertainty source, standard uncertainties
uPi of the pitch
Pi obtained by the
ith positive or negative first-order Littrow angle can be estimated by the following equations:
where
c(α),
c(
β),
c(
θi),
c(
λi) and
c(
nair) are the sensitivity coefficients that can be described by the following equations:
In the above equations, α is the angular misalignment of the measurement laser beam about the
Z-axis,
β is the angular misalignment value of the measurement laser beam about the
X-axis,
θi is the average Littrow angle,
λi is the central wavelength, and
nair is the refractive index in air.
Table 3 summarizes the contribution of each uncertainty source. Based on Equation (15),
uPi was evaluated to be 40.65 pm.
An expanded uncertainty
U of the pitch was thus evaluated to be 81.30 pm (
k = 2, 95% confidence). From the results shown in
Figure 12b, the pitch values were found to distribute in a range from 833.404 ± 0.0372 nm; the experimental results were found to be within the uncertainty value estimated in the above analysis. It should be noted that
U estimated in the above analysis is the expanded uncertainty of the pitch by a specific optical mode in the optical frequency comb laser. By using
N optical modes (
N = 100 in
Figure 12) observed in experiments, an expanded uncertainty of the pitch measurement by the proposed method becomes 81.30/
pm.


 ,
, 


