
Application of Thermodynamics and Protein–Protein Interaction Network Topology for Discovery of Potential New Treatments for Temporal Lobe Epilepsy


Abstract
:Featured Application
Abstract
1. Introduction
2. Materials and Methods
3. Data Sources
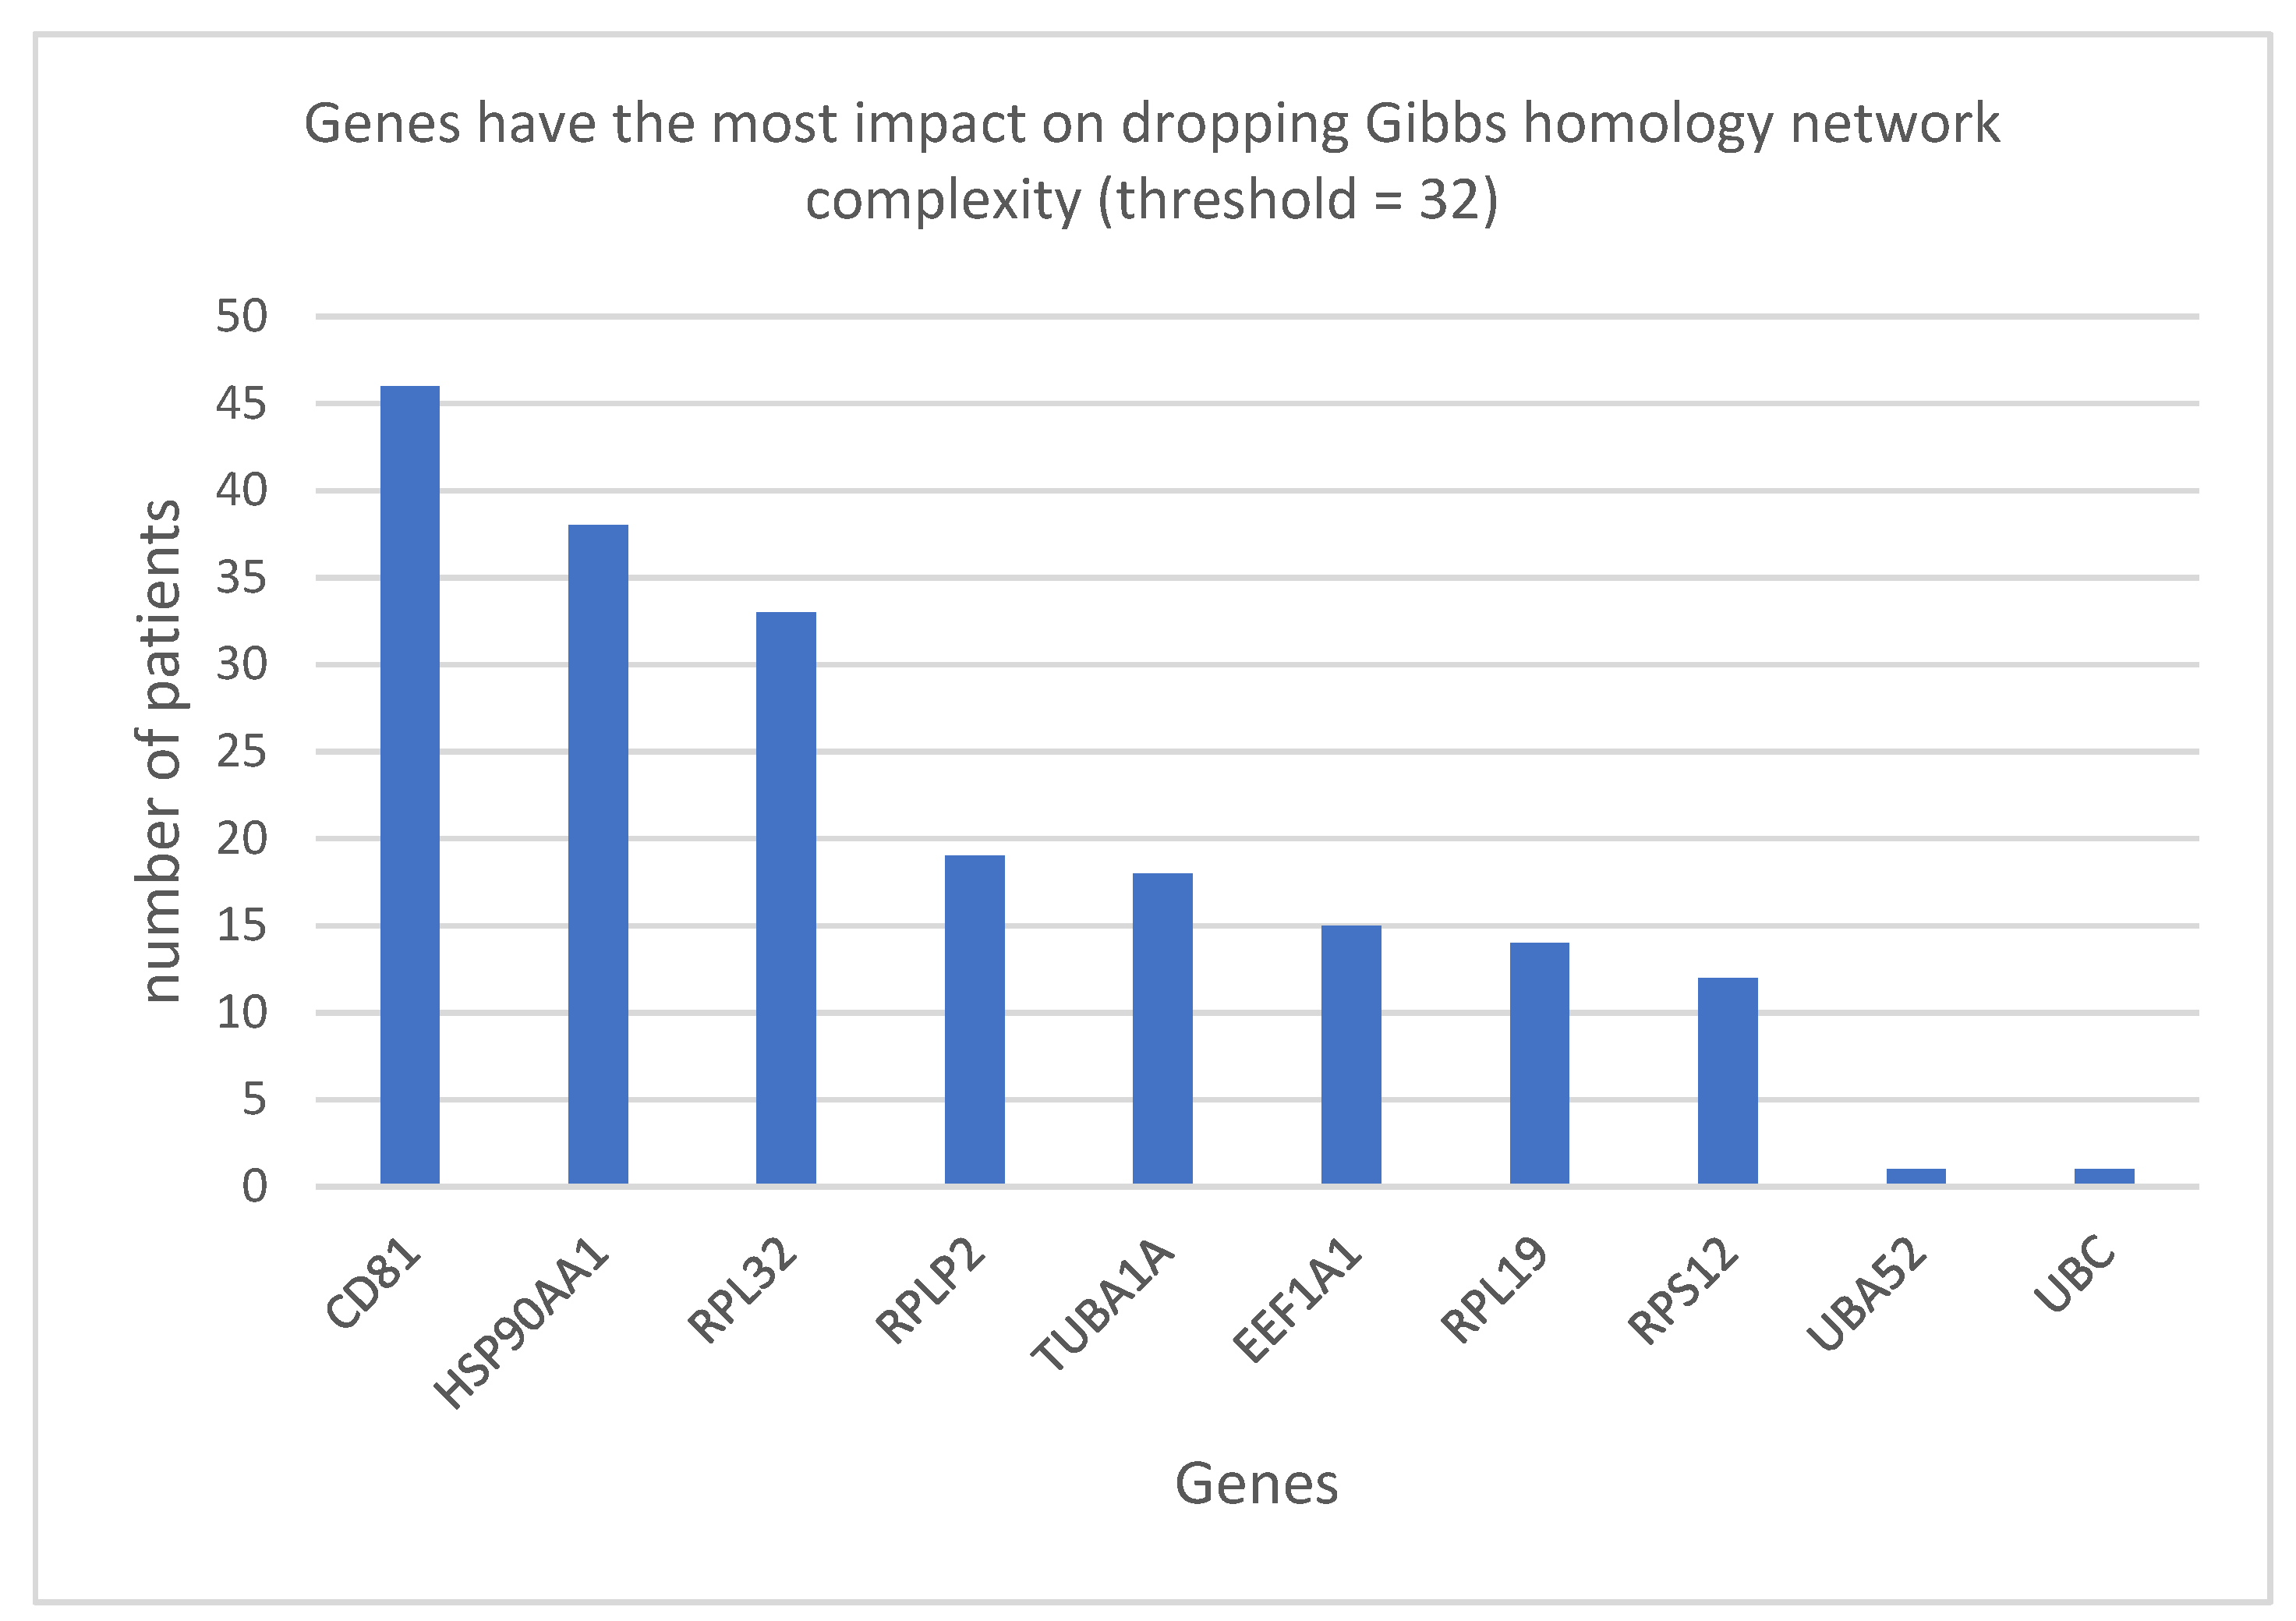
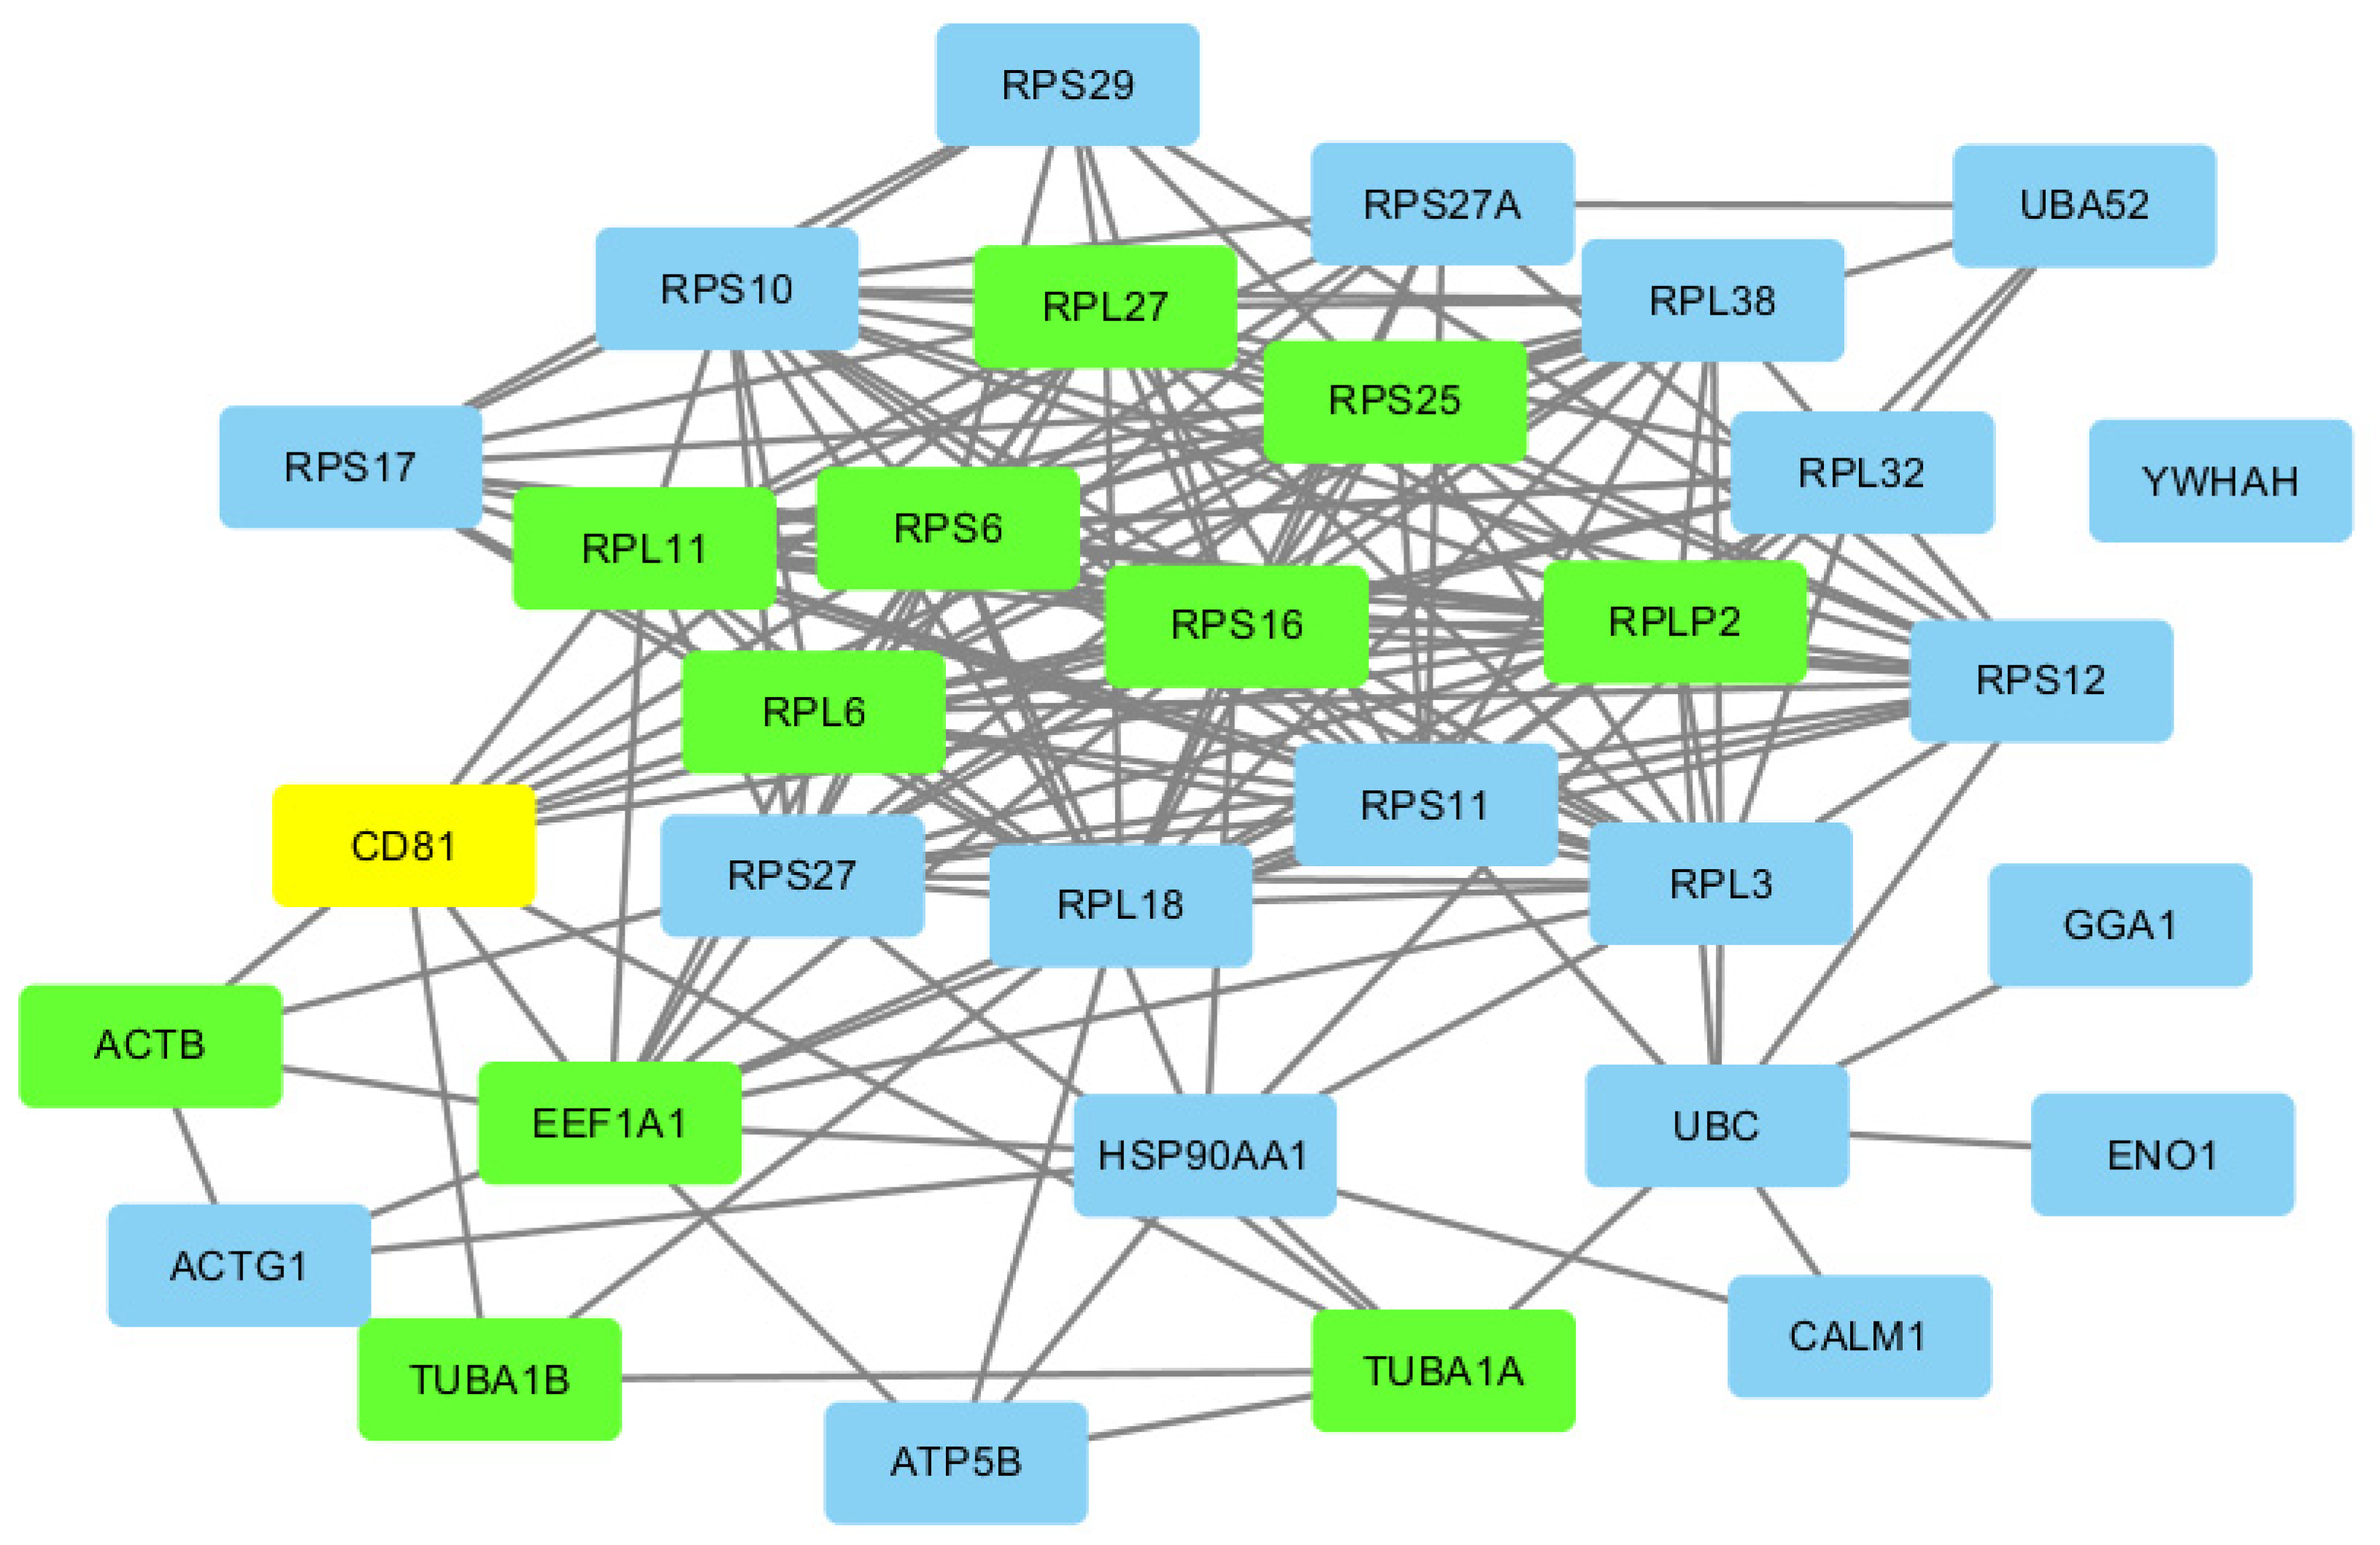
4. Results
Ribosomal Proteins
5. Discussion
Supplementary Materials
Author Contributions
Funding
Institutional Review Board Statement
Informed Consent Statement
Data Availability Statement
Acknowledgments
Conflicts of Interest
References
- Epilepsy. Available online: https://www.who.int/news-room/fact-sheets/detail/epilepsy (accessed on 27 June 2021).
- Epilepsy Data and Statistics | CDC. Available online: https://www.cdc.gov/epilepsy/data/index.html (accessed on 27 June 2021).
- Stafstrom, C.E.; Carmant, L. Seizures and Epilepsy: An Overview for Neuroscientists. Cold Spring Harb. Perspect. Med. 2015, 5, a022426. [Google Scholar] [CrossRef] [PubMed]
- Cunliffe, V.T. Building a Zebrafish Toolkit for Investigating the Pathobiology of Epilepsy and Identifying New Treatments for Epileptic Seizures. J. Neurosci. Methods 2016, 260, 91–95. [Google Scholar] [CrossRef] [PubMed]
- Majores, M.; Eils, J.; Wiestler, O.D.; Becker, A.J. Molecular Profiling of Temporal Lobe Epilepsy: Comparison of Data from Human Tissue Samples and Animal Models. Epilepsy Res. 2004, 60, 173–178. [Google Scholar] [CrossRef] [PubMed]
- Kamel, H.F.M.; Al-Amodi, H.S.A.B. Exploitation of Gene Expression and Cancer Biomarkers in Paving the Path to Era of Personalized Medicine. Genom. Proteom. Bioinform. 2017, 15, 220–235. [Google Scholar] [CrossRef] [PubMed]
- Bhalla, D.; Godet, B.; Druet-Cabanac, M.; Preux, P.-M. Etiologies of Epilepsy: A Comprehensive Review. Expert Rev. Neurother. 2011, 11, 861–876. [Google Scholar] [CrossRef]
- Fukuma, G.; Oguni, H.; Shirasaka, Y.; Watanabe, K.; Miyajima, T.; Yasumoto, S.; Ohfu, M.; Inoue, T.; Watanachai, A.; Kira, R.; et al. Mutations of Neuronal Voltage-Gated Na+ Channel A1 Subunit Gene SCN1A in Core Severe Myoclonic Epilepsy in Infancy (SMEI) and in Borderline SMEI (SMEB). Epilepsia 2004, 45, 140–148. [Google Scholar] [CrossRef]
- Lipponen, A.; Paananen, J.; Puhakka, N.; Pitkänen, A. Analysis of Post-Traumatic Brain Injury Gene Expression Signature Reveals Tubulins, Nfe2l2, Nfkb, Cd44, and S100a4 as Treatment Targets. Sci. Rep. 2016, 6, 31570. [Google Scholar] [CrossRef] [Green Version]
- Ding, K.; Gupta, P.K.; Diaz-Arrastia, R. Epilepsy after Traumatic Brain Injury. In Translational Research in Traumatic Brain Injury; Laskowitz, D., Grant, G., Eds.; Frontiers in Neuroscience; CRC Press/Taylor and Francis Group: Boca Raton, FL, USA, 2016; ISBN 978-1-4665-8491-4. [Google Scholar]
- Schubert-Bast, S.; Rosenow, F.; Klein, K.M.; Reif, P.S.; Kieslich, M.; Strzelczyk, A. The Role of MTOR Inhibitors in Preventing Epileptogenesis in Patients with TSC: Current Evidence and Future Perspectives. Epilepsy Behav. 2019, 91, 94–98. [Google Scholar] [CrossRef] [PubMed]
- Devinsky, O.; Vezzani, A.; O’Brien, T.J.; Jette, N.; Scheffer, I.E.; de Curtis, M.; Perucca, P. Epilepsy. Nat. Rev. Dis. Primer 2018, 4, 1–24. [Google Scholar] [CrossRef]
- Amzica, F. Neurophysiology of Epilepsy; Oxford University Press: Oxford, UK, 2012; ISBN 978-0-19-175136-3. [Google Scholar]
- Shorvon, S.D.; Bermejo, P.E.; Gibbs, A.A.; Huberfeld, G.; Kälviäinen, R. Antiepileptic Drug Treatment of Generalized Tonic–Clonic Seizures: An Evaluation of Regulatory Data and Five Criteria for Drug Selection. Epilepsy Behav. 2018, 82, 91–103. [Google Scholar] [CrossRef] [PubMed]
- Wu, C.; Sun, D. GABA Receptors in Brain Development, Function, and Injury. Metab. Brain Dis. 2015, 30, 367–379. [Google Scholar] [CrossRef] [Green Version]
- Dedeurwaerdere, S.; Boets, S.; Janssens, P.; Lavreysen, H.; Steckler, T. In the Grey Zone between Epilepsy and Schizophrenia: Alterations in Group II Metabotropic Glutamate Receptors. Acta Neurol. Belg. 2015, 115, 221–232. [Google Scholar] [CrossRef]
- Rietman, E.A.; Karp, R.L.; Tuszynski, J.A. Review and Application of Group Theory to Molecular Systems Biology. Theor. Biol. Med. Model. 2011, 8, 21. [Google Scholar] [CrossRef] [Green Version]
- Breitkreutz, D.; Hlatky, L.; Rietman, E.; Tuszynski, J.A. Molecular Signaling Network Complexity Is Correlated with Cancer Patient Survivability. Proc. Natl. Acad. Sci. USA 2012, 109, 9209–9212. [Google Scholar] [CrossRef] [PubMed] [Green Version]
- Hinow, P.; Rietman, E.A.; Omar, S.I.; Tuszyński, J.A. Algebraic and Topological Indices of Molecular Pathway Networks in Human Cancers. Math. Biosci. Eng. MBE 2015, 12, 1289–1302. [Google Scholar] [CrossRef]
- Benzekry, S.; Tuszynski, J.A.; Rietman, E.A.; Lakka Klement, G. Design Principles for Cancer Therapy Guided by Changes in Complexity of Protein-Protein Interaction Networks. Biol. Direct 2015, 10, 32. [Google Scholar] [CrossRef]
- Rietman, E.A.; Scott, J.G.; Tuszynski, J.A.; Klement, G.L. Personalized Anticancer Therapy Selection Using Molecular Landscape Topology and Thermodynamics. Oncotarget 2016, 8, 18735–18745. [Google Scholar] [CrossRef] [PubMed] [Green Version]
- Rietman, E.A.; Platig, J.; Tuszynski, J.A.; Lakka Klement, G. Thermodynamic Measures of Cancer: Gibbs Free Energy and Entropy of Protein–Protein Interactions. J. Biol. Phys. 2016, 42, 339–350. [Google Scholar] [CrossRef] [PubMed] [Green Version]
- Brant, E.J.; Rietman, E.A.; Lakka Klement, G.; Cavaglia, M.; Tuszynski, J.A. Personalized therapy design for systemic lupus erythematosus based on the analysis of protein-protein interaction networks. PLoS ONE 2020, 15, e0226883. [Google Scholar] [CrossRef]
- Golas, S.M.; Nguyen, A.N.; Rietman, E.A.; Tuszynski, J.A. Gibbs free energy of protein-protein interactions correlates with ATP production in cancer cells. J. Biol. Phys. 2019, 45, 423–430. [Google Scholar] [CrossRef]
- Rietman, E.A.; Taylor, S.; Siegelmann, H.T.; Deriu, M.A.; Cavaglia, M.; Tuszynski, J.A. Using the Gibbs Function as a Measure of Human Brain Development Trends from Fetal Stage to Advanced Age. Int. J. Mol. Sci. 2020, 21, 1116. [Google Scholar] [CrossRef] [PubMed] [Green Version]
- McGuire, S.H.; Rietman, E.A.; Siegelmann, H.; Tuszynski, J.A. Gibbs free energy as a measure of complexity correlates with time within C. elegans embryonic development. J. Biol. Phys. 2017, 43, 551–563. [Google Scholar] [CrossRef] [PubMed]
- Huang, S. On the Intrinsic Inevitability of Cancer: From Foetal to Fatal Attraction. Semin. Cancer Biol. 2011, 21, 183–199. [Google Scholar] [CrossRef]
- Moris, N.; Pina, C.; Arias, A.M. Transition States and Cell Fate Decisions in Epigenetic Landscapes. Nat. Rev. Genet. 2016, 17, 693–703. [Google Scholar] [CrossRef] [PubMed]
- Kim, M.S.; Pinto, S.M.; Getnet, D.; Nirujogi, R.S.; Manda, S.S.; Chaerkady, R.; Madugundu, A.K.; Kelkar, D.S.; Isserlin, R.; Jain, S.; et al. A draft map of the human proteome. Nature 2014, 509, 575–581. [Google Scholar] [CrossRef] [PubMed] [Green Version]
- Wilhelm, M.; Schlegl, J.; Hahne, H.; Moghaddas Gholami, A.; Lieberenz, M.; Savitski, M.M.; Ziegler, E.; Butzmann, L.; Gessulat, S.; Marx, H.; et al. Mass-spectrometry-based draft of the human proteome. Nature 2014, 509, 582–587. [Google Scholar] [CrossRef]
- Guo, Y.; Sheng, Q.; Li, J.; Ye, F.; Samuels, D.C.; Shyr, Y. Large scale comparison of gene expression levels by microarrays and RNAseq using TCGA data. PLoS ONE 2013, 8, e71462. [Google Scholar] [CrossRef] [PubMed] [Green Version]
- The Cancer Genome Atlas Program—National Cancer Institute. Available online: https://www.cancer.gov/about-nci/organization/ccg/research/structural-genomics/tcga (accessed on 28 June 2021).
- BioGRID|Database of Protein, Chemical, and Genetic Interactions. Available online: https://thebiogrid.org/ (accessed on 28 June 2021).
- Johnson, M.R.; Behmoaras, J.; Bottolo, L.; Krishnan, M.L.; Pernhorst, K.; Santoscoy, P.L.M.; Rossetti, T.; Speed, D.; Srivastava, P.K.; Chadeau-Hyam, M.; et al. Systems Genetics Identifies Sestrin 3 as a Regulator of a Proconvulsant Gene Network in Human Epileptic Hippocampus. Nat. Commun. 2015, 6, 6031. [Google Scholar] [CrossRef] [PubMed] [Green Version]
- Uhlén, M.; Fagerberg, L.; Hallström, B.M.; Lindskog, C.; Oksvold, P.; Mardinoglu, A.; Sivertsson, Å.; Kampf, C.; Sjöstedt, E.; Asplund, A.; et al. Tissue-Based Map of the Human Proteome. Science 2015, 347. [Google Scholar] [CrossRef]
- Kelić, S.; Levy, S.; Suarez, C.; Weinstein, D.E. CD81 Regulates Neuron-Induced Astrocyte Cell-Cycle Exit. Mol. Cell. Neurosci. 2001, 17, 551–560. [Google Scholar] [CrossRef]
- Cd81 Phenotype Annotations. Available online: http://www.informatics.jax.org/marker/phenotypes/MGI:1096398 (accessed on 28 June 2021).
- Geisert, E.E.; Williams, R.W.; Geisert, G.R.; Fan, L.; Asbury, A.M.; Maecker, H.T.; Deng, J.; Levy, S. Increased Brain Size and Glial Cell Number in CD81-Null Mice. J. Comp. Neurol. 2002, 453, 22–32. [Google Scholar] [CrossRef] [PubMed]
- Van Zelm, M.C.; Smet, J.; Adams, B.; Mascart, F.; Schandené, L.; Janssen, F.; Ferster, A.; Kuo, C.-C.; Levy, S.; van Dongen, J.J.M.; et al. CD81 Gene Defect in Humans Disrupts CD19 Complex Formation and Leads to Antibody Deficiency. J. Clin. Investig. 2010, 120, 1265–1274. [Google Scholar] [CrossRef] [PubMed] [Green Version]
- Long, Q.; Upadhya, D.; Hattiangady, B.; Kim, D.-K.; An, S.Y.; Shuai, B.; Prockop, D.J.; Shetty, A.K. Intranasal MSC-Derived A1-Exosomes Ease Inflammation, and Prevent Abnormal Neurogenesis and Memory Dysfunction after Status Epilepticus. Proc. Natl. Acad. Sci. USA 2017, 114, E3536–E3545. [Google Scholar] [CrossRef] [Green Version]
- Borges, K.; Shaw, R.; Dingledine, R. Gene Expression Changes after Seizure Preconditioning in the Three Major Hippocampal Cell Layers. Neurobiol. Dis. 2007, 26, 66–77. [Google Scholar] [CrossRef] [Green Version]
- Yoo, T.-H.; Ryu, B.-K.; Lee, M.-G.; Chi, S.-G. CD81 Is a Candidate Tumor Suppressor Gene in Human Gastric Cancer. Cell. Oncol. 2013, 36, 141–153. [Google Scholar] [CrossRef] [PubMed]
- Fagerberg, L.; Hallström, B.M.; Oksvold, P.; Kampf, C.; Djureinovic, D.; Odeberg, J.; Habuka, M.; Tahmasebpoor, S.; Danielsson, A.; Edlund, K.; et al. Analysis of the Human Tissue-Specific Expression by Genome-Wide Integration of Transcriptomics and Antibody-Based Proteomics. Mol. Cell. Proteom. 2014, 13, 397–406. [Google Scholar] [CrossRef] [PubMed] [Green Version]
- Zuehlke, A.D.; Beebe, K.; Neckers, L.; Prince, T. Regulation and Function of the Human HSP90AA1 Gene. Gene 2015, 570, 8–16. [Google Scholar] [CrossRef] [Green Version]
- Kim, Y.-J.; Kim, J.-Y.; Ko, A.-R.; Kang, T.-C. Reduction in Heat Shock Protein 90 Correlates to Neuronal Vulnerability in the Rat Piriform Cortex Following Status Epilepticus. Neuroscience 2013, 255, 265–277. [Google Scholar] [CrossRef]
- Lee, S.; Francoeur, A.M.; Liu, S.; Wang, E. Tissue-Specific Expression in Mammalian Brain, Heart, and Muscle of S1, a Member of the Elongation Factor-1 Alpha Gene Family. J. Biol. Chem. 1992, 267, 24064–24068. [Google Scholar] [CrossRef]
- Soares, D.C.; Abbott, C.M. Highly Homologous EEF1A1 and EEF1A2 Exhibit Differential Post-Translationalmodification with Significant Enrichment around Localised Sites of Sequence Variation. Biol. Direct 2013, 8, 29. [Google Scholar] [CrossRef] [Green Version]
- Chambers, D.M.; Peters, J.; Abbott, C.M. The Lethal Mutation of the Mouse Wasted (Wst) Is a Deletion That Abolishes Expression of a Tissue-Specific Isoform of Translation Elongation Factor 1alpha, Encoded by the Eef1a2 Gene. Proc. Natl. Acad. Sci. USA 1998, 95, 4463–4468. [Google Scholar] [CrossRef] [PubMed] [Green Version]
- Davies, F.C.J.; Hope, J.E.; McLachlan, F.; Nunez, F.; Doig, J.; Bengani, H.; Smith, C.; Abbott, C.M. Biallelic Mutations in the Gene Encoding EEF1A2 Cause Seizures and Sudden Death in F0 Mice. Sci. Rep. 2017, 7, 46019. [Google Scholar] [CrossRef] [PubMed]
- Lam, W.W.K.; Millichap, J.J.; Soares, D.C.; Chin, R.; McLellan, A.; FitzPatrick, D.R.; Elmslie, F.; Lees, M.M.; Schaefer, G.B.; Abbott, C.M. Novel de Novo EEF1A2 Missense Mutations Causing Epilepsy and Intellectual Disability. Mol. Genet. Genom. Med. 2016, 4, 465–474. [Google Scholar] [CrossRef] [PubMed] [Green Version]
- Nakajima, J.; Okamoto, N.; Tohyama, J.; Kato, M.; Arai, H.; Funahashi, O.; Tsurusaki, Y.; Nakashima, M.; Kawashima, H.; Saitsu, H.; et al. De Novo EEF1A2 Mutations in Patients with Characteristic Facial Features, Intellectual Disability, Autistic Behaviors and Epilepsy. Clin. Genet. 2015, 87, 356–361. [Google Scholar] [CrossRef] [PubMed]
- de Ligt, J.; Willemsen, M.H.; van Bon, B.W.M.; Kleefstra, T.; Yntema, H.G.; Kroes, T.; Vulto-van Silfhout, A.T.; Koolen, D.A.; de Vries, P.; Gilissen, C.; et al. Diagnostic Exome Sequencing in Persons with Severe Intellectual Disability. N. Engl. J. Med. 2012, 367, 1921–1929. [Google Scholar] [CrossRef] [Green Version]
- GTEx Portal. Available online: https://www.gtexportal.org/home/gene/TUBA1A (accessed on 29 June 2021).
- Hikita, N.; Hattori, H.; Kato, M.; Sakuma, S.; Morotomi, Y.; Ishida, H.; Seto, T.; Tanaka, K.; Shimono, T.; Shintaku, H.; et al. A Case of TUBA1A Mutation Presenting with Lissencephaly and Hirschsprung Disease. Brain Dev. 2014, 36, 159–162. [Google Scholar] [CrossRef]
- Kumar, R.A.; Pilz, D.T.; Babatz, T.D.; Cushion, T.D.; Harvey, K.; Topf, M.; Yates, L.; Robb, S.; Uyanik, G.; Mancini, G.M.S.; et al. TUBA1A Mutations Cause Wide Spectrum Lissencephaly (Smooth Brain) and Suggest That Multiple Neuronal Migration Pathways Converge on Alpha Tubulins. Hum. Mol. Genet. 2010, 19, 2817–2827. [Google Scholar] [CrossRef] [PubMed] [Green Version]
- Dumontet, C. Mechanisms of action and resistance to tubulin-binding agents. Expert Opin. Investig. Drugs 2000, 9, 779–788. [Google Scholar] [CrossRef]
- Laurén, H.B.; Lopez-Picon, F.R.; Brandt, A.M.; Rios-Rojas, C.J.; Holopainen, I.E. Transcriptome Analysis of the Hippocampal CA1 Pyramidal Cell Region after Kainic Acid-Induced Status Epilepticus in Juvenile Rats. PLoS ONE 2010, 5, e10733. [Google Scholar] [CrossRef] [Green Version]
- Marrone, A.K.; Kucherenko, M.M.; Wiek, R.; Göpfert, M.C.; Shcherbata, H.R. Hyperthermic seizures and aberrant cellular homeostasis in Drosophila dystrophic muscles. Sci. Rep. 2011, 1, 1–9. [Google Scholar] [CrossRef] [Green Version]
- Aronica, E.; Boer, K.; Baybis, M.; Yu, J.; Crino, P. Co-Expression of Cyclin D1 and Phosphorylated Ribosomal S6 Proteins in Hemimegalencephaly. Acta Neuropathol. 2007, 114, 287–293. [Google Scholar] [CrossRef] [PubMed] [Green Version]
- Cho, C.-H. Frontier of Epilepsy Research—MTOR Signaling Pathway. Exp. Mol. Med. 2011, 43, 231–274. [Google Scholar] [CrossRef] [Green Version]
- Laumonnier, F.; Cuthbert, P.C.; Grant, S.G.N. The Role of Neuronal Complexes in Human X-Linked Brain Diseases. Am. J. Hum. Genet. 2007, 80, 205–220. [Google Scholar] [CrossRef] [PubMed] [Green Version]
- Moreira-Filho, C.A.; Bando, S.Y.; Bertonha, F.B.; Iamashita, P.; Silva, F.N.; Costa, L.; da, F.; Silva, A.V.; Castro, L.H.M.; Wen, H.-T. Community Structure Analysis of Transcriptional Networks Reveals Distinct Molecular Pathways for Early- and Late-Onset Temporal Lobe Epilepsy with Childhood Febrile Seizures. PLoS ONE 2015, 10, e0128174. [Google Scholar] [CrossRef] [PubMed]
- do Canto, A.M.; Donatti, A.; Geraldis, J.C.; Godoi, A.B.; da Rosa, D.C.; Lopes-Cendes, I. Neuroproteomics in Epilepsy: What Do We Know so Far? Front. Mol. Neurosci. 2021, 13, 604158. [Google Scholar] [CrossRef] [PubMed]
- Pires, G.; Leitner, D.; Drummond, E.; Kanshin, E.; Nayak, S.; Askenazi, M.; Faustin, A.; Friedman, D.; Debure, L.; Ueberheide, B.; et al. Proteomic Differences in the Hippocampus and Cortex of Epilepsy Brain Tissue. BiorΧiv 2020. [Google Scholar] [CrossRef]
- Yang, Y.; Boza-Serrano, A.; Dunning, C.J.R.; Clausen, B.H.; Lambertsen, K.L.; Deierborg, T. Inflammation Leads to Distinct Populations of Extracellular Vesicles from Microglia. J. Neuroinflamm. 2018, 15, 168. [Google Scholar] [CrossRef]
- Reactive Astrogliosis Causes the Development of Spontaneous Seizures. J. Neurosci. 2015, 35, 3330–3345. Available online: https://www.jneurosci.org/content/35/8/3330/ (accessed on 29 June 2021). [CrossRef] [Green Version]
- Scihub.Se. Available online: https://scihub.se/10.1038/nrdp.2018.24 (accessed on 29 June 2021).
- Long, K.S. Ribosomal Protein Synthesis Inhibitors. In Encyclopedia of Molecular Pharmacology; Offermanns, S., Rosenthal, W., Eds.; Springer: Berlin/Heidelberg, Germany, 2008. [Google Scholar] [CrossRef]

Publisher’s Note: MDPI stays neutral with regard to jurisdictional claims in published maps and institutional affiliations. |
© 2021 by the authors. Licensee MDPI, Basel, Switzerland. This article is an open access article distributed under the terms and conditions of the Creative Commons Attribution (CC BY) license (https://creativecommons.org/licenses/by/4.0/).
Share and Cite
Yu, C.; Rietman, E.A.; Siegelmann, H.T.; Cavaglia, M.; Tuszynski, J.A. Application of Thermodynamics and Protein–Protein Interaction Network Topology for Discovery of Potential New Treatments for Temporal Lobe Epilepsy. Appl. Sci. 2021, 11, 8059. https://doi.org/10.3390/app11178059
Yu C, Rietman EA, Siegelmann HT, Cavaglia M, Tuszynski JA. Application of Thermodynamics and Protein–Protein Interaction Network Topology for Discovery of Potential New Treatments for Temporal Lobe Epilepsy. Applied Sciences. 2021; 11(17):8059. https://doi.org/10.3390/app11178059
Chicago/Turabian StyleYu, Chang, Edward A. Rietman, Hava T. Siegelmann, Marco Cavaglia, and Jack A. Tuszynski. 2021. "Application of Thermodynamics and Protein–Protein Interaction Network Topology for Discovery of Potential New Treatments for Temporal Lobe Epilepsy" Applied Sciences 11, no. 17: 8059. https://doi.org/10.3390/app11178059