1. Introduction
The shock environment exists widely in aerospace engineering. A high-frequency transient shock load will occur during the initiating process of a pyrotechnics device. The response of spacecraft under this shock load is defined as the shock environment [
1]. During the process of explosive separation, the explosion and separation can produce a complex shock environment with a short duration, high frequency and high amplitude, which may cause the damage or failure of the satellite system (especially the electronic equipment), resulting in failure of the satellite. Therefore, the transient response analysis of the spacecraft structure under the explosive separation and shock load is an important aspect of satellite development [
2]. A reasonable prediction method of the shock response is urgently needed in the process of spacecraft development and the early stage of system level tests so as to reduce the scientific research cost and shorten the development cycle. Because of the complexity of the structure and material properties of spacecraft, the modal density of each part of the spacecraft varies greatly. Due to the large area mass and dense modes of the structure, such as the stellar panel, it is very sensitive to high frequency excitation. Therefore, a single finite element or statistical energy analysis method cannot solve the problem well. The hybrid FE-SEA method based on the wavenumber can effectively solve the problem of a complex spacecraft response [
3].
Due to the complexity of the shock environment, the shock signal has obvious high frequency or broadband characteristics. The traditional finite element analysis and other dynamic analysis methods cannot accurately predict the high frequency response caused by the shock load [
4,
5]. In engineering practice, the magnitude of the shock load is estimated based on the engineering experience combined with the data of a similar test [
6]. Lacher [
7] studied a shock test method. A pendulum was used to shock the plate to achieve different shock environments. Statistical energy analysis was used in the numerical simulation [
8]. Tagarielli et al. predicted the dynamic response of a composite sandwich beam under shock load. The shock responses of fully clamped monolithic and sandwich beams with elastic panels and compressible elastoplastic cores were analyzed [
9]. The FE-SEA method [
10] was used to calculate the high frequency or middle high frequency response of the structure. The transient statistical energy analysis (TSEA), the finite element method, the local phase information reconstruction (LMPR), and the virtual mode synthesis (VMSS) were utilized to calculate the transient shock response of the structure. George [
11] investigated a method of transient response prediction. The shock load was applied to the structure. The results of the numerical analysis were verified by experiments. Jalal Akbari [
12] focused on dynamic response estimation against short-time loading with an updated finite element model, using frequency response functions and the particle swarm optimization technique. Pinnington [
13] calculated the exact transient energy response of a two-degree-of-freedom system under impulse, and the accurate transient energy response of the two-oscillator system was studied by using TSEA. At the same time, the two methods were simulated. Bodin [
14] synthesized the correlation phase based on the pseudo modal phase change. Combined with the influence of the high frequency filter output and low frequency finite element calculation, the time history response of the equipment in the whole frequency range was predicted. Caresta [
15] developed a method to predict the transient response of the shock source under structural shock loading. According to the relationship between the impulse response and contact force, Caresta calculated the structural displacement and contact force. Borello [
16] supplemented the missing phase information of the statistical energy analysis by supplementing the substructure modal information. The transfer function of the phase reconfiguration was obtained. Then, the time-dependent structural response was calculated by Fourier inverse transform. This method was called local modal phase information reconstruction. The VMSS method was proposed by E. C. Dalton et al. [
17]. The principle of statistical energy analysis was introduced into the classical modal analysis. E. C. Dalton et al. expounded the principles and basic formulas of VMSS. It integrated the method into a general computing program. Zhao et al. [
18] proposed an improved VMSS to study the shock response of the structure. Experiments were carried out for verification. For the complex structure and the shock signal containing many kinds of information, the applicability of the above method was reduced. For instance, the VMSS ignores the low mode structure, and the TSEA and LMPR cannot deal with complex structures. The calculation accuracy is also difficult to guarantee.
Luo et al. [
19] predicted the vibration of typical beam structures based on the hybrid FE-SEA method. It was found that the hybrid method was more efficient than other methods. Yan et al. [
20] researched the hybrid method of aircraft model. The structural noise response of aircraft model under acoustic vibration coupling was studied by the hybrid FE-SEA method. In addition, some other papers have applied the hybrid FE-SEA method to different structures and problems [
21,
22]. At present, the hybrid FE-SEA method is mainly used to solve the problem of steady-state response. For the prediction of the structural shock response, the application of the hybrid FE-SEA method is rarely studied.
In this paper, the basic theory of FE-SEA hybrid method is derived. This method is extended to shock response prediction. When the shock load is acted on the structure, the response time is very short, and the phase of the response of the structure is very close to the phase of the loaded signal. The amplitude of the response is mainly determined by the frequency response function. A more accurate and applicable prediction method of the shock response based on the hybrid FE-SEA method is presented in this paper. The time domain response results are reconstructed by using the phase information of the loaded signal. We can calculate the SRS needed in engineering based on the time domain response. A shock experiment for the typical spacecraft structure to the rationality and sufficient accuracy of the novel method is carried in this paper. At the same time, compared with the finite element method and other transient response prediction methods, the complex structures are reasonably calculated, and the computational efficiency is greatly improved by our method. The research in this paper can better predict the shock response of system level spacecraft structure and shorten the development cycle of the spacecraft. It provides a basis for the application of the steady-state method to shock problems.
2. The Basic Theory of Shock Response Prediction
A new prediction method of shock response based on the hybrid FE-SEA method is presented in this paper. The flow chart for the shock response predictions process in this article is illustrated in
Figure 1. It is known that the amplitude of the response is mainly determined by the frequency response function, and the typical spacecraft structure is a small damping vibration system. Therefore, we start with the analysis of the loading signal. The quasi-steady state loading method is adopted. Firstly, based on short-time Fourier transform (
STFT) technology, the time–frequency domain transform of the shock load signal is studied. The amplitude–frequency value of the shock load and the acceleration phase–frequency characteristics of the shock loading in a single degree of freedom system are obtained. Then, the hybrid FE-SEA model of the structure is established. By using the force load input method, the model is loaded. The acceleration frequency response of each frequency band is calculated separately. Finally, the time domain response results are reconstructed based on the inverse short-time Fourier transform (ISTFT) technique by using a series of acceleration frequency response and the corrected phase information. At the same time, the
SRS are calculated based on the shock response spectrum theory.
The shock load force function acting on the structure is defined as
.
STFT is used for the time–frequency analysis of the shock time domain signal. It has superior performance in non-linear and non-stationary signal processing. The basic idea of
STFT is to divide the original signal into a number of stationary or approximate stationary segments by a window function, which is shifted with time. Then, the frequency spectrum of each time period is calculated and determined. For the convenience of numerical calculation,
STFT is discretized in the time domain and frequency domain. After deduction and analysis, the basic form of discrete
STFT is written as follows:
in which
contains the results of
STFT related to frequency and time,
n is the discrete time,
r is the angular frequency,
x(
t) symbolizes the original signal, and
symbolizes a window function.
According to the
STFT theory, the result of the time–frequency analysis is calculated by using MATLAB tools for programming. From the above Equation (1), we can obtain the following:
where
symbolizes the amplitude–frequency value of the shock load, and
symbolizes the phase–frequency characteristics
.The phase information of the response of the
ith subsystem corrected on the basis of original signal could be written as follows:
where
is the phase delay factor of the shock load passing through the
ith subsystem.
is related to the damping of the
ith subsystem and the distance between the
ith subsystem and the shock source. The sine shock load signal is loaded into the single degree of freedom system with a different damping ratio. The acceleration response analysis of the system is shown in
Figure 2.
Figure 2a,b shows the acceleration responses of the system with a large damping ratio (0.5) and small damping ratio (0.02), respectively.
It is found that the phase of the acceleration response is almost the same as that of the loading signal in the case of small damping. The above study reveals that when the shock load acts on the structure piecewise and the response time is very short, the phase change is very small in the whole loading time domain. The damping coefficient of the system is generally less than 0.1. The phase of the structural response is very close to that of the loading signal. Therefore, the effect of on the response prediction is usually ignored.
The complex spacecraft structure contains a variety of structural forms. According to the hybrid FE-SEA theory, the structure can be divided into different subsystems, according to the modal characteristics of each part. The acceleration response of the subsystem with higher modal density has statistical characteristics when it is exposed to the shock load. The statistic characteristics can be processed by the concept of statistical average, while the subsystem with sparse modal density cannot be processed accurately. Therefore, the average value of the statistical energy of all subsystems of the overall spacecraft structure cannot be inferred by the modal density in the frequency range alone, nor can the overall reliable response result be obtained by the finite element method alone. In this case, the most reasonable method is to carry out hybrid FE-SEA modeling for complex structures. The subsystem with higher modal density is the SEA system, and the subsystem with sparse modal density is the FE system. In this paper, the hybrid FE-SEA model of spacecraft structure is established. Based on the FE-SEA model, the acceleration frequency response of the structure in each frequency band is calculated.
In the hybrid FE-SEA method, diffuse reflection means the reverberant energy field after multiple reflections. The direct field only satisfies the output displacement field on the deterministic boundary, and the energy can be radiated out through the direct field subsystem. The function of reverberation field is to superimpose the boundary conditions of reverberation field and direct field linearly. The deterministic and stochastic boundary conditions are satisfied simultaneously [
23,
24].
The dynamic equation of subsystem boundary can be written as follows:
where
is the dynamic stiffness matrix of direct field, which is used to solve the displacement on the definite boundary,
is the reverberation force generated by reverberation field energy, and
is the external load. After coupling, only considering the effect of the external force of the deterministic subsystem on the deterministic subsystem, the dynamic equation of the deterministic subsystem can be shown as follows:
where
,
is the dynamic stiffness matrix of the deterministic subsystem,
q is a deterministic generalized coordinate, and
is the sum of the external loads. The set average of Equation (6) is solved. The response cross-spectrum can be given as follows:
where
is the cross-spectrum of external load, and
is the cross-spectrum of blocked diffuse reverberant force. The set average related to the blocking force
in the reverberation field can be obtained from the reciprocity between the direct field and the reverberation field. In a diffuse reverberation field, because of the relationship between the blocking force of the stochastic subsystem in the reverberation field and the uncertainty of the system, the set related to
tends to the following values:
where
is the proportional constant related to the reverberation field amplitude, and
is the diffuse reverberant energy. The energy of each stochastic subsystem can be calculated by the power balance among subsystems.
The power flow balance relation of stochastic
ith subsystem can be established as follows:
where
is the input power of the direct field to the random subsystem through the deterministic boundary,
is the input power directly applied to the random subsystem,
is the output power through the blocked hybrid force with deterministic boundary conditions,
is the power dissipated with internal loss factor, and
is the power transferred to other statistical energy subsystems.
Considering the energy equations of each stochastic subsystem, the energy equations of the
ith stochastic subsystem can be obtained as follows:
where
is the internal loss factor,
is the coupling loss factor,
is the energy of the
ith system,
is the input power applied to the
ith system,
is the power input by other systems, and
can be represented by
and
The analysis process based on the hybrid method is as follows: Firstly, the system is divided into a deterministic subsystem and stochastic subsystem, and the dynamic stiffness matrix of the joint is obtained. Then, the parameters of the subsystem are analyzed. Furthermore, the power balance equation of stochastic subsystem is established to solve the energy of stochastic subsystem. Finally, the deterministic subsystem is solved.
According to the relationship between average velocity and energy response, the average velocity of the
ith subsystem can be expressed as follows:
where
is the energy response,
is the velocity response, and
is the mass.
According to Equation (11), the acceleration response amplitude of the
ith subsystem can be obtained as follows:
The inverse short time Fourier transform is discretized in the time domain and frequency domain. After derivation, the basic form of discrete ISTFT is represented as follows:
According to the STFT theory, the inverse short time Fourier transform of signal is realized by using MATLAB tools for programming. So far, we have obtained the results of acceleration frequency response () and the phase information () corrected on the basis of the original signal. Combined with the two calculation data, the time history response of the ith subsystem under shock loading is reconstructed. Then, the shock response spectrum is calculated, based on the time history response.
3. Shock Experiment and Simulation Study of Spacecraft Structure
This section introduces the shock experiment of a typical spacecraft structure. The shock force load function curve and the structure’s acceleration shock response results are obtained through experiments. In addition, the time–frequency results of the shock load signal are analyzed based on STFT. A hybrid model of the spacecraft structure is established. Through the FE-SEA method, the acceleration shock response of the structure is calculated by the quasi-steady state loading method. Comparing experiments and calculations, the accuracy of the impulse response prediction method is verified and discussed.
3.1. Shock Experiment of the Spacecraft Structure
The shock experiment should provide information for subsequent numerical simulation verification in three aspects. First, the shock force function acting on the structure is measured in the test. It is used as the input signal of numerical analysis. Second, the hybrid model is established, according to the structure of spacecraft. Third, the response results of the structure under shock load are obtained. It is used as a reference value for numerical analysis results.
We designed a high frequency and high efficiency shock test platform based on the light-gas gun device. Shock tests of typical spacecraft structures are carried out with this platform. In the tests, a typical structure of the spacecraft is assembled by employing aluminum honeycomb sandwich panels and beams. The four aluminum honeycomb sandwich panels have the same structure; the size is 100 cm × 120 cm, and the thickness is 3 cm. The plates are assembled into the spacecraft cabin by the beam structure.
The shock experiment of the structure is shown in
Figure 3. The structure is suspended on the test support by using elastic ropes. The power unit of shock loading device is the light-gas gun which is shown in
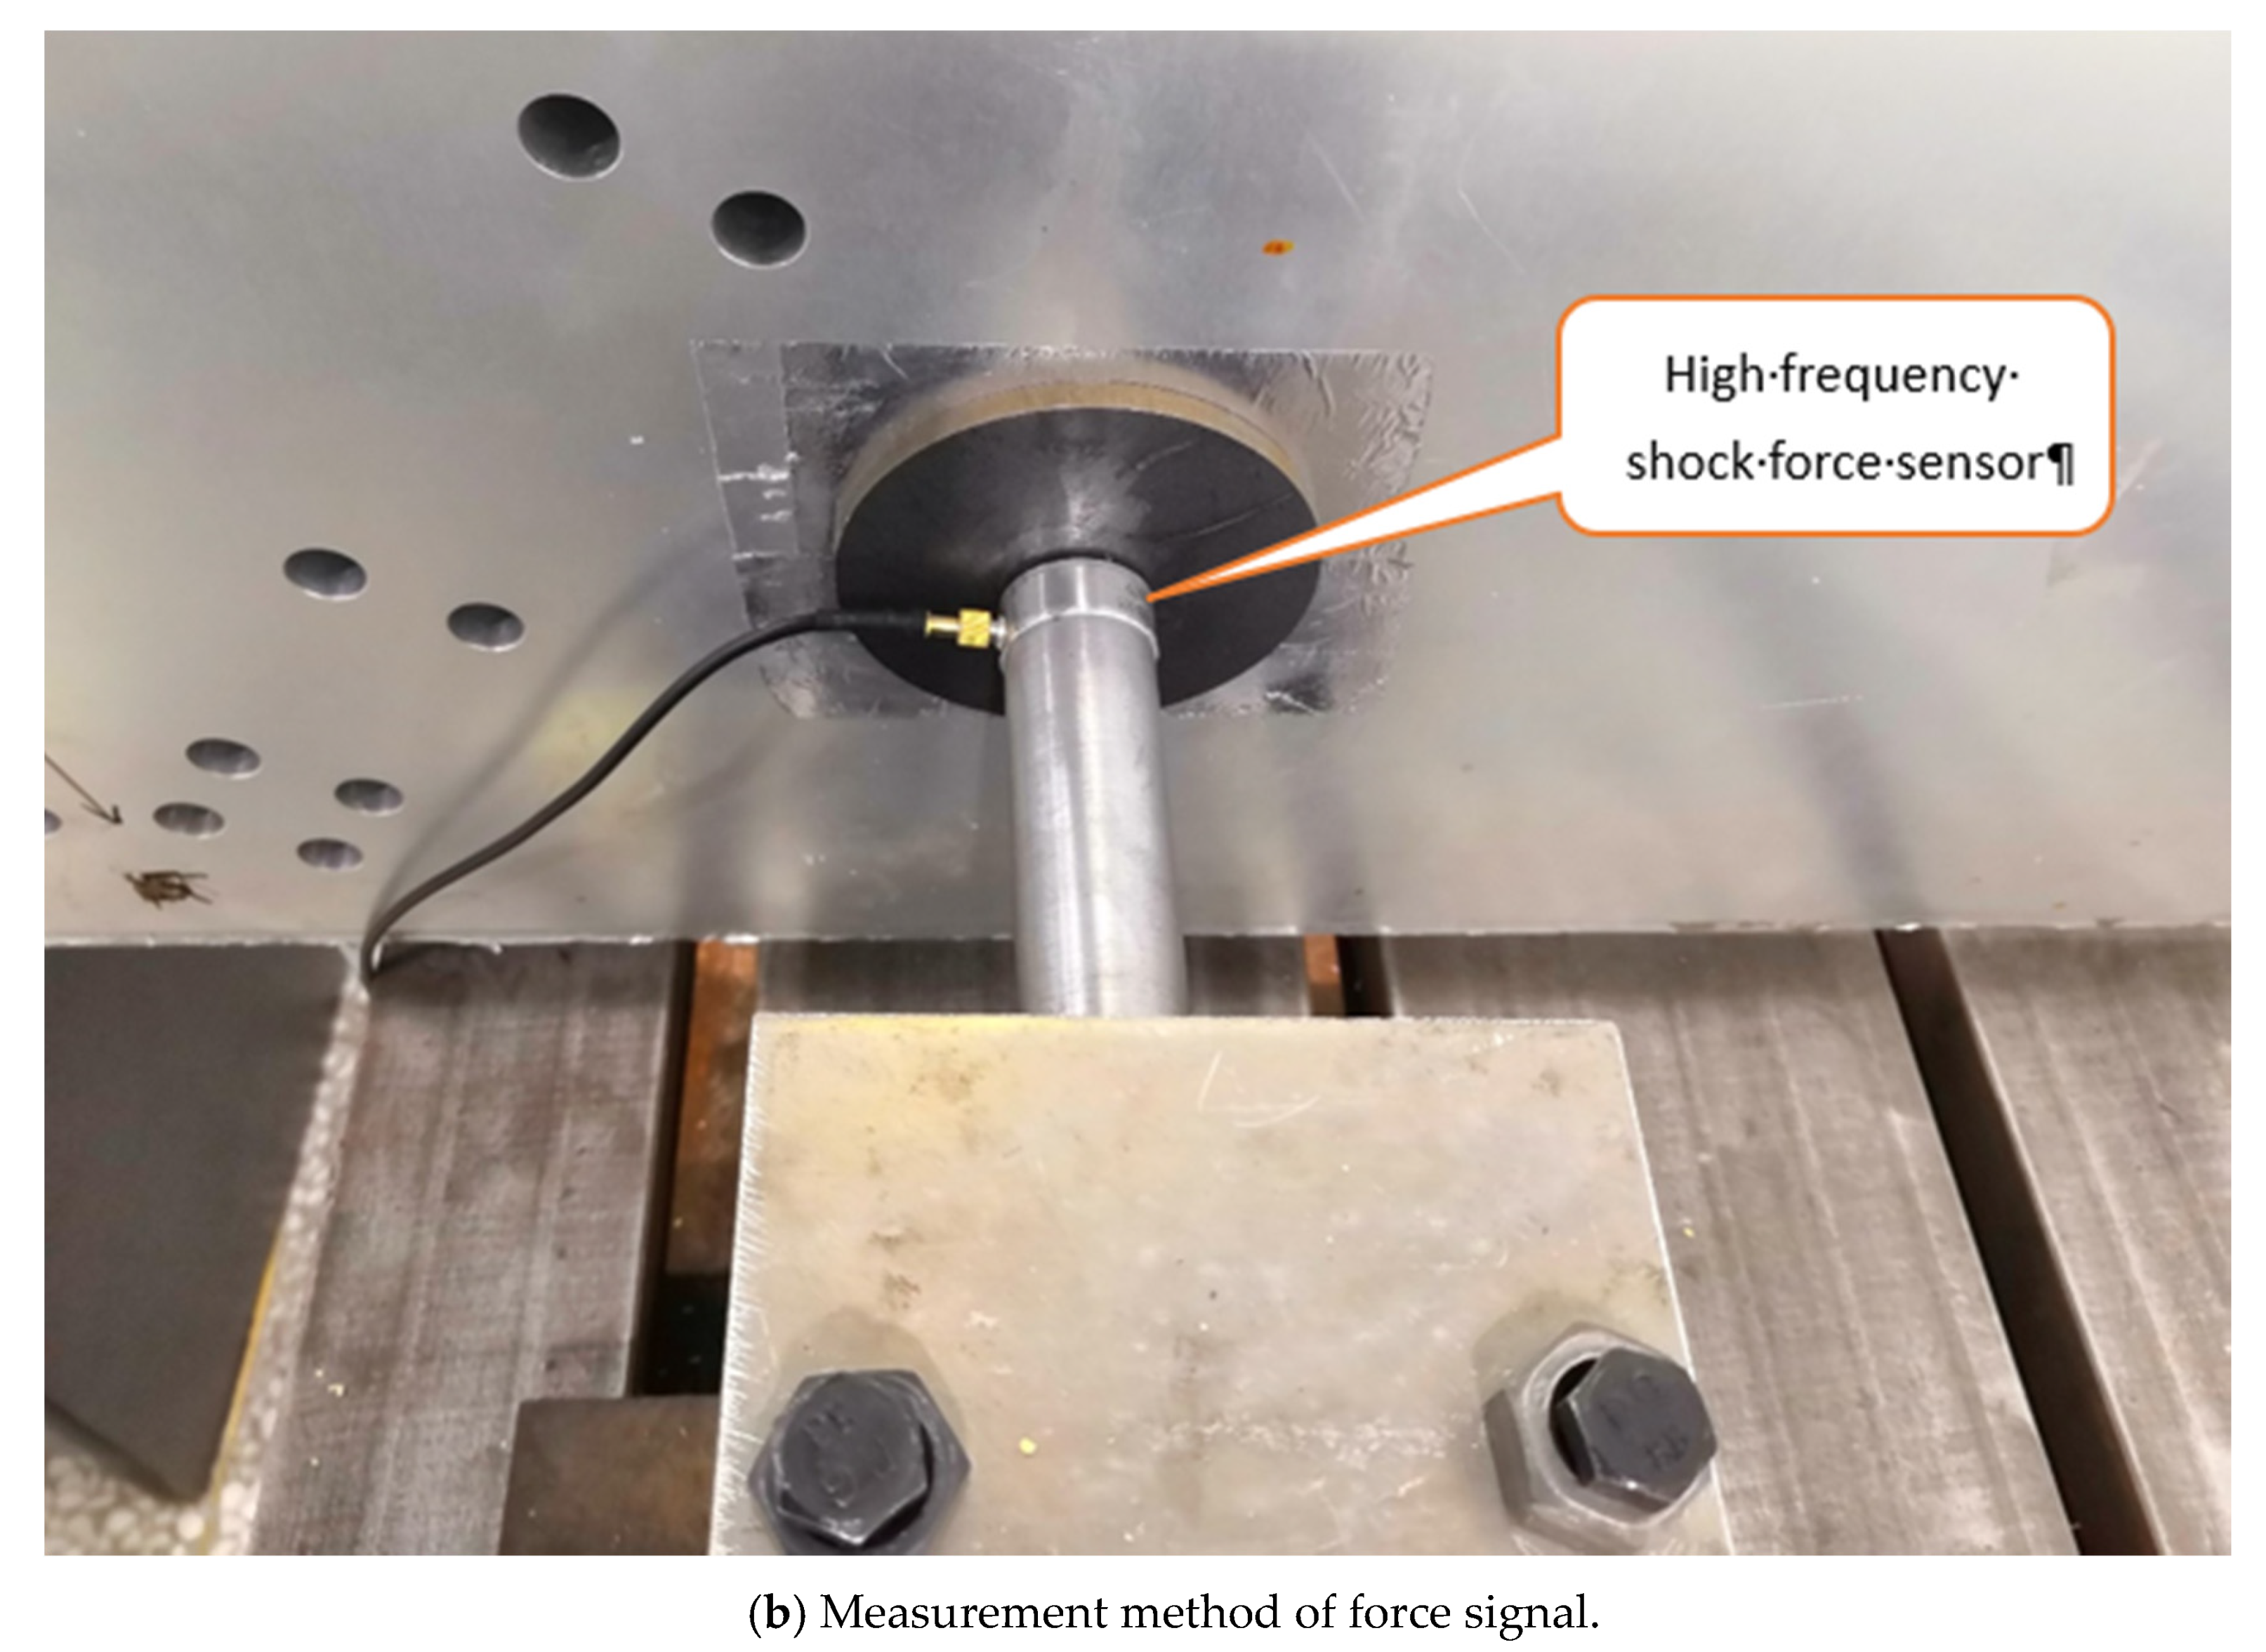
Figure 4a. By changing the pressure value of the pressure chamber of the light-gas gun, the shock load is adjusted. Bullets with various geometries and vibrating rods of different materials and sizes are fabricated. By selecting the bullet and the vibrating rod, the waveform of the loading signal can be adjusted, and the shock load of our concerned frequency and magnitude can be obtained. A shock force sensor and a vibration rod are arranged at the shock position of the structure, which is shown in
Figure 4b. In the experiment, the function of the shock force sensor is to measure the electric signal of the shock force function of the bullet acting on the steel plate. The measuring range of the force sensor is 80,000 N. The measured signal can be directly converted into the pressure signal by using the piezoresistive relationship obtained by calibrating the sensor in advance. It provides input force for numerical calculation.
Subsequently, the inclusion curves of
SRS results of all acceleration sensor data on a board are used as the test results of the board. The acceleration sensors are arranged on four plates in the principle of random distribution. Four acceleration sensors are arranged on each board. The measuring range of the acceleration sensor is 20,000 Hz and 50,000 g. Through the signal acquisition system, the acceleration response of each position of the structure is collected. The measurement and control system of the experiment can be seen in
Figure 5. Based on the measurement and control system, the results are collected, analyzed and processed. Finally, the acceleration shock response spectrum of the structure can be calculated, according to the shock response results. According to the acceleration signal of each measuring point, the average acceleration response and
SRS of the structure in space is calculated. The test experiment is used to provide reference values for numerical analysis.
3.2. The Time–Frequency Analysis of Shock Load
The input force load measured from the experiment is used as the input load of the numerical analysis. This high frequency shock load signal is shown in
Figure 6. The explosion shock signal has the characteristics of short duration and fast mutation. The peak value of shock signal in
Figure 6 is obvious with high frequency, and the maximum value reaches 30,000 N. The experimental result is consistent with the characteristics of the shock signal from the explosion.
According to the
STFT theory in the previous chapter, the time–frequency analysis of the typical high-frequency shock load signal in
Figure 6 is calculated. The shock load signal is transformed by
STFT, and the results are shown in
Figure 7. The
STFT results include both the temporal and frequency characteristics of the signal. It can be found that each time period contains a frequency value, and the frequency energy is more concentrated between 1 ms and 2 ms, which is related to the characteristics of the time domain signal.
3.3. Hybrid FE-SEA Model and Solution
The typical spacecraft structure used in the experiment is shown in
Figure 3. The hybrid FE-SEA model of the structure is established based on FE-SEA theory, as shown in
Figure 8.
In the typical structure, the aluminum honeycomb sandwich panels behave with low stiffness but high modal density. This accords with the characteristics of SEA. So, the aluminum honeycomb sandwich panels are built as SEA model. The modal density of the connecting beam is low. It is built as a FE model. The process of model establishment meets the accuracy requirements of simplification and equivalence. The beam structure is made of cylindrical aluminum alloy, with a length of 110 cm and a density of 2750 kg/m
3. The finite element model of the beam structure is established, according to the beam structure form in
Figure 3, with a mass of 4.3 kg. The plate structure is an aluminum honeycomb sandwich plate structure; the size is 100 cm × 120 cm, and the thickness is 3 cm. The thickness of the upper and lower aluminum plates is 0.1 cm, and the density is 2700 kg/m
3. The thickness of honeycomb sandwich structure is 2.8 cm, and the density is 48 kg/m
3. The statistical energy analysis model of sandwich structure is established according to the actual structure, and the mass is 8.2 kg.
Since the honeycomb panel and the beam structure are connected by screws, a mixed point connection is established between the FE subsystem and the SEA subsystem. In VAone, corresponding material attributes are generated, according to material type settings. In the early stage, we conducted the parameter test of a single-plate, double-plate and four-plate structure. The internal loss factor, coupling loss factor and modal density of SEA model are obtained through typical structural parameter measurement experiments. As shown in
Figure 8, the plate shocked by the load and the three response plates are defined as plate 1, plate 2, plate 3 and plate 4, respectively.
For the statistical energy analysis subsystem, only the modal characteristics of the structure need to be concerned. In the process of modeling, the form of the structure is simplified. After the SEA model is established, the modal density of the subsystem in each frequency band is detected based on the VAone intermediate frequency band modal number analysis. Based on hybrid connection detection, the connection mode between subsystems is modified. The modal number of SEA subsystem in each frequency band is greater than five. The SEA model meets the calculation standard. The parameters of hybrid connection are corrected by a parameter test. The convergence and stability of the finite element subsystem are analyzed. The overall modal density of the finite element subsystem is low. So, the number of grids meets the requirements of calculation accuracy. The vibration mode of finite element structure is consistent with that of an actual beam structure. Therefore, the model based on hybrid method can effectively characterize the actual structure. The prediction of structural shock response based on the model is reasonable and effective. Taking the time–frequency analysis results as the input load, the quasi-steady state loading mode is used to calculate the coupled plate structure. The loading mode of the force spectrum is used, and the result of the structural response is predicted based on the hybrid FE-SEA method. By using the phase information and a series of frequency response, the time domain response is reconstructed by utilizing the ISTFT technique. The results of the overall time domain response are reconstructed. The SRS of typical spacecraft structure can be calculated based on the time domain response results. So far, we obtain the final shock response of the structure based on the hybrid FE-SEA method.
Figure 9 illustrates the
SRS results of the typical spacecraft structure, which are obtained based on the hybrid FE-SEA method. Obviously, the four
SRS curves have similar trends with the change of frequency. The value shows an increasing trend from 100 Hz to 2500 Hz, and reaches the inflection point and the maximum at about 2500 Hz. It starts to decrease from 2500 Hz and tends to a stable value. For the same frequency bandwidth, the
SRS results show a decreasing trend from plate 1 to plate 4. However, the
SRS results of plate 2 and plate 3 are almost the same. This result conforms to the actual transmission law of the impulse response. Plate 1 is the closest to the source of the shock load, and plate 4 is the farthest from the source of the shock load. The farther away from the shock source, the smaller the shock response. Plate 3 and plate 2 are symmetrical to the shock source, so their
SRS are the same, in theory. However, due to the simplification of the model and the errors in the reconstruction of the response results, there are very slight differences between their
SRS.
3.4. Results and Discussion
In this chapter, the shock response of the loading plate and the response plate of the spacecraft structure are obtained by the hybrid FE-SEA method. The
SRS of calculation and experiment for the plate 1 are plotted in
Figure 10. The
SRS of the calculation and experiment for the other three response plates are shown in
Figure 11,
Figure 12 and
Figure 13, respectively. With the change of in frequency, the
SRS curves of the four plate test results have a similar trend. The value shows an upward trend form, reaching the inflection point and the maximum at about 2500 Hz. At the same frequency band width, the values from plate 1 to plate 4 show a downward trend. The test results are consistent with the physical law of shock load transmission in the structure. By comparing the numerical and experimental data of the spacecraft structure, the rationality and sufficient accuracy of the proposed method in this paper are discussed.
From
Figure 10,
Figure 11,
Figure 12 and
Figure 13, it is shown that the numerical results are in good agreement with the experimental results. The maximum and inflection points of the two results are close. The evolution trend of the two curves with the increase of frequency are the same. In most frequency bands, the calculated results are within 6 dB of the experimental results. However, it is obvious that in some cases, the error of the calculation results is large, especially in some low-frequency bands.
The finite element model of the structural cabin is established, and the traditional finite element is used to analyze the response of the structural cabin. In order to ensure the calculation accuracy of high frequency band, the grid size should meet the requirements of the modal analysis. The structure needs to be divided into at least 170,000 units. It is calculated every 10 μs step, and it takes more than 24 h to calculate 10,000 μs. The high-frequency band of the calculation results will be inaccurate, due to the high modal density. The new method is used to predict the shock response of the spacecraft cabin, which avoids the meshing of the plate structure. The same computer is used for the calculation, according to the frequency band based on the hybrid model. The above calculation results can be obtained in only a few minutes, which greatly improves the calculation efficiency. The calculation accuracy of high frequency band is also guaranteed.
The error reason is analyzed in the following. One is that there are errors in the parameters of the SEA model obtained from the measurement of typical structure. The other is that the modal density of the structure is low in some low frequency bands, which cannot meet the modal requirements for accurate results. Another reason is that four acceleration sensors are randomly arranged on each plate in the experiment, and the response result of the plate is the average of the five sensors. Since the number of measurement points is limited, the average response of these measurement points will also bring errors.
It can be found that the calculated results of plate 1 are more consistent with the experimental results than the other three plates. The calculated results of the plate 4 are the worst. It can be found that the farther the structure is from the shock source, the less consistent the calculated and experimental results are. In order to describe the above comparison results clearly, the coefficient
E is constructed to represent the error, which is defined as follows:
where
and
are the calculated
SRS and the experimental
SRS, respectively. Obviously, the coefficient
E is positive. The greater the coefficient
E, the greater the error.
This analysis shows that the error increases when the stress wave passes through the connecting structure. When the energy is transmitted from the shock source to the response plate, the more subsystems it passes through, the greater the prediction error of the response plate. The hybrid connection and structural transfer parameters cannot accurately describe the actual energy transfer. We should note that the calculation results are generally larger than the test results, and the calculation results are relatively conservative. The farther away from the shock source, the larger the phase error of the structural response. In the second section, the variable is proposed. The larger the is, the more conservative the calculation result. However, in general, the magnitude of the shock load at a distance from the shock source is relatively small. In future, it will be necessary to increase research on the structural connection setting. In the calculation process, the control variables can be summarized, according to the shock source distance and transmission law so as to improve the calculation accuracy.


