Article

Enhancement of Convection Heat Transfer in Air Using Ultrasound

Institute of Chemical Technology and Engineering, Poznań University of Technology, ul. Berdychowo 4, 60-965 Poznań, Poland
*
Author to whom correspondence should be addressed.
Appl. Sci. 2021, 11(19), 8846; https://doi.org/10.3390/app11198846
Submission received: 16 August 2021 / Revised: 17 September 2021 / Accepted: 19 September 2021 / Published: 23 September 2021

Abstract

:

Featured Application

This research concerns the improvement of heat transfer inside the dryer due to the use of ultrasound. The results can be used in all processes where convective heat exchange occurs in the gas.

Abstract

The use of ultrasound is a new method to enhance convection drying. However, there is little information in the literature on the improvement of convective heat transfer caused by ultrasound. Therefore, the heat transport during ultrasound-assisted convective heating of small samples in a hybrid dryer was experimentally examined. A small Biot number regime of heat transfer was considered. The results confirmed a great enhancement of heat transfer due to the application of ultrasound. Due to the use of ultrasound, the convective heat exchange coefficient increased from 45% to almost 250%. The enhancement is a linear function of applied ultrasound power. It was shown that the energy absorption of ultrasound existed, but the thermal effect of this absorption was very small.

1. Introduction

Almost every food product is dried during its processing. Drying extends storage life and facilitates handling as well as transportation. Drying also influences the quality of a final product. It changes the colour, flavour, and nutritional value of food. Due to the quality of the product, low-temperature drying is recommended. Unfortunately, low-temperature convective drying is energetically inefficient. Therefore, new methods to improve the process without raising the temperature are sought. One of these methods is the use of high-intensity ultrasound (US) [1]. Reviews of the use of ultrasound to enhance drying could be found in [2,3,4].
According to the literature [5,6,7,8,9,10], ultrasound enhances the capacity for moisture transport inside the material to be dried in addition to enhancing heat and moisture transfer between the material surface and the surrounding drying medium. Muralidhara et al. [5] considered sonic and ultrasonic dewatering. They presented the possible effects of acoustic waves during the process. The use of ultrasounds improved the kinetics of persimmon [6], apples [7,8,10], carrots [8], eggplant [8], and grape stalk [9] drying. An increase in the mass transfer coefficient due to the application of ultrasonic in drying is widely reported [6,11,12,13,14,15,16,17]. Cárcel et al. reported an increase of between 12% and 34% during persimmon drying [6], 10% and 47% during carrot drying [11], 47% during strawberries drying [16], 79% during green pepper drying [17], 96% during raspberries drying [15], 107% during orange peel drying [12], and even 229% during eggplant drying [13]. Rodríguez et al. [14] studied the influence of drying temperature on the ultrasound enhancement of thyme drying. They did not obtain an increase in the moisture transfer coefficient in high temperature drying (80 °C); they did obtain a 65% increase in low temperature (40 °C), however. Only a few authors determined the heat transfer coefficient based on drying kinetics. Rodríguez et al. [14] obtained an increase of between 12% and 47% of the heat transfer coefficient during thyme drying. Aversa et al. [18] reported an increase of between 12% and 44% during carrot drying. Musielak et al. [19] received a 31% increase in the case of apple drying and 83–94% in the case of carrot drying. Taking into account the literature devoted to drying, only Bantle and Hanssler [20] carried out the experiments in which they directly studied the influence of ultrasound on the heat transfer coefficient. They performed heating and cooling of an aluminum plate under the same conditions as used in drying experiments. They found out that ultrasound caused an increase in this coefficient (27.9%) in the case of heating, and a small decrease during cooling. It is also obvious that ultrasound energy could be absorbed by the dried material. Kowalski [21] described the phenomenon on the basis of irreversible thermodynamics; however, he did not present any numerical results in his work. The increase in material temperature due to ultrasound absorption in the range of 5 K is reported in [22] for the drying of apples. Similar values of the temperature increase were obtained by Musielak et al. [19]. The authors modelled the drying kinetics and they obtained ultrasound energy absorption in the range of 1–4.5 per mille. This thermal effect is minor or even not observed, and is usually neglected [11,23,24,25,26].
On the other hand, the phenomenon of heat transfer augmentation through the use of ultrasound is widely reported [27,28,29,30,31,32,33,34,35,36,37,38,39,40,41]. In most cases, the heat transfer in water [27,28,32,33,36,37,38,39] and other liquids (methanol [27,28], liquid FC-72 [30], ethylene glycol-water mixture [34], and LiBr solution [40]) was studied. In most cases, free convection in liquids and boiling was considered [28,30,35,39]. Only a few works were dedicated to forced convection [32,33,40], which is typical of the drying processes. Mannot et al. [32] reported an increase in the heat transfer coefficient between the coil and water in the range of 22–104%. Dhanalakshmi et al. [33] obtained an improvement in the heat transfer coefficient between water flowing through tubes in the range of 10–40%. Zheng et al. [40] examined the forced flow of LiBR solution outside tubes. They received an increase in the heat transfer coefficient in the range of 10–45%. In these publications [32,33,40], the phenomena that cause the improvement of heat transfer have not been investigated. In other publications, an enhancement of heat transfer due to cavitation [30,32,33,38] and acoustic streaming [33,36,37,38,39] was observed. Generally, an enhancement of heat transfer in liquids from 22% to 390% has been reported [32,37,39]. There are a lack of studies on the influence of ultrasound on the convective heat transfer coefficient in the gas phase—achieved through utlising an airborne ultrasound. This is because the generation of power ultrasound in liquids is easier and much more efficient than in gases [42]. In the case of heat transfer in air, the enhancement of free convection (cooling) was studied [29,31,41]. The authors of these works did not provide numerical values of the obtained enhancement of heat exchange. However, attention was paid to the importance of the relative location of the source of ultrasound to the source of heat [29]. The same problem of the effect of ultrasound transducer placement on heat transfer in liquids was analysed in [28,36]. It was stated that the placement of the ultrasound source plays an important role in the enhancement of heat transfer.
The aim of this work is to study the influence of ultrasound on both the convective heat transfer as well as the ultrasound absorption (US thermal effect) during convective heating of material in a dryer.

2. Materials and Methods

The aim of the presented work is to examine only the thermal effects. Mass transfer is not studied. That is why all tested samples are made of carbon steel (density ρ = 7820 kg/m3, specific heat c = 473.3 J/kg·K, and thermal conductivity λ = 42.9 W/m·K). Four samples were used: a small cylinder, a cylinder, a cube, and a cuboid (Figure 1). Sample dimensions are given in Table 1. In order to measure the temperature, holes with a diameter of 2.5 mm to a depth of 10 mm were drilled into the geometric centre of the samples. During the test, the measuring probe of the temperature recorder was placed in these holes.
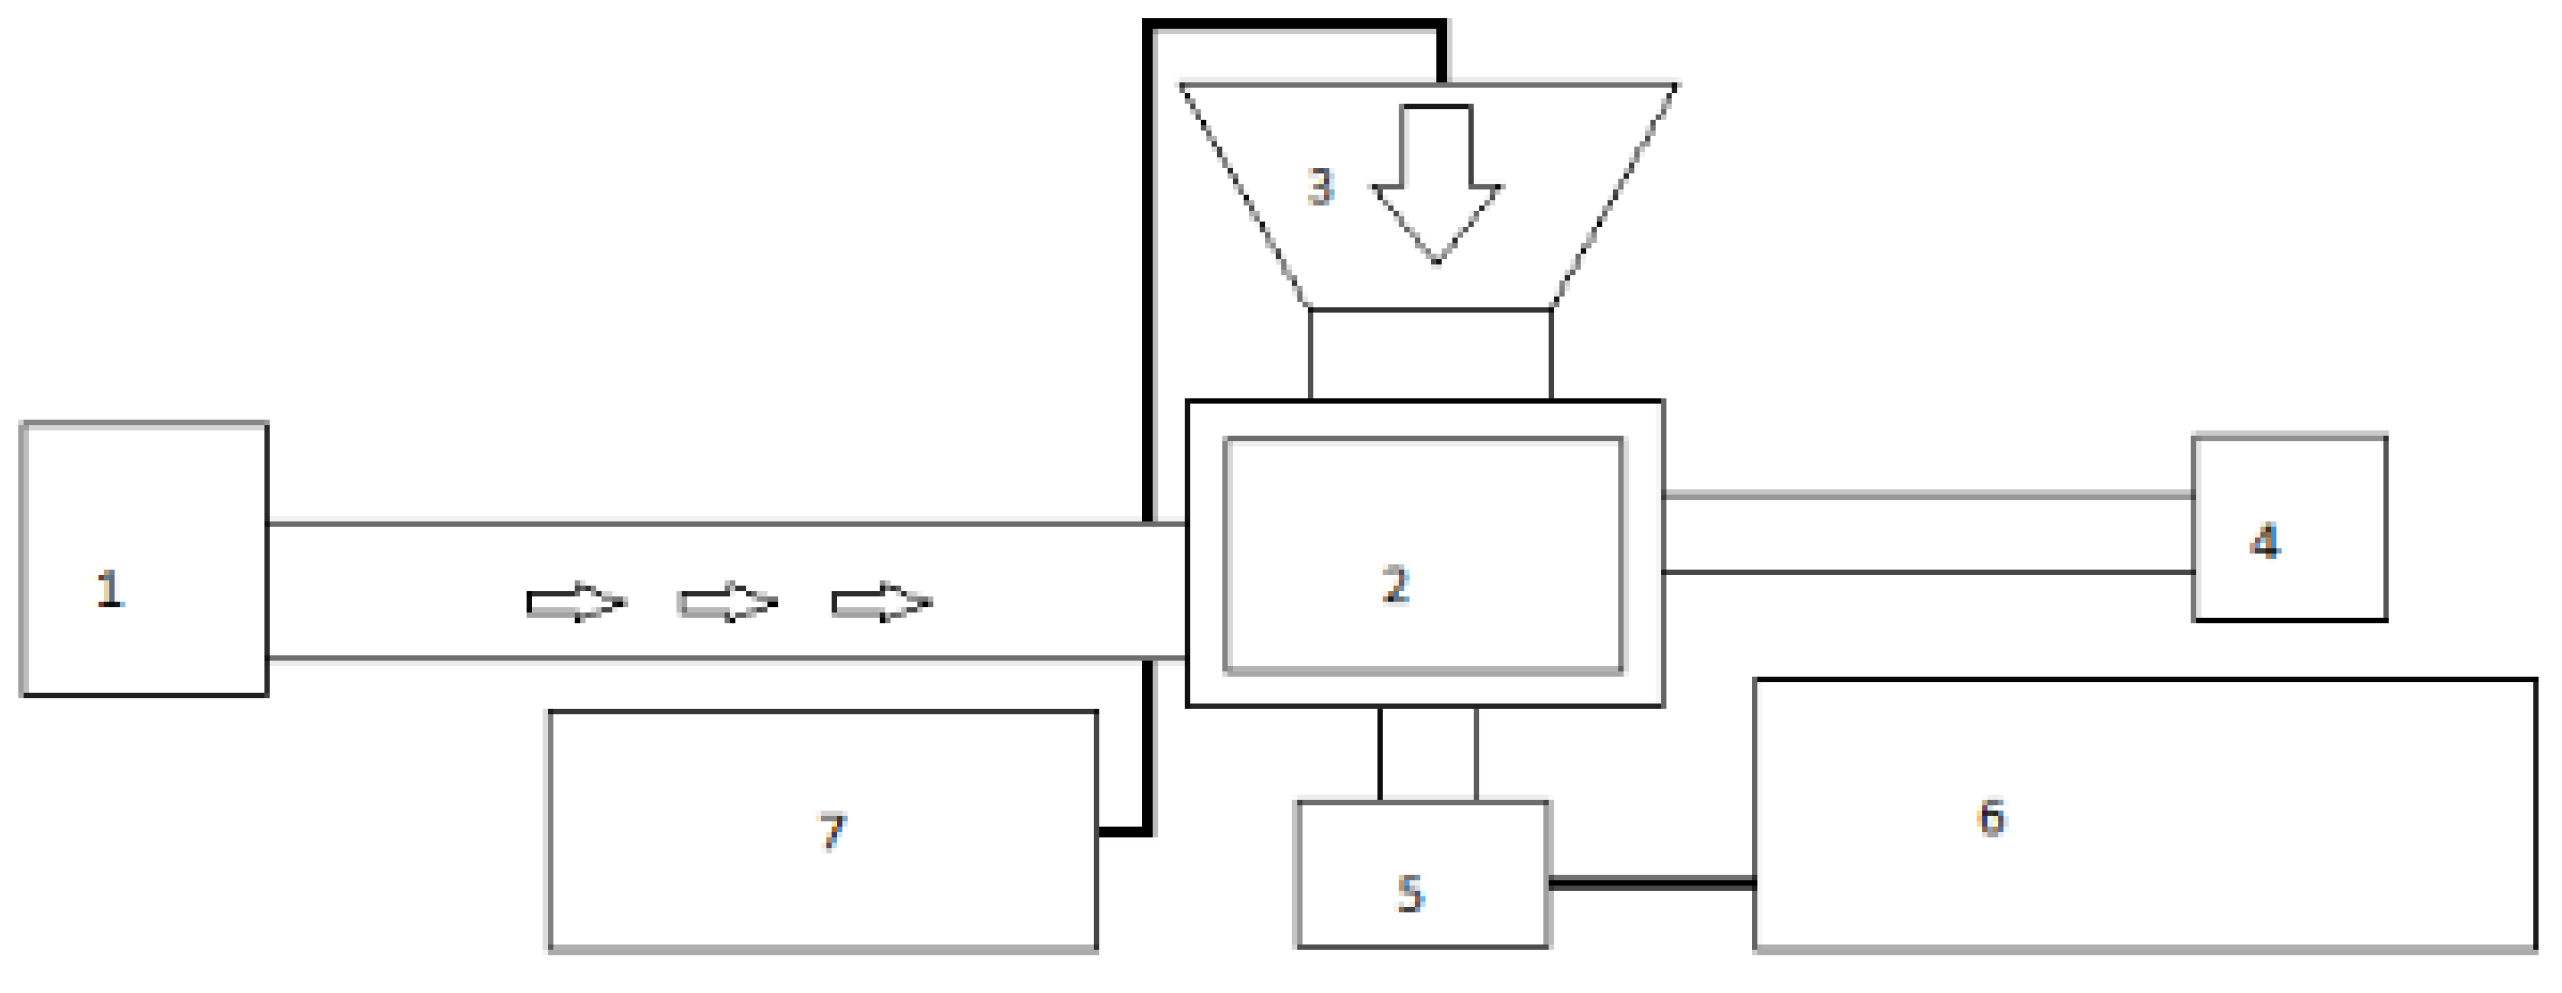
The samples were heated convectively inside a hybrid dryer (Figure 2) equipped with the Airborne Ultrasound System—AUS (Pusonics, Madrid, Spain), which allows generation of a low-frequency (26 kHz), high-power ultrasound (maximal power 200 W). The AUS works with a focalized acoustic field, which means that the intensity of the waves converges with increasing distance from the transducer, and at about 420 mm from the radiator it attains its maximum at 160–170 dB. The distance between the emitter and the sample was fixed at 415 mm to ensure that the sample stayed within the focusing area during the drying process.
For each sample, eight measurement series were made. The measurements were performed for two different air temperatures and four ultrasound powers. The process parameters are shown in Table 2. The temperature and flow velocity of the air were measured continuously during the experiment with the HD26371TC1.5 transmitter (DeltaOHM, Caselle di Selvazzano, Italy). According to the device spec sheet, the accuracy for velocity is ±0.1 + 3% and for temperature 0.3 °C. Experimental conditions ensured a small Biot number regime of heat transfer (the conduction resistance is negligible).
During the experiments, the temperature inside the test samples was measured every 30 s, with the use of a type-K thermocouple and recorded with a CENTER 309 datalogger (New Taipei City, Taiwan) with an accuracy of ±1 °C + 0.3%. Each experiment was conducted until three equal temperature readings were obtained.
Obtained experimental data were processed with the use of OriginPro 2021b (OriginLab Corporation, Northampton, MA, USA). Data presented are mean ± standard deviation. Additionally, a one-way ANOVA and Tukey posthoc mean comparison were performed. Statistically significant differences at the level of p ≤ 0.05 are marked with different letters. All calculations were performed using Statistica ver. 12 software produced by StatSoft (StatSoft, Tulsa, OK, USA).

3. Mathematical Model

A simple energy balance shows that energy accumulation in sample dU is equal to delivered heat dQ:
d U = d Q
If the sample mass m and its heat capacity c are constant and the Biot number is small, then inner energy U is the linear function of internal temperature T:
d U = m c d T = ρ c V d T
where ρ is the sample’s density and V is its volume. Heat transfer to the sample consists of two parts:
d Q = [ h A ( T a T ) + Q ˙ a b s ] d t
convective heat flux proportional to the difference of surrounding air temperature Ta and the sample temperature T, and ultrasound absorption Q ˙ a b s . Based on irreversible thermodynamics, Kowalski [21] introduced the volumetric heat absorption term in the form:
Q ˙ a b s = a u η u P u
where au is the absorption coefficient of ultrasonic energy, ηu is the working efficiency of the ultrasonic transducer, and Pu is the ultrasound power per unit volume, dependent on bed height. If the absorption coefficient is constant and the bed height is not optimal, then the thermal effect is also constant [15,16,17,19]. In Equation (4), h is the heat transfer coefficient and A is the sample surface. Rearranging of Equations (1)–(3) gives:
d T d t = h A ρ c V ( T a T + Q ˙ a b s h A ) = h A ρ c V ( T f T )
where
T f = T a + Q ˙ a b s h A
is the final temperature of the heated sample. The solution of Equation (5) has a form:
ln ϑ = ln T T f T 0 T f = h A ρ c V t = a t
where T0 is initial temperature, ϑ is dimensionless temperature, and a is the slope of the line. The knowledge of the slope allows the heat transfer coefficient h to be calculated:
h = ρ c V a A
and then, based on Equation (5), the ultrasound absorption Q ˙ a b s can be calculated:
Q ˙ a b s = h A ( T f T a )
Equation (9) is the energy balance at the end of the process. It means that all the energy absorbed by the sample is transferred by convection to the surrounding air (thermodynamic equilibrium).

4. Results and Discussion

Exemplary results of the temperature evolution of the cubic sample are presented in Figure 3 (applied US power: 0, 50, 100, 200 W). The results confirmed both the acceleration of heat transfer and US energy absorption. The enhancement of heat transfer results in an increase of the curve’s slope and the energy absorption causes an increase in final sample temperature.
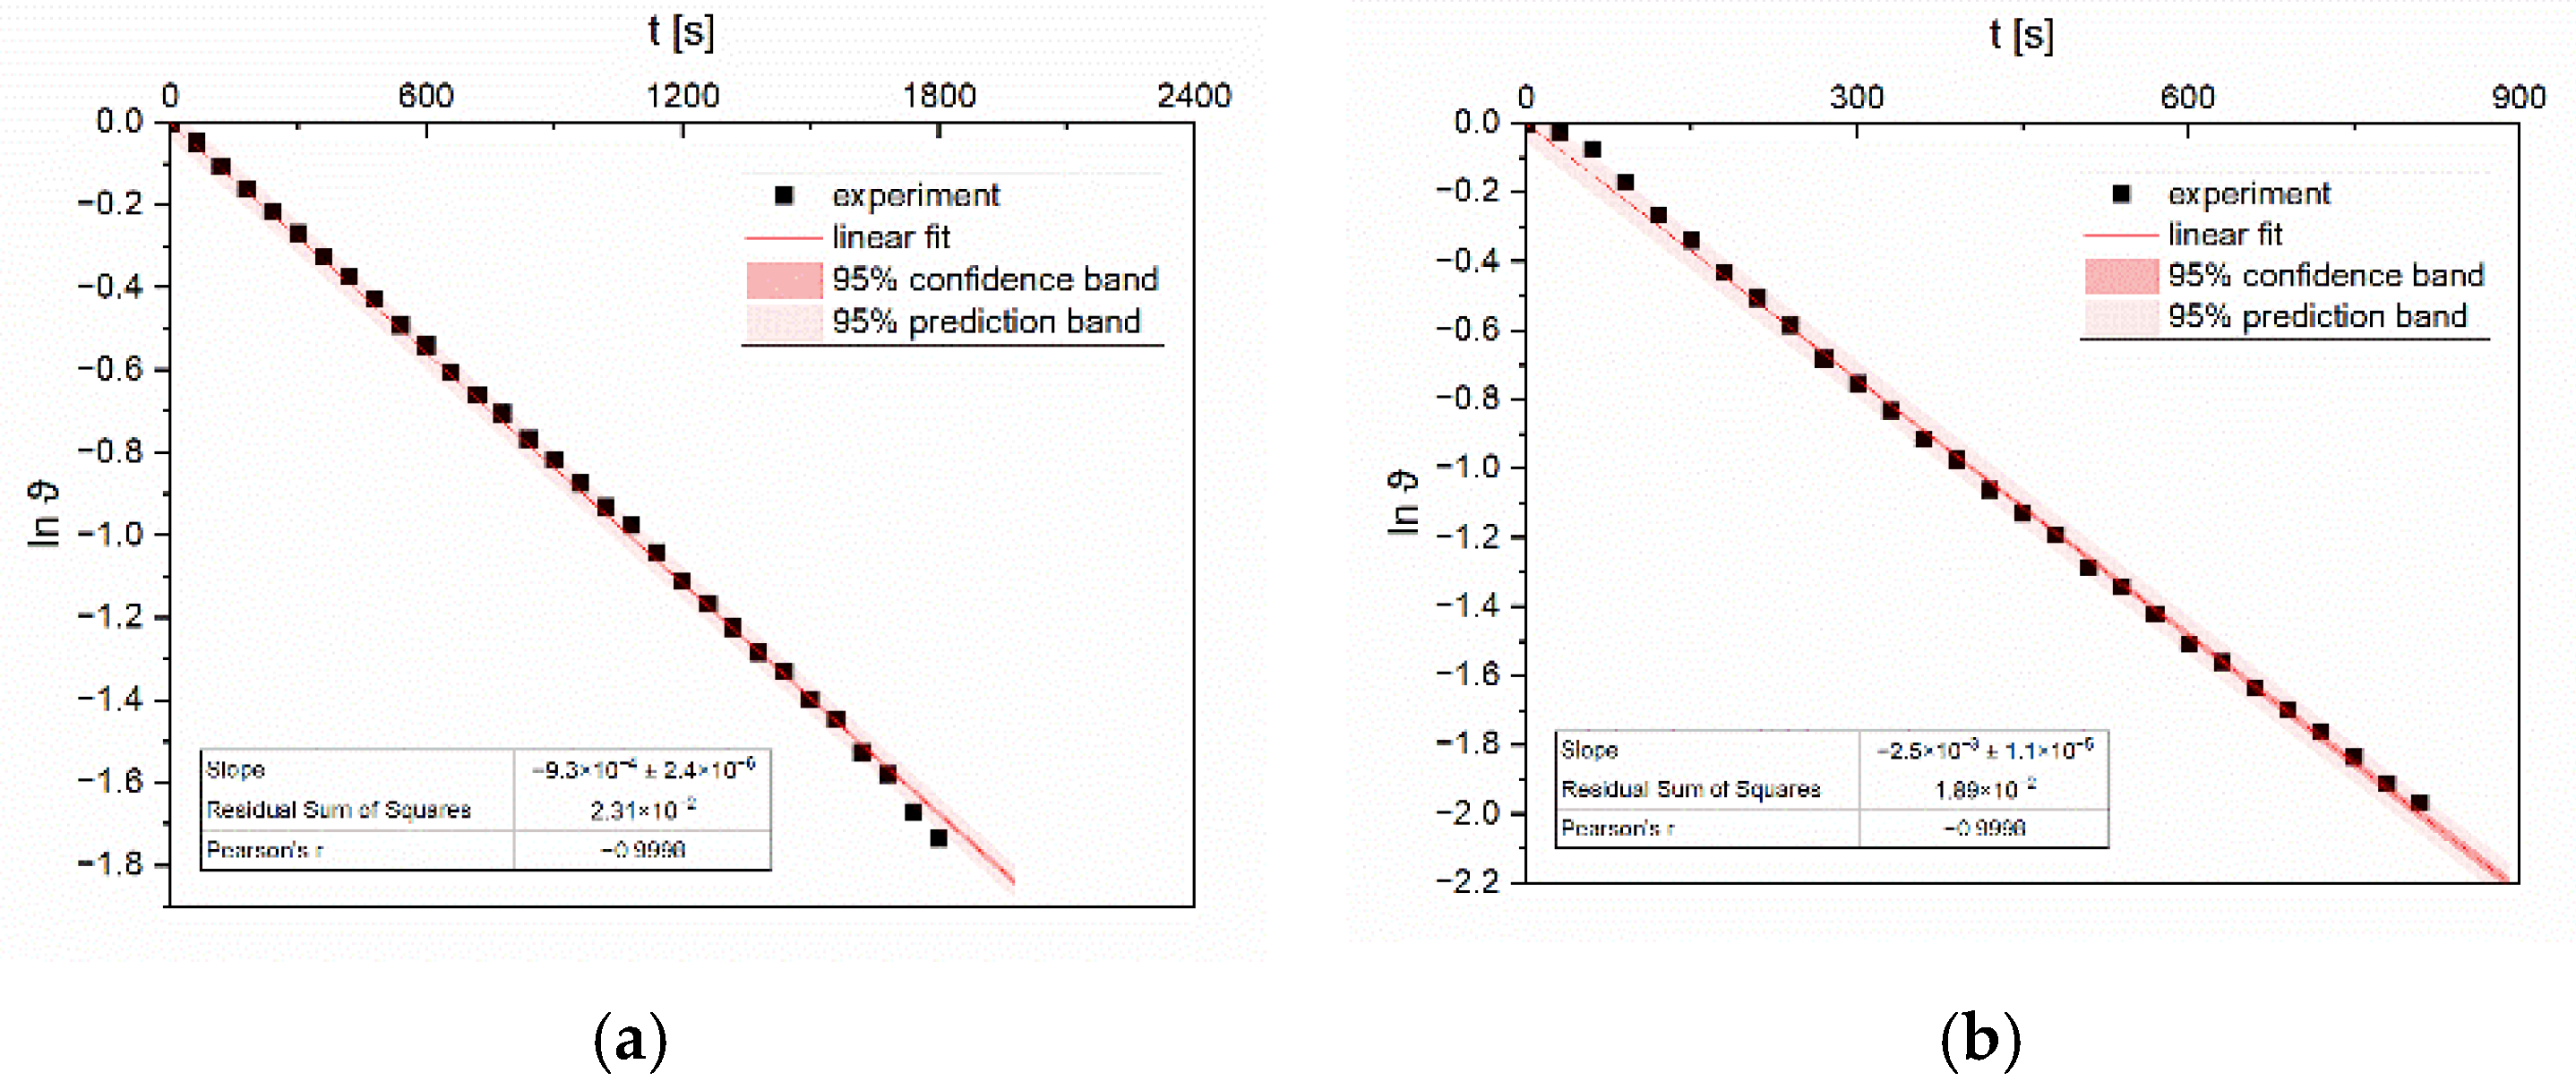
On the base of temperature evolution curves, the final temperature Tf was established and then the time evolution of the logarithm of dimensionless temperature ϑ was calculated (exemplary results are shown in Figure 4).
Next, the slopes a of all lines were established and both the heat transfer coefficient h (Equation (8)) and the ultrasound absorption Q ˙ a b s (Equation (9)) were calculated. The results are presented in Table 3 and Table 4.
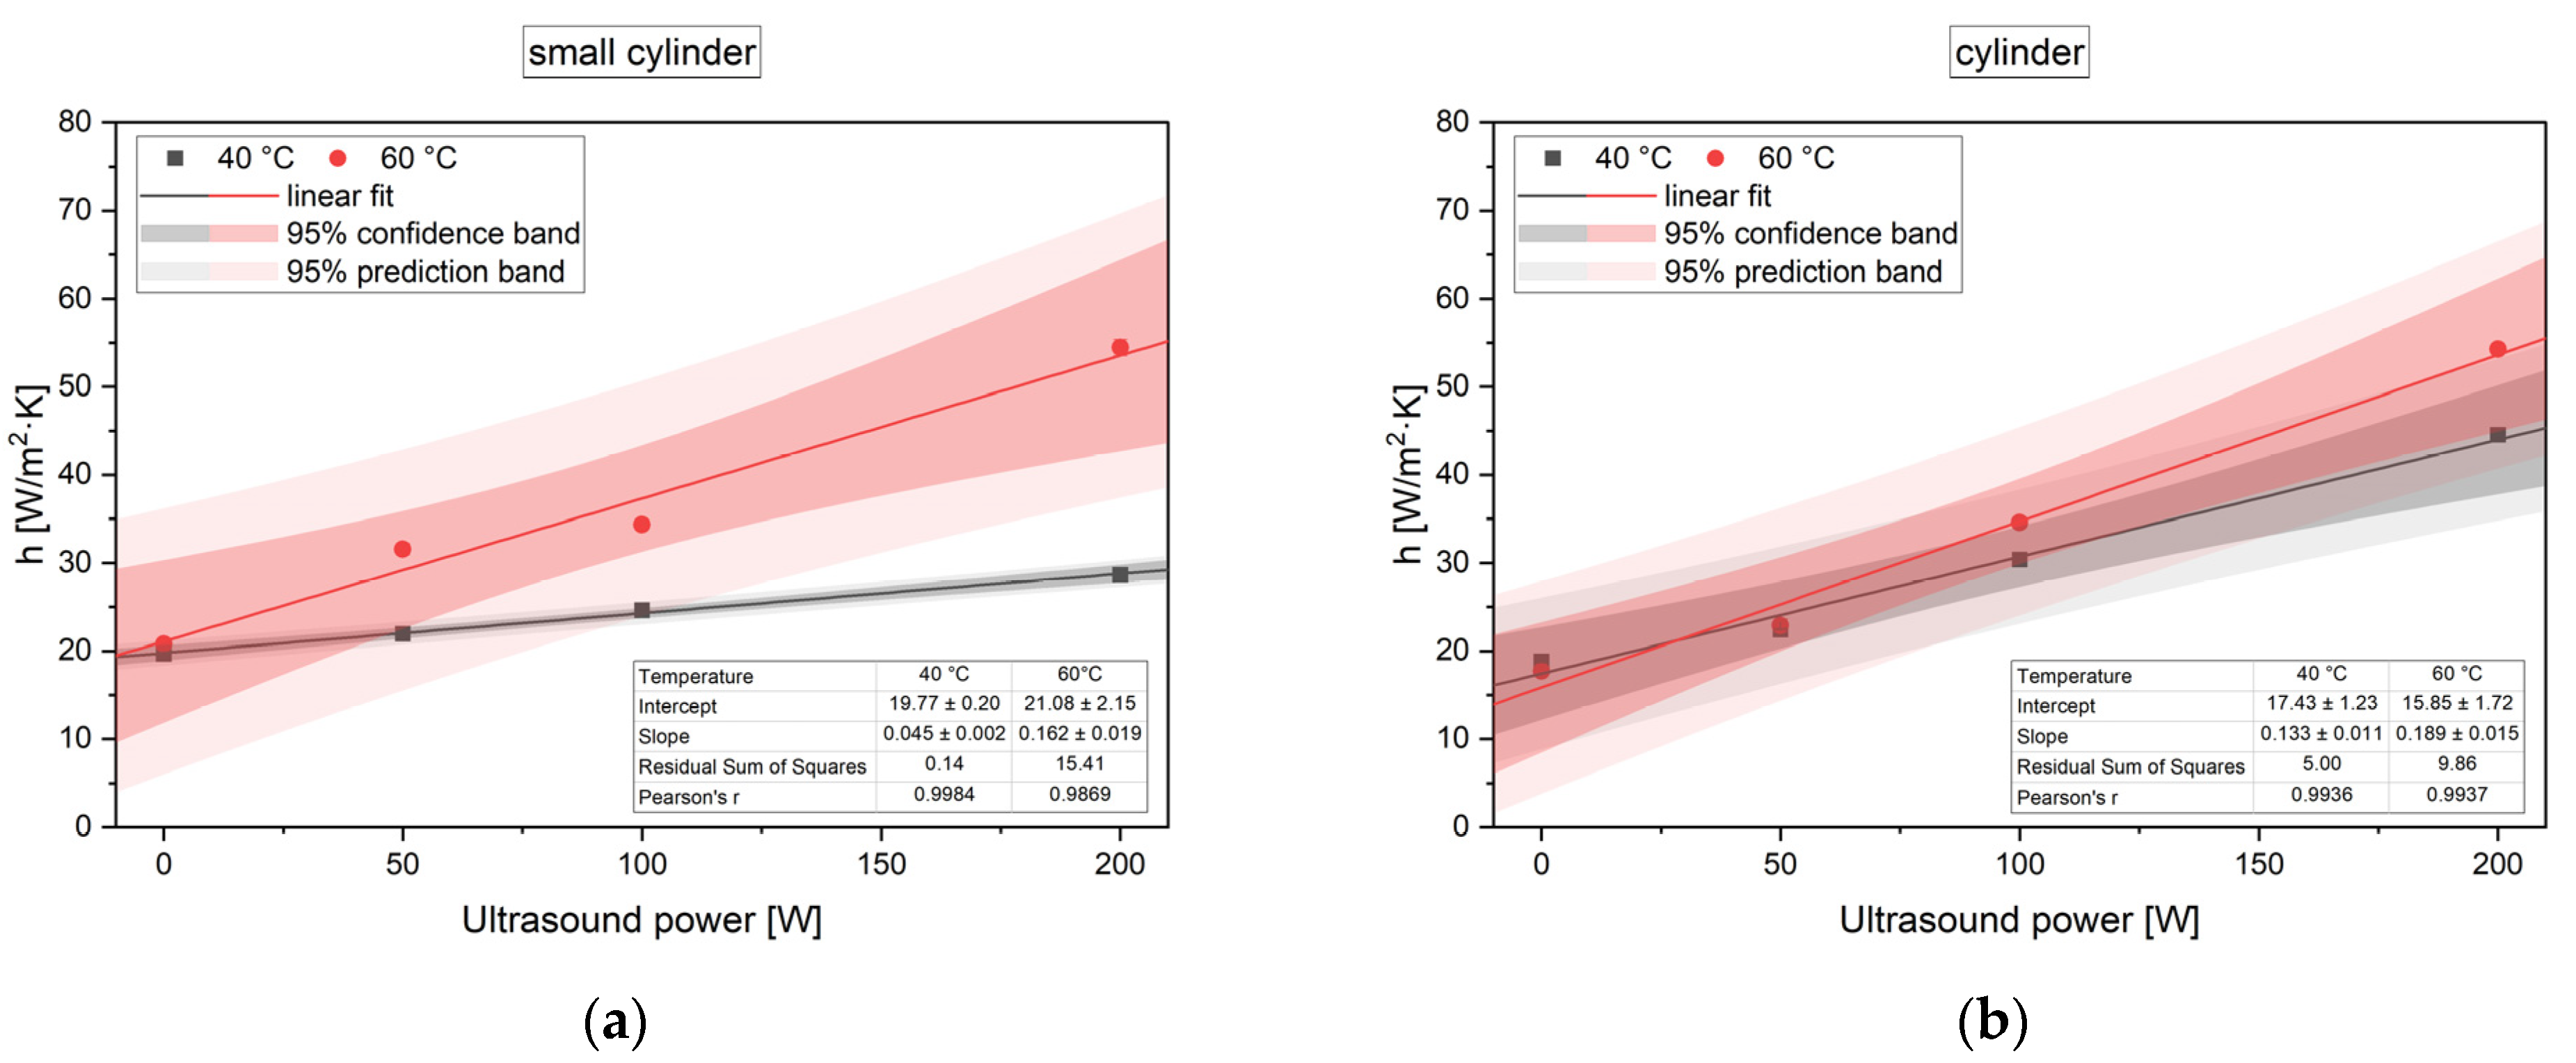
Dependencies of the heat transfer coefficient h on the applied ultrasound power are shown in Figure 5.
The results show that, for all the samples, an enhancement of heat transfer due to ultrasound was obtained. This enhancement is a linear function of the applied ultrasound power. The heat transfer enhancement ratio η is defined as [30,39]:
η = h U S h 0 h 0 · 100 %
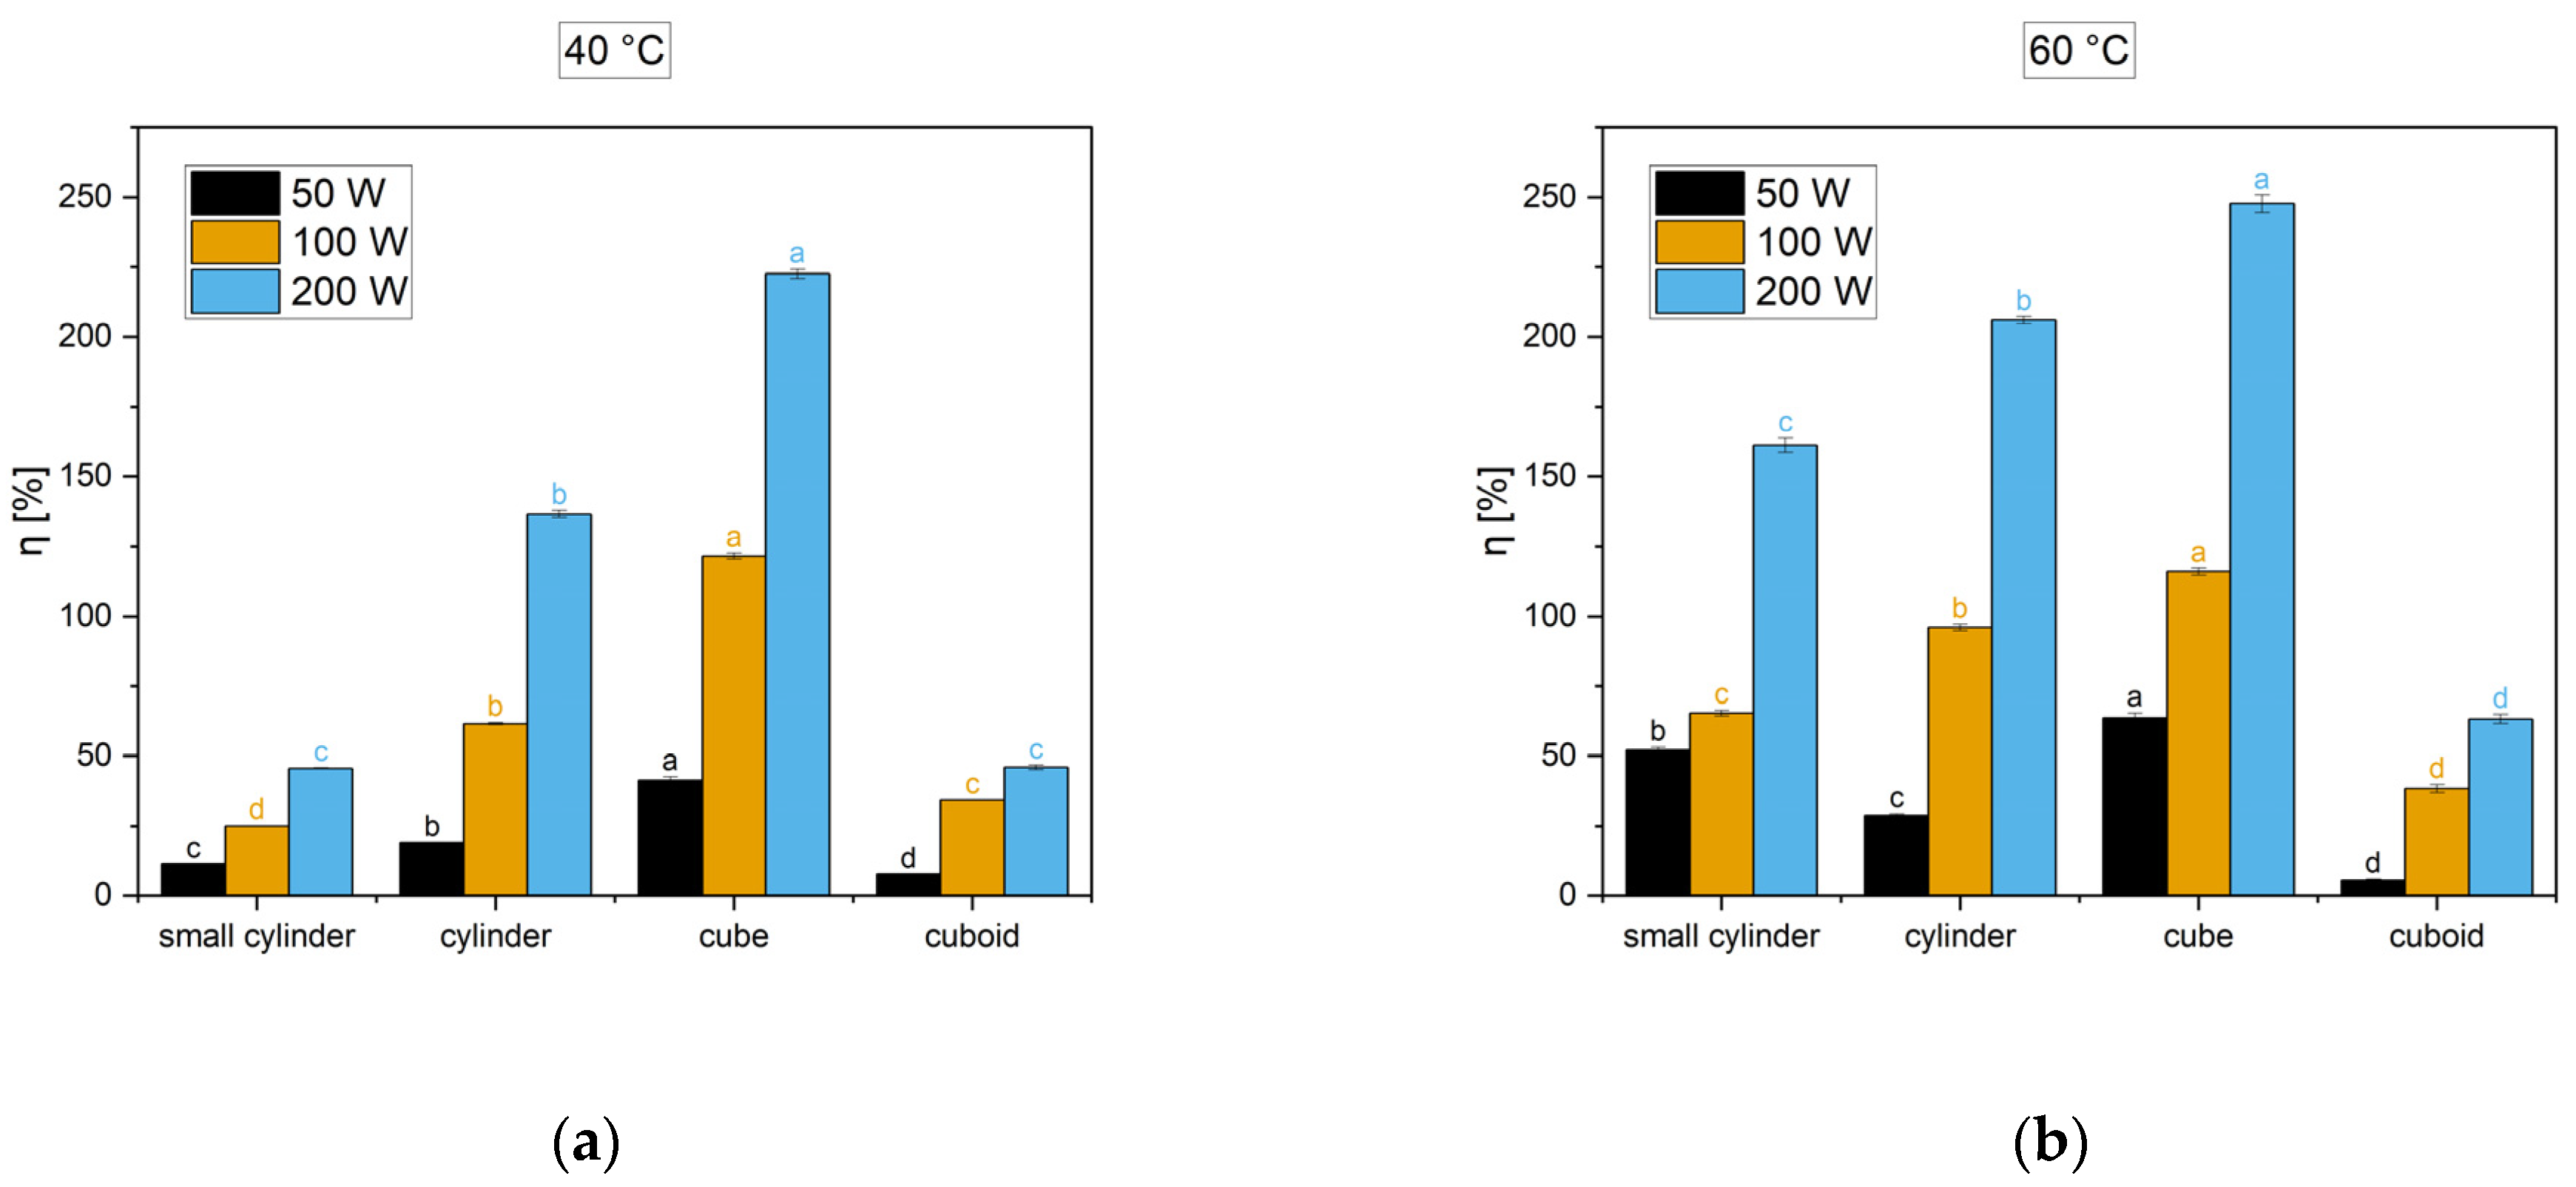
where hUS represents the heat transfer coefficient with ultrasound, while h0 represents the heat transfer coefficient without ultrasound. The obtained heat transfer enhancement ratios η are presented in Figure 6.
The results confirmed that the greater the power of the ultrasound, the greater the improvement in heat transfer. In the investigated range of applied ultrasound power, the heat transfer coefficient is a linear function of the applied power (see Figure 5). It can be observed that the heat exchange enhancement strongly depends on the size of the samples. Due to the use of ultrasound, the convective heat exchange coefficient increased from 45% to almost 250%. There are few results in the literature describing the increase in the heat transfer coefficient due to the use of ultrasound. Aversa et al. [18] found a 12–44% increase in this coefficient and Kroehnke et al. [43] obtained a 34% increase, both in the case of carrot drying, while García-Pérez et al. [9] obtained a 65% increase in grape stalk drying. Heat transfer enhancement for both small (small cylinder) and large (cuboid) samples was smaller than the improvement in heat transfer for medium samples (cylinder and cube). In the latter case, an increase in growth of almost 250% of the heat transfer coefficients was achieved. The obtained results show that, in the studied temperature range, a higher air temperature is associated with a greater heat exchange improvement. This is contrary to the results presented by Garcia-Peres et al. [9] and Rodrigues et al. [14], who ascertained that an increase in temperature causes a decrease in the enhancement of heat transfer. This inconsistency may result from the difference in the construction of the dryers, particularly in the way the ultrasound is brought.
The enhancement of heat transfer can be caused by various mechanisms. For instance, pressure pulsations could increase the turbulence inside the boundary layer and reduce the layer thickness. It is worth noticing that the heat transfer through a boundary layer is done by the slowest mechanism, i.e., conduction. If the thickness of the boundary layer is reduced, the heat transfer proceeds more effectively. Moreover, alternating compression and rarefaction could improve heat transfer through the boundary layer. Fluctuations of pressure close to the material surface could also promote circulation flows of air and enhance the heat transfer. A number of additional mechanisms may be considered, e.g., acoustic streaming.
The thermal effect was also observed in our experiments. The maximum temperature increase due to absorption of the ultrasound energy by the samples was in the range of 5–8 degrees. These results confirmed a slight absorption of the ultrasound energy. The value of absorbed energy did not exceed one percent of the energy supplied (see Table 3 and Table 4).
Finally, the Biot number values were calculated according to the equation:
Bi = h V λ A
These values ranged from 0.0015 to 0.0066. This means that assuming a small Biot number is correct.

5. Conclusions

The results showed a great enhancement of heat transfer due to the application of ultrasound. The use of ultrasound resulted in the increase of the heat transfer coefficient h from 45% to over 200%. The heat transfer coefficient highly depends on the shape of the examined samples. The increase in air temperature causes a small increase in heat transfer enhancement. The obtained heat transfer enhancement is a linear function of the applied US power. The US energy absorption existed, but it was slight and the thermal effect of this absorption was small. All the obtained results suggest that the application of ultrasound plays an important role during drying, and both heat and mass transfer in a particular dryer should be studied with special attention.
Due to the lack of detailed studies on the mechanisms leading to the improvement of convective heat exchange during forced convection between flowing gas and a solid, it is necessary to pay attention to these issues in future research.

Author Contributions

Conceptualization, G.M.; methodology, G.M.; formal analysis, G.M. and D.M.; investigation, G.M.; data curation, D.M.; writing—original draft preparation, G.M.; writing—review and editing, G.M. and D.M.; visualization, G.M. and D.M.; supervision, G.M.; All authors have read and agreed to the published version of the manuscript.

Funding

This research was funded by Ministry of Education and Science in Poland.

Institutional Review Board Statement

Not applicable.

Informed Consent Statement

Not applicable.

Data Availability Statement

Not applicable.

Acknowledgments

This work was supported by the Ministry of Education and Science in Poland.

Conflicts of Interest

The authors declare no conflict of interest.

References

  1. Kudra, T.; Mujumdar, A.S. Special Drying Techniques and Novel Dryers. In Handbook of Industrial Drying, 4th ed.; Mujumdar, A.S., Ed.; CRC Press: Boca Raton, FL, USA; London, UK; New York, NY, USA, 2015; pp. 433–489. [Google Scholar]
  2. Kudra, T.; Mujumdar, A.S. Advanced Drying Technologies, 2nd ed.; Taylor & Francis Group: Abingdon, UK; CRC Press: Boca Raton, FL, USA, 2009. [Google Scholar]
  3. Siucińska, K.; Konopacka, D. Application of Ultrasound to Modify and Improve Dried Fruit and Vegetable Tissue—A Review. Dry. Technol. 2014, 32, 1360–1368. [Google Scholar] [CrossRef]
  4. Musielak, G.; Mierzwa, D.; Kroehnke, J. Food Drying Enhancement by Ultrasound. Trends Food Sci. Technol. 2016, 56, 126–141. [Google Scholar] [CrossRef]
  5. Muralidhara, H.S.; Ensminger, A.; Putnam, A. Acoustic Dewatering and Drying (Low and High Frequency): State of the Art Review. Dry Technol. 1985, 3, 529–566. [Google Scholar] [CrossRef]
  6. Cárcel, J.A.; García-Pérez, J.V.; Riera, E.; Mulet, A. Influence of High Intensity Ultrasound on Drying Kinetics of Persimmon. Dry Technol. 2007, 25, 185–193. [Google Scholar] [CrossRef]
  7. Gallego-Juárez, J.A.; Riera, E.; de la Fuente Blanco, S.; Rodríguez-Corral, G.; Acosta- Aparicio, V.M.; Blanco, A. Application of High-Power Ultrasound for Dehydration of Vegetables: Processes and Devices. Dry Technol. 2007, 25, 1893–2007. [Google Scholar] [CrossRef]
  8. García-Pérez, J.V.; Cárcel, J.A.; Riera, E.; Rosselló, C.; Mulet, A. Intensification of Low-Temperature Drying by Using Ultrasound. Dry Technol. 2012, 30, 1199–1208. [Google Scholar] [CrossRef] [Green Version]
  9. García-Pérez, J.V.; Cárcel, J.A.; Simal, S.; García-Alvarado, M.A.; Mulet, A. Ultrasonic Intensification of Grape Stalk Convective Drying: Kinetic and Energy Efficiency. Dry Technol. 2013, 31, 942–950. [Google Scholar] [CrossRef]
  10. Sabarez, H.T.; Gallego-Juárez, J.A.; Riera, E. Ultrasonic-Assisted Convective Drying of Apple Slices. Dry Technol. 2012, 30, 989–997. [Google Scholar] [CrossRef]
  11. Cárcel, J.A.; García-Pérez, J.V.; Riera, E.; Mulet, A. Improvement of Convective Drying of Carrot by Applying Power Ultrasound. Influence of Mass Load Density. Dry Technol. 2011, 29, 174–182. [Google Scholar] [CrossRef]
  12. Ortuño, C.; Pérez-Munuera, I.; Puig, A.; Riera, E.; García-Pérez, J.V. Influence of Power Ultrasound Application on Mass Transport and Microstructure of Orange Peel during Hot Air Drying. Phys. Procedia 2010, 3, 153–159. [Google Scholar] [CrossRef] [Green Version]
  13. Puig, A.; Pérez- Munuera, I.; Cárcel, J.A.; Hernando, I.; García-Pérez, J.V. Moisture Loss Kinetics and Microstructural Changes in Eggplant (Solanum melongena L.) during Conventional and Ultrasonically Assisted Convective Drying. Food Bioprod. Process. 2012, 90, 624–632. [Google Scholar] [CrossRef]
  14. Rodríguez, J.; Mulet, A.; Bon, J. Influence of High-Intensity Ultrasound on Drying Kinetics in Fixed Beds of High Porosity. J. Food Eng. 2014, 127, 93–102. [Google Scholar] [CrossRef]
  15. Kowalski, S.J.; Pawłowski, A.; Szadzińska, J.; Łechtańska, J.; Stasiak, M. High Power Airborne Ultrasound Assist in Combined Drying of Raspberries. Innov. Food Sci. Emerg. Technol. 2016, 34, 225–233. [Google Scholar] [CrossRef]
  16. Szadzińska, J.; Kowalski, S.J.; Stasiak, M. Microwave and Ultrasound Enhancement of Convective Drying of Strawberries: Experimental and Modeling Efficiency. Int. J. Heat Mass Transf. 2016, 103, 1065–1074. [Google Scholar] [CrossRef]
  17. Szadzińska, J.; Łechtańska, J.; Kowalski, S.J.; Stasiak, M. The Effect of High Power Airborne Ultrasound and Microwaves on Convective Drying Effectiveness and Quality of Green Pepper. Ultrason. Sonochem. 2017, 34, 531–539. [Google Scholar] [CrossRef] [PubMed]
  18. Aversa, M.; Van der Voort, A.-J.; de Heij, W.; Tournois, B.; Curcio, S. An Experimental Analysis of Acoustic Drying of Carrots: Evaluation of Heat Transfer Coefficients in Different Drying Conditions. Dry. Technol. 2011, 29, 239–244. [Google Scholar] [CrossRef]
  19. Stasiak, M.; Musielak, G.; Mierzwa, D. Optimization Method for the Evaluation of Convective Heat and Mass Transfer Effective Coefficients and Energy Sources in Drying Process. Energies 2020, 13, 6577. [Google Scholar] [CrossRef]
  20. Bantle, M.; Hanssler, J. Ultrasonic Convective Drying Kinetics of Clipfish during the Initial Drying Period. Dry. Technol. 2013, 31, 1307–1316. [Google Scholar] [CrossRef]
  21. Kowalski, S.J. Ultrasound in Wet Materials Subjected to Drying: A Modeling Study. Int. J. Heat Mass Transf. 2015, 84, 998–1007. [Google Scholar] [CrossRef]
  22. Kowalski, S.J.; Mierzwa, D. US-Assisted Convective Drying of Biological Materials. Dry Technol. 2015, 33, 1601–1613. [Google Scholar] [CrossRef]
  23. García-Pérez, J.V.; Cárcel, J.A.; Riera, E.; Mulet, A. Influence of the Applied Acoustic Energy on the Drying of Carrots and Lemon Peel. Dry Technol. 2009, 27, 281–287. [Google Scholar] [CrossRef]
  24. García-Pérez, J.V.; Ozuna, C.; Ortuño, C.; Cárcel, J.A.; Mulet, A. Modeling Ultrasonically Assisted Convective Drying of Eggplant. Dry Technol. 2011, 29, 1499–1509. [Google Scholar] [CrossRef]
  25. Clemente, G.; Sanjuán, N.; Cárcel, J.A.; Mulet, A. Influence of Temperature, Air Velocity, and Ultrasound Application on Drying Kinetics of Grape Seeds. Dry Technol. 2014, 32, 68–76. [Google Scholar] [CrossRef]
  26. Fernandes, F.A.N.; Rodrigues, S.; Cárcel, J.A.; García-Pérez, J.V. Ultrasound-Assisted Air Drying of Apple (Malus domestica L.) and Its Effects on the Vitamin of the Dried Product. Food Bioprocess Technol. 2015, 8, 1503–1511. [Google Scholar] [CrossRef]
  27. Wong, S.W.; Chon, W.Y. Effects of Ultrasonic Vibrations on Heat Transfer to Liquids by Natural Convection and by Boiling. AIChE 1969, 15, 281–288. [Google Scholar] [CrossRef] [Green Version]
  28. Iida, Y.; Tsutsui, K. Effect of Ultrasonic Waves on Natural Convection, Nucleate Boiling, and Film Boiling Heat Transfer to a Saturated Liquid. Exp. Therm. Fluid Sci. 1992, 5, 108–115. [Google Scholar] [CrossRef]
  29. Loh, B.-G.; Lee, D.-R. Heat Transfer Characteristics of Acoustic Streaming by Longitudinal Ultrasonic Vibration. J. Thermophys. Heat Transf. 2004, 18, 94–99. [Google Scholar] [CrossRef]
  30. Kim, H.-Y.; Kim, Y.G.; Kang, B.H. Enhancement of natural convection and pool boiling heat transfer via ultrasonic vibration. Int. J. Heat Mass Transf. 2004, 47, 2831–2840. [Google Scholar] [CrossRef]
  31. Hyun, S.; Lee, D.-R.; Loh, B.-G. Investigation of Convective Heat Transfer Augmentation Using Acoustic Streaming Generated by Ultrasonic Vibrations. Int. J. Heat Mass Transf. 2005, 48, 703–718. [Google Scholar] [CrossRef]
  32. Monnot, A.; Gondrexon, A.P.; Boldo, N.; Bontemps, N. Enhancement of Cooling Rate by Means of High Frequency Ultrasound. Heat Transf. Eng. 2007, 28, 3–8. [Google Scholar] [CrossRef]
  33. Dhanalakshmi, N.P.; Nagarajan, R.; Sivagaminathan, N.; Prasad, B.V.S.S.S. Acoustic Enhancement of Heat Transfer in Furnace Tubes. Chem. Eng. Process. 2012, 59, 36–42. [Google Scholar] [CrossRef]
  34. Kiani, H.; Sun, D.-W.; Zhang, Z. The Effect of Ultrasound Irradiation on the Convective Heat Transfer Rate during Immersion Cooling of a Stationary Sphere. Ultrason. Sonochem. 2012, 19, 1238–1245. [Google Scholar] [CrossRef] [PubMed]
  35. Baffigi, F.; Bartoli, C. Influence of the Ultrasound on the Heat Transfer in Single Phase Free Convection and in Saturated Pool Boiling. Exp. Therm. Fluid Sci. 2012, 36, 12–21. [Google Scholar] [CrossRef]
  36. Rahimi, M.; Dehbani, M.; Abolhasani, M. Experimental Study on the Effects of Acoustic Streaming of High Frequency Ultrasonic Waves on Convective Heat Transfer: Effects of Transducer Position and Wave Interference. Int. Commun. Heat Mass Transf. 2012, 39, 720–725. [Google Scholar] [CrossRef]
  37. Tajik, B.; Abbassi, A.; Saffar-Avval, M.; Abardeh, R.H. Heat Transfer Enhancement by Acoustic Streaming in a Closed Cylindrical Enclosure Filled with Water. Int. J. Heat Mass Transf. 2013, 60, 230–235. [Google Scholar] [CrossRef]
  38. Dehbani, M.; Rahimi, M.; Abolhasani, M.; Maghsoodi, A.; Afshar, P.G.; Dodmantipi, A.R.; Alsairafi, A.A. CFD Modeling of Convection Heat Transfer Using 1.7 MHz and 24 kHz Ultrasonic Waves: A Comparative Study. Heat Mass Transf. 2014, 50, 1319–1333. [Google Scholar] [CrossRef]
  39. Li, B.; Han, X.; Wan, Z.; Wang, X.; Tang, Y. Influence of Ultrasound on Heat Transfer of Copper Tubes with Different Surface Characteristics in Sub-Cooled Boiling. Appl. Therm. Eng. 2016, 92, 93–103. [Google Scholar] [CrossRef]
  40. Zheng, M.; Li, B.; Wan, Z.; Wu, B.; Tang, Y.; Li, J. Ultrasonic heat transfer enhancement on different structural tubes in LiBr solution. Appl. Therm. Eng. 2016, 106, 625–633. [Google Scholar] [CrossRef]
  41. Talebi, M.; Setareh, M.; Saffar-Avval, M.; Abardeh, R.H. Numerical Investigation of Natural Convection Heat Transfer in a Cylindrical Enclosure Due to Ultrasonic Vibrations. Ultrasonics 2017, 76, 52–62. [Google Scholar] [CrossRef]
  42. Cheeke, J.D.M. Fundamentals and Applications of Ultrasonic Waves, 2nd ed.; Taylor & Francis Group: Abingdon, UK; CRC Press: Boca Raton, FL, USA, 2012. [Google Scholar]
  43. Kroehnke, J.; Szadzińska, J.; Stasiak, M.; Radziejewska-Kubzdela, E.; Biegańska-Marecik, R.; Musielak, G. Ultrasound- and Microwave-Assisted Convective Drying of Carrots—Process Kinetics and Product’s Quality Analysis. Ultrason. Sonochem. 2018, 48, 249–258. [Google Scholar] [CrossRef]
Figure 1. Used samples.
Applsci 11 08846 g001
Figure 2. The scheme of the hybrid dryer: (1) air heater and fan, (2) dryer chamber, (3) ultrasound transducer, (4) microwave generator, (5) balance, (6) control system (PC), and (7) ultrasound generator.
Applsci 11 08846 g002
Figure 3. Temperature evolution of cubic sample. Applied US power: 0, 50, 100, 200 W. Air temperature: (a) 40 °C; (b) 60 °C.
Applsci 11 08846 g003
Figure 4. The logarithm of dimensionless temperature ϑ versus time—exemplary results for cylindrical sample, air temperature 40 °C, US power: (a) 0 W (b) 200 W.
Applsci 11 08846 g004
Figure 5. Heat transfer coefficients h versus applied ultrasound power P: (a) small cylindrical sample; (b) cylindrical sample; (c) cube; and (d) cuboid.
Applsci 11 08846 g005aApplsci 11 08846 g005b
Figure 6. Heat transfer enhancement ratios η (%). Air temperature: (a) 40 °C; (b) 60 °C. Presented data are mean ± standard deviation. Different letters above the bar of the same color indicate statistically significant difference at p ≤ 0.05 in accordance to Tukey posthoc mean comparison.
Applsci 11 08846 g006
Table 1. Sample dimensions.
SampleDiameter (mm)Height (mm)SampleLength (mm)Width (mm)Height (mm)
Small cylinder2020Cube303030
Cylinder3030Cuboid1202030
Table 2. Processes parameters.
ParameterSeries ISeries II
Air velocity (m/s)0.40 ± 0.11
Air temperature (°C)40 ± 0.360 ± 0.3
Ultrasound power P (W)00
5050
100100
200200
Table 3. Results of heating in temperature 40 °C.
Applied US Power0 W50 W
h(W/K·m2) Q ˙ a b s   ( W ) h(W/K·m2) Q ˙ a b s   ( W )
Small cylinder19.68 ± 0.10-21.93 ± 0.080.14 ± 0.09
Cylinder18.81 ± 0.17-22.43 ± 0.100.07 ± 0.04
Cube17.72 ± 0.09-24.97 ± 0.680.17 ± 0.03
Cuboid14.35 ± 0.08-15.43 ± 0.080.06 ± 0.02
Applied US Power100 W200 W
h(W/K·m2) Q ˙ a b s (W)h(W/K·m2) Q ˙ a b s (W)
Small cylinder24.60 ± 0.150.26 ± 0.1228.65 ± 0.140.46 ± 0.02
Cylinder30.40 ± 0.160.46 ± 0.0644.55 ± 0.340.96 ± 0.10
Cube39.21 ± 0.250.75 ± 0.1657.12 ± 0.461.85 ± 0.09
Cuboid19.26 ± 0.040.75 ± 0.0220.92 ± 0.421.67 ± 0.05
Table 4. Results of heating in temperature 60 °C.
Applied US Power0 W50 W
h(W/K·m2) Q ˙ a b s   ( W ) h(W/K·m2) Q ˙ a b s   ( W )
Small cylinder20.78 ± 0.24-31.58 ± 0.630.061 ± 0.04
Cylinder17.73 ± 0.05-22.87 ± 0.720.039 ± 0.011
Cube16.17 ± 0.20-26.39 ± 0.650.037 ± 0.009
Cuboid10.68 ± 0.27-11.27 ± 0.580.16 ± 0.03
Applied US Power100 W200 W
h(W/K·m2) Q ˙ a b s (W)h(W/K·m2) Q ˙ a b s (W)
Small cylinder34.34 ± 0.530.11 ± 0.0554.44 ± 0.930.33 ± 0.09
Cylinder34.60 ± 0.550.05 ± 0.0154.28 ± 0.120.78 ± 0.17
Cube34.96 ± 0.750.08 ± 0.0156.32 ± 0.631.12 ± 0.25
Cuboid14.71 ± 0.510.23 ± 0.0317.61 ± 0.550.92 ± 0.04
Publisher’s Note: MDPI stays neutral with regard to jurisdictional claims in published maps and institutional affiliations.