Article

Dropwise Condensation Mechanism on Smooth Hydrophilic Surfaces

by
Shahab Bayani Ahangar
1,
Kyung-Bon Lee
2,* and
Chang Kyoung Choi
1,*
1
Department of Mechanical Engineering-Engineering Mechanics, Michigan Technological University, Houghton, MI 49931, USA
2
Department of Biology Education, College of Education, Chonnam National University, Gwangju 61186, Korea
*
Authors to whom correspondence should be addressed.
Appl. Sci. 2021, 11(19), 9184; https://doi.org/10.3390/app11199184
Submission received: 25 August 2021 / Revised: 27 September 2021 / Accepted: 28 September 2021 / Published: 2 October 2021

Abstract

:

Featured Application

This work shows ultra-thin film measurements using surface plasmon resonance imaging (SPRi), which can help enable a better understanding of the mechanism of dropwise condensation.

Abstract

The objective of this work is to identify the mechanism of dropwise condensation on a smooth solid surface. We investigate the stable dropwise condensation that occurs at a droplet growth rate of 1 µm/s in diameter on a gold-coated glass surface. Additionally, we present our observations on unstable dropwise condensation, i.e., degradation of dropwise condensation of steam on a gold surface. Surface Plasmon Resonance Imaging (SPRi) is used to evaluate the existence and structure of thin films and occurrence of initial nuclei during condensation. SPRi approach used in this study has lateral resolutions of 4–10 µm, thickness resolutions of 0.1–1 nm, and temporal resolutions of 200–10,000 frames per second (FPS). Visualization of the onset of stable dropwise condensation suggests droplets form at heterogeneous nucleation sites and that no film greater than a monolayer exists on the surface before the formation of droplets. Observation of the unstable dropwise condensation of steam shows the existence of water films that are several nanometers thick between droplets. This work shows that neither the nucleation theory nor film rupture theory can individually explain the physics of dropwise condensation. Therefore, there is a need for a more comprehensive theory that can explain the mechanism of dropwise condensation.

1. Introduction

Dropwise condensation has the potential to improve efficiency and reduce maintenance costs of heat transfer systems. However, efforts to design and fabricate surfaces to sustain long-term dropwise condensation have not been successful [1,2]. The main reason for this lack of success is that the physics behind dropwise condensation is not fully understood [3]. Currently, there are two competing theories on the mechanism of dropwise condensation, specifically, the classical nucleation and film rupture theories [4]. Nucleation theory, first introduced by Tammann and Boehme in 1935 [5], claims that droplets nucleate heterogeneously on a surface. Then, the droplets grow and coalesce to make larger droplets. Heat transfer is dominant through the droplets (defined as the active area) and the area between the droplets is considered inactive. Umur and Griffith [6] experimentally showed that nucleation theory is the mechanism of dropwise condensation. They studied the static dropwise condensation of steam on a gold surface and showed that no film larger than a monolayer exists between droplets. Therefore, their finding supports that the area between droplets is not active in heat transfer. The majority of researchers support nucleation theory as the governing mechanism of dropwise condensation [7]. Numerical models that have been developed to predict dropwise condensation are mostly based on nucleation physics [3,7]. Monte Carlo simulations [8] and the molecular dynamics simulations [9,10] have been used to investigate the nucleation process. However, a few studies focused on how the initial droplets form on the surface [10].
On the other hand, film rupture theory, first introduced in 1937 by Jacob et al. [11], hypothesized that vapor condenses as a thin film on a surface. At a critical thickness, the thin film breaks up, and subsequently forms small droplets on the surface. According to this theory, a thin film (e.g., a film with a thickness larger than a monolayer) exists between droplets. Song et al. [12] argued that dropwise condensation is a dynamic process. Therefore, the static dropwise condensation experiment conducted by Umar and Griffith [6] could not represent the actual dropwise condensation process. Song et al. experimentally showed the presence of a thin film between droplets during the dynamic dropwise condensation of steam on a steel surface.
The work of Umar and Griffith [6] is one of the main experimental studies that support nucleation theory, while the research of Song et al. [12] is one of the main studies that shows support for film rupture theory. These conflicting experimental studies are one of the main reasons for the existence of two competing theories on the mechanism of dropwise condensation. In 2017, Sheng et al. [10] used the molecular dynamics simulation to investigate the onset of dropwise condensation. Their study showed that initial droplets could form according to the nucleation or film rupture theory, depending on relative surface free energy. This means the two classical hypotheses cannot independently describe the formation of nanoscales droplets at the onset of dropwise condensation.
In this work, we study the dropwise condensation mechanism by conducting experiments similar to the works of Umar and Griffith [13] and Song et al. [12]. Due to the need for visualization of interfacial phenomena with high-frequency features, such as ultrathin film instabilities, we developed an automated SPRi instrument, the first-ever reported instrument capable of imaging a sub-nanometer film at high-speed (up to 10,000 FPS) in ambient conditions [14]. This newly developed near-field imaging system was applied [14,15,16,17] to understand the physics of dropwise condensation, which have been under debate for the past nine decades [4]. We interpret the static dropwise condensation in Umar and Griffith’s work [6] as stable dropwise condensation (SDC) occurring at a very low condensation rate, or dropwise condensation that can be sustained on the surface for a long-time. Here, the droplet growth rate of 1 µm/s in diameter allows us to conduct SDC on gold-coated glass. Our interpretation from the dynamic dropwise condensation of steam mentioned in Song et al.’s work [12] is that it is unstable dropwise condensation (USDC) on a hydrophilic surface, or dropwise condensation that degrades over time and eventually turns into film wise condensation. In this work, USDC of steam was conducted at a droplet growth rate of 20 µm/s in diameter on gold-coated glass.

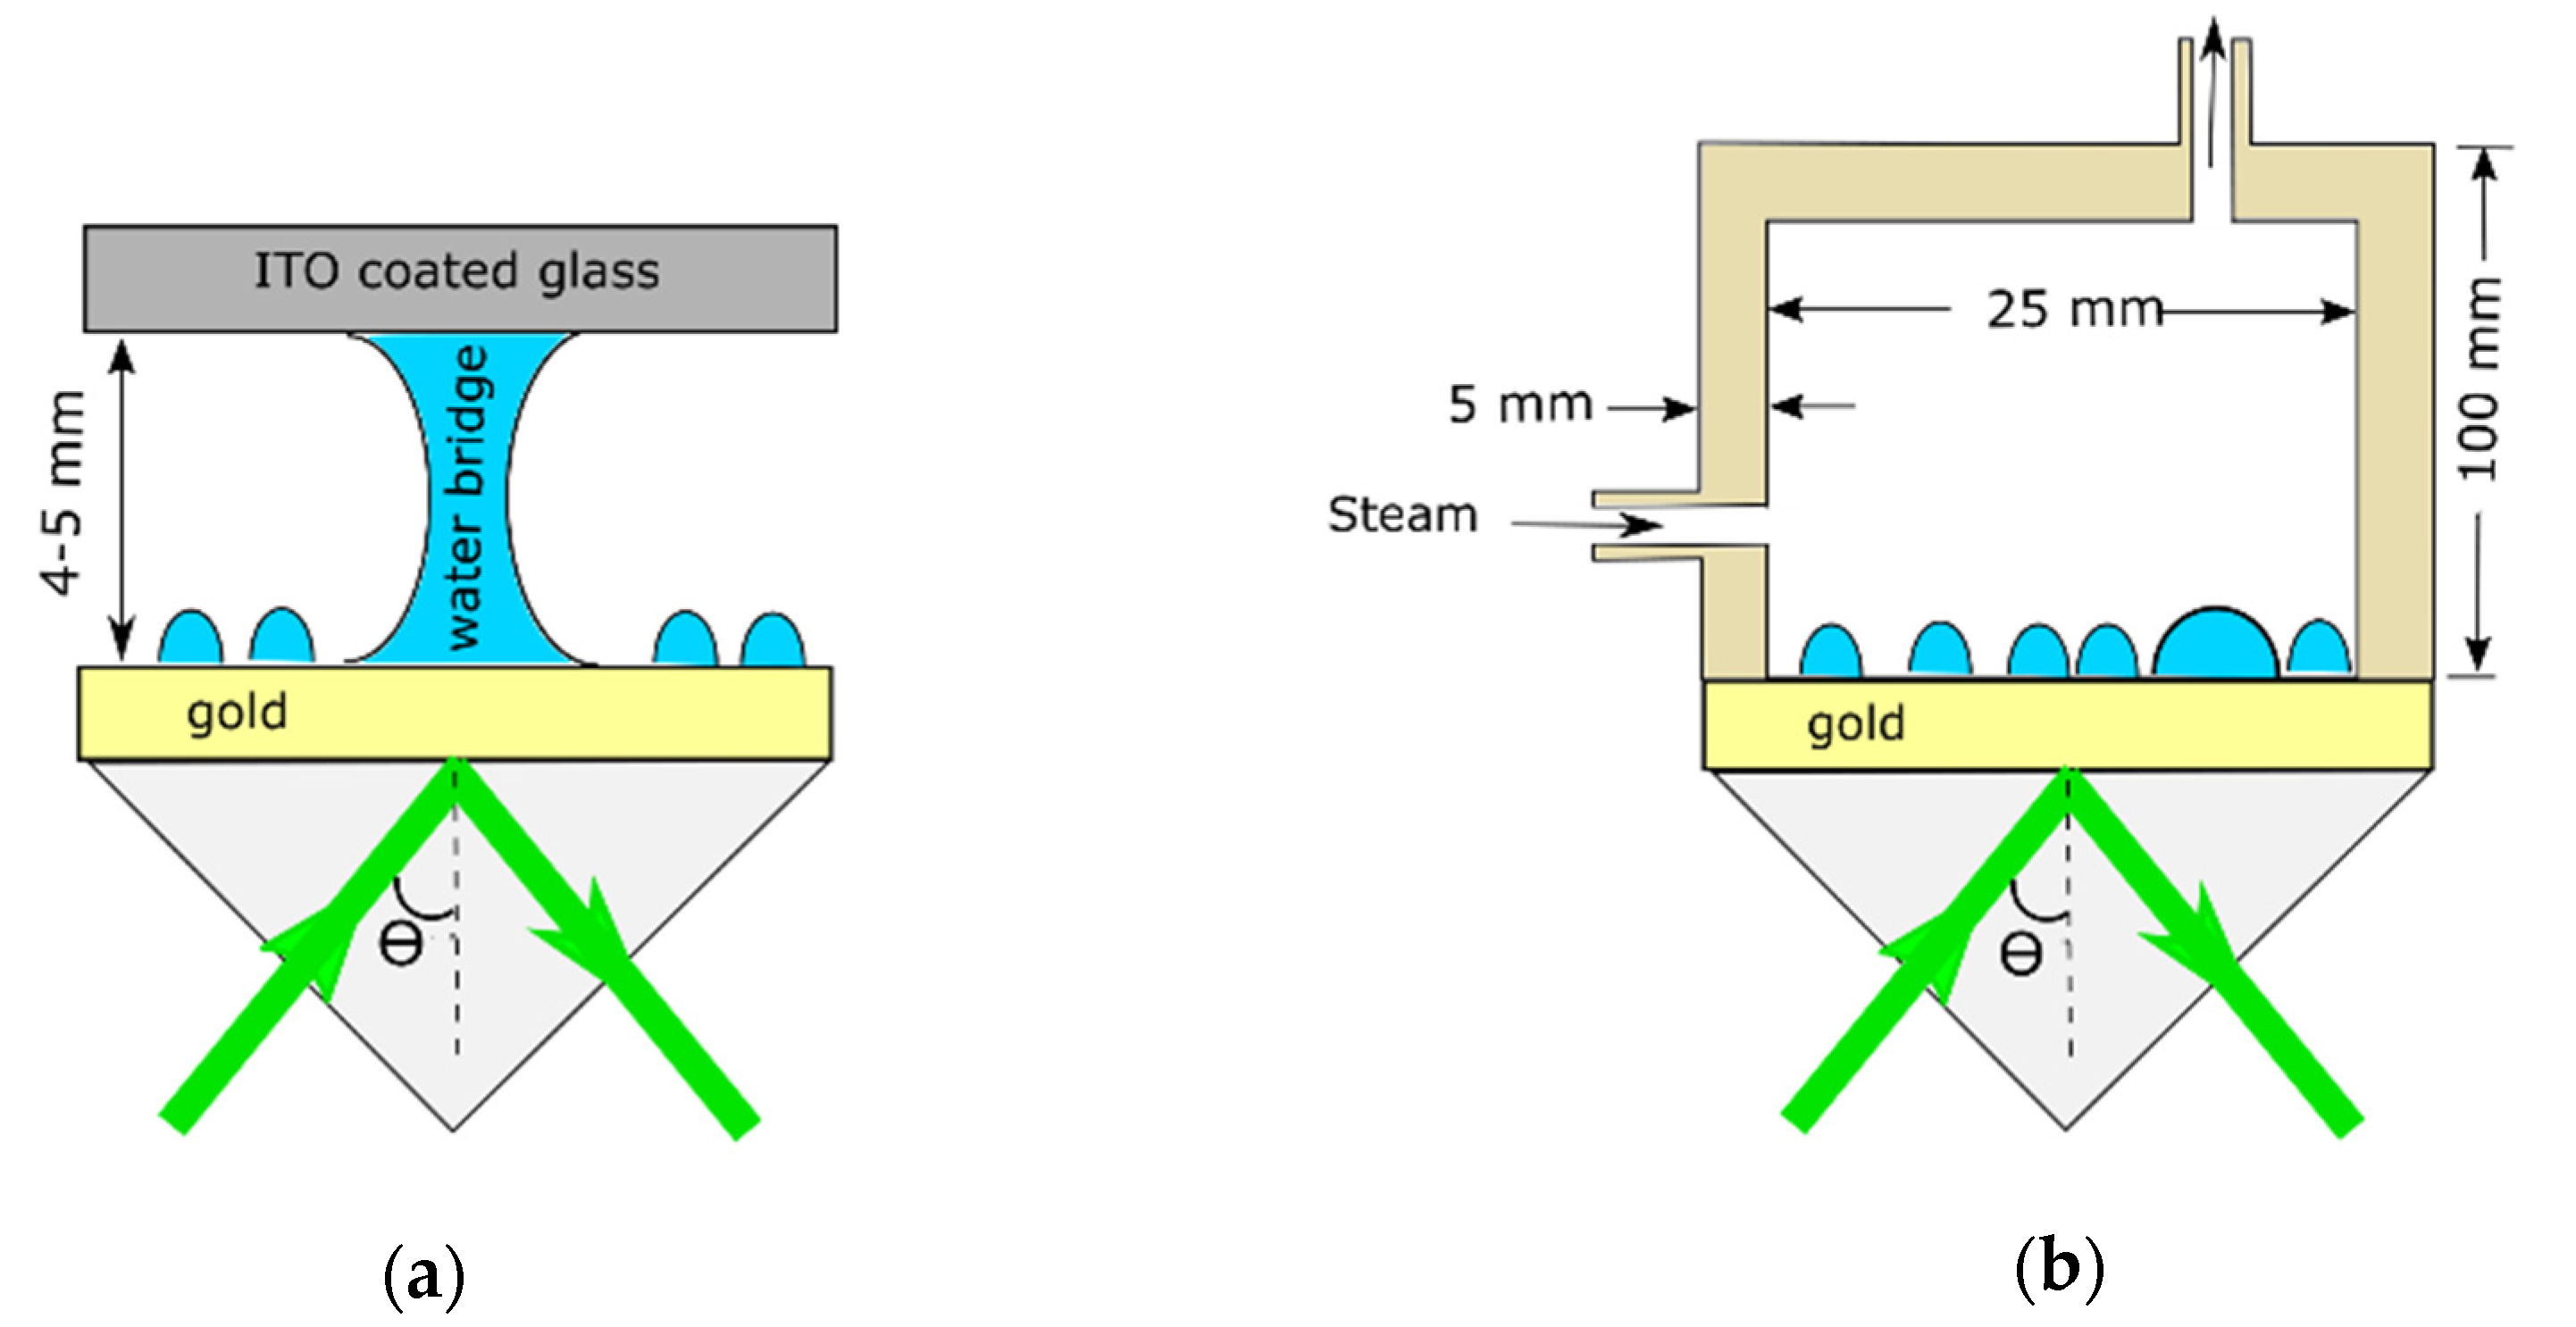
2. Materials and Methods

The visualization of dropwise condensation was carried out using the SPRi instrument, which is an in-house developed microscope [14]. The schematics of the dropwise condensation experiments are detailed in Figure 1. The substrate is 50 nm gold with 2.5 nm of titanium as an adhesive layer, coated on a glass substrate. The root-mean-square of surface roughness is 1.10 ± 0.02 nm and a static contact angle of water on a surface is 78°. SDC was conducted at the droplet growth rate of 1 µm/s in diameter. As Figure 1a shows, an ITO-coated glass is placed 4–5 mm above the gold surface as a heater and a water column with a volume of 10–15 µL is formed between the substrate and the heater. By heating the water bridge, the water evaporates and condenses on the gold surface. During the visualization of the dropwise condensation, the temperature of the gold surface was 35 °C, the local temperature of air above the gold surface was 45 °C, and the relative humidity (RH) was 60%. The thermocouples are not shown in the schematics of Figure 1. For the USDC, a 3-D printed chamber with an inlet and outlet was placed on top of the gold surface as an enclosure (see Figure 1b). The relative humidity (RH = 99%) and temperature (T = 97 °C) were monitored inside the enclosure using a combined temperature and RH sensor (DHT22 sensor based on an Arduino Mega 2560 controller). Steam was introduced into the chamber from the inlet and vented from the outlet of the chamber. As dropwise condensation of steam occurs on a smooth gold surface and no drainage mechanism was designed for this surface, the setup makes it intuitive to see the degradation of dropwise condensation in the long term. The SPRi visualization was carried out at 550 nm and 680 nm for both stable and unstable dropwise condensation. More details about the experimental procedure, visualization, and analysis of data are provided in our previous work [14].
In the case of SDC at the RH of 60%, the condensation rate was approximately 0.0009 µL/(mm2 s), or a heat transfer rate of 0.2 W/cm2. The droplet growth rate was roughly calculated to be around 1 µm/s in diameter. In the case of USDC, the droplet growth rate was calculated roughly to be around 20 µm/s in diameter. SDC and USDC were repeated 3–5 times at both wavelengths of 680 nm and 550 nm. The incident angle was set at 43.15 degrees (0.15 degrees below the SPR angle for air at 680 nm) and 44.80 degrees (1.5 degrees below the SPR angle of air at 550 nm) for SPRi with intensity modulation (IM) at 680 nm and 550 nm, respectively. Figure 2 shows the theoretical reflectance curve for SPRi of a 1 nm layer of water at wavelengths of 550 nm and 680 nm. The experimental angles shown in these plots are the incident angle of 44.80 degrees and 43.15 degrees implemented for SPRi with intensity modulation at 550 nm and 680 nm, respectively. At 550 nm and an experimental angle of 44.80 degrees, a 1 nm water film can result in a ~4% change in the reflectance of the recorded signal. At 680 nm and an experimental angle of 43.15 degrees, a 1 nm film of water on the gold surface can produce a ~16% change in the reflectance. Therefore, SPRi with a higher wavelength provides a better resolution in measuring ultrathin films. On the other hand, SPRi at 550 nm provides a better lateral resolution for our imaging; the lateral resolutions at 550 nm and 680 nm are 4 µm and 10 µm, respectively. Because of the trade-off in resolutions, we repeated the dropwise condensation experiments at both wavelengths of 550 nm and 680 nm.

3. Results and Discussion
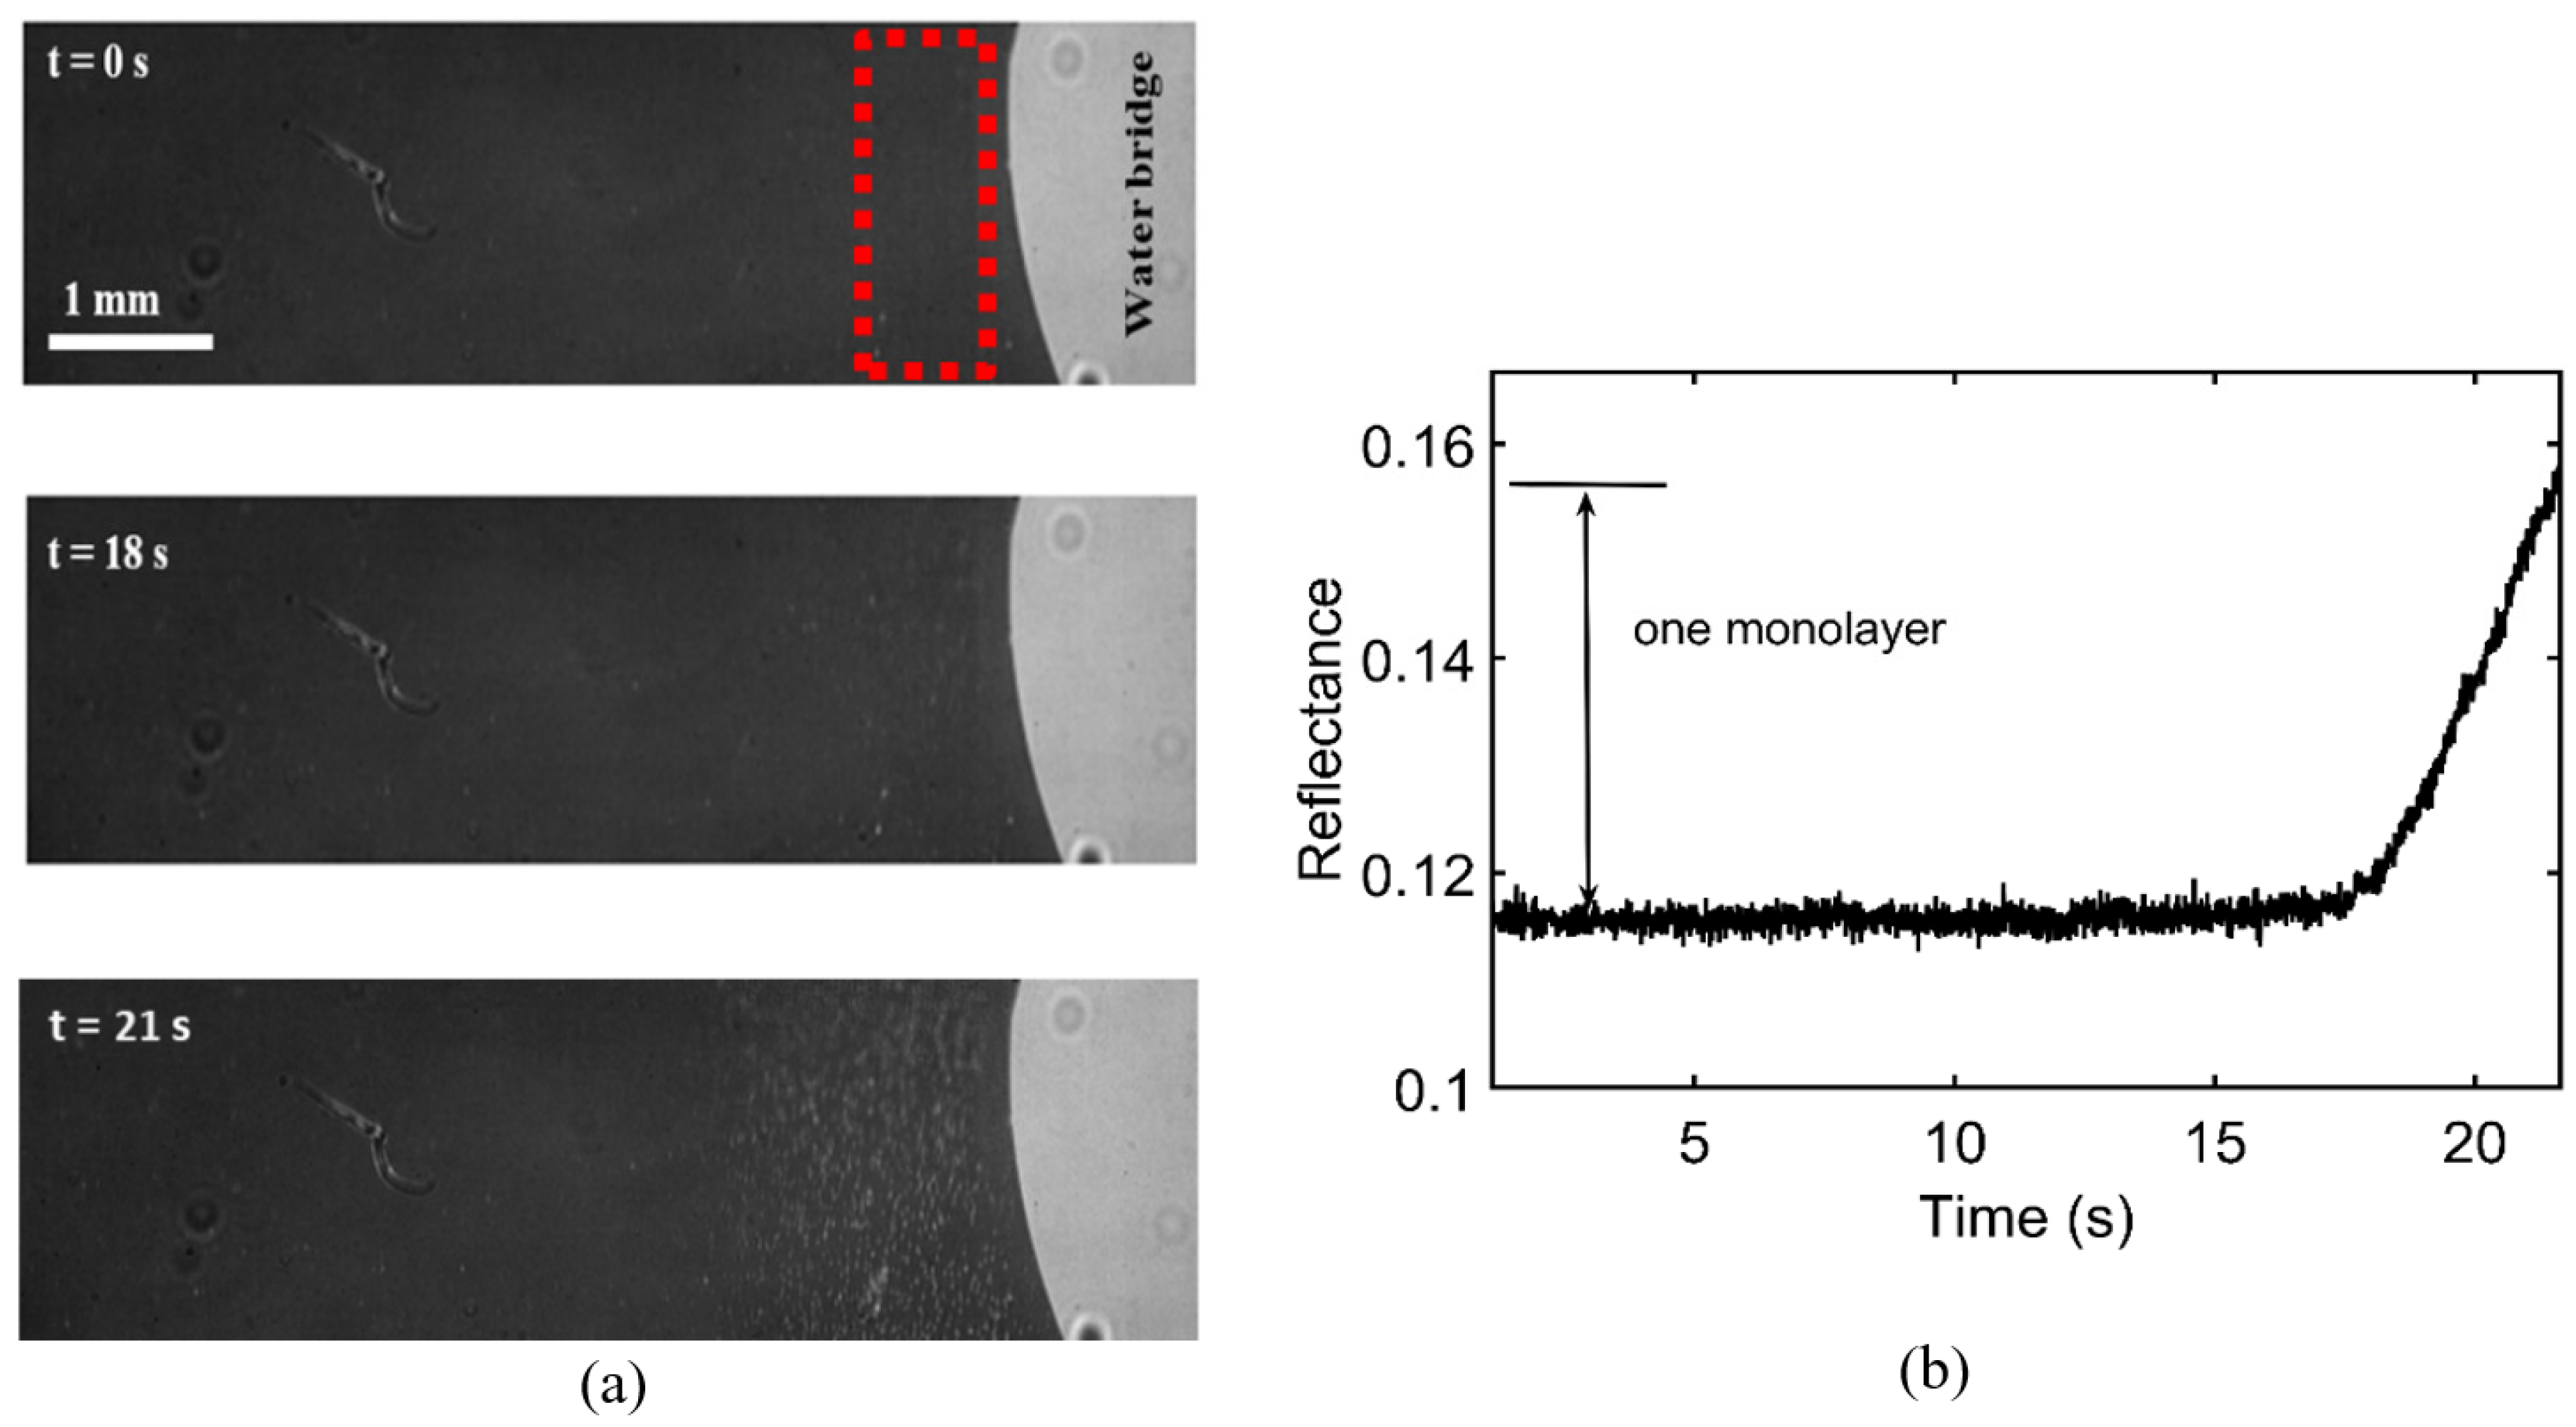
3.1. Onset of SDC

As SPR imaging is a powerful technique for the detection of thin films, we designed our experiment to understand whether a thin film can be detected at the onset of dropwise condensation. Figure 3a shows the SPRi (at 680 nm) results of SDC at the onset of condensation. Online Resource 1 shows the corresponding video of SDC at 680 nm. The light gray and dark gray represent water and gold surfaces, respectively. As Figure 3a shows at t = 18 s, the first condensates emerge in the vicinity of the water bridge. The reflectance variation is measured by tracking the averaged reflectance of pixels in the red dotted box over time; the measurement area is chosen in the vicinity of the water bridge, as the initial droplets emerge on the part of the surface closer to the water bridge. As mentioned, the formation of a water film with the thickness of a molecule layer corresponds to a 4% change in the measured reflectance. However, this result indicates that the reflectance variations before the emergence of the first droplets are infinitesimal (see Figure 3b). This means no film, even one as small as a molecule-thick layer, forms on the surface prior to the emergence of droplets at the onset of SDC, i.e., the initial droplets form by heterogeneous nucleation on the surface. In our other work [14], we showed that the area between droplets is covered with a monolayer film during SDC. Our results confirm the finding of Umur and Griffith [6] in support of nucleation theory as the mechanism of dropwise condensation.
In a different set of experiments, the water bridge on the surface was slightly relocated on the surface by moving the ITO coated glass that is on the top of the water bridge (see Figure 1a). After ~16 s, SDC was started by heating the water bridge using ITO-coated glass. Figure 4 shows selected time-lapse images of this experiment recorded using SPRi at 550 nm. The relocation of a water bridge on the surface left behind an area with a lower reflectance, compared to the rest of the surface. The white-dashed line shows the boundary of the area that was previously covered by the water bridge. The area on the right side of the dashed line can be identified with its darker gray color from the rest of the surface. Locations 1 and 2 are sample areas that are chosen from these two distinct parts of the surface for image processing purposes. Our analysis shows that the reflectance of location 2 is 1% higher than the reflectance of location 1, i.e., for ambient conditions, the gold surface is found to be covered with a molecule-thick layer of adsorbed water. The presence of adsorbed water film on the metal surface has been reported in the literature [18,19]. Figure 4f shows the temporal changes of reflectance at locations 1 and 2. It can be observed the reflectance at location 1 increases when the relative humidity increases (from 35% to 60%) on the surface due to dropwise condensation. The increase in the reflectance of location 1 indicates that water molecules are adsorbing on the surface. It is worth noting that the adsorbed molecules on the surface mostly consist of water molecules and not volatile organic compounds (VOCs). In our previous work [15], we showed that the rate of adsorption of VOCs on the gold surface is much slower than the rate of adsorption of the molecularly adsorbed water layer on the surface.

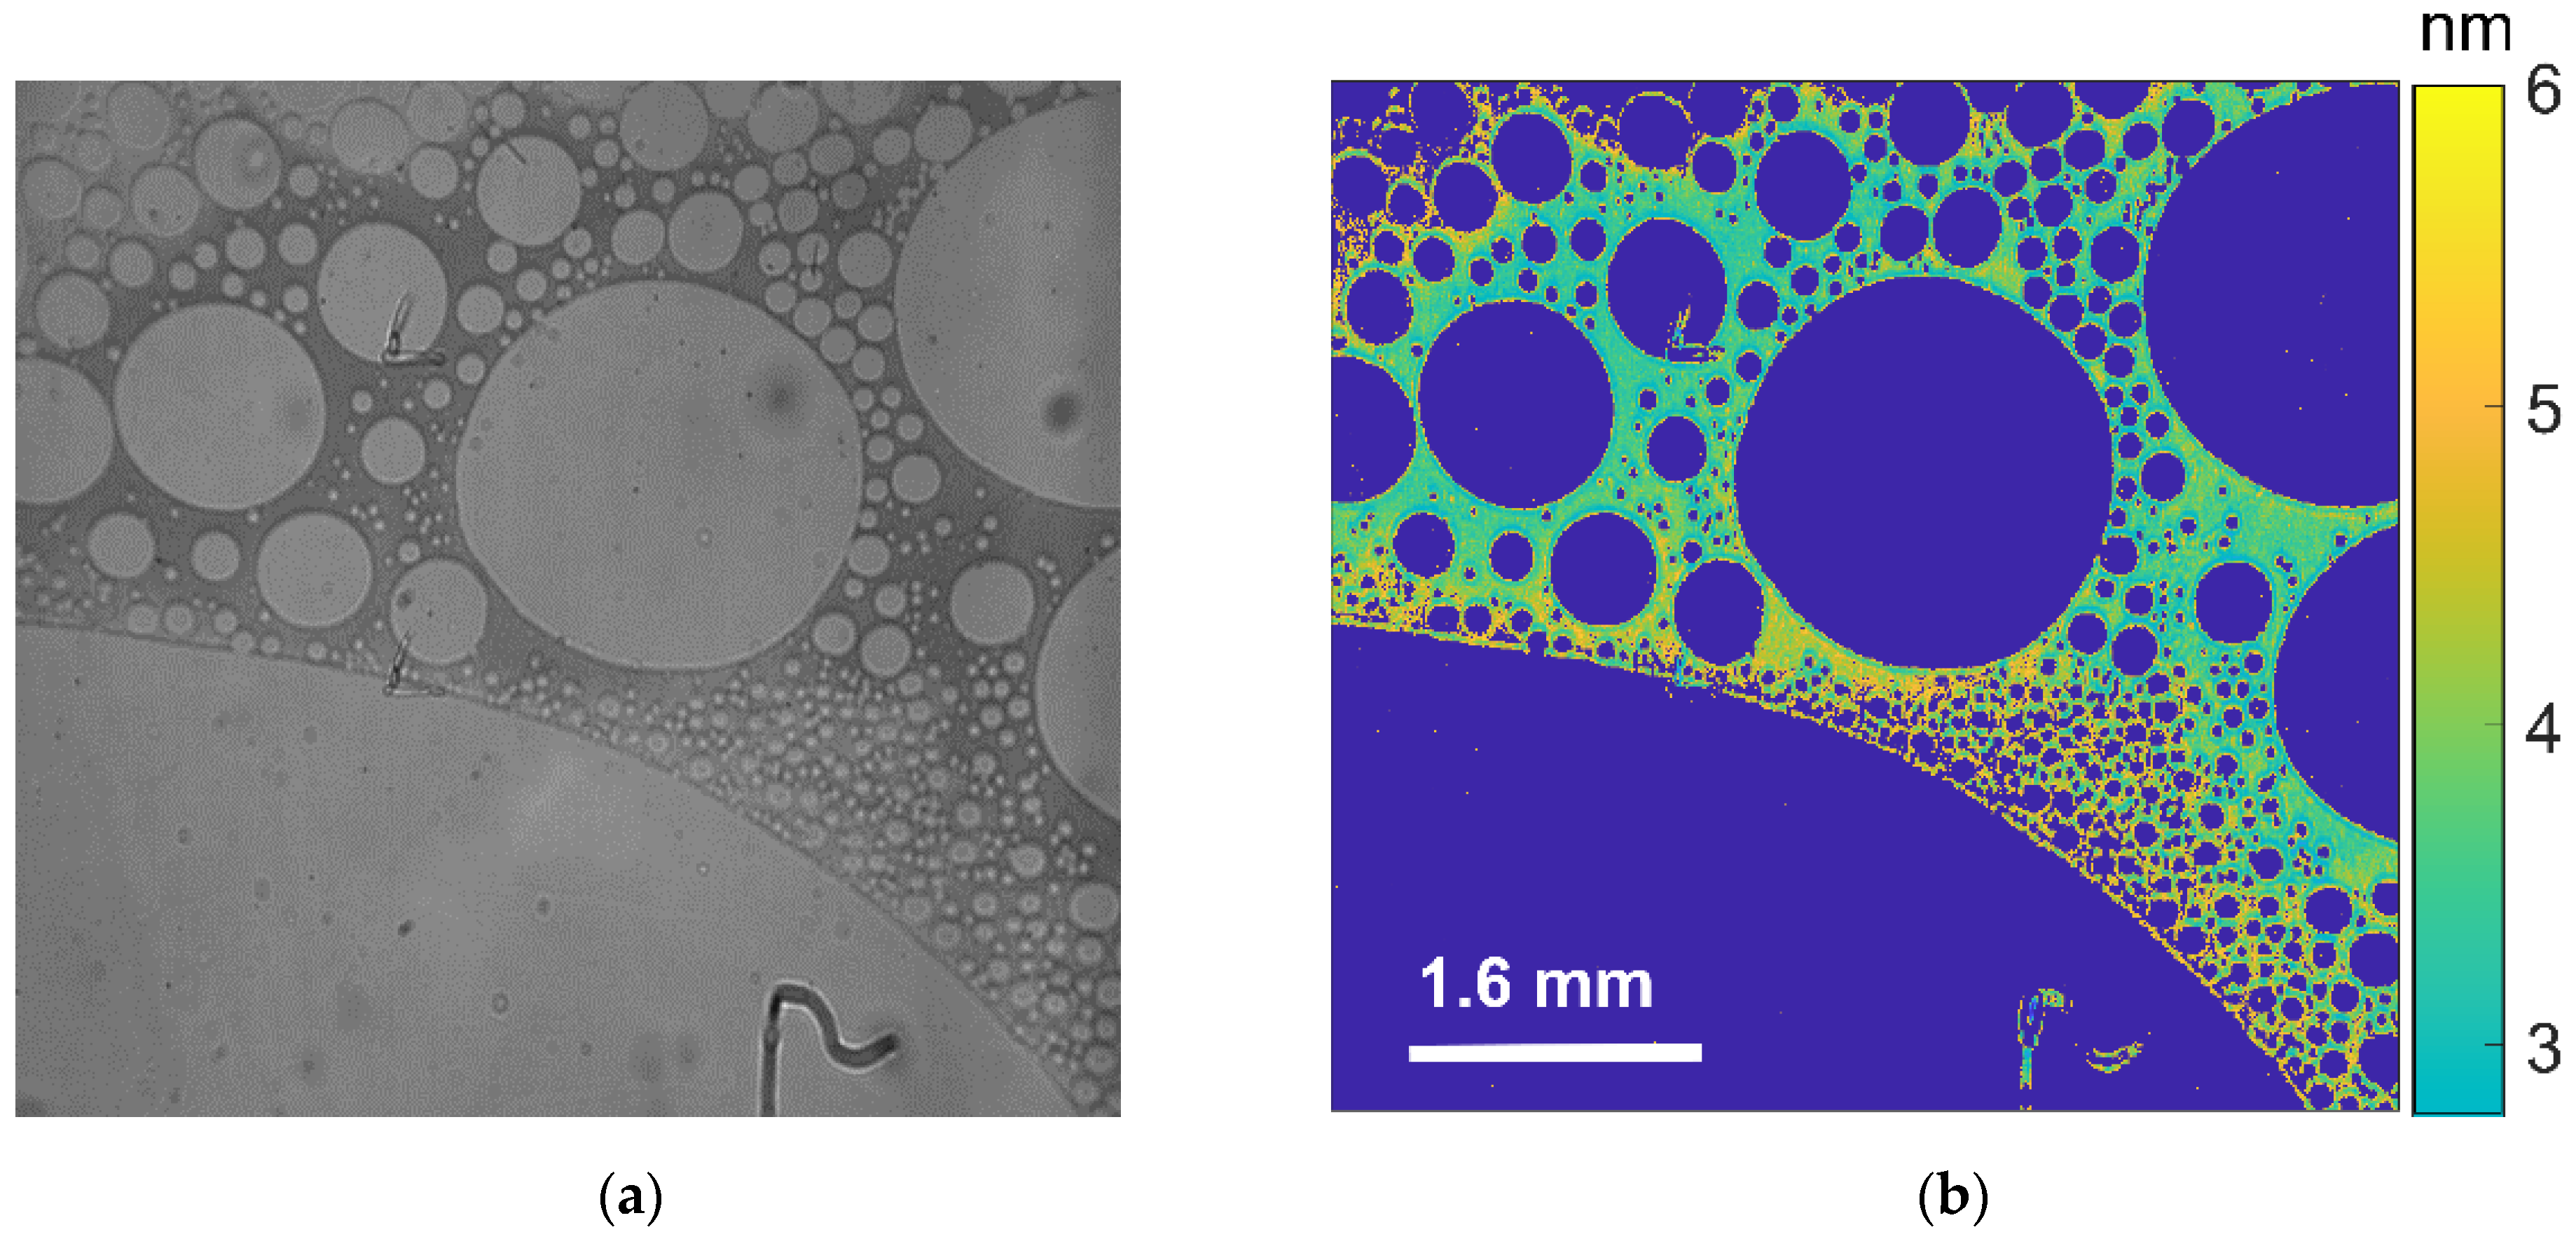
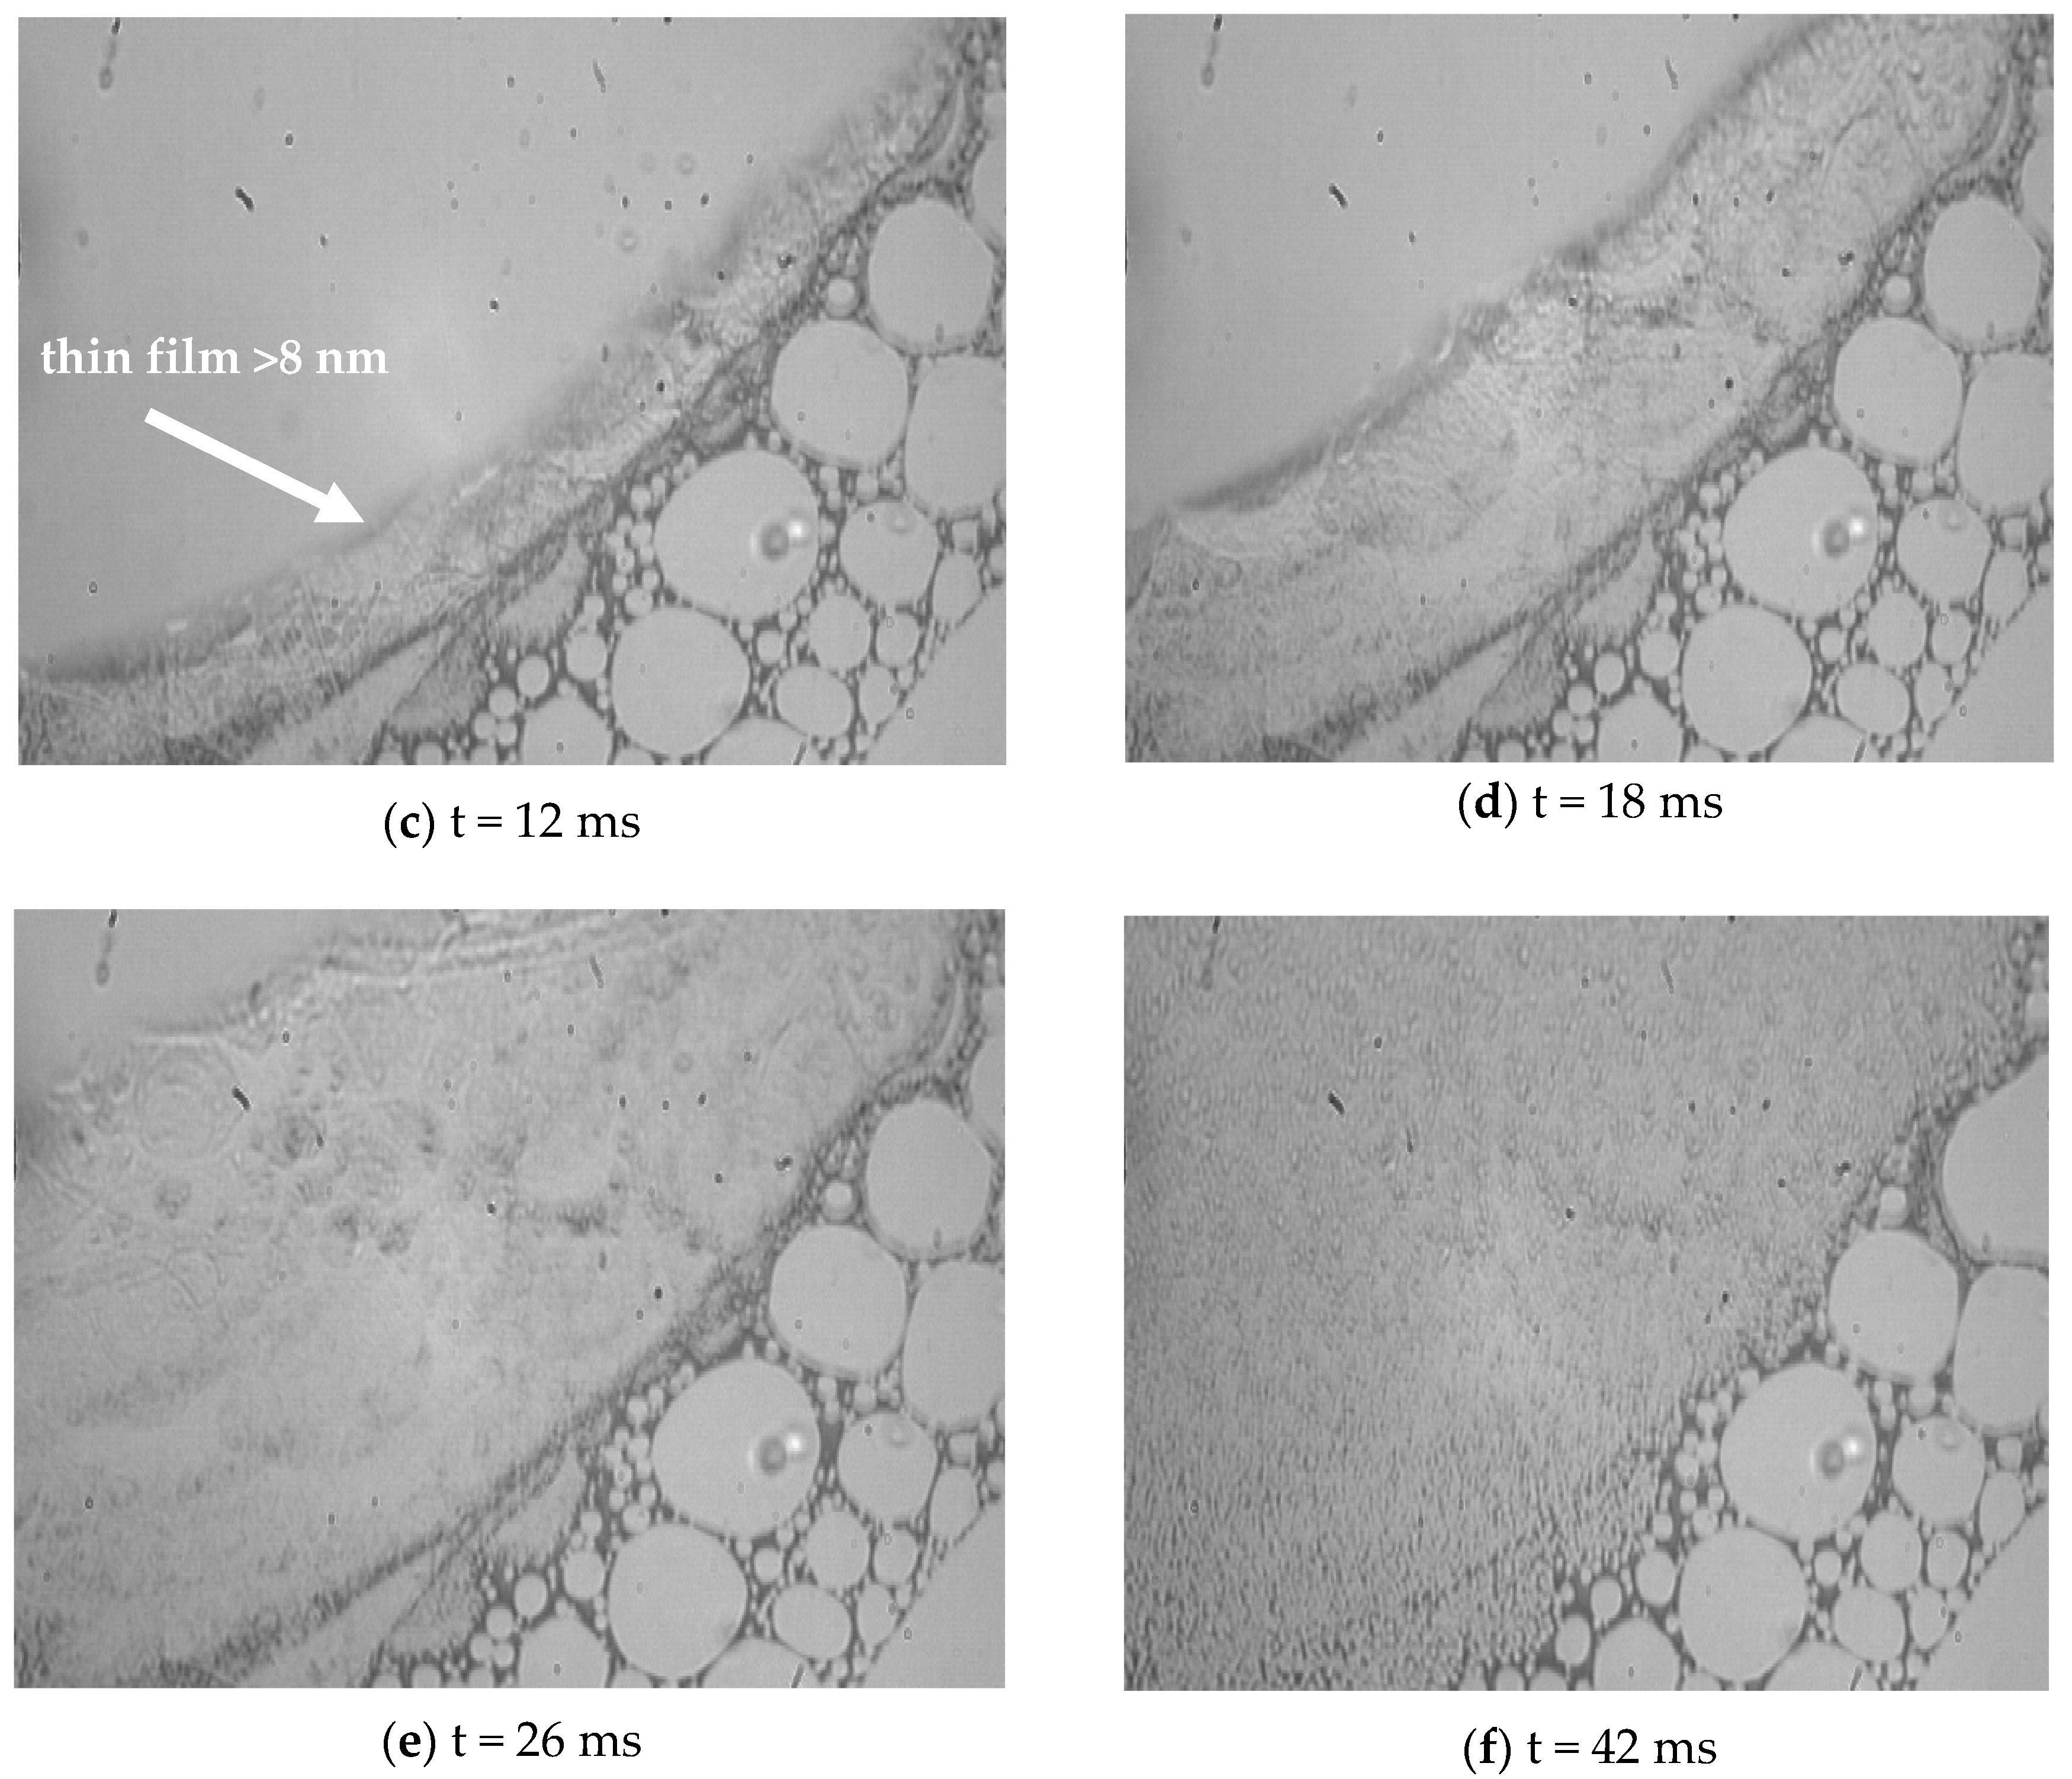
3.2. Visualization of USDC

Song et al. [12] did not use any drainage mechanism on their condensing surface. Similarly, we have not considered any drainage mechanism on the gold surface in our study. Therefore, it is intuitive to expect the dropwise condensation to degrade over time in our experiments. We break down the USDC into three stages: (i) onset of condensation, (ii) growth of the multilayer film up to 8 nm, and (iii) thin-film growth more than 8 nm. These stages are separated by the presence and/or size of the thin film between droplets. Note that these stages are defined for the sake of our analysis’ convenience because 8 nm is the maximum thickness that is measurable in our SPR imaging.
Figure 5 illustrates the recorded images at the first stage, onset of condensation from the USDC experiments. The corresponding video of the onset of USDC is available as Online Resource 2. When steam is introduced to the surface, the vapor molecules in the ambient air strike the surface and form a film-like layer on the surface (see Figure 5a,b). This layer propagates from the inlet of steam, i.e., in the example case of Figure 5 from the right side to the left side of the image. Then, the reflectance of this film-like layer increases (up to the reflectance of a droplet, which is 0.5941 and 0.8710 for SPRi at 550 nm and 680 nm, respectively, see Figure 5c). Eventually, distinct droplets emerge on the surface (see Figure 5d). It can be seen in the example case of Figure 5a that some droplets also emerge randomly on the surface. The visualization results may make it look like a thin film forms on the surface and that eventually this film ruptures. However, due to low lateral resolution (the lateral resolution is 4 µm and 10 µm for SPRi at 550 nm and 680 nm wavelengths, respectively) of the experiments, the visualization can be misleading. In other words, as the size of each pixel is bigger than the size of initial droplets that form on the surface, the colonies of sub-micron size droplets at the onset of condensation can also create an image similar to a thin film. Therefore, the current visualizations cannot provide sufficient evidence regarding the mechanism of droplet formation at the onset of USDC. In a future study, we will equip the SPRi with a high-aperture objective lens to study the onset of dropwise condensation of steam in more detail.
After Stage I, droplets grow and coalesce to become larger droplets. As no drainage mechanism was designed on the condensing surface, it is intuitive to expect that the long-term dropwise condensation of steam is not sustainable on the gold surface. At stage II of USDC, the results show the reflectance of the area between droplets increases. This increase in the reflectance indicates the formation of a multilayer water molecule film between droplets. Figure 6a,b show a raw image and the corresponding processed image from Stage II of USDC, respectively. The dark blue in Figure 6b represents that water droplets and thickness of thin-films between droplets varies between 3–6 nm. As the USDC continues, the thickness of thin films between droplets increases. As our study of the mechanism of dropwise condensation of steam is at its early stages, we have not conducted any quantitative analysis on the effect of thin films between droplets on the heat transfer rates. In our future work, we will include the measurement of heat transfer on the surface for USDC.
Stage III of USDC is the growth of the thin film between droplets beyond the detection range (>8 nm) of the current SPRi system. Figure 7a depicts the correlation between the reflectance and the thickness of water film for SPRi with intensity modulation (IM, experimental angle of 43.15 degrees) at a 680 nm wavelength. As this figure shows, the reflectance associated with just air (no film on the surface) is 0 and the reflectance associated with a liquid droplet on the surface is 0.87. The reflectance values of 0 and 0.87 are practically the minimum and maximum reflectance that we can measure using our current SPRi system. In terms of thin film measurements, the water film with a thickness of 8 nm produces a signal that is equivalent to the reflectance of a water droplet, i.e., reflectance of 0.87. Therefore, the range in which we can measure a thin film is 0 to 8 nm. If the thickness of the thin film goes beyond 8 nm, it shows itself in our image with a reflectance higher than a water droplet, i.e., the color of a thin-film larger than 8 nm is slightly brighter than the water droplets in the recorded images. As noted, it is not possible to accurately measure film larger than 8 nm with the current SPRi setup. In this case, we can only comment as to whether a film with a thickness larger than 8 nm exists on the surface. The thickness of this film could be anywhere from 8 to 250 nm. Figure 7b,c show the raw and corresponding processed images from Stage III of USDC, respectively. In the raw image, the area between the droplets has a brighter color, as compared to the color of the droplets. In the processed image, droplets are represented in dark blue, areas with a thickness larger than 8 nm are identified in yellow color, and areas with a thickness less than 8 nm are shown in a bright blue color. Online Resource 3 is the video from Stage III of USDC.
Figure 8 shows time-lapse images of coalescence during Stage III of USDC. It can be observed that after the coalescence, the swept area on the surface is not dry. In the example case shown in Figure 8, the thickness of the swept area just after the coalescence increases beyond 8 nm, i.e., the reflectance of this area is higher than 0.87, the reflectance of a droplet (and 8 nm thick film). Then, reflectance drops to a value lower than the reflectance of a droplet, i.e., the thickness of film becomes smaller than 8 nm. This fluctuation in film thickness may be an indicator of the thin film instability or lateral transition of water molecules in the thin film. Figure 8d shows the new droplets emerging on the surface after 42 ms from the start of coalescence. Online Resource 4 provides the video of the droplet coalescence illustrated in Figure 8. Our USDC results confirm the findings of Song et al. [12] regarding the presence of a thin-film larger than a monolayer between droplets.

4. Conclusions

The current work studies the mechanism of dropwise condensation on a smooth hydrophilic surface using SPRi. SPRi is an ideal tool with which to study thin film evolution, as it can monitor dynamic changes of a thin film as small as 0.1 nm to 8 nm at temporal resolutions of 200–10,000 FPS. We studied two cases of dropwise condensation: SDC and USDC. In the case of SDC on a smooth hydrophilic gold surface, our studies showed that no film larger than a monolayer forms on the surface before the formation of initial droplets. Therefore, the droplets form on the surface at heterogeneous nucleation sites. These results confirms the findings of Umur and Griffith [6] and other researchers, in support of nucleation theory as the mechanism governing dropwise condensation. In the case of USDC, where long-term dropwise condensation becomes unsustainable on the surface, visualization results showed that a thin film with a thickness larger than a monolayer grows between the droplets. We were able to detect a thin film thicker than 8 nm between the droplets during USDC. Our finding on USDC confirms the finding of Song et al. [12] regarding the presence of a thin film between droplets during dropwise condensation of steam on a steel surface. In summary, our results show that neither nucleation theory nor film rupture theory can individually explain the mechanism of dropwise condensation. Thus, there is a need for a more comprehensive theory to explain the physics of dropwise condensation. Future work needs to quantitatively study the parameters affecting the growth of the thin-film between droplets and the effect of thin-film on the heat transfer rate.

Author Contributions

Conceptualization, S.B.A.; methodology, S.B.A.; software, S.B.A.; validation, S.B.A.; formal analysis, S.B.A.; investigation, S.B.A.; resources, C.K.C.; data curation, S.B.A.; writing—original draft preparation, S.B.A.; writing—review and editing, S.B.A., K.-B.L. and C.K.C.; visualization, S.B.A.; supervision, C.K.C.; project administration, C.K.C.; funding acquisition, K.-B.L. All authors have read and agreed to the published version of the manuscript.

Funding

This research received no external funding.

Conflicts of Interest

The authors declare no conflict of interest.

References

  1. Ahlers, M.; Buck-Emden, A.; Bart, H.-J. Is dropwise condensation feasible? A review on surface modifications for continuous dropwise condensation and a profitability analysis. J. Adv. Res. 2018, 16, 1–13. [Google Scholar] [CrossRef] [PubMed]
  2. Hu, X.; Yi, Q.; Kong, X.; Wang, J. A Review of Research on Dropwise Condensation Heat Transfer. Appl. Sci. 2021, 11, 1553. [Google Scholar] [CrossRef]
  3. Khandekar, S.; Muralidhar, K. Modeling dropwise condensation. In Dropwise Condensation on Inclined Textured Surfaces; Springer: Berlin/Heidelberg, Germany, 2014; pp. 17–72. [Google Scholar]
  4. Leipertz, A. J3 dropwise condensation. In VDI Heat Atlas; Springer: Berlin/Heidelberg, Germany, 2010; pp. 933–938. [Google Scholar]
  5. Tammann, G.; Boehme, W. Die zahl der wassertröpfchen bei der kondensation auf verschiedenen festen etoffen. Ann. Phys. 1935, 414, 77–80. [Google Scholar] [CrossRef]
  6. Umur, A.; Griffith, P. Mechanism of Dropwise Condensation. J. Heat Transf. 1965, 87, 275–282. [Google Scholar] [CrossRef] [Green Version]
  7. Sikarwar, B.S.; Khandekar, S.; Agrawal, S.; Kumar, S.; Muralidhar, K. Dropwise Condensation Studies on Multiple Scales. Heat Transf. Eng. 2012, 33, 301–341. [Google Scholar] [CrossRef]
  8. Merikanto, J.; Vehkamäki, H.; Zapadinsky, E. Monte Carlo simulations of critical cluster sizes and nucleation rates of water. J. Chem. Phys. 2004, 121, 914–924. [Google Scholar] [CrossRef] [PubMed]
  9. Diemand, J.; Angélil, R.; Tanaka, K.K.; Tanaka, H. Large scale molecular dynamics simulations of homogeneous nucleation. J. Chem. Phys. 2013, 139, 074309. [Google Scholar] [CrossRef] [PubMed]
  10. Sheng, Q.; Sun, J.; Wang, Q.; Wang, W.; Wang, H.S. On the onset of surface condensation: Formation and transition mechanisms of condensation mode. Sci. Rep. 2016, 6, 30764. [Google Scholar] [CrossRef] [PubMed] [Green Version]
  11. Jakob, M. Heat Transfer in Evaporation and Condensation; University of Illinois: Urbana, IL, USA, 1937. [Google Scholar]
  12. Song, Y.; Xu, D.; Lin, J.; Tsian, S. A study on the mechanism of dropwise condensation. Int. J. Heat Mass Transf. 1991, 34, 2827–2831. [Google Scholar] [CrossRef]
  13. Umur, A.; Griffith, P. Mechanism of Dropwise Condensation; MIT Dept. of Mechanical Engineering: Cambridge, MA, USA, 1963. [Google Scholar]
  14. Ahangar, S.B.; Konduru, V.; Allen, J.S.; Miljkovic, N.; Lee, S.H.; Choi, C.K. Development of automated angle-scanning, high-speed surface plasmon resonance imaging and SPRi visualization for the study of dropwise condensation. Exp. Fluids 2019, 61, 12. [Google Scholar] [CrossRef] [Green Version]
  15. Ahangar, S.B.; Jeong, C.H.; Long, F.; Allen, J.S.; Lee, S.H.; Choi, C.K. The Effect of Adsorbed Volatile Organic Compounds on an Ultrathin Water Film Measurement. Appl. Sci. 2020, 10, 5981. [Google Scholar] [CrossRef]
  16. Bayani, S.; Tabe, Y.; Kang, Y.T.; Lee, S.H.; Choi, C.K. Surface plasmon resonance imaging of drop coalescence at high-temporal resolution. J. Flow Vis. Image Process. 2018, 25, 191–205. [Google Scholar] [CrossRef]
  17. Ahangar, S.B.; Allen, J.S.; Lee, S.H.; Choi, C.K. Surface Plasmon Resonance Imaging: A Technique to Reveal the Dropwise Condensation Mechanism. J. Heat Transf. 2020, 142, 030903. [Google Scholar] [CrossRef] [Green Version]
  18. Xiao, C.; Shi, P.; Yan, W.; Chen, L.; Qian, L.; Kim, S.H. Thickness and structure of adsorbed water layer and effects on adhesion and friction at nanoasperity contact. Colloids Interfaces 2019, 3, 55. [Google Scholar] [CrossRef] [Green Version]
  19. Kochsiek, M. Measurement of water adsorption layers on metal surfaces. Metrologia 1982, 18, 153. [Google Scholar] [CrossRef]
Figure 1. Schematic of the experimental setup for (a) stable dropwise condensation (SDC) and (b) unstable dropwise condensation (USDC) studies. Two wavelengths of 550 nm and 680 nm with the incident angles (θ) of 44.80 degrees and 43.15 degrees, respectively, were studied.
Applsci 11 09184 g001
Figure 2. Theoretical SPR plots showing the effect of 1 nm water film on the reflectance at two wavelengths, (a) 550 nm and (b) 680 nm.
Applsci 11 09184 g002
Figure 3. (a) Selected time-lapse images recorded (using SPRi at wavelength of 680 nm and temporal resolution of 250 FPS) from the onset of SDC, (b) the averaged reflectance of the area in the red box shows no thin film forms on the surface prior to the droplet formation.
Applsci 11 09184 g003
Figure 4. (a) Water bridge on the gold surface, (b) relocation of the water bridge, leaving behind an area that is darker in color; the gold surface in ambient condition (location 2) is covered with a monolayer of adsorbed water molecules, (ce) time-lapse images of dropwise condensation on the surface, and (f) the reflectance of location 2 remained relatively constant up to 45 s, while the reflectance of location 1 increased.
Applsci 11 09184 g004
Figure 5. Selected time-lapse images at (a) 5.92 s, (b) 6.12 s, (c) 9.18 s, and (d) 20.14 s during the first stage, Onset (stage I) of USDC provide inconclusive evidence on whether a thin film larger than a monolayer exists on the surface; the images are recorded using SPRi at 680 nm.
Applsci 11 09184 g005
Figure 6. Formation of multilayer water film between droplets during Stage II of USDC, (a) recorded image using SPRi at 680 nm, and (b) processed image with thickness map; dark blue represents the droplet of water.
Applsci 11 09184 g006
Figure 7. (a) Theoretical correlation between the reflectance and thickness of the water film, as visualized using SPRi at an experimental angle of 43.15 degrees and a wavelength of 680 nm, (b) a raw image of a thin film between droplets during USDC (bright and dark grays represent thin films and droplets, respectively), and (c) the corresponding processed image of thin films grown between droplets during USDC (dark blue, light blue, and yellow colors represent droplets, film with thickness smaller than 8 nm, and film with thickness larger than 8 nm, respectively).
Applsci 11 09184 g007
Figure 8. Selected time-lapse images of coalescence during Stage III of USDC show the presence of a thin film (>8 nm) at the exposed area and the subsequent film rupture.
Applsci 11 09184 g008aApplsci 11 09184 g008b
Publisher’s Note: MDPI stays neutral with regard to jurisdictional claims in published maps and institutional affiliations.

