Article

Delamination Detection in Bimetallic Composite Using Laser Ultrasonic Bulk Waves

1
School of Mechanical Engineering, University of Science and Technology Beijing, Beijing 100083, China
2
College of Mechanical Engineering, Beijing Institute of Petrochemical Technology, Beijing 102617, China
*
Authors to whom correspondence should be addressed.
Appl. Sci. 2021, 11(2), 636; https://doi.org/10.3390/app11020636
Submission received: 10 December 2020 / Revised: 5 January 2021 / Accepted: 7 January 2021 / Published: 11 January 2021
(This article belongs to the Section Optics and Lasers)

Abstract

:

Featured Application

This paper presents a testing method based on laser ultrasonic bulk waves for the detection of interface delamination defects in a Cu/Al bimetallic plate produced by sandwich rolling.

Abstract

In this study, a method based on laser ultrasonic bulk waves is used to detect delamination in a bimetallic composite. For this purpose, several artificial delamination defects were created in a copper-aluminum sample using wire-electrode cutting. The research includes numerical simulation and experimental analysis. The propagation process of laser ultrasonic in Cu/Al bimetallic compo-site, the interaction between bulk waves and composite interface, and the effect of delamination defects on the ultrasound field were studied by numerical simulation. Suitable parameters and features were determined by numerical simulation, which provided a basis for the parameter se-lection of experimental research. The reflected shear waves from the composite interface can act as a sensitive feature to detect the delamination in Cu/Al bimetallic composites. The distance between the detection point and the excitation point was set to 2 mm to take into account the detection resolution and efficiency. The experimental results were in good agreement with the simulation results, and the C-scan image can intuitively show the location and size of delamination defects. The detection method based on laser ultrasonic bulk waves can effectively detect the delamination in Cu/Al bimetallic composite, which is suitable for the on-line detection of the rolling composite process.

1. Introduction

Bimetal products have become an important structural material in modern industrial production, due to their good comprehensive properties and low cost [1,2,3]. Copper-aluminum bimetallic products are compounded by a copper layer and an aluminum layer, which are widely used in electricity and communication [4,5,6]. The main production process of copper-aluminum bimetallic composites is the sandwich rolling method [7]. In the process of sandwich rolling, a variety of uncertain factors will cause interfacial delamination defects, which will significantly reduce the structural strength and fatigue life of the bimetal products. Although the interface delamination defects seriously affect the quality of bimetal products, on-line delamination detection is still quite difficult. The on-line detection of defects can not only record the compound quality of all products and optimize the sandwich rolling process, but also provide real-time feedback control signals for the rolling mill. Therefore, on-line nondestructive detection of bimetallic products is highly needed.
Ultrasound is very sensitive to interface bonding characteristics, so it is widely used in the detection of interface delamination in multilayer composite materials [8,9,10,11,12,13,14,15,16,17,18]. Conventional piezoelectric ultrasonic transducers need couplant [19], which cannot realize non-contact detection in the sandwich rolling process. Although air-coupled ultrasonic transducer and electromagnetic ultrasonic transducer can realize non-contact detection, the sensitivity and resolution of air-coupled ultrasonic transducer are low [20], and electromagnetic ultrasonic transducers cannot adapt to high-temperature environments. As a new detection technology, laser ultrasound has the characteristics of non-contact and high spatial-temporal resolution, which can excite and detect ultrasound a long distance in a high-temperature environment. Laser ultrasonic technology has been successfully used in the on-line inspection of the strip rolling process and the defects detection of multilayer composite. Lévesque et al. measured the thickness of the seamless tube using the time-of-flight of laser ultrasonic echo at about 1000 °C, which was used for feedback control of rolling mill and reduced the thickness error of the seamless tube, and proposed an on-line measurement method of austenite grain based on laser ultrasonic [21]. In the hot rolling workshop, Hutchinson et al. used lasers to excite and detect ultrasonic waves on high-speed, high-temperature hot-rolled strips to characterize the transformation state from austenite to ferrite [22]. Sano et al. measured the grain size of high-strength steel using laser ultrasound, which was in good agreement with the scanning electron microscope-electron backscatter diffraction (SEM-EBSD) results [23]. Zhang et al. characterized the disbonds in a steel-lead structure using laser ultrasound and proposed a quantitative method to assess the sizes of disbands [24]. Karabutov et al. proposed an ultrasonic spectroscopy method to quantitatively analyze the influence of internal delamination in laminates on ultrasonic attenuation coefficient [8]. Consequently, laser ultrasonic testing technology can be used for on-line delamination detection of bimetallic composite in the sandwich rolling process.
In this paper, the interaction between laser ultrasonic bulk waves and interface separation defects in Cu/Al bimetallic composite was systematically studied, and a new method to detect delamination defects is proposed. The effect of the position and size of the delamination defects on the peak value of different bulk waves was explored experimentally and numerically. The reflected shear wave from the composite interface is a sensitive feature to evaluate the delamination defects at the interface. Finally, the position and size of the delamination defects are given intuitively by the C-scan imaging results.

2. Theory and Model

2.1. Generation of Laser Ultrasonic Based on the Thermo-Elastic Mechanism

The ablation mechanism will cause damage to the surface of the material, so the thermos-elastic mechanism is used to excite the ultrasound. When the pulse laser irradiates the surface of aluminum, the material in the irradiated area absorbs heat and expands instantly, and ultrasonic waves are excited. The thermal conduction equation [25,26] can be described as
ρ C v T t · ( K T ) = Q
where T is the temperature field in aluminum, K is the conductive thermal coefficient, Q is the power density of aluminum surface generated by pulse laser, Cv is the constant volume specific heat, and ρ is the material density. The power density Q can be described as
Q = I 0 ( 1 R ) f ( r ) g ( t )
where I0 is the total power density of pulsed laser, R is the reflection coefficient of laser, f(r) is the spatial distribution function of laser energy, and g(t) is the temporal profile of the laser pulse. f(r) and g(t) are given as following:
f ( r ) = exp r 2 r 0 2
g ( t ) = exp t t 0 / 2 τ 2
where r0 is the spot radius of pulse laser on aluminum surface, τ is the rise time of the laser pulse, and t0 is the duration of the laser pulse. The thermos-elastic displacement equation is given as following:
( λ + 2 μ ) ( u ) μ × × u α ( 3 λ + 2 μ ) T = ρ 2 u t 2
where u is the transient displacement vector, λ and μ are the lame constants, and α is the expansion coefficient.

2.2. Finite Element Method

The propagation process of laser ultrasonic waves in Cu/Al bimetallic composite was studied by numerical analysis. The heat conduction equations and finite element equations [25,26,27] are given as following
K T + C T ˙ = R q + R Q
M U ¨ + K U = R e x t
where K is the conductivity matrix, C is the heat capacity matrix, M is the mass matrix, T is the temperature vector, T ˙ is the temperature change rate vector, R q is the heat flux, R Q is the heat source vector, R e x t is the external force vector, U is the displacement vector, and U ¨ is the acceleration vector.
Appropriate element size and iteration time step are very important to ensure the accuracy of finite element calculation results. The element size and iteration time are determined by the following two formulae [26,27].
Δ t 1 180 f max
L e λ min 20
where Δt is the integration time, fmax is the maximum center frequency of laser ultrasonic, Le is the element size, and λmin is the shortest wavelength of laser ultrasonic.

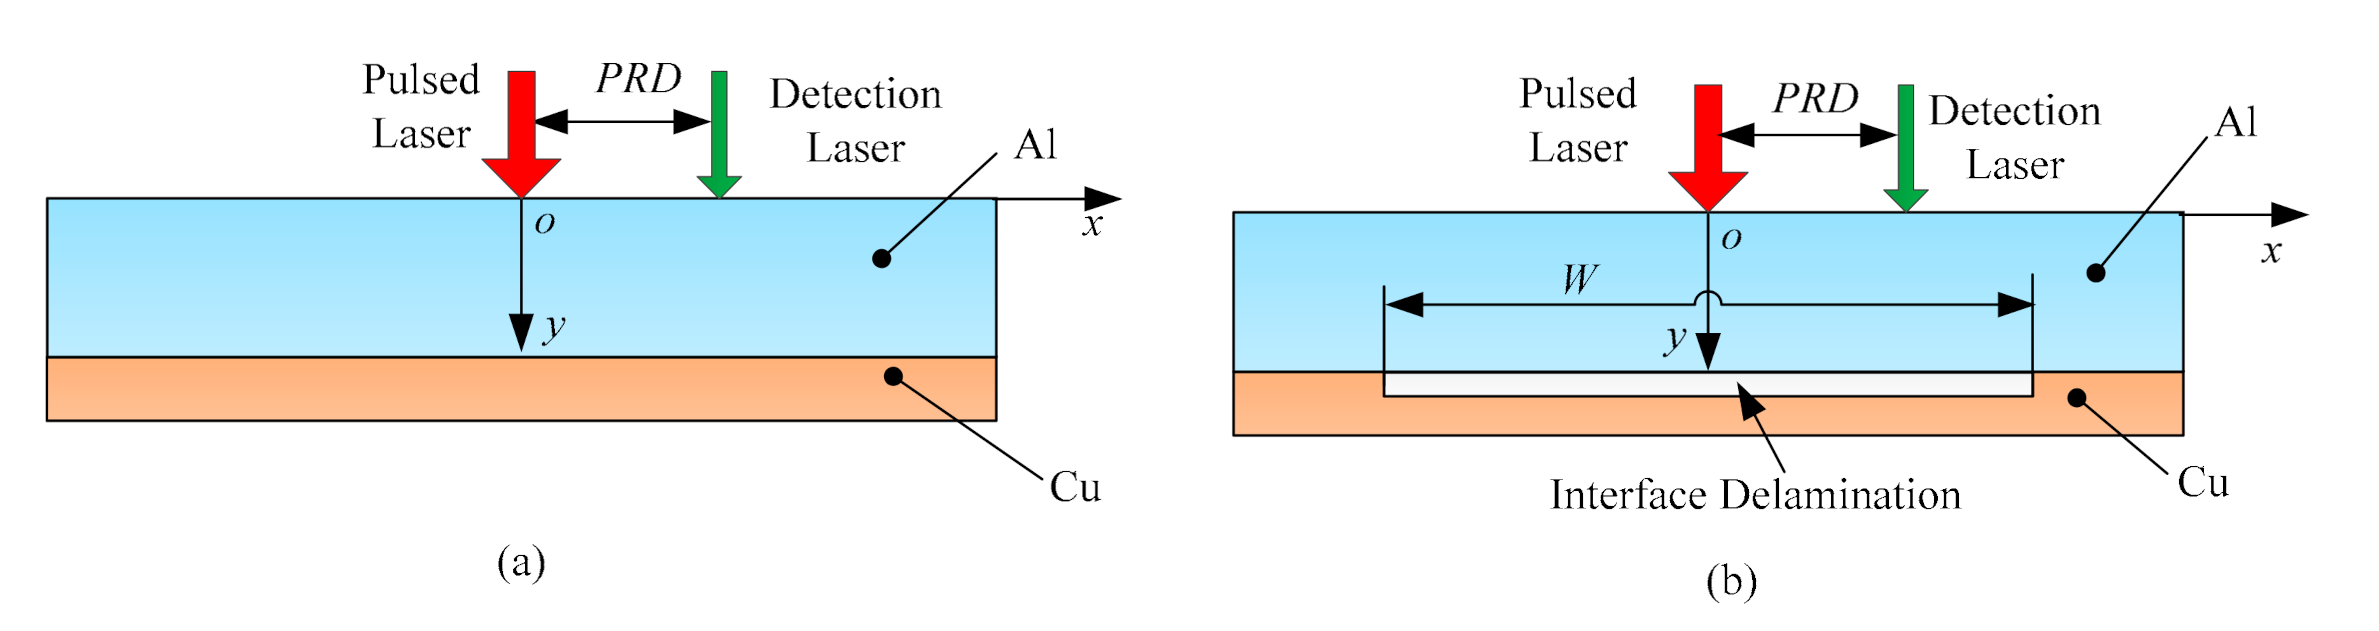
2.3. Finite Element Model

The coupled thermo-mechanical analysis module of the commercial finite element package ABAQUS/EXPLICIT was used to simulate the propagation of laser ultrasonic in the copper-aluminum bimetallic laminates. To reduce the calculation load, the two-dimensional plane finite element (FE) shell models with two layers were established to simulate the copper-aluminum bimetallic composites with various delamination defects. The dimension of each model was 50 mm × 3 mm, the aluminum layer thickness was 2.5 mm, and the copper layer thickness was 0.5 mm, as shown in Figure 1. The distance between the excitation point and the detection point is defined as PRD. Table 1 lists the thermo-physical parameters of copper and aluminum used in the numerical simulation. The ultrasonic wave was excited on the surface of the aluminum layer, rectangular cavities with dimensions of 6 mm × 0.01 mm and 2 mm × 0.01 mm, which were located on the copper layer side of the composite interface, were used to simulate delamination defects. The pulsed laser load was equivalent to a transient planar heat source (surface heat flux) and applied to the FE models to excite ultrasonic waves. The power density of surface heat flux was 5 MW/cm2, which is Gaussian distributed in space. The shape of the impulse was determined by Equation (4). The diameter of laser irradiation area was 1 mm, and the duration of a single laser pulse was 8 ns. The element length of pulsed laser irradiation area was 5 μm, and other areas were 10 μm, connected by the gradient grid. The element type used in the simulation was thermally coupled quadrilateral element with 4 nodes (CPE4RT). The time step was set to be 0.5 ns to guarantee the accuracy of simulation analysis. The simulation time was 5 μs.

3. Experimental Setup and Specimen

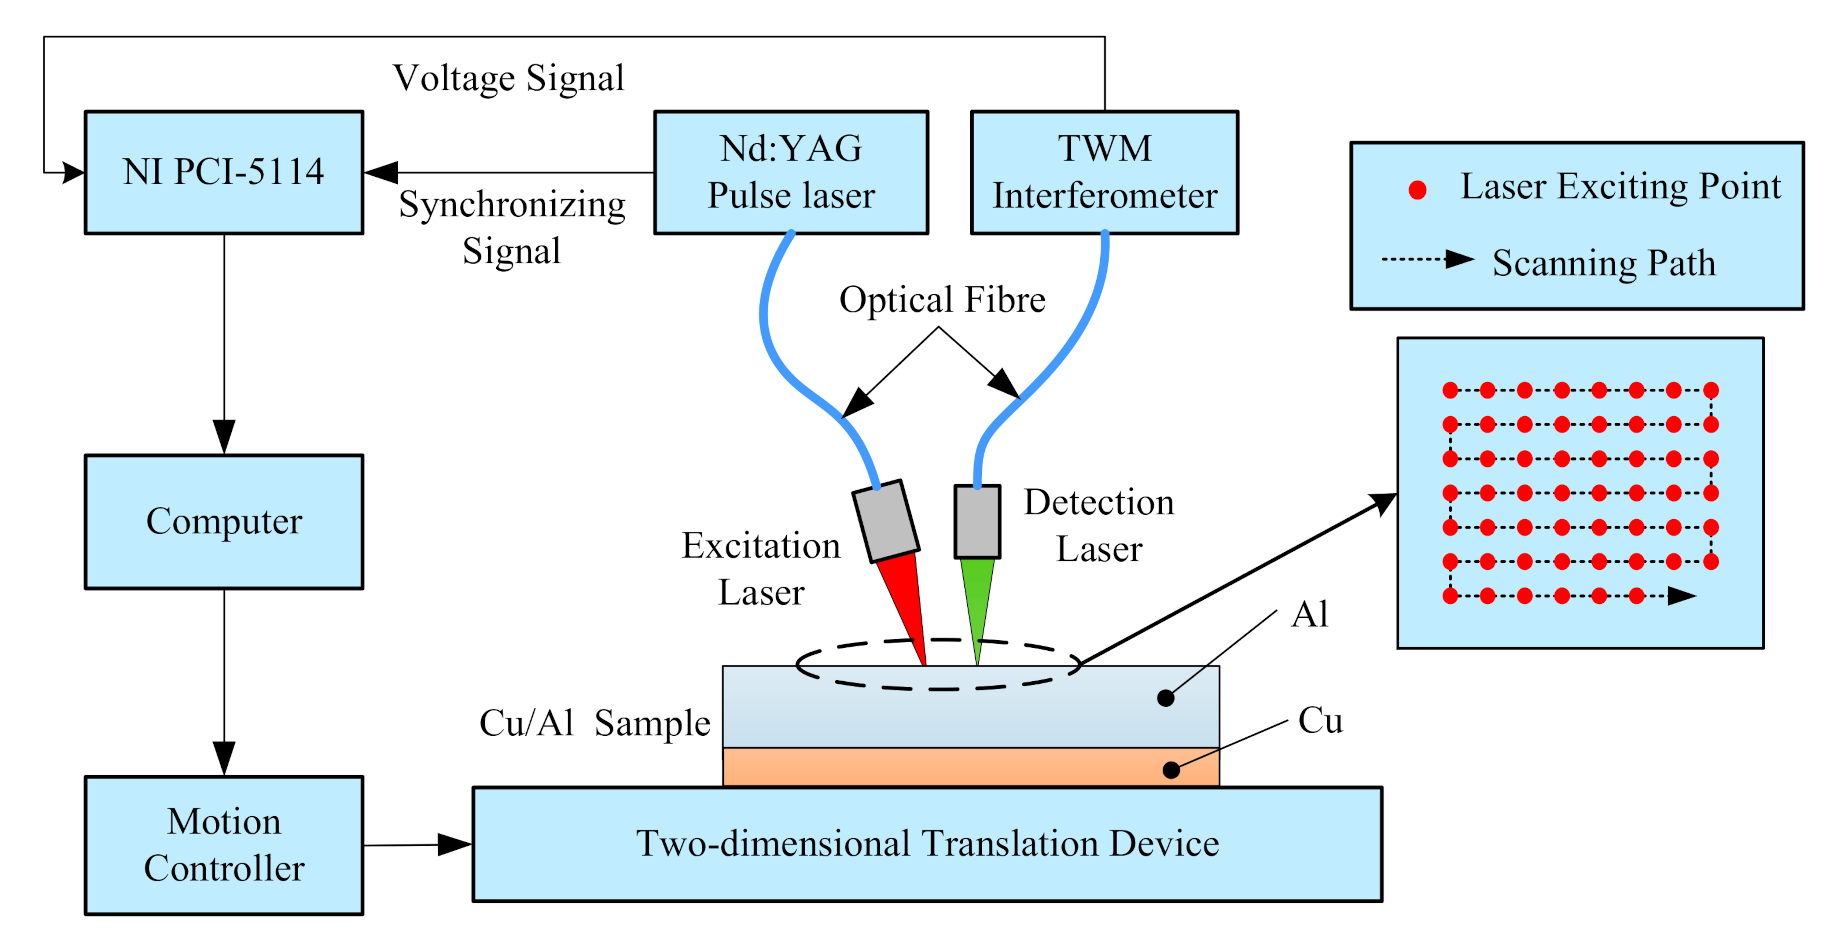
3.1. Experimental Setup

Figure 2 shows the schematic diagram of the laser ultrasonic testing system. A Q switched neodymium-doped yttrium aluminium garnet (Nd: YAG) pulsed laser (Ultra-50) manufactured by Quantel with pulse duration of 8 ns, laser spot diameter of 1 mm, wavelength of 1064 nm, and energy range of 0–50 mJ was used for generating ultrasonic waves. The ultrasound was detected by a two-wave mixing (TWM) laser interferometer system. The wavelength of the continuous laser in the interferometer system was 1550 nm and the maximum power was 2 W. The pulsed laser emitted a laser pulse to the surface of the aluminum layer to excite ultrasonic waves, and simultaneously sent a synchronous signal to the data acquisition card (NI PCI-5114) to trigger it to start collecting data. The interferometer converted the vibration displacement of the ultrasonic wave into a voltage signal and then outputted it to the data acquisition card. The data were filtered, saved, and displayed on the computer. The Butterworth filter was used for low-pass filtering to filter out high-frequency noise above 10 MHz. The computer sent instructions to the motion controller to control the movement of the two-dimensional platform and complete the detection of the designated area of the sample. During the experiment, the detection laser should be kept perpendicular to the sample surface to ensure that enough reflected light is received by the detection probe. The excitation probe was fixed on the precision displacement platform to set the relative position of the excitation point and the receiving point.

3.2. Cu/Al Bimetallic Composites Sample

The dimension of the Cu/Al bimetallic composites was 80 mm × 40 mm × 3 mm, which was produced by rolling cladding technology. The thickness of the aluminum layer was 2.5 mm and the thickness of the copper layer was 0.5 mm, as shown in Figure 3. The T-shaped groove was machined by wire-electrode cutting, which was cut vertically from the copper side, and after cutting to the composite interface, cut equal lengths symmetrically along the horizontal direction. The gap width of wire-electrode cutting was about 0.2 mm. The simulated delamination widths were 2 mm, 4 mm, 6 mm, 8 mm, and 10 mm, respectively.

4. Results and Discussion

4.1. Characteristics of Laser Ultrasonic Waves in a Cu/Al Bimetallic Composite

The acoustic impedance of aluminum was 1.7 × 10⁷ kg/(m2·s), and the acoustic impedance of copper was 4.16 × 10⁷ kg/(m2·s). When the ultrasonic wave propagated vertically from the aluminum layer to the composite interface, the sound pressure reflectance was (4.16 − 1.7)/(4.16 + 1.7) = 0.4198, and the sound pressure transmittance was 2 × 4.16/(4.16 + 1.7) = 1.4198. Figure 4 shows the propagation of ultrasonic waves in the Cu/Al bimetallic composite. When ultrasonic waves were incident obliquely from the aluminum layer to the composite interface, reflection, refraction, and mode conversion occurred at the interface. The propagation characteristics of laser ultrasonic in Cu/Al bimetallic composite were analyzed by the finite element method. A pulsed laser was used to excite ultrasound in the aluminum layer. The out-of-plane displacements extracted at nodes with 1.5 mm distances to the center of the pulsed laser spot are shown in Figure 5. The laser ultrasonic longitudinal waves (L) were fast and reached the composite interface first, generating reflected longitudinal waves (2L) and mode converted waves (LS). The longitudinal waves entered the copper layer through the composite interface and generated transmitted longitudinal waves, which were reflected by the bottom surface of the model and generated reflected longitudinal waves (2Lb). The laser ultrasonic transverse waves (S) propagated to the composite interface, generating reflected transverse waves (2S) and mode conversion waves (SL). The transverse waves entered the copper layer through the composite interface and generated transmitted transverse waves, which were reflected by the bottom surface of the model and generated reflected transverse waves (2Sb). The LS and SL had different propagation paths, but they reached the detection point at the same time. The five types of waveforms, including the 2L, 2S, 2Lb, 2Sb and LS-SL, were identified by the calculated wave velocity.

4.2. Interaction of Laser Ultrasonic Bulk Waves with a Delamination

In order to study the interaction of laser ultrasonic bulk waves with delamination defect, a two-dimensional finite element model was established. Figure 6 shows the distribution of the total velocity field simulated in models without and with delamination defect at 750 ns, where colors represent the amplitude of the vibration velocity of the particle. In Figure 6, through the analysis of wave velocity and propagation, five types of waveforms, including the L, S, 2L, 2Lb, and LS, are clearly identified. In Figure 6a, when the laser ultrasonic longitudinal waves (L) arrived at the composite interface, part of the energy was reflected, generating reflected longitudinal waves (2L) and mode conversion waves (LS). The other part of the longitudinal wave energy entered into the copper layer through the interface, continued to propagate forward, and reflected on the bottom surface, generating reflected longitudinal waves (2Lb). In Figure 6b, the laser ultrasonic longitudinal waves (L) could not pass through the delamination defect, the longitudinal waves (2Lb) reflected from the bottom surface disappeared, and the energy of reflected longitudinal waves (2L) and mode conversion waves (LS) increased significantly, because most of the energy of P-wave was reflected by interface separation defects.
The out-of-plane displacement curves of nodes 1 mm, 2 mm, 3 mm, and 4 mm away from the excitation point were extracted from the models with and without defects, as shown in Figure 7. In the time domain, the arrival time of 2L and 2Lb was close to the arrival time of Rayleigh wave, and it was difficult to distinguish them from aliasing. The displacements of LS-SL, 2S, 2Sb in a good model are higher than those in a model with interface separation, so they are salient features that can characterize delamination defects. The relative position of the detection point and the excitation point has obvious influence on the detection result, so choosing the appropriate PRD can improve the detection ability of defects.
To study the effect of the PRD on laser ultrasonic waveforms, the displacements of LS-SL, 2S, and 2Sb are extracted from the models with and without defects, as shown in Figure 8a–c. The displacements of the three modes of ultrasonic waves at the non-defective position were greater than that of the defective position. In Figure 8a, the increase of PRD had little influence on the displacement of 2L, but a peak appeared when PRD was 4.5 mm, which is due to the aliasing between 2L and Rayleigh waves. In Figure 8b,c, displacements of 2S and 2Sb in the models with and without defects increased with the increase of PRD. In Figure 8d, the displacement differences of LS-SL, 2S and 2Sb in the models without and with defects increased first and then decreased with the increase of PRD. When the displacement differences of LS-SL, 2S, and 2Sb reached the maximum, the PRDs were 0.5 mm, 1 mm, and 2 mm, respectively. When the PRD is too small, the detection efficiency is low, when the PRD is too large, the resolution is low. Considering the detection efficiency and resolution, the PRD was set to 2 mm.

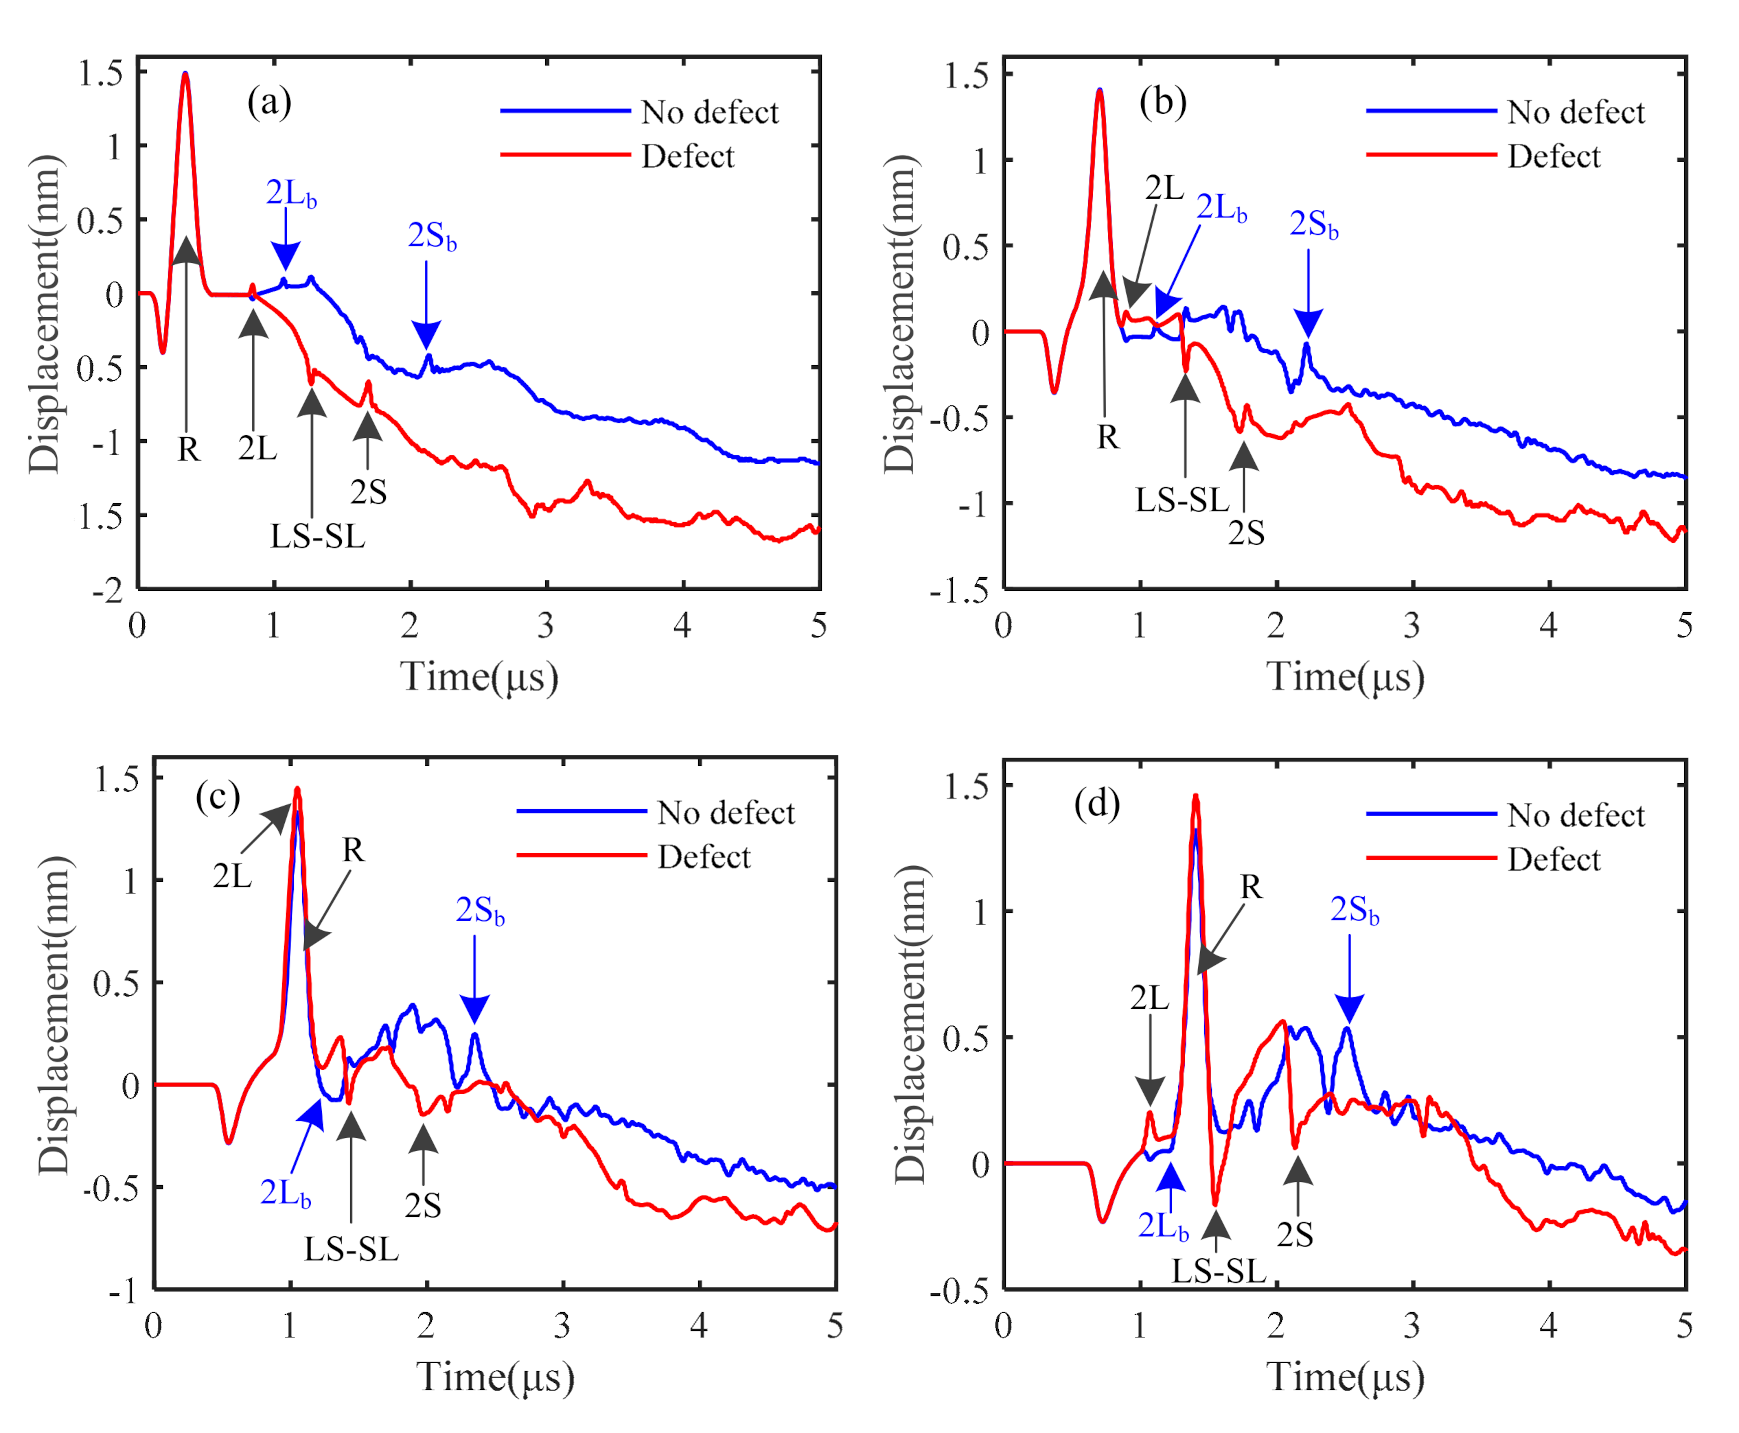
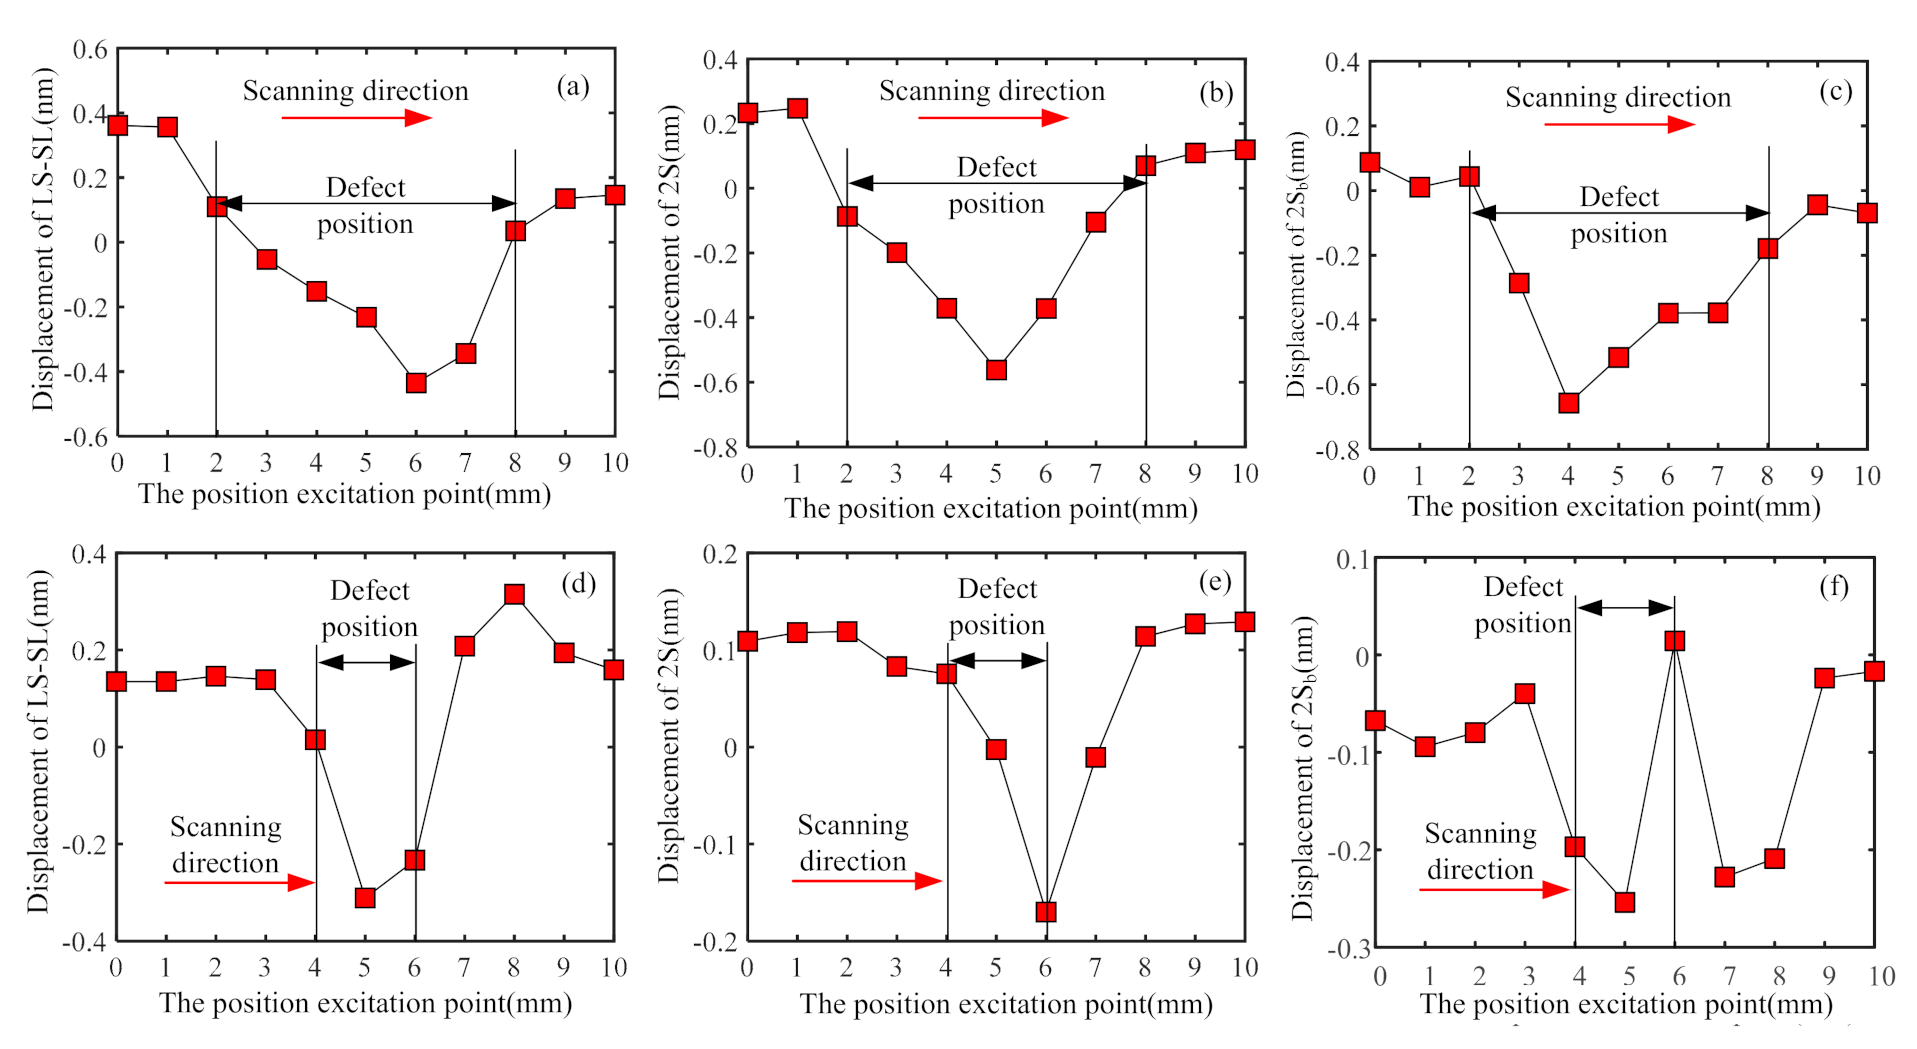
4.3. The Effect of Delamination Location on Laser Ultrasound

The effect of delamination location on laser ultrasound was studied by scanning laser source method and the schematic diagram is shown in Figure 9, where the PRD was set to 2 mm. The scanning step was 1 mm and the widths of the delamination were 6 mm and 2 mm. The variations of the displacements of LS-SL, 2S, and 2Sb are shown in Figure 10. In Figure 10a–c, LS-SL, 2S, and 2Sb could effectively detect the approximate position and size of the 6 mm wide delamination defect, and the minimum point of 2S was the center of the delamination defect. In Figure 10d,e, LS-SL and 2S could effectively detect the approximate position and size of the 2 mm wide delamination defect, and the minimum point of LS-SL was the center of the delamination defect. In Figure 10f, 2Sb was used to detect the 2 mm defect, and the results showed that there were two defects, indicating that the error of using 2Sb to detect small defects is larger. The reflected shear wave (2S) from the composite interface is very suitable for the detection of delamination defects in composite interfaces.

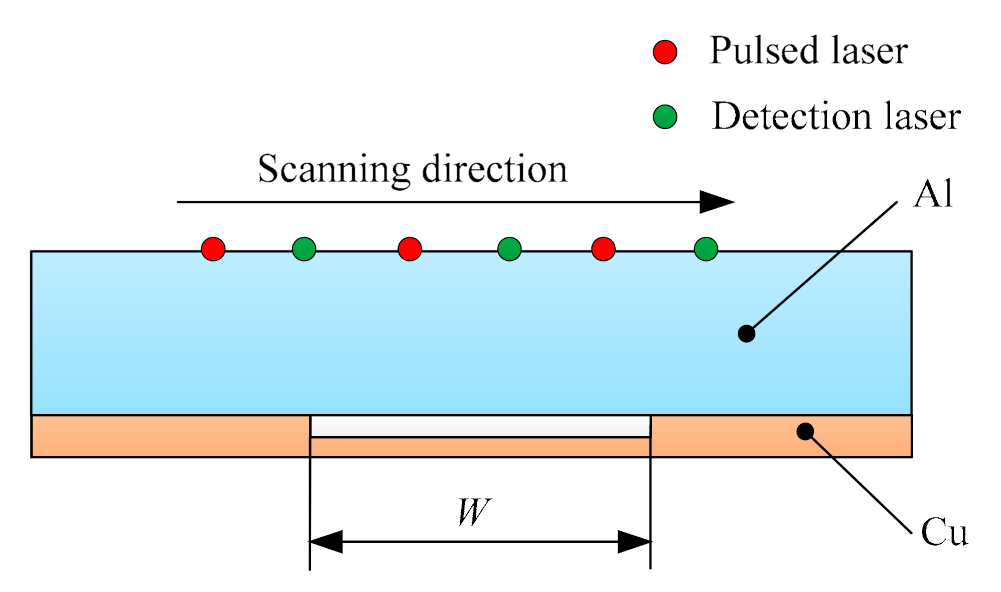
4.4. C-Scan Detection of the Cu/Al Bimetallic Specimen

During the experiment, the spot diameter of the excitation laser was set to 1 mm, and the excitation frequency of the excitation laser was set to 20 Hz. The spot diameter of the detection laser was about 0.2 mm, and the power was set to 0.9 W. The scanning step was set to 0.5 mm. The signal waveforms of laser ultrasonic experiment in the Cu/Al bimetallic specimen are shown in Figure 11, where LS-SL denotes mode conversion waves from composite interface, 2S denotes reflected transverse waves from delamination defect, and 2Sb denotes reflected transverse waves from the bottom of the specimen. After 1.3 μs, the amplitude of the laser ultrasonic signal in the defective region was significantly higher than that in the non-defective region. The ultrasonic signal waveforms obtained in the experiment are in good agreement with the numerical simulation waveforms in Figure 7b.
In Figure 12, the C-scan imaging of the delamination in the Cu/Al bimetallic specimen based on reflected transverse waves (2S) from the composite interface was realized. Figure 13 shows the variations of amplitude at the position of the white dotted line in Figure 12. The fabricated delamination can be clearly seen in the C-scan image, where delamination defects are labeled as w2, w4, w6, w8, and w10. The position and width of the delamination defects in the C-scan image are consistent with the T-shaped grooves machined by wire-electrode cutting in the specimen in Figure 3.

5. Conclusions

Laser ultrasonic bulk waves were used to detect the interface separation in Cu/Al bimetallic composites. The propagation process of laser ultrasonic bulk waves in Cu/Al bimetallic composites and the influence of composite interface on the propagation of bulk waves were analyzed by the finite element method. The interaction between ultrasonic bulk waves in different modes and delamination defects was analyzed, and the influence of PRD on ultrasonic bulk waves in different modes was studied. The results of finite element analysis showed that the reflected shear wave from the composite interface is very suitable for the detection of delamination defects in composite interfaces. The time-domain waveforms collected in the experiment have similar trends and characteristics with the waveforms simulated by finite element method. Therefore, the reflected shear wave from the composite interface can be used as a reliable feature to detect the delamination in Cu/Al bimetallic composites. The position and width of the delamination defects in the C-scan image are consistent with the T-shaped grooves machined by wire-electrode cutting in the specimen. Therefore, the detection method based on laser ultrasonic bulk waves can effectively detect the delamination defects in Cu/Al bimetallic composites, and its non-contact characteristics make it possible to be used for on-line inspection in the rolling process of laminated plates.

Author Contributions

B.J. conducted most of the simulation work, implemented the experiments, analyzed the data, and wrote the paper. Q.Z. supervised the project and discussed the results with B.J., J.C. prepared the experimental setup and specimen, and carried out the experiments. B.Z. and L.Z. reviewed and corrected the manuscript. All authors have read and agreed to the published version of the manuscript.

Funding

This research was funded by the National Natural Science Foundation of China (grant No. 51575040), the Natural Science Foundation of Beijing Municipality (grant No. 3182008), the Natural Science Foundation of Beijing Municipality (grant No. 3202019), and the Fundamental Research Funds for the Central Universities Project (grant No. FRF-TP-19-039A2Z).

Conflicts of Interest

The authors declare no conflict of interest.

References

  1. Lee, J.H.; Bae, D.H.; Chung, W.S.; Kim, K.H.; Cho, Y.-R. Effects of annealing on the mechanical and interface properties of stainless steel/aluminum/copper clad-metal sheets. J. Mater. Process. Technol. 2007, 187, 546–549. [Google Scholar] [CrossRef]
  2. Jin, J.Y.; Hong, S.I. Effect of heat treatment on tensile deformation characteristics and properties of Al3003/STS439 clad composite. Mater. Sci. Eng. A 2014, 596, 1–8. [Google Scholar] [CrossRef]
  3. Zhang, Q.; Li, S.; Liu, J.; Wang, Y.; Zhang, B.; Zhang, L.-Y. Study of a bimetallic interfacial bonding process based on ultrasonic quantitative evaluation. Metals 2018, 8, 329. [Google Scholar] [CrossRef] [Green Version]
  4. Xia, C.Z.; Li, Y.; Wang, J.; Ma, H.J. Microstructure and phase constitution near interface of Cu/Al vacuum brazing. Mater. Sci. Technol. 2007, 23, 815–818. [Google Scholar] [CrossRef]
  5. Xue, P.; Xiao, B.L.; Wang, D.; Ma, Z.Y. Achieving high property friction stir welded aluminium/copper lap joint at low heat input. Sci. Technol. Weld. Join. 2011, 16, 657–661. [Google Scholar] [CrossRef]
  6. Lee, K.S.; Yong-Nam, K. Solid-state bonding between Al and Cu by vacuum hot pressing. Trans. Nonferrous Met. Soc. China 2013, 23, 341–346. [Google Scholar] [CrossRef]
  7. Jing, Y.-A.; Qin, Y.; Zang, X.; Shang, Q.; Hua, S. A novel reduction-bonding process to fabricate stainless steel clad plate. J. Alloys Compd. 2014, 617, 688–698. [Google Scholar] [CrossRef]
  8. Karabutov, A.A.; Podymova, N. Quantitative analysis of the influence of voids and delaminations on acoustic attenuation in CFRP composites by the laser-ultrasonic spectroscopy method. Compos. Part B Eng. 2014, 56, 238–244. [Google Scholar] [CrossRef]
  9. Lee, Y.-J.; Lee, J.-R.; Ihn, J.-B. Composite repair patch evaluation using pulse-echo laser ultrasonic correlation mapping method. Compos. Struct. 2018, 204, 395–401. [Google Scholar] [CrossRef]
  10. Geetha, G.K.; Mahapatra, D.R.; Gopalakrishnan, S.; Hanagud, S. Laser Doppler imaging of delamination in a composite T-joint with remotely located ultrasonic actuators. Compos. Struct. 2016, 147, 197–210. [Google Scholar] [CrossRef]
  11. Yu, J.; Zhang, D.; Li, H.; Song, C.; Zhou, X.; Shen, S.; Zhang, G.; Yang, Y.; Wang, H. Detection of internal holes in additive manufactured Ti-6Al-4V part using laser ultrasonic testing. Appl. Sci. 2020, 10, 365. [Google Scholar] [CrossRef] [Green Version]
  12. Masserey, B.; Raemy, C.; Fromme, P. High-frequency guided ultrasonic waves for hidden defect detection in multi-layered aircraft structures. Ultrasonics 2014, 54, 1720–1728. [Google Scholar] [CrossRef] [PubMed] [Green Version]
  13. Bychkov, A.; Simonova, V.; Zarubin, V.; Cherepetskaya, E.; Karabutov, A. The progress in photoacoustic and laser ultrasonic tomographic imaging for biomedicine and industry: A review. Appl. Sci. 2018, 8, 1931. [Google Scholar] [CrossRef] [Green Version]
  14. Chen, S.-L. Review of Laser-Generated Ultrasound Transmitters and Their Applications to All-Optical Ultrasound Transducers and Imaging. Appl. Sci. 2016, 7, 25. [Google Scholar] [CrossRef]
  15. Li, J.; Lu, Y.; Lee, Y.F. Debonding detection in CFRP-reinforced steel structures using anti-symmetrical guided waves. Compos. Struct. 2020, 253, 112813. [Google Scholar] [CrossRef]
  16. Zima, B.; Kędra, R. Reference-free determination of debonding length in reinforced concrete beams using guided wave propagation. Constr. Build. Mater. 2019, 207, 291–303. [Google Scholar] [CrossRef]
  17. Sikdar, S. Multi-level nondestructive analysis of joint-debond effects in sandwich composite structure. Polym. Test. 2019, 80, 106149. [Google Scholar] [CrossRef]
  18. Ng, C.T.; Mohseni, H.; Lam, H.-F. Debonding detection in CFRP-retrofitted reinforced concrete structures using nonlinear Rayleigh wave. Mech. Syst. Signal Process. 2019, 125, 245–256. [Google Scholar] [CrossRef] [Green Version]
  19. Green, R.E. Non-contact ultrasonic techniques. Ultrasonics 2004, 42, 9–16. [Google Scholar] [CrossRef]
  20. Alvarez-Arenas, T.G.; Camacho, J.; Fritsch, C. Passive focusing techniques for piezoelectric air-coupled ultrasonic transducers. Ultrasonics 2016, 67, 85–93. [Google Scholar] [CrossRef]
  21. Lévesque, D.; Kruger, S.; Lamouche, G.; Kolarik, R.; Jeskey, G.; Choquet, M.; Monchalin, J.-P. Thickness and grain size monitoring in seamless tube-making process using laser ultrasonics. NDT E Int. 2006, 39, 622–626. [Google Scholar] [CrossRef] [Green Version]
  22. Hutchinson, B.; Moss, B.; Smith, A.; Astill, A.; Scruby, C.; Engberg, G.; Bjorklund, J. Online characterisation of steel structures in hot strip mill using laser ultrasonic measurements. Ironmak. Steelmak. 2002, 29, 77–80. [Google Scholar] [CrossRef]
  23. Sano, M.; Ohara, K.; Shimoda, N.; Tsugeno, M. Measurement of material properties of steel sheets using laser ultrasonic technology. Procedia Eng. 2014, 81, 1414–1419. [Google Scholar] [CrossRef] [Green Version]
  24. Zhang, K.; Li, S.; Zhou, Z. Detection of disbonds in multi-layer bonded structures using the laser ultrasonic pulse-echo mode. Ultrasonics 2019, 94, 411–418. [Google Scholar] [CrossRef]
  25. Lee, J.; Burger, C. Finite element modeling of laser-generated Lamb waves. Comput. Struct. 1995, 54, 499–514. [Google Scholar] [CrossRef]
  26. Liu, P.; Nazirah, A.W.; Sohn, H. Numerical simulation of damage detection using laser-generated ultrasound. Ultrasonics 2016, 69, 248–258. [Google Scholar] [CrossRef]
  27. Sun, G.; Zhou, Z. Non-contact detection of delamination in layered anisotropic composite materials with ultrasonic waves generated and detected by lasers. Optik 2016, 127, 6424–6433. [Google Scholar] [CrossRef]
Figure 1. Laser ultrasound in copper-aluminum composites: (a) a model without defects; (b) a model with delamination.
Applsci 11 00636 g001
Figure 2. Schematic diagram of experimental device.
Applsci 11 00636 g002
Figure 3. Cu/Al bimetallic composites sample.
Applsci 11 00636 g003
Figure 4. Reflection, refraction, and waveform conversion of ultrasonic wave oblique incident on the interface: (a) Oblique incidence of longitudinal waves; (b) oblique incidence of transverse wave.
Applsci 11 00636 g004
Figure 5. Laser ultrasonic reflected waves in a model without defect (PRD = 1.5 mm).
Applsci 11 00636 g005
Figure 6. The total velocity field simulated in Cu/Al bimetallic composites with and without delamination defects at 0.75 μs: (a) Without defect; (b) delamination defect width of 6 mm.
Applsci 11 00636 g006
Figure 7. Comparison of laser ultrasonic waves in a model without defect and a model with delamination defect with different PRDs: (a) 1 mm, (b) 2 mm, (c) 3 mm, and (d) 4 mm.
Applsci 11 00636 g007
Figure 8. Comparison of displacement of ultrasonic waves in different modes in good model and a model with delamination: (a) LS-SL, (b) 2S, (c) 2Sb, and (d) Displacement differences of the LS-SL, 2S, and 2Sb in the models without and with defects.
Applsci 11 00636 g008
Figure 9. The schematic of scanning laser source method.
Applsci 11 00636 g009
Figure 10. Variation of displacement of ultrasonic waves in different modes after interacting with defects of different sizes. (a) W = 6 mm, LS-SL, (b) W = 6 mm, 2S, (c) W = 6 mm, 2Sb, (d) W = 2 mm, LS-SL, (e) W = 2 mm, 2S, and (f) W = 2 mm, 2Sb.
Applsci 11 00636 g010
Figure 11. Experimental signals of laser ultrasound in the Cu/Al bimetallic specimen.
Applsci 11 00636 g011
Figure 12. The C-scan image based on reflected transverse waves (2S) from the composite interface.
Applsci 11 00636 g012
Figure 13. The C-scan image based on reflected transverse waves (2S) from the composite interface.
Applsci 11 00636 g013
Table 1. The thermo-physical parameters of Cu and Al used in the finite element (FE) models.
Physical PropertiesCuAl
Thermal conductivity (W m−1 K−1)386.4209
Density (g cm−3)8.962.71
Poisson’s ratio0.3260.33
Thermal expansion coefficient (10−6 K−1)17.223.6
Elastic Young’s modulus (GPa)11968
Specific heat (J kg−1 K−1)394880
Publisher’s Note: MDPI stays neutral with regard to jurisdictional claims in published maps and institutional affiliations.

