Featured Application
This paper’s results describe the variation in the ecological and energy parameters of a spark ignition engine running on a mixture of biogas and hydrogen. The data can be applied in further biogas studies involving combustion process optimization, spark timing control, biogas and hydrogen mixtures, and hydrogen influence on the combustion process and exhaust gas composition. Additionally, the data are useful in practice when modifying compress natural gas engines to work using biogas or when adding hydrogen to reduce emissions and increase engine efficiency.
Abstract
The global policy solution seeks to reduce the usage of fossil fuels and greenhouse gas (GHG) emissions, and biogas (BG) represents a solutions to these problems. The use of biogas could help cope with increased amounts of waste and reduce usage of fossil fuels. Biogas could be used in compressed natural gas (CNG) engines, but the engine electronic control unit (ECU) needs to be modified. In this research, a spark ignition (SI) engine was tested for mixtures of biogas and hydrogen (volumetric hydrogen concentration of 0, 14, 24, 33, and 43%). In all experiments, two cases of spark timing (ST) were used: the first for an optimal mixture and the second for CNG. The results show that hydrogen increases combustion quality and reduces incomplete combustion products. Because of BG’s lower burning speed, the advanced ST increased brake thermal efficiency (BTE) by 4.3% when the engine was running on biogas. Adding 14 vol% of hydrogen (H2) increases the burning speed of the mixture and enhances BTE by 2.6% at spark timing optimal for CNG (CNG ST) and 0.6% at the optimal mixture ST (mixture ST). Analyses of the rate of heat release (ROHR), temperature, and pressure increase in the cylinder were carried out using utility BURN in AVL BOOST software.
1. Introduction
The transport sector is facing the challenge of reducing emissions, while demand for transport is increasing. As several European Commission reports state, the road transport is the second largest source of carbon dioxide (CO2) in the European Union (EU), accounting for around 25% of total CO2 emissions [1,2]. Without ambitious steps towards decarbonization, the EU-2016 Basic Standard states that by 2050, road transport may account for the largest share of CO2 emissions [3]. Therefore, European emission reduction targets obligates a 60% reduction in greenhouse gas emissions by 2050 compared with 1990 and a 20% reduction in emissions by 2030 compared to 2008 [4]. To achieve these targets, further efforts have been made in the research and development of clean and alternative fuels, such as compressed natural gas (CNG) [5], biogas [6], biodiesel [7], rapeseed oil [8], alcohols [9] and hydrogen (H2) [10,11], which are considered to be cleaner and more environmentally friendly when compared to conventional fuels. Biogas is one of the most promising types of biofuel with the potential to reduce greenhouse gas emissions and use of fossil fuels. Biogas is produced by anaerobic digestion of organic compounds, such as agricultural wastes, municipal waste, animal waste, green waste, or food waste. The three main components of biogas (BG) are methane (CH4), carbon dioxide, and nitrogen (N2). However, it may contain traces of hydrogen sulfide (H2S), hydrogen, ammonia (NH3), oxygen (O2), and carbon monoxide (CO) [12]. A more detailed composition of biogas is given in Table 1.

Table 1.
Biogas composition depending on raw material [12].
As shown in Table 1, if the biogas is produced in a sewage digester, the concentration of the harmful hydrogen sulfide is close to zero. In other cases, for example, those described in [12,13], the concentration of H2S could reach up to 400 ppm and cause corrosion (reaction with water leads to formation of sulfuric acid), the formation of Sulphur oxides (SOX) as a result of combustion, and the formation of combustible mixtures (4.5–45.0 vol%. H2S in air). In Europe, according to Eurostat 2016, more than 9.67 million tons of raw material for biogas production in the sewage digester were produced, and more than 4.82 million tons were produced in Italy alone. The data include only sludge and liquid waste from waste treatment. Europe produced in total more than 680 million tons of possible feedstock for biogas production [14]. Depending on the used raw materials, biogas production efficiency can variate. As shown in Table 2, one kilogram of wheat straws can produce 0.483 cubic meters of biogas, but different feedstocks provide various results.
Table 2.
Amount of biogas produced from one kilogram of feedstock.
Converting all feedstocks to biogas with a ratio of 0.1 kg of feedstock per cubic meter of biogas would produce 68 Gm3 of biogas or more than 58 Mtoe (total oil equivalent) [25]. Data from EurObserv’ER 2017 suggest that in 2016, twenty-eight European Union (EU-28) countries used only a part of their feedstock to produced just under 16.1 Mtoe of biogas [27]. However, every year, the number of biogas plants increases. The European Banking Authority (EBA) Annual Report 2019 states that by the end of 2018, 18,202 biogas plants were operating in Europe after a decade of sustained growth, which was largely stable during periods of political turmoil in different countries [28]. Statistic data demonstrating the increasing number of biogas plants in the European Union and distribution by countries are shown in Figure 1.
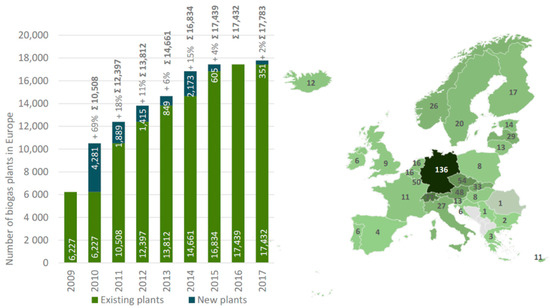
Figure 1.
(a) Change in the number of biogas plants in Europe. (b) Distribution of biogas plants per 1 million people [29].
Due to the increasing number of biogas plants and many possible raw materials, biogas can be used as a green energy source for the use of electricity and heat and as a transport fuel.
Biogas power plants are often located near the sources of raw materials needed for biogas production (farms, slaughterhouse, and water or waste treatment plants) that are not included in the natural gas pipeline network. In this case, the produced biogas is typically used in heavy-duty cogeneration plants located near biogas plants to generate electricity and heat [30,31]. However, there are many opportunities in the market to transport biogas and connect local manufacturers with potential consumers. Production of electricity becomes less demanding of power, and smaller stationary engines can be used. Therefore, opportunities arise to use biogas for generating electricity in heavy-duty and smaller engines. Replacing fossil fuels with biogas would reduce greenhouse gas emissions, because CO2 emissions of biogas (made from biomass) combustion are considered as biogenic and calculated to be neutral with regard to their impact on the climate [32,33]. Researchers also describes a reduction in sulfur, nitrogen, and carbon compounds in exhaust gasses when changing fossil fuel to biogas [34].
Standard internal combustion after the necessary changes could be adapted to use biogas, which can be used as a renewable energy source in a spark ignition [35] or compression ignition [36] (CI) internal combustion engine. As described by Verma et al. [37], due to the higher autoignition temperature, biogas cannot be used as a standalone fuel for CI engines. Therefore, biogas is mostly used in a dual-fuel approach with diesel or biodiesel [34,38]. Because of higher autoignition temperature and higher antiknock index, the biogas-fueled spark ignition (SI) engine can have a high compression ratio (CR), which enhances the thermal efficiency of the engine [39]. Moreover, biogas has the potential for complete replacement of fuel in SI engines. However, it is highly recommended that the exact CR, air–fuel ratio, and ignition timing be maintained in order to achieve low emissions and the best fuel conversion efficiency [40].
The presence of carbon dioxide in biogas reduces engine performance and brake thermal efficiency, but the compression ratio is directly proportional to these parameters [41]. Due to the higher compression ratios of CI engines and high antiknock index of biogas, CI engines are often converted into an SI biogas engine by replacing its injectors with spark plugs and modifying the pistons [42,43]. In this case, increased CR leads to higher engine performance and brake thermal efficiency (BTE). It was also found by Porpatham and his team [44] that at higher compression ratios, engines operated with biogas do not lose power in their operating CR range, and at CR 13 a brake thermal efficiency of 25% was reported in the full load and wide open throttle (WOT) condition. Increasing the compression ratio for an SI engine running on biogas at WOT conditions improves brake power output and brake thermal efficiency, and reduces brake-specific fuel consumption (BSFC) [41]. Based on the experimental results, where SI biogas engines with different CR values between 10 and 14 were tested, the optimally achievable engine performance, BSFC, and BTE under WOT conditions were observed at a compression ratio of 12 [45].
Due to different biogas feedstock and anaerobic process condition, biogas composition varies and has a different effect on the tested engine. Experiments showed that for the SI biogas engine, increasing methane concentration from 55 to 80 vol% increases the burning rate and temperature in the cylinder [46]. Higher compression ratios of 13 and the decreasing CO2 concentration from 41 to 20 vol% confirmed that a low CO2 concentration increases the pressure in the cylinder and flame speed, thereby increasing the thermal efficiency and performance of the engine [47]. Increasing CO2 concentration by more than 50 vol% significantly retards ignition timing and reduces burning rate [48].
To increase the efficiency of the combustion process, various additives or fuel blends are used [49,50]. Researchers found that adding titanium dioxide (TiO2) nanoparticles could increase engine BTE by 17%. However, before using TiO2, more detailed studies of the long-term impact on engine component life are needed [51]. Therefore, often liquid or gaseous biofuels are used to increase BTE and reduce exhaust emissions. Researchers from various research institutes tested compressed natural gas (CNG), CH4 [52], methanol, ethanol, butanol [53], acetone-n-butanol-ethanol, isopropanol-n-butanol-ethanol [54] and other alternative fuels. All of the fuels that contain carbon or hydrocarbons (HC) in a molecular composition will form CO2 after combustion; therefore, the use of hydrogen is investigated. As stated by Sing [55] and Zhao [56], adding hydrogen to a biogas engine increases the burning rate and extends the flammability range, and 10 vol% hydrogen causes a significant increase in burning stability. However, further increase in hydrogen concentration does not have such a noticeable effect on burning stability [57]. The addition of hydrogen increases the total heat transfer of the fuel by up to 20–30% when adding 30 vol% H2 [58]. Testing biogas and hydrogen mixtures showed that H2 reduces combustion duration but, at the same time, increases the possibility of detonation, and the ignition advance angle should be retarded [59].
Biogas, which contains inert CO2, featured lower BTE, a decrease in engine power, and extended combustion duration when compared to an identical SI engine running on natural gas [60]. Nevertheless, biogas is an eligible fuel, especially for stationary engines, because it is made from renewable sores. Moreover, hydrogen addition could increase the lower heat value (LHV) of the biogas and possibly the BTE of the engine. Therefore, the purpose of this paper is to investigate the influence of hydrogen addition on the energy and environmental performance of an SI biogas engine. In this study, a spark ignition engine running on a biogas–hydrogen mixture was tested. The biogas contained of 62 vol% CH4 and 38 vol% CO2. The maximum hydrogen content in the mixture was 43 vol%. The composition and LHV of all mixtures are shown in Table 3. Two different strategies of ignition timing were used.
Table 3.
Fuel composition, marking of mixtures and spark timing.
2. Materials and Methods
Experimental tests were carried out using specialized measuring equipment and an SI engine adapted for gaseous fuels. An overview of the engine test bench and measuring equipment is presented in Figure 2. The main components of the experimental set up include the following:
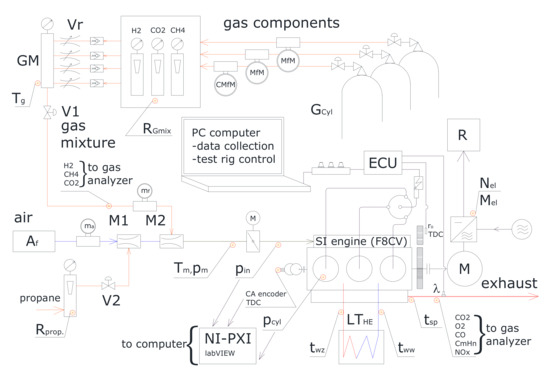
Figure 2.
The experimental test rig [56].
- A naturally aspirated spark engine with three cylinders, a capacity of 796 cm3, and a compression ratio equal to 9.3. The engine control and power supply systems were modified for the use of biogas and hydrogen mixtures. The engine was tested at 1500 rpm.
- An asynchronous electric motor with a power take-off system, capable of operating as electric motor (starter) and generator (load). The main purpose of this motor is to apply load on the selected point of the operating cycle. All experiments were conducted at Brake Mean Effective Pressure (BMEP) of 0.42 MPa.
- High-pressure cylinders with methane, carbon dioxide, and hydrogen equipped with dual-stage gas regulators.
- A measuring devices for flow rate, temperature, and pressure evaluation, including rotameters, Coriolis- and conductivity-type flow meters, manometers, and thermocouples.
To maintain stable temperature of the engine during all experiments, an additional cooling system with two plate heat exchangers was added to the engine test bench. The control thermostat, regulating the flow of the coolant, was located in the engine cooling system’s primary circuit. The secondary side of the heat exchanger was equipped with a control valve, which regulates amount of heat transferred to the local central heating system. In this way, the engine temperature was maintained in the range of 80 ± 5 °C.
During the experiment, the operation of the engine was controlled using a programmable engine electronic control unit (ECU). The used device has the capability to program and monitor engine operational parameters, i.e., preprogrammed spark timing, maps, and mixture compositions. Two types of spark timing (ST) were used for experiments with the combustion of biogas and hydrogen mixtures: the first with values corresponding to the optimal combustion of CNG (CNG ST), and the second with values adapted to the optimal combustion of a mixture of biogas and hydrogen (mixture ST) (Table 3).
ST values for the mixture were chosen according to the optimal peak in-cylinder pressure position. The composition of the mixture was controlled using the lambda sensor signal and by adjusting the flow of the gas mixture to the engine inlet. During the tests, the replacement of the biogas mixture was stored in high-pressure bottles. The gas fuel was supplied to the engine through the gas mixer.
The flow of each gaseous component (CH4, CO2, and H2) was manually adjusted with a pressure regulator to obtain the required biogas mixture composition and value of the fuel–air ratio during the combustion process. The value of the fuel–air ratio was controlled by a wideband lambda sensor. The volumetric flows of the gases were measured by rotameters equipped to the temperature and pressure sensor. Additionally, the flow of each gas component was measured using Coriolis—(for CO2) and conductivity-type (for CH4 and H2) mass flow meters. The exhaust gas composition measured directly from the engine outlet without any aftertreatment system was measured by using a CAPELEC gas analyzer type CAP 3201. The gas analyzer parameters are listed in Table 4.
Table 4.
Measurement range and accuracy of the exhaust gas analyzer.
The in-cylinder pressure was measured with a type 6117BF17 piezoelectric pressure sensor, integrated in the spark plug and manufactured by KISTLER. The signal from the pressure transducer was amplified by using a type 5039A212 charge amplifier. Since piezoelectric pressure transducers only allow the measurement of pressure to increase, it was also necessary to measure the absolute pressure in the engine intake manifold in order to relate the in-cylinder pressure to a known absolute pressure value. For this purpose, a type 4045A1 KISTLER piezoresistive transducer, connected with a type 4618A0 amplifier, was used. The voltage pressure signals from the in-cylinder and the intake pressure transducers were sampled and processed by a measuring system containing two type PXI-6133 and PXI-6602 cards from NATIONAL INSTRUMENTS. Measurements were performed with a resolution of 1024 measurement points per crankshaft revolution. In addition, the encoder was fitted with a position marker to indicate the position of the piston in the cylinder. Each set of measurement consisted of 100 consecutive engine cycles. The collected air and fuel consumption data and in-cylinder pressure were used to analyze the combustion parameters with utility BURN in AVL BOOST software.
3. Results
During all experiments, the engine was operated at 1500 rpm, BMEP 0.42 MPa, and a stoichiometric mixture of air and fuel was determined. The obtained results were compared with the biogas results. The addition of hydrogen, at first, reduced brake-specific energy consumption (BSEC) in both ST situations (Figure 3). Adding 14 vol% hydrogen increased the mixture’s LHV by 9.8% and increased the combustion speed (the duration of the 50% mass burn fraction (MBF) was reduced by 21.7% when ST was set to 28 crank angle degrees before top-dead-center (CAD BTDC) and by 45.9% when ST was 36 CAD BTDC). Because of the slight increase in the LHV of the mixture and the enhanced combustion, the BSEC decreased by 2% with spark timing optimal for CNG (CNG ST) and by 0.7% with spark timing optimal for the mixture (mixture ST). A further increase in the hydrogen concentration caused the BSEC to increase by 0.1, 3.0, and 4.1%, when setting ST to 28 CAD BTDC and by 2.3, 4.1, 6.7 with optimal mixture ST conditions. A further increase in hydrogen concentration caused an increase in the LHV of the mixture and the amount of energy one engine cycle. Furthermore, the low density of hydrogen deteriorated engine volumetric efficiency; thus, fuel energy was used less efficiently, and this translates into an increase in BSEC.
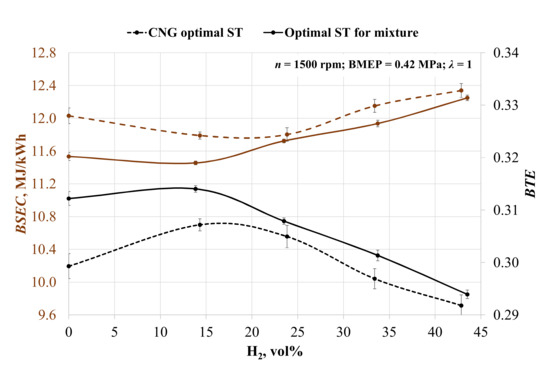
Figure 3.
Change in the brake-specific energy consumption (BSEC) and brake thermal efficiency (BTE) depending on the volumetric fraction of hydrogen and spark timing.
The engine running on biogas with adjusted ST increased the brake thermal efficiency by 4.3%, because biogas has a lower burning speed than CNG and needs advanced ignition timing. The addition of hydrogen increased the burning speed of the mixture, and only 14 vol% H2 enhanced BTE by 2.6% at CNG ST and by 0.6% at the mixture ST. A further increase in hydrogen reduced brake thermal efficiency because of the decreasing burning process stability and volumetric efficiency. The increase in 24 vol% of H2 reduced BTE by 0.7% at CNG ST and by 1.9% at the mixture ST; 33 vol% of H2 reduced BTE by 3.3% at CNG ST and 4.0% at the mixture ST, and 43 vol% of hydrogen reduced BTE by 5.0% at CNG ST and by 6.4% at the mixture ST.
The environmental parameters in Figure 4 show that the increase in hydrogen concentration leads to increased emissions of nitrogen oxides (NOx), because hydrogen improves the quality of the combustion process, as confirmed by other researchers [61]. Without ST adjustment, NOx emissions rose by 79.3, 113.8, 135.3 and 153.9% with each increase in hydrogen concentration. This is because of the increase in cylinder pressure and the temperature of the burning fuel mixture with higher LHV [62]. Figure 4 also confirms the increase in the in-cylinder temperature, because the addition of hydrogen increases the burn rate of fuel and less burning fuel passes through the exhaust valve. The exhaust gas temperature dropped by 5.9% when engine was running on the 57BG43H2 (57% of biogas and 43 % of hydrogen) fuel mixture with an advanced ST from 24 to 28 CAD BTDC due to the longer time for combustion and the lower amount of burning fuel escaping through the exhaust valve.
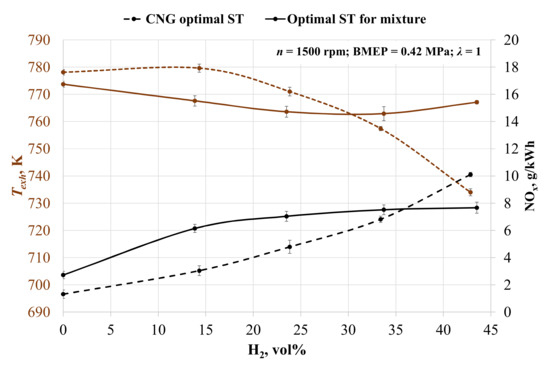
Figure 4.
Change in exhaust gas temperature (Texh) and specific emission of nitrogen oxides (NOx) depending on the volumetric fraction of hydrogen and spark timing.
When adjusting ST for the mixture, the NOx emissions rose by 77.0, 88.3, 93.5 and 95.1% with each increase in hydrogen concentration. Comparing the two different types of ST adjustment, it becomes clear that the advanced ST causes an increase in NOx formation and a reduction in exhaust gas temperature. In all H2 concentrations, NOx formation is greater with the optimal ST for the mixture, excluding the last measured point of 43 vol% hydrogen. This time, ST was set for 24 CAD BTDC in the case of optimal ST and 28 CAD BTDC in the case of CNG ST. This led to an increase in NOx emissions in the case of the advanced ST, and it shows that 24 CAD BTDC is too late for optimal ignition of this mixture. The same tendency of late start of the ignition when the ST is set to 24 CAD BTDC is visible in the MBF data (Table 5). It took 3 CAD longer to burn 10% of the fuel, which reduced the pressure in the cylinders and reduced the NOx concentration.
Table 5.
Combustion parameters.
It is clear from the exhaust emission data that increasing the hydrogen concentration in the fuel mixture alters the hydrogen–carbon molecule ratio in the fuel mixture. Figure 5 shows the reduction in unburn fuel emissions when adding hydrogen. In the case of CNG ST, emissions of unburned hydrocarbon (HC) decreased by 3.60, 8.99, 21.08, and 40.36% when adding 14, 24, 33, and 43 vol% hydrogen. When adjusting ST, the HC reduction was 11.52, 15.16, 21.84, and 43.53% respectively. HC reduction was affected by the decreased amount of carbon molecules in the fuel mixture and the increased combustion and mixing of fuel and air [63]. ST influenced the increase in HC emissions when the engine ignition timing was advanced. Without hydrogen and the advanced ST by 8 CAD BTDC, the HC emissions increased by 12%. The increase in HC emissions is noticeable in all measured point. The advanced ST reduces the exhaust temperatures, which consequently, reduces the speed of the oxidation reaction of the unburned hydrocarbons.
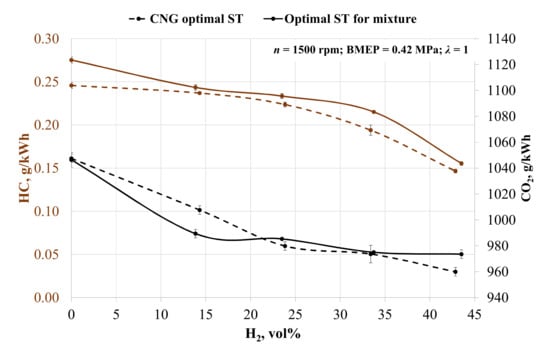
Figure 5.
Change in the specific emissions of unburned hydrocarbons (HC) and carbon dioxide (CO2) depending on the volumetric fraction of hydrogen and spark timing.
A similar tendency is noticeable for CO2 emissions. Increasing the hydrogen concentration in fuel causes a reduction in CO2 emissions. Without ST adjustment, CO2 emissions decreased by 3.81, 6.46, 7.05, and 8.36% compared to emissions when the engine is running on biogas. In the case of optimal ST for the mixture, CO2 emissions decreased by 5.45, 5.83, 6.82, and 6.96% respectively. Increased concentration of hydrogen caused a reduction in fuel consumption and carbon molecules in fuel mixture, resulting in reduced CO2 emissions [34]. With hydrogen concentrations of 24, 33 and 43 vol%, adjusting ST led to an increase in CO2 emissions as compared with the case when ST was set to be 28 CAD BTDC. This increase was influenced by increased fuel consumption and the higher amount of carbon molecules filling the combustion chamber.
The main combustion parameters such as rate of heat release (ROHR) and temperature rise were analyzed with utility BURN in AVL BOOST software. The parameters used for analysis include measured in-cylinder pressure (Figure 6), fuel consumption, air consumption, and engine data. The engine running on biogas with the addition of hydrogen and at constant ST of 28 CAD BTDC (Figure 6B) displayed increases of 14.3, 22.9, 31.1 and 38.2% in the cylinder pressure. Maximum pressure was obtained 1, 3, and 4 CAD earlier, while hydrogen volumetric concentration was 24, 33, and 43%. Hydrogen increased the burn speed of the fuel due to the better fuel mixing and higher flame speed of the added hydrogen [64,65]. Adjusting ST enabled an increase in cylinder pressure (Figure 6A) because of the advanced ST and more efficient combustion. The pressure increased by 16.1, 23.2, 20.7, and 19.0%, while ST advanced to 36, 36, 34, and 30 CAD BTDC. A higher hydrogen concentration accelerates combustion and reduces the need to advance ST. With the highest H2 concentration, optimal ST was the same as that for CNG. Therefore, retarding ST to 24 CAD BTDC reduced the in-cylinder pressure by 8.2%, and the maximum value of the in-cylinder pressure was measured 3 CAD later.
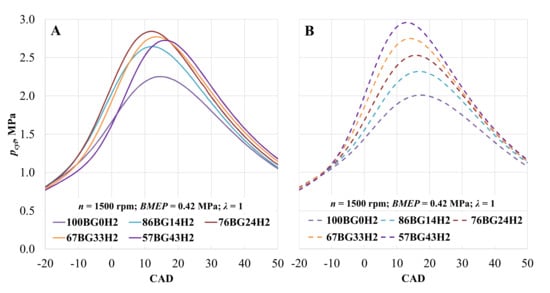
Figure 6.
Pressure in the cylinder (pcyl) depending on hydrogen concentration. (A)—with optimal ST for the mixture; (B)—with optimal CNG ST.
Changes in the rate of heat release when the engine was running on biogas and hydrogen mixtures are shown in Figure 7. When ST was set to 28 CAD BTDC, ROHR increased with the addition of hydrogen and reached a maximum value relatively early. Comparing the pure biogas with the mixtures of biogas and hydrogen, ROHR increased by 21.3, 31.1, 40.4, and 50.9% and reached its maximum value 1, 4, 7, and 9 CAD earlier due to the increased LHV of the fuel mixture and speed of combustion [66]. Adjusting ST moves the maximum value of ROHR closer to TDC, but the change in ROHR is minimum (3.3, 3.0, 1.9, 3.3, and 0.1%) with all of the measured fuel mixtures.
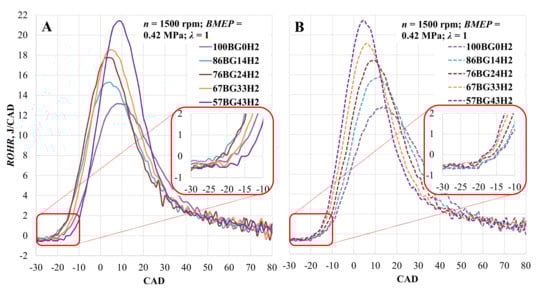
Figure 7.
Rate of heat release (ROHR) in the cylinder depending on hydrogen concentration. (A)—with optimal ST for the mixture; (B)—with optimal CNG ST.
More detailed combustion parameters are shown in Table 5. It can be observed that the addition of hydrogen shortens the ignition lag stage, and when setting ST to 28 CAD BTDC, the ignition lag duration shortens by 4.6, 8.6, 12.0, and 12.5% when adding 14, 24, 33, and 43 vol% hydrogen, respectively. When adjusting the spark timing, the ignition lag duration reduced by 3.6, 3.9, 13.4, and 22.3% when adding 14, 24, 33, and 43 vol% hydrogen, respectively. Reduced ignition lag is achieved due to the low energy required to ignite the hydrogen and the higher flame velocity when burning the hydrogen mixture. The same tendency is visible in the flame propagation stage. When ST was 28 CAD BTDC, 50% of the MBF combusted 8.6% faster with the addition of just 14 vol% hydrogen.
An increase in temperature in the cylinder is shown in Figure 8. When ST was set to 28 CAD BTDC and the engine was running on pure biogas, a maximum temperature increase of 42.5 K/CAD was observed at 10 CAD after top dead centre (TDC). By increasing the hydrogen concentration in the fuel mixture, the temperature also increased to 53.3 K/CAD at 7 CAD after TDC, 59.23 K/CAD at 7 CAD after TDC, 65.23 K/CAD at 4 CAD after TDC, and 73.4 K/CAD at 3 CAD after TDC at 14, 24, 33, and 43 vol% hydrogen, respectively. Advanced spark timing led to an earlier and more intense temperature increase. The increase when the engine was running on pure biogas was 8.5%, while that with 14 vol and 24 vol% hydrogen was 4.1% and 6.4%, respectively. In the other cases, the maximum value of the temperature increase decreased by 0.8% and 1.9% at 33 and 43 vol% hydrogen, respectively.
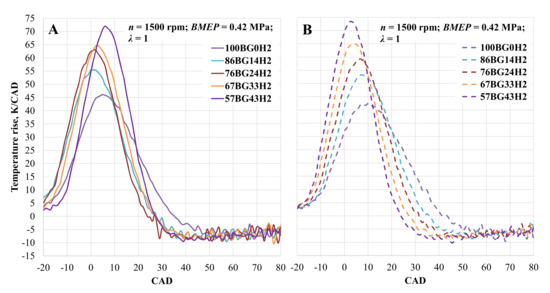
Figure 8.
Temperature rise in the cylinder depending on hydrogen concentration. (A)—with optimal ST for the mixture; (B)—with optimal CNG ST.
A maximum pressure rise of 0.116 MPa/CAD was measured with highest hydrogen concentration and at spark timing of 28 CAD BTDC. In this case, the pressure increase occurred at 1 CAD after TDC. The value of the maximum pressure increase value was 13.9, 29.7, 41.7, and 56.6% lower when hydrogen concentration changed from 33 to 0 vol%. The advanced ST lead to increased peak in-cylinder pressure [10] by 25.1, 29.1, 23.5, and 0.9% in the cases where hydrogen concentration changed from 0 to 33 vol%. Adding 43 vol% hydrogen and retarding ST to 24 CAD BTDC reduced the pressure increase by 15.9%, and it occurred 3 CAD later.
From the energy distribution shown in Figure 9, it can be seen how the energy losses through the exhaust increase in both cases of the ST setting as a result of the increasing proportion of hydrogen in the mixture. With the addition of 14 vol% hydrogen and the ST set from 28 to 36 CAD BTDC, the exhaust energy losses decreased by 2.4% and the propulsion energy increased by 2.3% due to better fuel mixture combustion, reduced ignition delay time, and increased BTE. The addition of hydrogen increased energy heat losses due to the increased combustion temperature and the greater increase in ROHR.
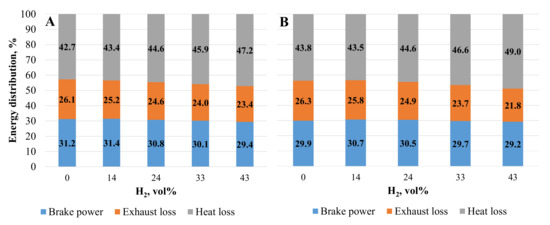
Figure 9.
Energy distribution. (A)—with optimal ST for the mixture; (B)—with optimal CNG ST.
4. Conclusions
The aim of this article was to demonstrate the possibilities of using a combination of biogas and hydrogen as an alternative fuel for internal combustion engines, and solutions were provided for the problems associated with optimizing the combustion process of this mixture while achieving favorable emissions and fuel consumption. This combination of fuels could be used in stable engines, as well as in municipal or agricultural vehicles, which are close to the source of biogas.
In this study, the effects of two different cases of spark timing and hydrogen addition on a spark ignition engine running on biogas were investigated. The following conclusions were drawn from the collected and analyzed experimental data:
- The maximum BTE value of 0.314 is reached with the advanced ST and the engine running on a mixture of biogas and 14 vol% hydrogen. Reducing ST to 28 CAD BTDC reduces BTE due to the low combustion speed and biogas combustion delay period. Further increasing the hydrogen concentration reduces the volumetric efficiency of the engine and at the same time reduces the BTE.
- In all cases, adding hydrogen to biogas increases NOx emissions. This is because of the increase in cylinder pressure and the temperature of burning fuel mixture with higher LHV. The advanced ST increases NOx emissions further, because the combustion process forms peak pressure earlier and the in-cylinder temperature rises. This is also confirmed by the drop in exhaust gas temperature as a result of less burning fuel passing through the exhaust valve when ST is advanced.
- Increased concentration of hydrogen improves the combustion process and decreases the amount of unburn fuel in the exhaust gases. At a maximum hydrogen concentration of 43 vol% and ST of 28 CAD BTDC emissions of HC fall by 40%; this is because of the lower ratio of carbon molecules inside the fuel mixture and the increased quality of combustion. In the cases of advanced ST, HC emissions rise because of the lower exhaust temperatures, which reduce the oxidation reaction of unburned HC speed.
- Reduction of GHG is also noticeable when adding H2, which reduces fuel consumption and carbon molecules in fuel mixture. In the case of 43 vol% hydrogen, CO2 emissions dropped by 8.36% when ST was set to 28 CAD BTDC and by 6.96% when ST was 24 CAD BTDC.
- The peak of the in-cylinder pressure increases with the addition of hydrogen, and it occurs closer to TDC due to the higher flame speed of added hydrogen. In the case of the highest hydrogen concentration, the value of ST 28 CAD BTDC is optimal for CNG and for the biogas–hydrogen mixture. Further reduction of ST to 24 CAD BTDC is not necessary, as the peak value of the in-cylinder pressure shifts further from TDC, and the maximum value decreases.
- ROHR increases with every portion of hydrogen, and the maximum value is reached earlier because of the increased fuel mixture’s LHV and the intensity of combustion. This is also confirmed by the increase in the in-cylinder temperature. In the maximum BTE case (ST 28 CAD BTDC, 14 vol% H2), the increase in peak temperature reached 53.3 K/CAD at 7 CAD, and the advanced ST increased it further to 55.4 K/CAD at 1 CAD. This change also influences the increase in NOx emission.
Author Contributions
Conceptualization, D.K. and G.P.; methodology, D.K. and G.P.; software, D.K.; validation, A.R.; formal analysis, S.P.; writing—original draft preparation, D.K.; writing—review and editing, S.P. and D.B.; visualization, D.B.; supervision, A.R. and P.D.; project administration, P.D. All authors have read and agreed to the published version of the manuscript.
Funding
This research received no external funding.
Institutional Review Board Statement
Not applicable.
Informed Consent Statement
Not Applicable.
Data Availability Statement
Data is contained within the article.
Acknowledgments
A part of the results of the research described in this article were obtained using the engine simulation tool AVL BOOST, acquired by signing a Cooperation Agreement between AVL Advanced Simulation Technologies and the faculty of the Transport Engineering of Vilnius Gediminas Technical University.
Conflicts of Interest
The authors declare no conflict of interest.
References
- European Comission. Commission Publishes Strategy for Low-Emission Mobility. Available online: https://ec.europa.eu/transport/themes/strategies/news/2016-07-20-decarbonisation_en (accessed on 18 April 2020).
- European Environment Agency. Annual European Union Greenhouse Gas Inventory 1990–2017 and Inventory Report 2019. Available online: https://www.eea.europa.eu/publications/european-union-greenhouse-gas-inventory-2019 (accessed on 18 April 2020).
- European Comission. EU Reference Scenario 2016: Energy, Transport and GHG Emissions: Trends to 2050. Available online: http://op.europa.eu/en/publication-detail/-/publication/aed45f8e-63e3-47fb-9440-a0a14370f243/language-en/format-PDF (accessed on 18 April 2020).
- European Union. WHITE PAPER Roadmap to a Single European Transport Area—Towards a Competitive and Resource Efficient Transport System. Available online: https://eur-lex.europa.eu/legal-content/EN/TXT/HTML/?uri=CELEX:52011DC0144&from=en (accessed on 19 April 2020).
- Rimkus, A.; Stravinskas, S.; Matijošius, J. Comparative study on the energetic and ecologic parameters of dual fuels (Diesel–NG and HVO–Biogas) and conventional diesel fuel in a CI engine. Appl. Sci. 2020, 10, 359. [Google Scholar] [CrossRef]
- Lee, S.; Park, S.; Kim, C.; Kim, Y.-M.; Kim, Y.; Park, C. Comparative study on EGR and lean burn strategies employed in an SI engine fueled by low calorific Gas. Appl. Energy 2014, 129, 10–16. [Google Scholar] [CrossRef]
- Puskar, M.; Jahnatek, A.; Kuric, I.; Kadarova, J.; Kopas, M.; Soltesova, M. Complex analysis focused on influence of biodiesel and its mixture on regulated and unregulated emissions of motor vehicles with the aim to protect air quality and environment. Air Qual. Atmos. Health 2019, 12, 855–864. [Google Scholar] [CrossRef]
- Caban, J.; Gniecka, A.; Holesa, L. Alternative fuels for diesel engines. Adv. Sci. Technol. Res. J. 2013, 7, 20–70. [Google Scholar] [CrossRef]
- Göktaş, M.; Kemal Balki, M.; Sayin, C.; Canakci, M. An Evaluation of the use of alcohol fuels in SI engines in terms of performance, emission and combustion characteristics: A review. Fuel 2021, 286, 119425. [Google Scholar] [CrossRef]
- Hao, D.; Mehra, R.K.; Luo, S.; Nie, Z.; Ren, X.; Fanhua, M. Experimental study of hydrogen enriched compressed natural gas (HCNG) Engine and Application of Support Vector Machine (SVM) on Prediction of Engine Performance at Specific Condition. Int. J. Hydrog. Energy 2020, 45, 5309–5325. [Google Scholar] [CrossRef]
- Park, J.; Song, S. Predicting the performance and NOx emissions of a turbocharged spark-ignition engine generator fueled with biogases and hydrogen addition under down-boosting condition. Int. J. Hydrog. Energy 2014, 39, 8510–8524. [Google Scholar] [CrossRef]
- Khan, I.; Hafiz, M.; Othman, M.H.; Hashim, H.; Matsuura, T.; Ismail, A.; Rezaei Dasht Arzhandi, M.; Wan Azelee, I. Biogas as a renewable energy fuel—A review of biogas upgrading, utilisation and storage. Energy Convers. Manag. 2017, 150, 277–294. [Google Scholar] [CrossRef]
- Qyyum, M.A.; Haider, J.; Qadeer, K.; Valentina, V.; Khan, A.; Yasin, M.; Aslam, M.; De Guido, G.; Pellegrini, L.A.; Lee, M. Biogas to liquefied biomethane: Assessment of 3P’s–production, processing, and prospects. Renew. Sustain. Energy Rev. 2020, 119, 109561. [Google Scholar] [CrossRef]
- European Comission. Eurostat Generation of Waste by Waste Category. Available online: https://appsso.eurostat.ec.europa.eu/nui/submitViewTableAction.do (accessed on 18 May 2020).
- Zabed, H.M.; Akter, S.; Yun, J.; Zhang, G.; Zhang, Y.; Qi, X. Biogas from microalgae: Technologies, challenges and opportunities. Renew. Sustain. Energy Rev. 2020, 117, 109503. [Google Scholar] [CrossRef]
- Saady, N.M.C.; Massé, D.I. Psychrophilic anaerobic digestion of lignocellulosic biomass: A characterization study. Bioresour. Technol. 2013, 142, 663–671. [Google Scholar] [CrossRef]
- Wang, Z.; Xu, F.; Li, Y. Effects of total ammonia nitrogen concentration on solid-state anaerobic digestion of corn stover. Bioresour. Technol. 2013, 144, 281–287. [Google Scholar] [CrossRef]
- Li, Y.; Zhang, R.; Liu, G.; Chen, C.; He, Y.; Liu, X. Comparison of methane production potential, biodegradability, and kinetics of different organic substrates. Bioresour. Technol. 2013, 149, 565–569. [Google Scholar] [CrossRef]
- Xu, F.; Wang, Z.-W.; Li, Y. Predicting the methane yield of lignocellulosic biomass in mesophilic solid-state anaerobic digestion based on deedstock characteristics and process parameters. Bioresour. Technol. 2014, 173, 168–176. [Google Scholar] [CrossRef] [PubMed]
- Zhang, C.; Xiao, G.; Peng, L.; Su, H.; Tan, T. The anaerobic co-digestion of food waste and cattle manure. Bioresour. Technol. 2013, 129, 170–176. [Google Scholar] [CrossRef] [PubMed]
- Kawai, M.; Nagao, N.; Tajima, N.; Niwa, C.; Matsuyama, T.; Toda, T. The effect of the labile organic fraction in food waste and the substrate/inoculum ratio on anaerobic digestion for a reliable methane yield. Bioresour. Technol. 2014, 157, 174–180. [Google Scholar] [CrossRef] [PubMed]
- Bharathiraja, D.B.; Sudharsanaa, T.; Bharghavi, A.; Jayamuthunagai, J.; Ramanujam, P.K. Biohydrogen and biogas—An overview on feedstocks and enhancement process. Fuel 2016, 185, 810–828. [Google Scholar] [CrossRef]
- Khalil, M.; Berawi, M.A.; Heryanto, R.; Rizalie, A. Waste to energy technology: The potential of sustainable biogas production from animal waste in Indonesia. Renew. Sustain. Energy Rev. 2019, 105, 323–331. [Google Scholar] [CrossRef]
- Zupančič, G.; Panjičko, M.; Zelić, B. Biogas production from brewer’s yeast using an anaerobic sequencing batch reactor. Food Technol. Biotechnol. 2017, 55, 187–196. [Google Scholar] [CrossRef]
- Achinas, S.; Achinas, V.; Euverink, G.J.W. A technological overview of biogas production from biowaste. Engineering 2017, 3, 299–307. [Google Scholar] [CrossRef]
- Mähnert, P.; Linke, B. Kinetic study of biogas production from energy crops and animal waste slurry: Effect of organic loading rate and reactor size. Environ. Technol. 2009, 30, 93–99. [Google Scholar] [CrossRef] [PubMed]
- Eurobserv-er. EurObserv’ER Biogas Barometer 2017. Available online: https://www.eurobserv-er.org/biogas-barometer-2017/ (accessed on 1 May 2020).
- European Biogas Association. EBA Annual Report 2019. Available online: https://www.europeanbiogas.eu/eba-annual-report-2019/ (accessed on 18 May 2020).
- European Biogas Association. EBA Statistical Report 2018. Available online: https://www.europeanbiogas.eu/wp-content/uploads/2019/11/EBA_report2018_abriged_A4_vers12_220519_RZweb.pdf (accessed on 18 May 2020).
- Hosseini, S.E.; Wahid, M.A. Utilization of biogas released from palm oil mill effluent for power generation using self-preheated reactor. Energy Convers. Manag. 2015, 105, 957–966. [Google Scholar] [CrossRef]
- Kapoor, R.; Ghosh, P.; Tyagi, B.; Vijay, V.K.; Vijay, V.; Thakur, I.S.; Kamyab, H.; Nguyen, D.D.; Kumar, A. Advances in biogas valorization and utilization systems: A comprehensive review. J. Clean. Prod. 2020, 273, 123052. [Google Scholar] [CrossRef]
- Kollamthodi, S. The role of natural gas and biomethane in the transport sector. Rep. Transp. Environ. 2016, 1, 85. [Google Scholar]
- Paolini, V.; Petracchini, F.; Segreto, M.; Tomassetti, L.; Naja, N.; Cecinato, A. Environmental impact of biogas: A short review of current knowledge. J. Environ. Sci. Health Part A 2018, 53, 899–906. [Google Scholar] [CrossRef]
- Khatri, N.; Khatri, K.K. Hydrogen enrichment on diesel engine with biogas in dual fuel mode. Int. J. Hydrog. Energy 2020, 45, 7128–7140. [Google Scholar] [CrossRef]
- Subramanian, K.A.; Mathad, V.C.; Vijay, V.K.; Subbarao, P.M.V. Comparative evaluation of emission and fuel economy of an automotive spark ignition vehicle fuelled with methane enriched biogas and CNG using chassis dynamometer. Appl. Energy 2013, 105, 17–29. [Google Scholar] [CrossRef]
- Wei, Z.L.; Leung, C.W.; Cheung, C.S.; Huang, Z.H. Effects of Equivalence Ratio, H2 and CO2 Addition on the heat release characteristics of premixed laminar biogas-hydrogen flame. Int. J. Hydrog. Energy 2016, 41, 6567–6580. [Google Scholar] [CrossRef]
- Verma, S.; Das, L.M.; Kaushik, S.C.; Bhatti, S.S. The effects of compression ratio and EGR on the performance and emission characteristics of diesel-biogas dual fuel engine. Appl. Therm. Eng. 2019, 150, 1090–1103. [Google Scholar] [CrossRef]
- Yoon, S.H.; Lee, C.S. Experimental investigation on the combustion and exhaust emission characteristics of biogas–biodiesel dual-fuel combustion in a CI engine. Fuel Process. Technol. 2011, 92, 992–1000. [Google Scholar] [CrossRef]
- Hotta, S.K.; Sahoo, N.; Mohanty, K. Comparative assessment of a spark ignition engine fueled with gasoline and raw biogas. Renew. Energy 2019, 134, 1307–1319. [Google Scholar] [CrossRef]
- Porpatham, E.; Ramesh, A.; Nagalingam, B. Effect of swirl on the performance and combustion of a biogas fuelled spark ignition engine. Energy Convers. Manag. 2013, 76, 463–471. [Google Scholar] [CrossRef]
- Kwon, E.-C.; Song, K.; Kim, M.; Shin, Y.; Choi, S. Performance of small spark ignition engine fueled with biogas at different compression ratio and various carbon dioxide dilution. Fuel 2017, 196, 217–224. [Google Scholar] [CrossRef]
- Siripornakarachai, S. Conversion of large diesel engine to run on biogas for high efficiency electrical power generation. AMA Agric. Mech. Asia Afr. Lat. Am. 2009, 40, 59–63. [Google Scholar]
- Porpatham, E.; Ramesh, A.; Nagalingam, B. Investigation on the effect of concentration of methane in biogas when used as a fuel for a spark ignition engine. Fuel 2008, 87, 1651–1659. [Google Scholar] [CrossRef]
- Porpatham, E.; Ramesh, A.; Nagalingam, B. Effect of hydrogen addition on the performance of a biogas fuelled spark ignition engine. Int. J. Hydrog. Energy 2007, 32, 2057–2065. [Google Scholar] [CrossRef]
- Hotta, S.K.; Sahoo, N.; Mohanty, K.; Kulkarni, V. Ignition timing and compression ratio as effective means for the improvement in the operating characteristics of a biogas fueled spark ignition engine. Renew. Energy 2020, 150, 854–867. [Google Scholar] [CrossRef]
- Kan, X.; Zhou, D.; Yang, W.; Zhai, X.; Wang, C.-H. An investigation on utilization of biogas and syngas produced from biomass waste in premixed spark ignition engine. Appl. Energy 2018, 212, 210–222. [Google Scholar] [CrossRef]
- Nges, I.A.; Escobar, F.; Fu, X.; Björnsson, L. Benefits of supplementing an industrial waste anaerobic digester with energy crops for increased biogas production. Waste Manag. 2012, 32, 53–59. [Google Scholar] [CrossRef]
- Byun, J.S.; Park, J. Predicting the performance and exhaust NOX emissions of a spark-ignition engine generator fueled with methane based biogases containing various amounts of CO2. J. Nat. Gas Sci. Eng. 2015, 22, 196–202. [Google Scholar] [CrossRef]
- Hoseini, S.S.; Najafi, G.; Ghobadian, B.; Ebadi, M.T.; Mamat, R.; Yusaf, T. Performance and emission characteristics of a CI engine using graphene oxide (GO) nano-particles additives in biodiesel-diesel blends. Renew. Energy 2020, 145, 458–465. [Google Scholar] [CrossRef]
- Soudagar, M.E.M.; Nik-Ghazali, N.-N.; Kalam, M.A.; Badruddin, I.A.; Banapurmath, N.R.; Bin Ali, M.A.; Kamangar, S.; Cho, H.M.; Akram, N. An investigation on the influence of aluminium oxide nano-additive and Honge oil methyl ester on engine performance, combustion and emission characteristics. Renew. Energy 2020, 146, 2291–2307. [Google Scholar] [CrossRef]
- Elseesy, A.; Hassan, H. Combustion characteristics of a diesel engine fueled by biodiesel-diesel-N-butanol blend and titanium oxide additives. Energy Procedia 2019, 162, 48–56. [Google Scholar] [CrossRef]
- Chandra, R.; Vijay, V.K.; Subbarao, P.M.V.; Khura, T.K. Performance evaluation of a constant speed IC engine on CNG, methane enriched biogas and biogas. Appl. Energy 2011, 88, 3969–3977. [Google Scholar] [CrossRef]
- Elfasakhany, A. Investigations on performance and pollutant emissions of spark-ignition engines fueled with n-Butanol–, Isobutanol–, Ethanol–, Methanol–, and Acetone–gasoline blends: A comparative study. Renew. Sustain. Energy Rev. 2016, 71. [Google Scholar] [CrossRef]
- Li, Y.; Chen, Y.; Wu, G.; Lee, C.F.; Liu, J. Experimental comparison of Acetone-n-Butanol-Ethanol (ABE) and Isopropanol-n-Butanol-Ethanol (IBE) as fuel candidate in spark-ignition engine. Appl. Therm. Eng. 2018, 133, 179–187. [Google Scholar] [CrossRef]
- Singh, S.; Jain, S.; Ps, V.; Tiwari, A.K.; Nouni, M.R.; Pandey, J.K.; Goel, S. Hydrogen: A sustainable fuel for future of the transport sector. Renew. Sustain. Energy Rev. 2015, 51, 623–633. [Google Scholar] [CrossRef]
- Zhao, L.; Wang, D.; Qi, W. Comparative study on air dilution and hydrogen-enriched air dilution employed in a SI engine fueled with Iso-Butanol-gasoline. Int. J. Hydrog. Energy 2020, 45, 10895–10905. [Google Scholar] [CrossRef]
- Leung, T.; Wierzba, I. The effect of hydrogen addition on biogas non-premixed jet flame stability in a co-flowing air stream. Int. J. Hydrog. Energy 2008, 33, 3856–3862. [Google Scholar] [CrossRef]
- Wei, Z.L.; Leung, C.W.; Cheung, C.S.; Huang, Z.H. Effects of H2 and CO2 addition on the heat transfer characteristics of laminar premixed biogas–hydrogen Bunsen flame. Int. J. Heat Mass Transf. 2016, 98, 359–366. [Google Scholar] [CrossRef]
- Gómez Montoya, J.P.; Amell, A.A.; Olsen, D.B.; Amador Diaz, G.J. Strategies to improve the performance of a spark ignition engine using fuel blends of biogas with natural gas, Propane and Hydrogen. Int. J. Hydrog. Energy 2018, 43, 21592–21602. [Google Scholar] [CrossRef]
- You, J.; Liu, Z.; Wang, Z.; Wang, D.; Xu, Y. Experimental analysis of inert gases in EGR on engine power and combustion characteristics in a stoichiometric dual fuel heavy-duty natural gas engine ignited with diesel. Appl. Therm. Eng. 2020, 180, 115860. [Google Scholar] [CrossRef]
- Dhyani, V.; Subramanian, K.A. Experimental based comparative exergy analysis of a multi-cylinder spark ignition engine fuelled with different gaseous (CNG, HCNG, and hydrogen) fuels. Int. J. Hydrog. Energy 2019, 44, 20440–20451. [Google Scholar] [CrossRef]
- Wasiu, S.; Aziz, R.A.; Megat, P. Brake specific energy consumption (BSEC) and emission characteristics of the direct injection spark ignition engine fuelled by hydrogen enriched compressed natural gas at various air-fuel ratios. Int. J. Appl. Eng. Res. 2018, 13, 677–683. [Google Scholar]
- Korsakas, V.; Melaika, M.; Pukalskas, S.; Stravinskas, P. Hydrogen addition influence for the efficient and ecological parameters of heavy-duty natural gas Si engine. Procedia Eng. 2017, 187, 395–401. [Google Scholar] [CrossRef]
- Zhang, K.; Jiang, X. An assessment of fuel variability effect on biogas-hydrogen combustion using uncertainty quantification. Int. J. Hydrog. Energy 2018, 43, 12499–12515. [Google Scholar] [CrossRef]
- Nadaleti, W.C.; Przybyla, G. NOx, CO and HC emissions and thermodynamic-energetic efficiency of an SI gas engine powered by gases simulated from biomass gasification under different H2 content. Int. J. Hydrog. Energy 2020, 45, 21920–21939. [Google Scholar] [CrossRef]
- Prasad, R.K.; Agarwal, A.K. Development and comparative experimental investigations of laser plasma and spark plasma ignited hydrogen enriched compressed natural gas fueled engine. Energy 2020, 119282. [Google Scholar] [CrossRef]


Publisher’s Note: MDPI stays neutral with regard to jurisdictional claims in published maps and institutional affiliations. |
© 2021 by the authors. Licensee MDPI, Basel, Switzerland. This article is an open access article distributed under the terms and conditions of the Creative Commons Attribution (CC BY) license (http://creativecommons.org/licenses/by/4.0/).