Article

A Hybrid Approach for Time-Varying Harmonic and Interharmonic Detection Using Synchrosqueezing Wavelet Transform

1
Department of Electrical Engineering, National Chung Cheng University, Chiayi 62102, Taiwan
2
Taiwan Power Company, Taipei 10016, Taiwan
*
Author to whom correspondence should be addressed.
Appl. Sci. 2021, 11(2), 752; https://doi.org/10.3390/app11020752
Submission received: 14 October 2020 / Revised: 21 December 2020 / Accepted: 27 December 2020 / Published: 14 January 2021
(This article belongs to the Special Issue Power Quality in Electrical Power Systems)

Abstract

:
With widespread non-linear loads and the increasing penetration of distributed generations in the power system, harmonic pollution has become a great concern. The causes of harmonic pollution not only include the integer harmonics, but also interharmonics, which exacerbate the complexity of harmonic analysis. In addition, the output variability of highly non-linear loads and renewables such as electric arc furnaces and photovoltaic solar or wind generation may lead to weakly time-varying harmonics and interharmonics in both frequency and magnitude. These features present challenges for accurate assessment of associated power-quality (PQ) disturbances. To tackle such increasing time-varying PQ problems, a hybrid detection method using synchrosqueezing wavelet transform (SSWT) is proposed. The proposed method first obtains the proper parameter values for the mother wavelet according to numerical computations. The wavelet transform-based synchrosqueezing and a clustering method are applied to determine each frequency component of the waveform under assessment. The time-domain waveform and the associated magnitude of each frequency component is then reconstructed by the inverse SSWT operation. The novelty of the proposed method is that it can decompose the measured waveform containing both harmonics and interharmonics into intrinsic mode functions without the need for fundamental frequency detection. Compared to other time–frequency analysis methods, SSWT has better anti-noise and higher resolution of time–frequency curves; even the measured signal has close frequency components. Simulation results and actual measurement validations show that the proposed method is effective and relatively accurate in time-varying harmonic and interharmonic detection and is suitable for applications in power networks and microgrids that have high penetration of renewables or non-linear loads causing time-varying voltage or current waveforms.

1. Introduction

It is well known that harmonics and interharmonics may cause transformer overheating, malfunctions of metering devices, or resonances that cause detrimental effects on the other power system components. In recent years, harmonic and interharmonic pollution in the power system has drawn much attention because of the increasing widespread applications of non-linear loads and integration of renewables.
There are many techniques proposed for the detection of harmonics and interharmonics, including discrete Fourier transform and window function, wavelet neural network, Prony-based, maximum likelihood and optimization, Kalman filter, and sparse decomposition combined with discrete trigonometric transform-based methods [1,2,3,4,5,6,7,8,9,10]. However, most of these detection methods assume that the measured waveforms are stationary. When the measured waveform contains interharmonics or has time-varying magnitude and frequency, the traditional methods present inaccurate results. To tackle the non-stationary harmonic and interharmonic measurement problems, several techniques have been proposed to perform more accurate assessment of such time-varying signals. These techniques for measuring dynamic harmonics and/or interharmonics include enhanced phase-locked loop mechanism, steepest descent gradient, or Gauss–Newton-based iterative techniques, extended Kalman filter, improved fast Fourier transform with sliding window, compressed sensing-based Taylor–Fourier transform, and deep-learning-based methods [11,12,13,14,15,16,17]. Though these methods have been proved to be efficient in time-varying harmonic and/or interharmonic measurements, the drawbacks are that most of these methods are not effective to show the time–frequency characteristics, and they are more suitable for either near-stationary magnitude-varying or frequency-varying signals.
In recent years, time–frequency (TF) analyses have drawn much attention in the field of electric power engineering for the analysis of time-varying non-stationary waveforms, especially when the distorted waveforms contain oscillating components with slowly time-varying magnitudes and instantaneous frequencies. There are several linear TF methods proposed, such as short-time Fourier transform (STFT), S-transform, continuous wavelet transform (CWT), Fourier-based synchrosqueezing transform (FSST), and synchrosqueezing wavelet transform (SSWT) [18,19,20,21,22,23,24,25,26]. Much effort has been made to improve the TF resolution of the different time–frequency ridges (TFRs) of a signal. Among these methods, CWT is the most common for power-quality (PQ) analysis. Both STFT and S-transform are also popular for TF analysis [18,21]. However, the results are sufficiently accurate only when the measured waveforms are close to stationary. Both FSST and SSWT have the ability for signal reconstruction. The advantage of SSWT is that it is good for sharpening the time–frequency representation of the measured time-varying signal through the allocation of the CWT coefficient value to a different location in the time–frequency plane compared to FSST. The other advantages include better anti-noise features and higher resolution of time–frequency curves; even the measured signal has close frequency components. It is proved that the SSWT is robust and is suitable for TF analysis for weakly time-varying signals [26].
Therefore, this paper proposes a time-varying harmonic and interharmonic detection method based on combining synchrosqueezing wavelet transform and the clustering method of density-based spatial clustering of applications with noise (DBSCAN) [27,28]. The proposed method is first to obtain time–frequency plots of the measured waveform and the clustering methods are then adopted to accurately detect each frequency component. Next, inverse SSWT is performed to reconstruct the time-domain waveform and obtain the corresponding magnitude of each harmonic and interharmonic component. Thus, the measured waveform is decomposed into separate intrinsic mode functions (IMF) for the corresponding harmonic and interharmonic components.

2. Review of Synchrosqueezing Wavelet Transform

As with the demodulation of vibration signals resulted from rolling element bearing defects in mechanical engineering [29,30], TF analysis also can be applied to detect the frequency and magnitude of non-stationary signals in power systems [31]. Regarding applications in voltage or current waveform measurement, TF analysis (TFA) has been exploited for PQ assessment in recent years. In [23], the authors proposed the synchrosqueezing wavelet transform method by resetting the time–frequency spectra of SSWT. The time–frequency ridges are substantially improved. SSWT is an empirical mode decomposition (EMD)-like method [32]. It is the TF signal analysis algorithm designed to decompose the signal s(t) of Equation (1) into several IMF.
s ( t ) = k = 1 K s k ( t ) + e ( t )
where the k-th component s k ( t ) = A k ( t ) cos θ k ( t ) is a Fourier-like non-stationary mode with time-varying magnitude, A k ( t ) , and phase, θ k ( t ) . e(t) represents the noise or measurement error; the instantaneous frequency is f k ( t ) = θ k ( t ) / 2 π . The goal is to recover the magnitude A k ( t ) at the instantaneous frequency f k ( t ) for each component k. The SSWT starts from the complex CWT of the signal s(t) and is defined by Equation (2).
W s ( a , b ) = s ( t ) , ψ a , b ( t ) = 1 a s ( t ) ψ * ( t b a ) d t
where a and b are scaling and localization parameters of the mother wavelet, and ψ is a properly selected complex mother wavelet in which the lognormal wavelet is adopted. Take a wavelet ψ that is concentrated on the positive frequency axis; we have the Fourier transform of the wavelet at ς , ψ ^ ( ς ) 0 for ς < 0. By Plancherel’s theorem, we can rewrite W s ( a , b ) , the CWT of s(t) with respect to ψ, as
W s ( a , b ) = s ^ ( ς ) a 2 π ψ ^ * ( a ς ) e i b ς d ς = A 4 π [ δ ( ς ω ) + δ ( ς + ω ) ] a   ψ ^ * e i b ς d ς = A 4 π a ψ ^ * ( a ω ) e i b ω
W s ( a , b ) will be concentrated around a = ω 0 /ω.
However, W s ( a , b ) will be spread out over a region around the horizontal line a = ω 0 /ω on the time-scale plane. Assume that W a ( a , b ) 0 for any ( a , b ) , the instantaneous frequency ω s ( a , b ) can be obtained from Equation (4).
ω s ( a , b ) = i ( 2 π W s ( a , b ) ) 1 b W s ( a , b )
Then, the information is transferred from the time-scale plane to the time–frequency plane by relocating points at ( b , a )   to   ( b , ω s ( a , b ) ) . The resulting SSWT representation T s ( ω l , b ) is given by
T s ( ω l , b ) = ( Δ ω ) 1 a k : | ω ( a k , b ) ω l | Δ ω / 2 W s ( a k , b ) a k 3 / 2 Δ a k
where (5) is calculated only at discrete central frequencies, ω l , separated by a frequency step, Δ ω , i.e., (5) is performed at the center ω l of the interval [ ( ω l Δ ω / 2 ) , ( ω l + Δ ω / 2 ) ] . In a similar manner, since the scale a and time b are discrete values, a scaling step Δ a k = a k a k 1 , is presented, separating discrete scales a k for which the wavelet decomposition of (3) is calculated [23].
T s ( ω l , b ) presents the time–frequency rigid (TFR) of the signal s(t) and is synchrosqueezed along the frequency axis. As with CWT, the SSWT is reversible. It can be shown that the signal can be reconstructed after the synchrosqueezing and is approximated by Equation (6) in the piecewise constant approximation corresponding to the binning in a [23].
s ( b ) e [ C ψ 1 k W s ( a k , b ) a k 3 / 2 ( Δ a k ) ] = e [ C ψ 1 l T s ( ω l , t ) ( Δ ω ) ]
where C ψ = 1 2 π ψ ^ * ( a ξ ) d ξ and C Ψ is a constant dependent on the selected wavelet. The k-th component of the multi-component signal can be reconstructed by
s k ( b ) = lim α 0 1 C ψ | ξ ϕ k ( b ) | < ρ T s ( ξ , b ) d ξ
where ρ is the width of the zone to be summed up around the ridge corresponding to the instantaneous frequency of the k-th component. In the discrete format, the k-th component is
s k ( t m ) = 2 C ψ e [ l L k ( t m ) T ˜ s ˜ ( ω l , t m ) ]
where T ˜ s ˜ ( ω l , t m ) is the discretized estimate of T s ( ω l , b ) , and where tm is the discrete time tm = t0 + mΔt for m = 0, 1, …, n − 1 and n is the total number of samples in the discrete waveform, s ˜ . The reconstruction of the k-th component from T ˜ s ˜ ( ω l , t m ) is the inverse CWT over a small frequency band l L k ( t m ) around the k-th component.
Figure 1 illustrates the application of SSWT on extracting the time–frequency ridges and reconstruction of each extracted frequency component of the input time-domain signal. In case the frequencies of harmonics and interharmonics in a time-domain signal are too close to each other, it is likely to cause blurry ridges or even ridges to be mixed up. SSWT can further improve this effect by setting parameters near a central frequency ω l of (5) or combining with the clustering method for an accurate frequency detection. It is helpful to analyze TF ridges since it can keep the ridges more concentrated and thus reduce the detection errors.

3. DBSCAN Clustering Method

Clustering is a commonly used unsupervised technique in machine learning, data mining, and pattern recognition. For clustering, the classes of objects are non-predetermined and the basic task is to locate a group of objects which are similar between them and are dissimilar to the objects belonging to other clusters. Each clustering method may need to identify groups where member objects are different. Each of the clustering methods has its own classification form, depending on the procedure of the method. In the study, after performing a literature survey and numeric tests over affinity propagation, mean shift, and DBSCAN clustering methods [27,33,34], the authors adopted a DBSCAN to detect the number of TF ridges in the TF spectrum obtained by SSWT since it is not necessary to identify the number of harmonic and interharmonic frequency clusters in advance. It is effective to estimate the frequency components with time-varying magnitudes of a measured waveform.
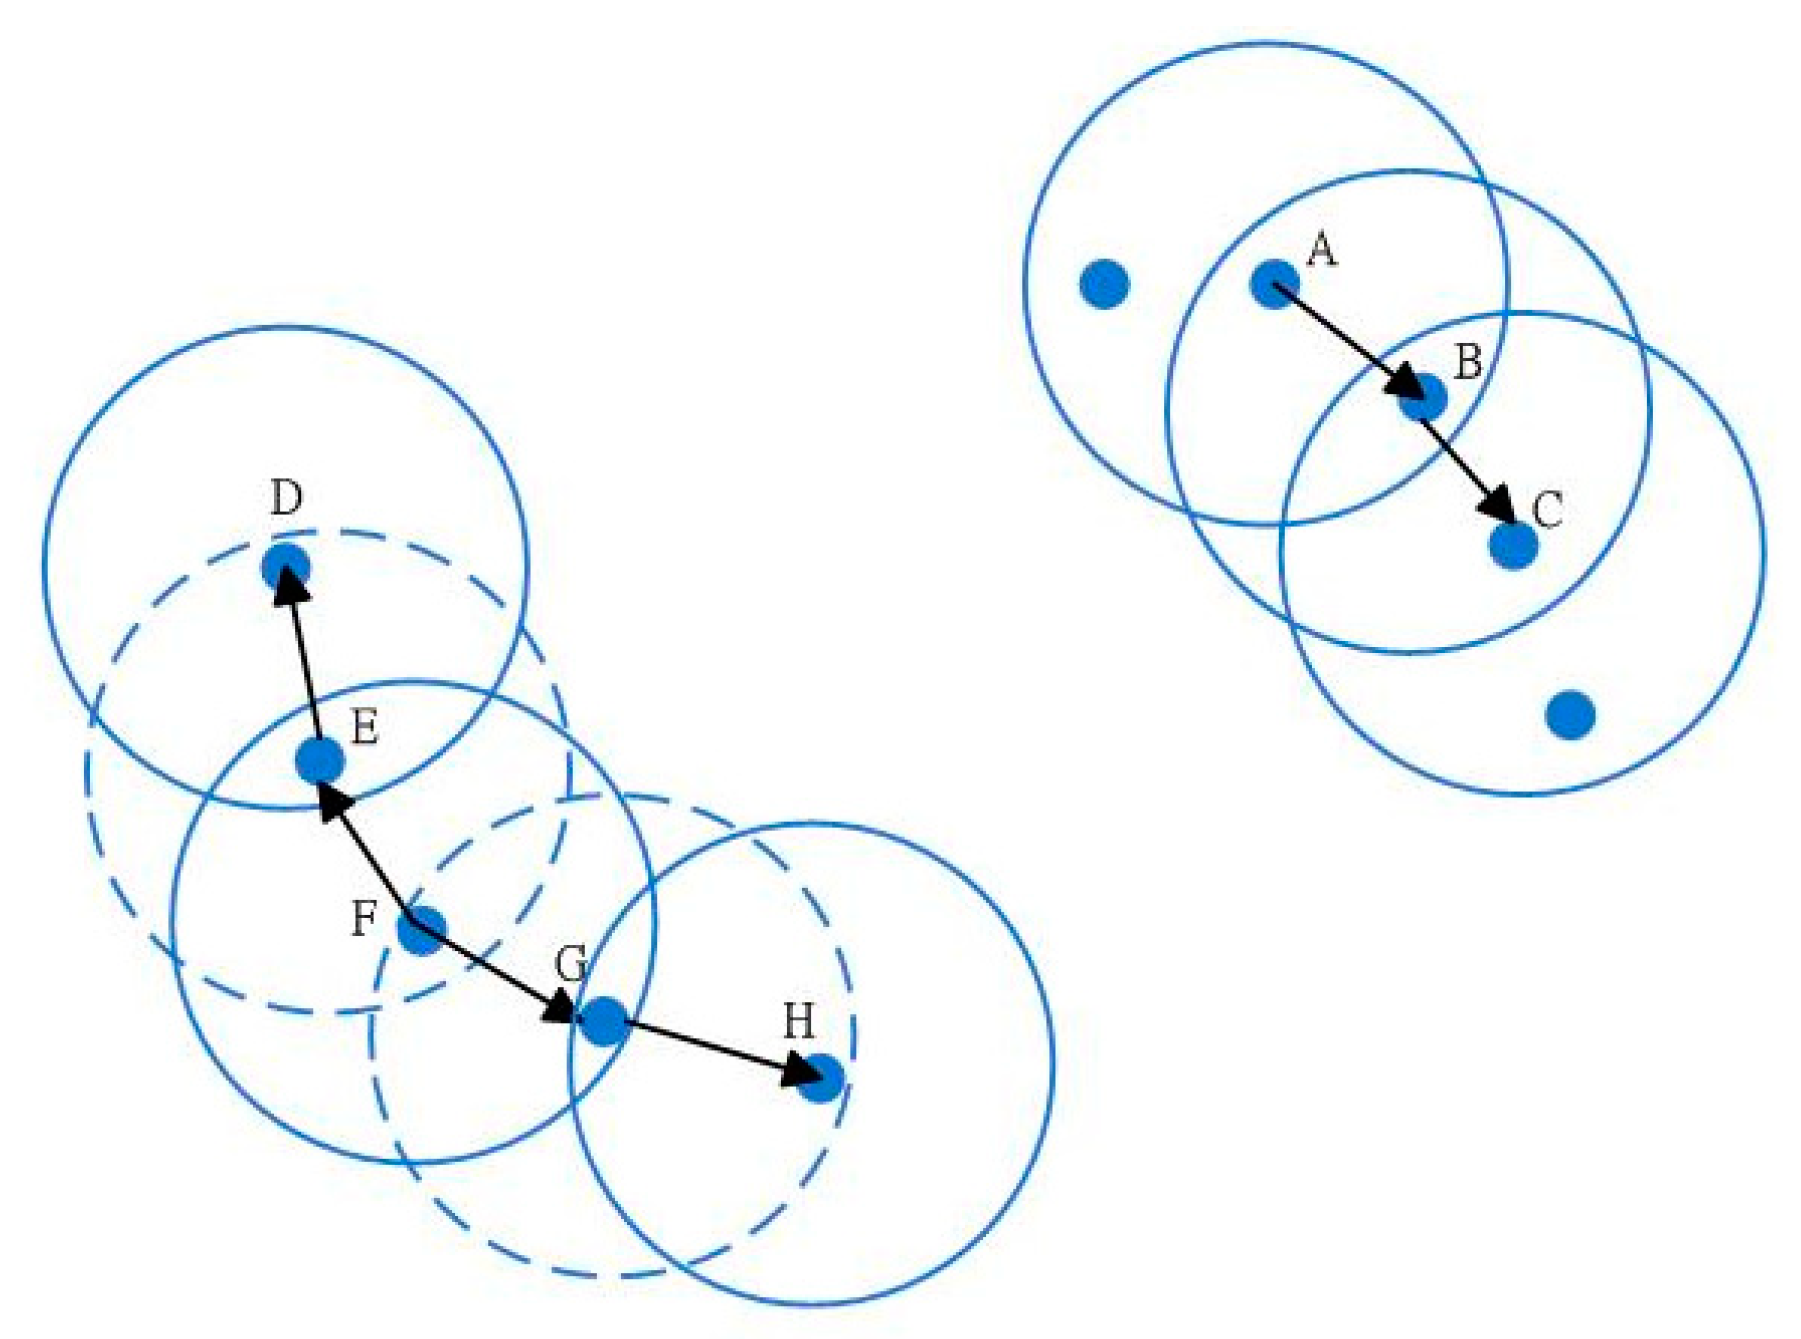
The DBSCAN that recognizes the clusters is the density of points in each cluster, which is considerably higher than outside of those clusters [27,28]. Data with low density is considered to be noise. Figure 2 illustrates the results of DBSCAN clustering, where the points can be easily detected as clusters of points, with the noise points not belonging to any clusters.
There are two parameters, min_pts and eps (i.e., ɛ), defined for the DBSCAN algorithm, where min_pts indicates the minimum number of neighbors of the core point, and eps indicates the distance from any core. A higher min_pts or lower eps indicates a higher density necessary to form a cluster. As shown in Figure 3, given a sample P, it is classified as the core point if at least min_pts points are within the distance eps, and then any point that is not the core point and is out of the distance eps from any core point is considered to be noise data.
Next, the group range is extended outward to find data points that satisfy the density-reachable and density-connected conditions of the group, and allocated these data to the group. The points that do not belong to any group are considered to be noise. This process continues until the density-connected cluster is completely found. As illustrated in Figure 4, if point A can reach point C by going through point B, then it can be considered to be a reachable point. Point F to point D are reachable points and point F to point H are reachable points as well. Thus, point D to point H is density-connected.

4. Proposed Solution Procedure for Harmonic and Interharmonic Detection

The proposed analysis procedure includes three steps: detection by SSWT, clustering, and estimation. The detection step is designed to implement TFA to harmonic and interharmonic contaminated waveforms, where the parameters for TFA are predetermined. The clustering step is mainly used to identify the exact frequencies of harmonics and interharmonics in the TF domain. Then, the estimation step is to detect the magnitudes of harmonics and interharmonics by implementing inverse SSWT for each of the corresponding frequencies obtained in the clustering step.

4.1. Setting the Value of Parameter σ for Time–Frequency Analysis

We select Morlet wavelet as the wavelet function, which is defined in (9).
ϕ ( t ) = c e i ω t e ( t 2 / 2 σ 2 )
where c = σ / π , ω is the center angular frequency of the window, σ is the factor of Morlet wavelet width. The corresponding frequency band covered by the window is actually limited in the range [ ω 2 π σ 2 ,   ω 2 π + σ 2 ]. When increasing the parameter, σ, the width of the Gaussian window is also increased and consequently increases the frequency resolution of the TF analysis. Based on the Heisenberg uncertainty principle of signal processing, the higher the required resolution in time, the lower resolution in frequency must be [35]. The comparison of time–frequency resolution under different sizes of time resolution, Δt, is shown in Table 1.
The width of the window determines the frequency resolution of the wavelet transform. A better resolution can improve the accuracy of the frequency detection, but the width of the window will affect the computational efficiency and the length of the calculation time. Therefore, a useful method proposed in [36] is adopted to find the optimal σ value used in the Morlet wavelet. In (10), it defines the entropy-magnification factor, em(σ), for the selection of the optimal σ value. The optimal value of σ can result the maximum value of em(σ).
e m ( σ ) = c r ( σ ) E ( σ )
where the magnification factor cr(σ) is defined in (11).
c r ( σ ) = M N max ( C w ( i , j ) ) i j C w ( i , j ) 2
and where the matrix C w ( i , j ) = | W s ( i , j ) | is developed based on the magnitudes of the elements of the complex matrix W s ( i , j ) of (2) with discrete signal of s(j), j = 1, 2, …, M, and M is the number of samples. The i-th row of W s is associated with a specific center frequency, fi, and the j-th column is associated with a different time instant. The elements of C w are the values of the envelopes of the signal at each frequency band i and each time instant j.
E(σ) of (11) is the Shannon entropy defined by (12).
E ( σ ) = p = 1 M d p log d p
where d p = | c p | / j = 1 M | c j | . The optimal value of σ for (12) is the one yielding the minimal entropy E of C w .
The optimal value of em(σ) is then the σ that leads to the maximum value of (10), which is selected for use in the Morlet wavelet of (9). The entropy-magnification factor em is tested on a simulated signal includes a set of harmonics and interharmonics. For one simulated signal tested for a range of values of σ, one can obtain the set of entropy-magnification factor em(σ). To obtain an optimal value of σ for detection of general harmonic and interharmonic data, a great number of simulated waveforms can be used for test. The optimal σ is then obtained and results in the maximum value of em(σ).

4.2. Solution Procedure of Proposed Harmonic and Interharmonic Detection Method

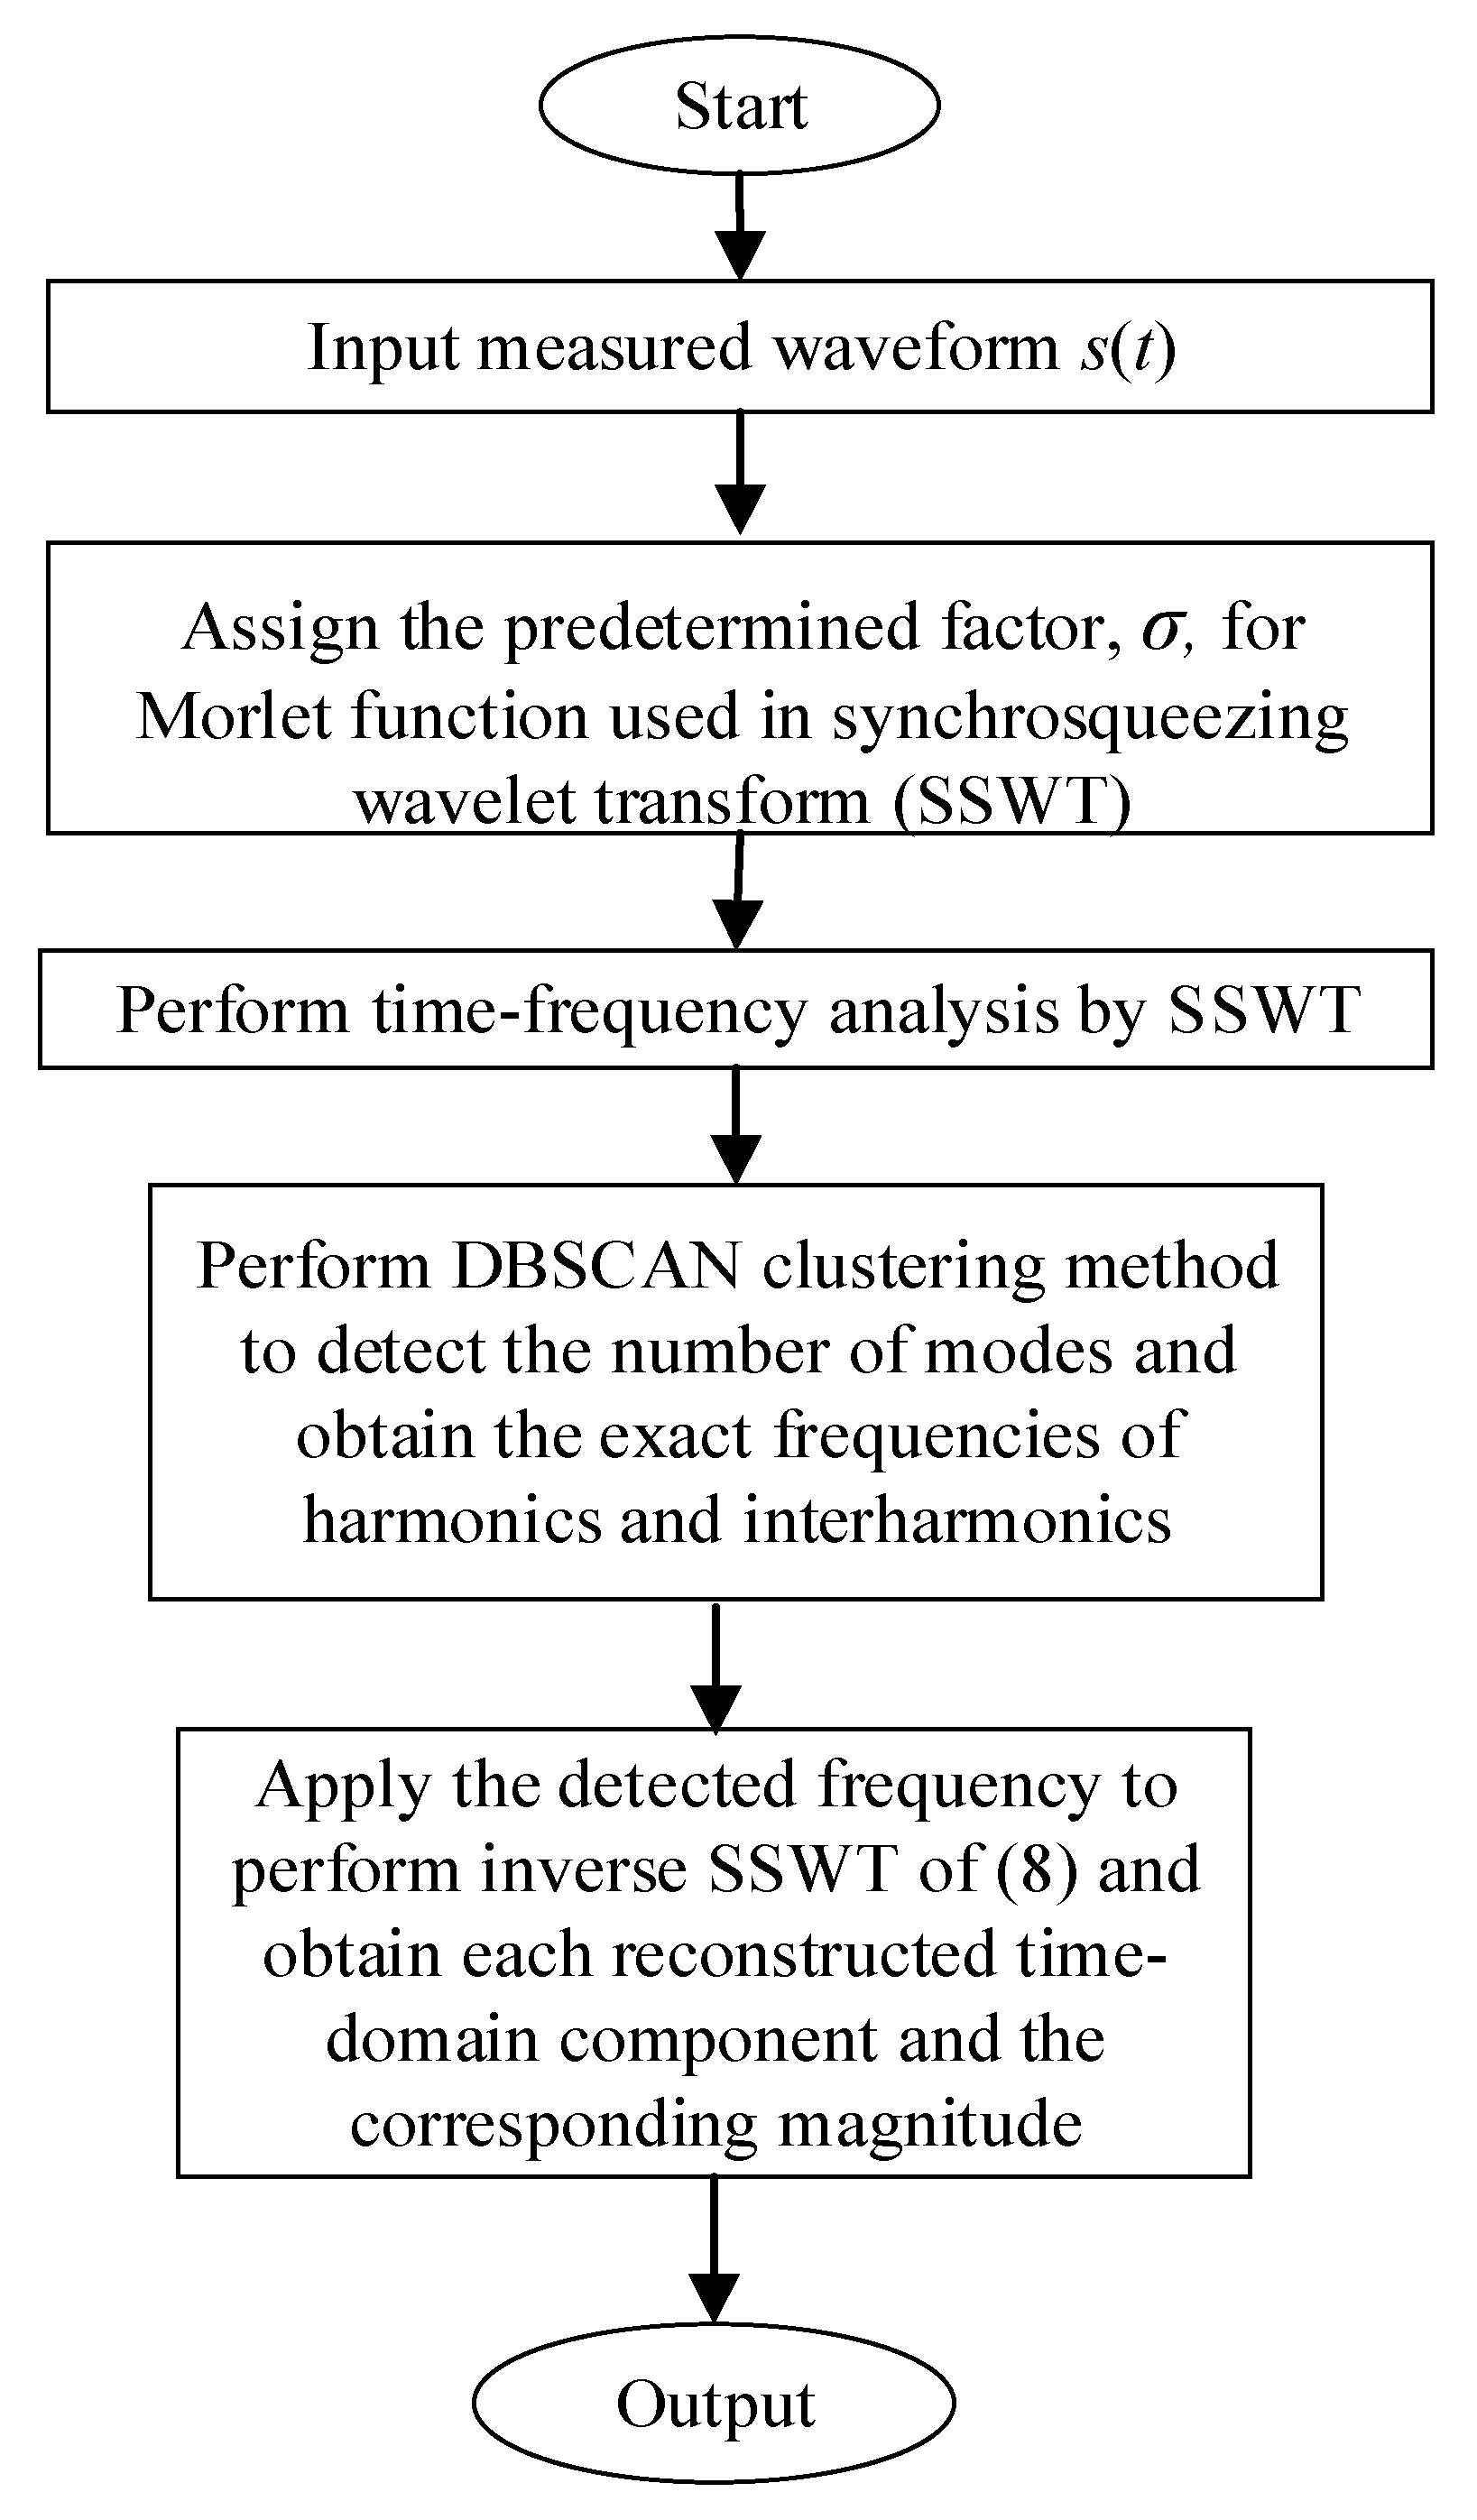
This section illustrates the flowchart of the proposed solution procedure for harmonic and interharmonic detection, as shown in Figure 5, where SSWT is used as the demodulation method to identify magnitude- and frequency-modulated components in a time-varying waveform represented by TF ridge curves in the plot. The ridges can reveal the local features of the signal and show energy distribution over frequency changes from one instant to the next. Due to the lightly blurred ridge curves detected in the TF plane for harmonic or interharmonic estimations obtained by the proposed SSWT, the clustering method, DBSCAN, is then used to identify the ridge curves and more accurately detect the corresponding frequencies. After all the harmonic or interharmonic frequencies are identified, the inverse SSWT of (8) is then applied to obtain each reconstructed time-domain waveform and the associated magnitude of frequency component.

5. Case Studies

To show the usefulness of the proposed hybrid method, test cases 5.1~5.4, SSWT, and DBSACN are implemented using Matlab 2019 running on PC with 1.6 GHz Intel Core i5-8250U CPU to verify the performance of the proposed algorithm [37,38,39]. Actual measurements in case 5.5 obtained by a power-quality meter (HIOKI 3198) are also used for validations. In the study, the sampling frequency is 3840 Hz and the time length of the signal to be processed is 0.2 s. The total time length for analysis of actual measured waveforms taken from an electric arc furnace (EAF) and an offshore wind farm is up to 1 s. In the proposed hybrid method, the Morlet wavelet factor used in (9), σ = 6.6, is selected according to numerical tests based on (10).

5.1. Effect of Multiple Frequency-Modulated Detection

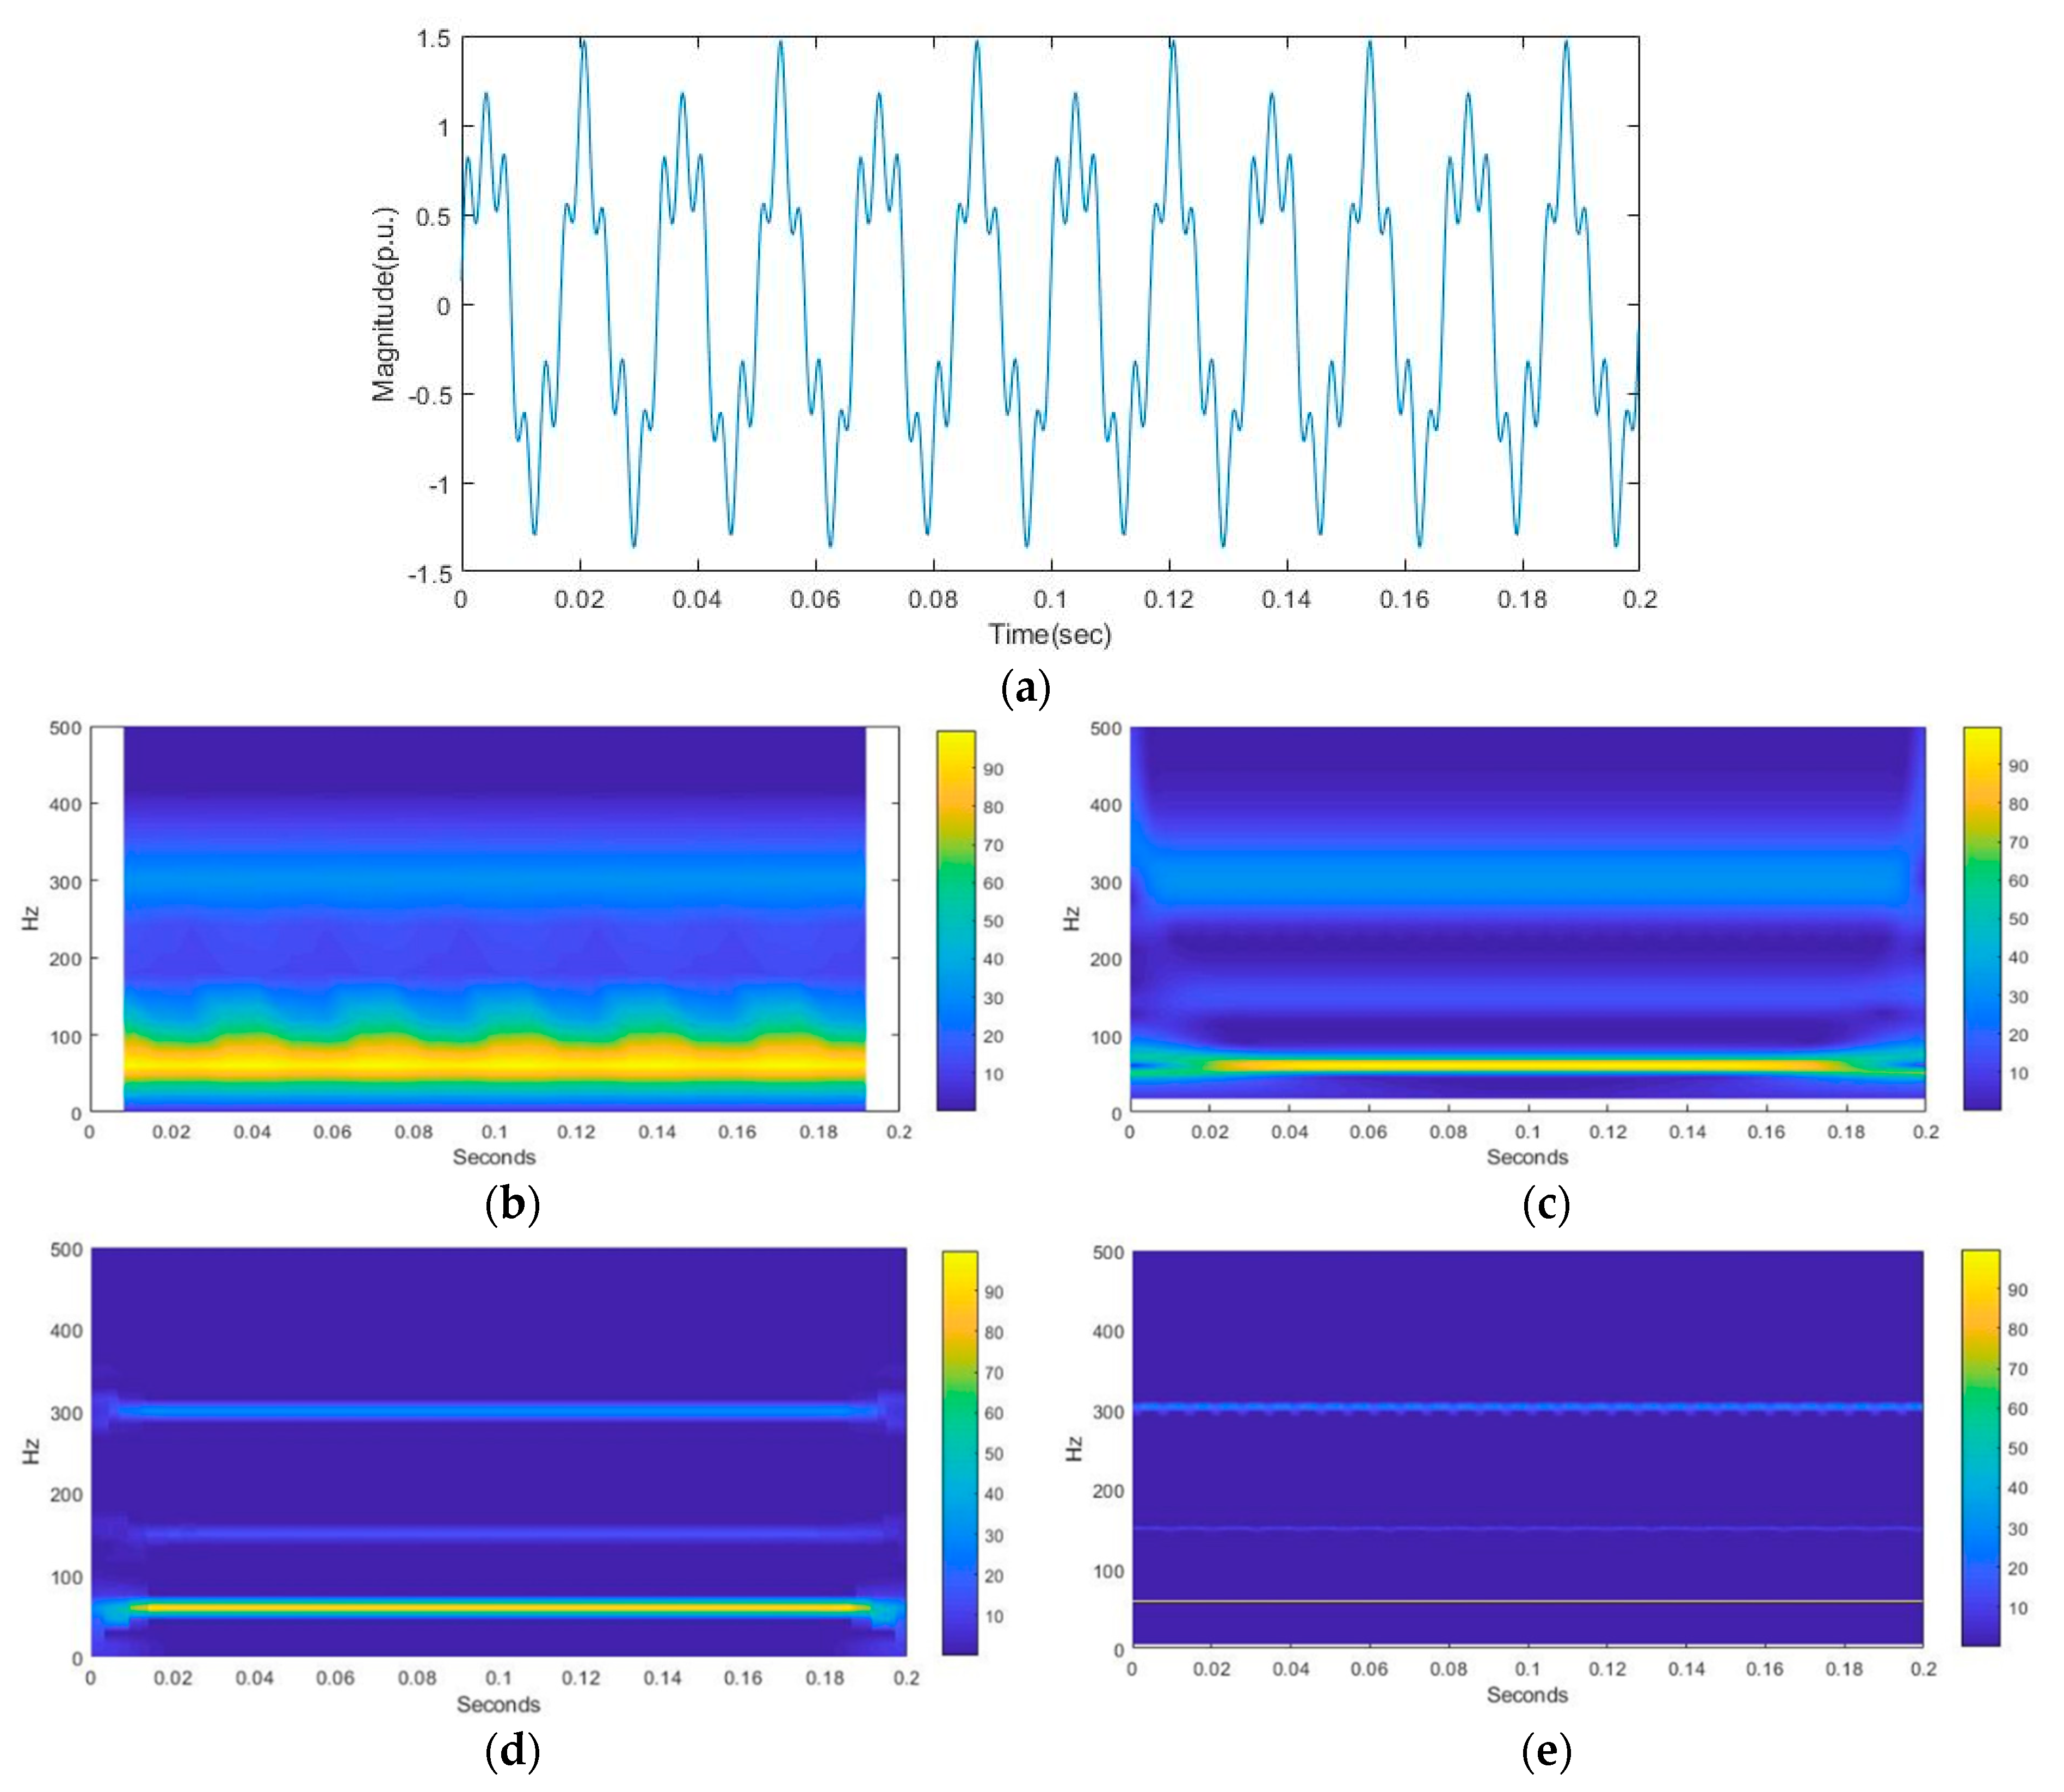
To verify the accuracy of the multiple frequency detection, the modulated waveform is set to include three modulation frequency components, as shown in (13). The frequencies are modulated at 60, 150, and 300 Hz, respectively, and the associated modulated magnitudes are 1, 0.15, and 0.33 p.u., respectively. Figure 6a shows the waveform of harmonics-polluted signal. The performances in TFA results of STFT, CWT, FSST, and SSWT are shown in Figure 6b–e, respectively. The efficiency of SSWT in this case is superior to the other methods since it has a better TF resolution. A better TF resolution allows a more precise TF representation with more concentrated TFR.
s ( t ) = sin ( 2 π · 60 t ) + 0.15 sin ( 2 π · 150 t ) + 0.33 sin ( 2 π · 300 t )

5.2. Impact of Noise Included in the Measured Signal

When the signal of (13) includes Gaussian white noise, the signal-to-noise ratio is 10 dB. Figure 7 shows the detection performances of STFT, CWT, FSST, and SSWT. It is observed that SSWT leads to the most accurate harmonic detection compared to the other TFA methods.

5.3. Impact of Fundamental Frequency Variations

The fundamental frequency fluctuates with the degree of unbalance between the power generation and load demand. The simulated signal is expressed by (14), where the fundamental frequency varies from which frequency is changed from f1 = 40 Hz to f2 = 60 Hz at 0.1 s. Figure 8 shows the waveform of the simulated signal and TF plots obtained by STFT, CWT, FSST, and SSWT, respectively. It is observed that SSWT provides more concentrated and accurate ridges to track the frequency changes than other methods.
s ( t ) = { sin ( 2 π f 1 t ) ,   0 < t 0.1   sec sin ( 2 π f 2 t ) ,   0.1 < t 0.2   sec

5.4. Effects Due to Proximity of Two Frequencies of Harmonics and Interharmonics

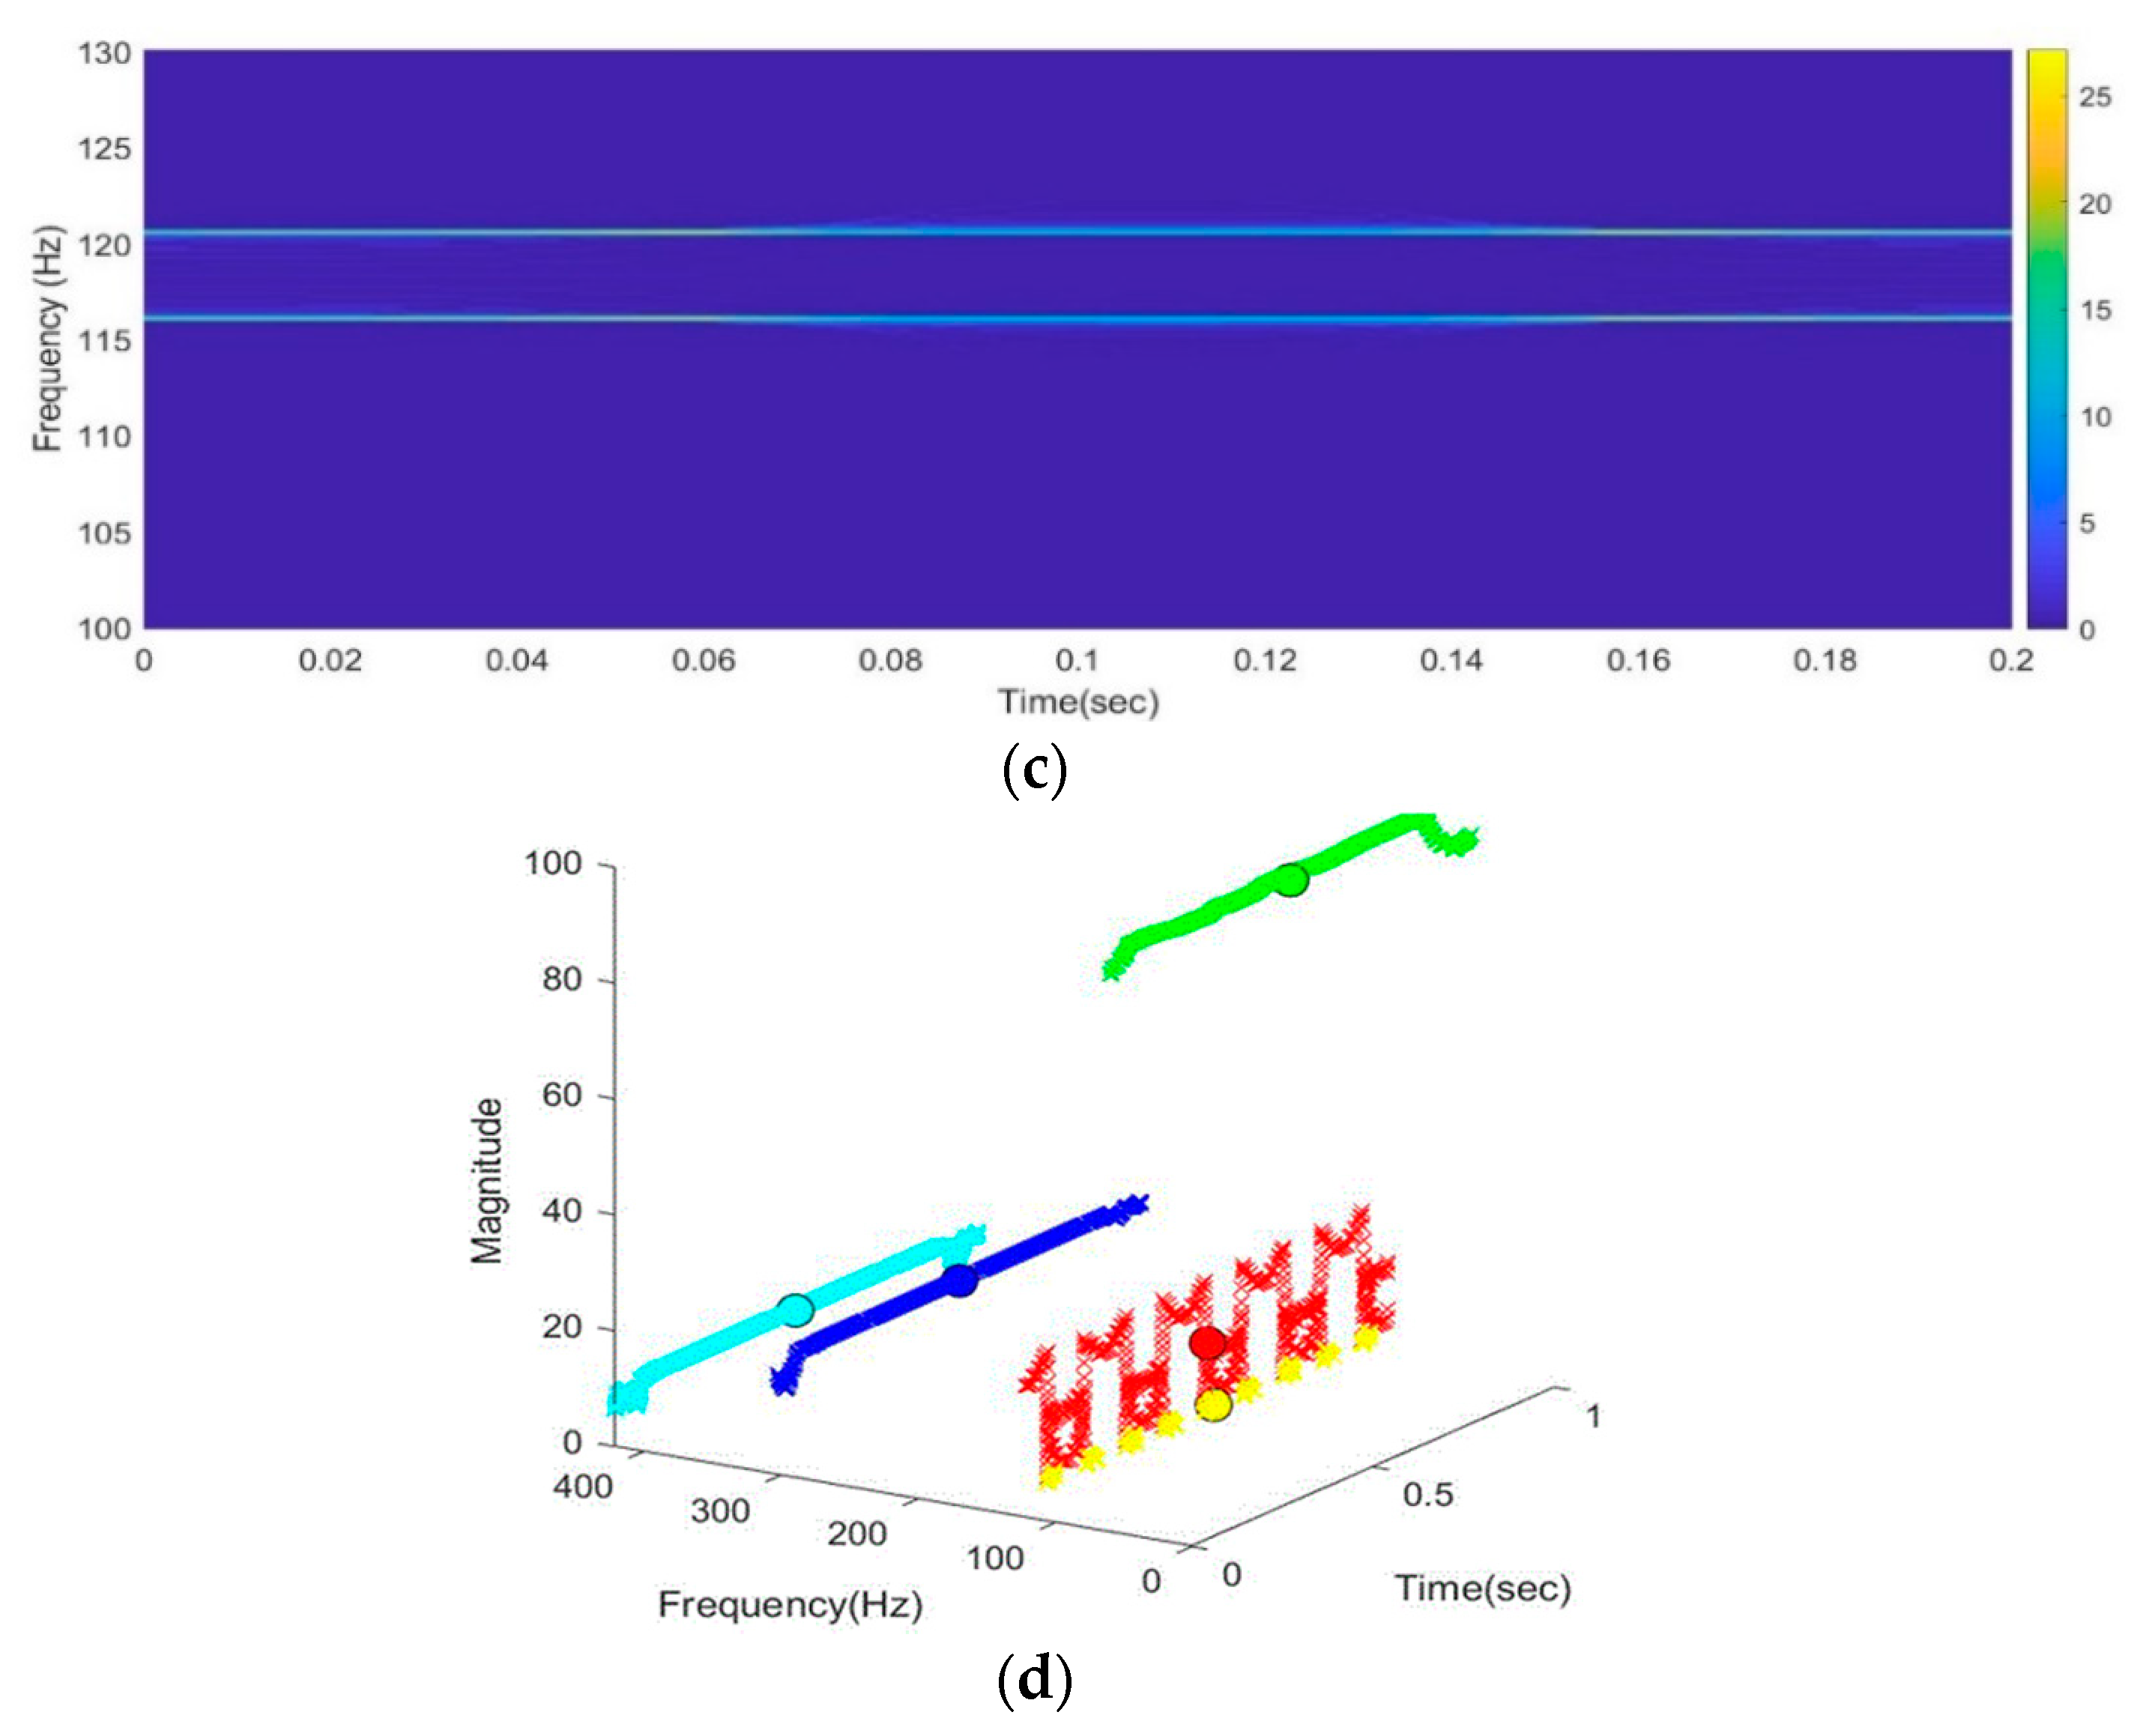
In the TF representation, when the distance (i.e., the difference between harmonic and/or interharmonic frequencies) between two TF ridges is close enough, the interaction between two ridges will cause low resolution of the representation and the ridges to look blurry. To show the accurate detection of the proposed method, a test signal of (15) is examined. Figure 9a,b show the simulated waveform and detected TF ridges, respectively. Figure 9c zooms in Figure 9b for the two close frequency components. It shows that the two components at 116 Hz and 120.6 Hz are mixed up. Using the DBSCAN clustering method, the two close frequency components can be more precisely classified, as shown in Figure 9c.
Table 2 lists the absolute errors between the true values and the calculated ones obtained by the proposed method and fast Fourier transform (FFT). In Table 2, f1~f5 are the frequencies of the harmonic and interharmonic components of the simulated signal given in (15). The maximum absolute error between the true values and the calculated ones obtained by the proposed method is 0.2898 Hz that occurs at estimating the 421.1 Hz interharmonic component. It also shows that the effect of proximity of two frequencies, 116Hz and 120.6Hz, can be identified by the proposed method. Overall, it can be seen that the proposed method with DBSCAN leads to more accurate frequency detection than the commonly used FFT.
s ( t ) = 100 sin ( 2 π · 60.3 t ) + 10 sin ( 2 π · 116 t ) + 30 sin ( 2 π · 120.6 t ) + 20 sin ( 2 π · 301.5 t ) + 10 sin ( 2 π · 421.1 t )

5.5. Performance Verification with Power-Quality Analyzer

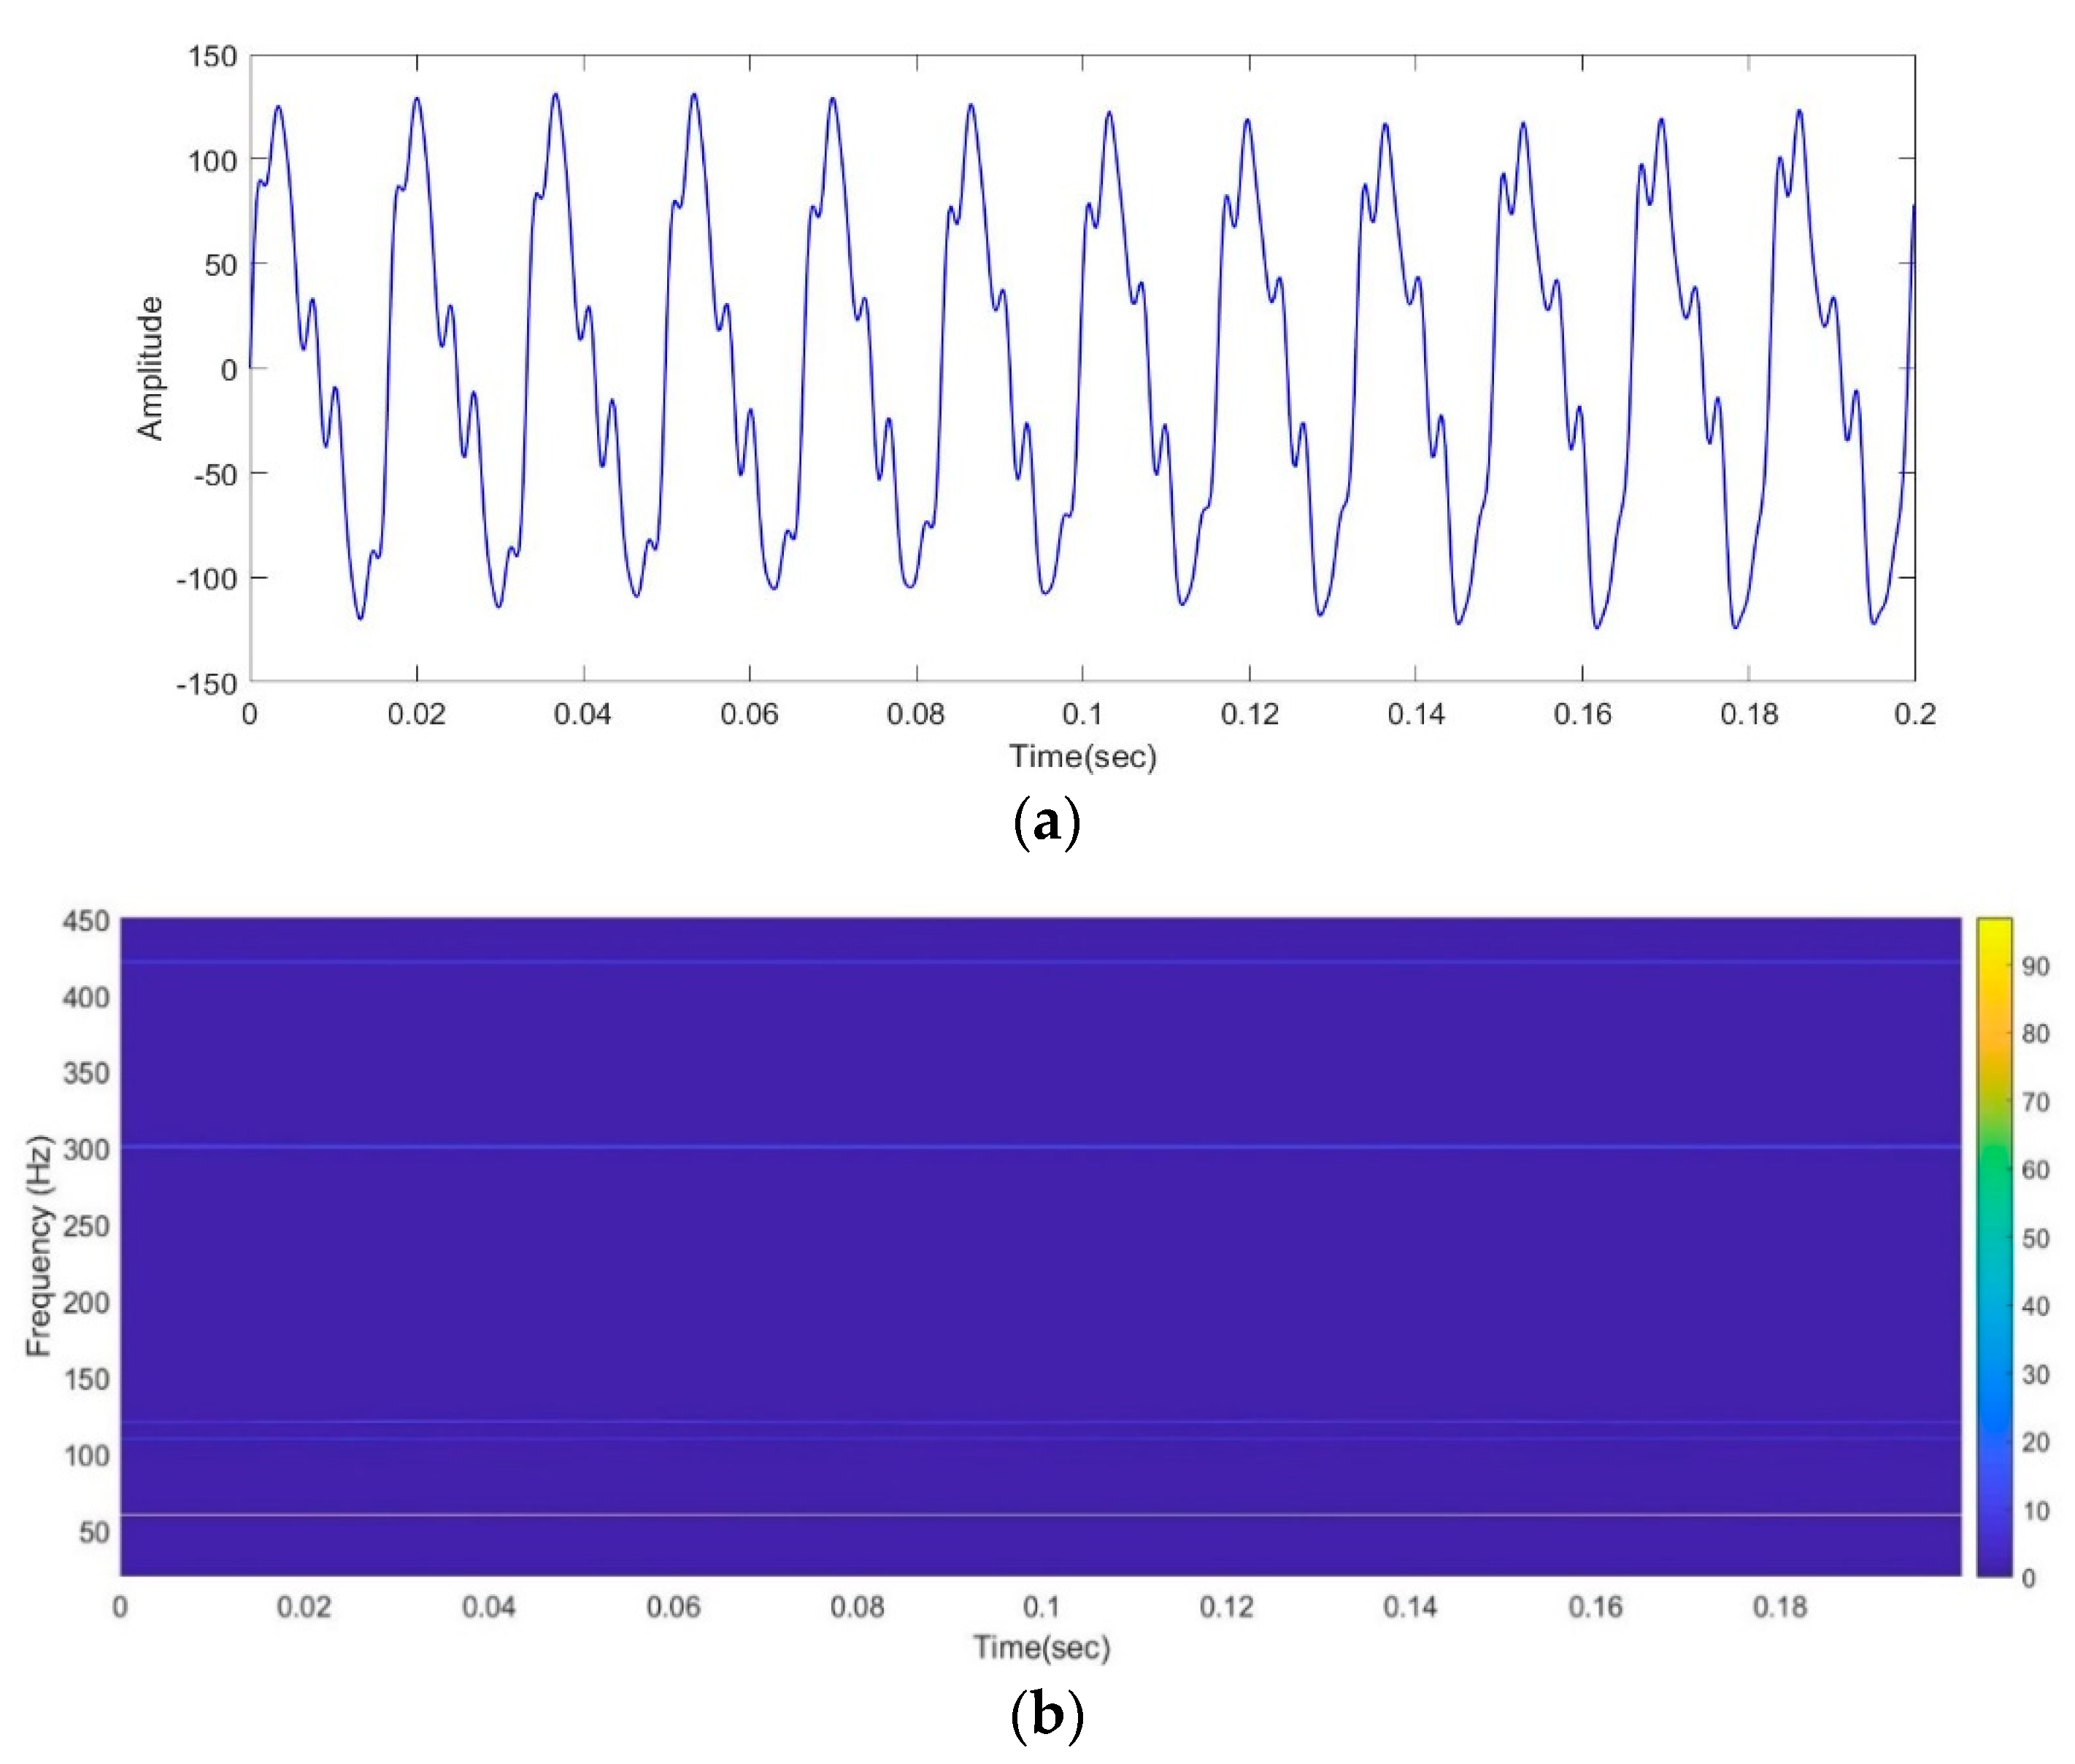
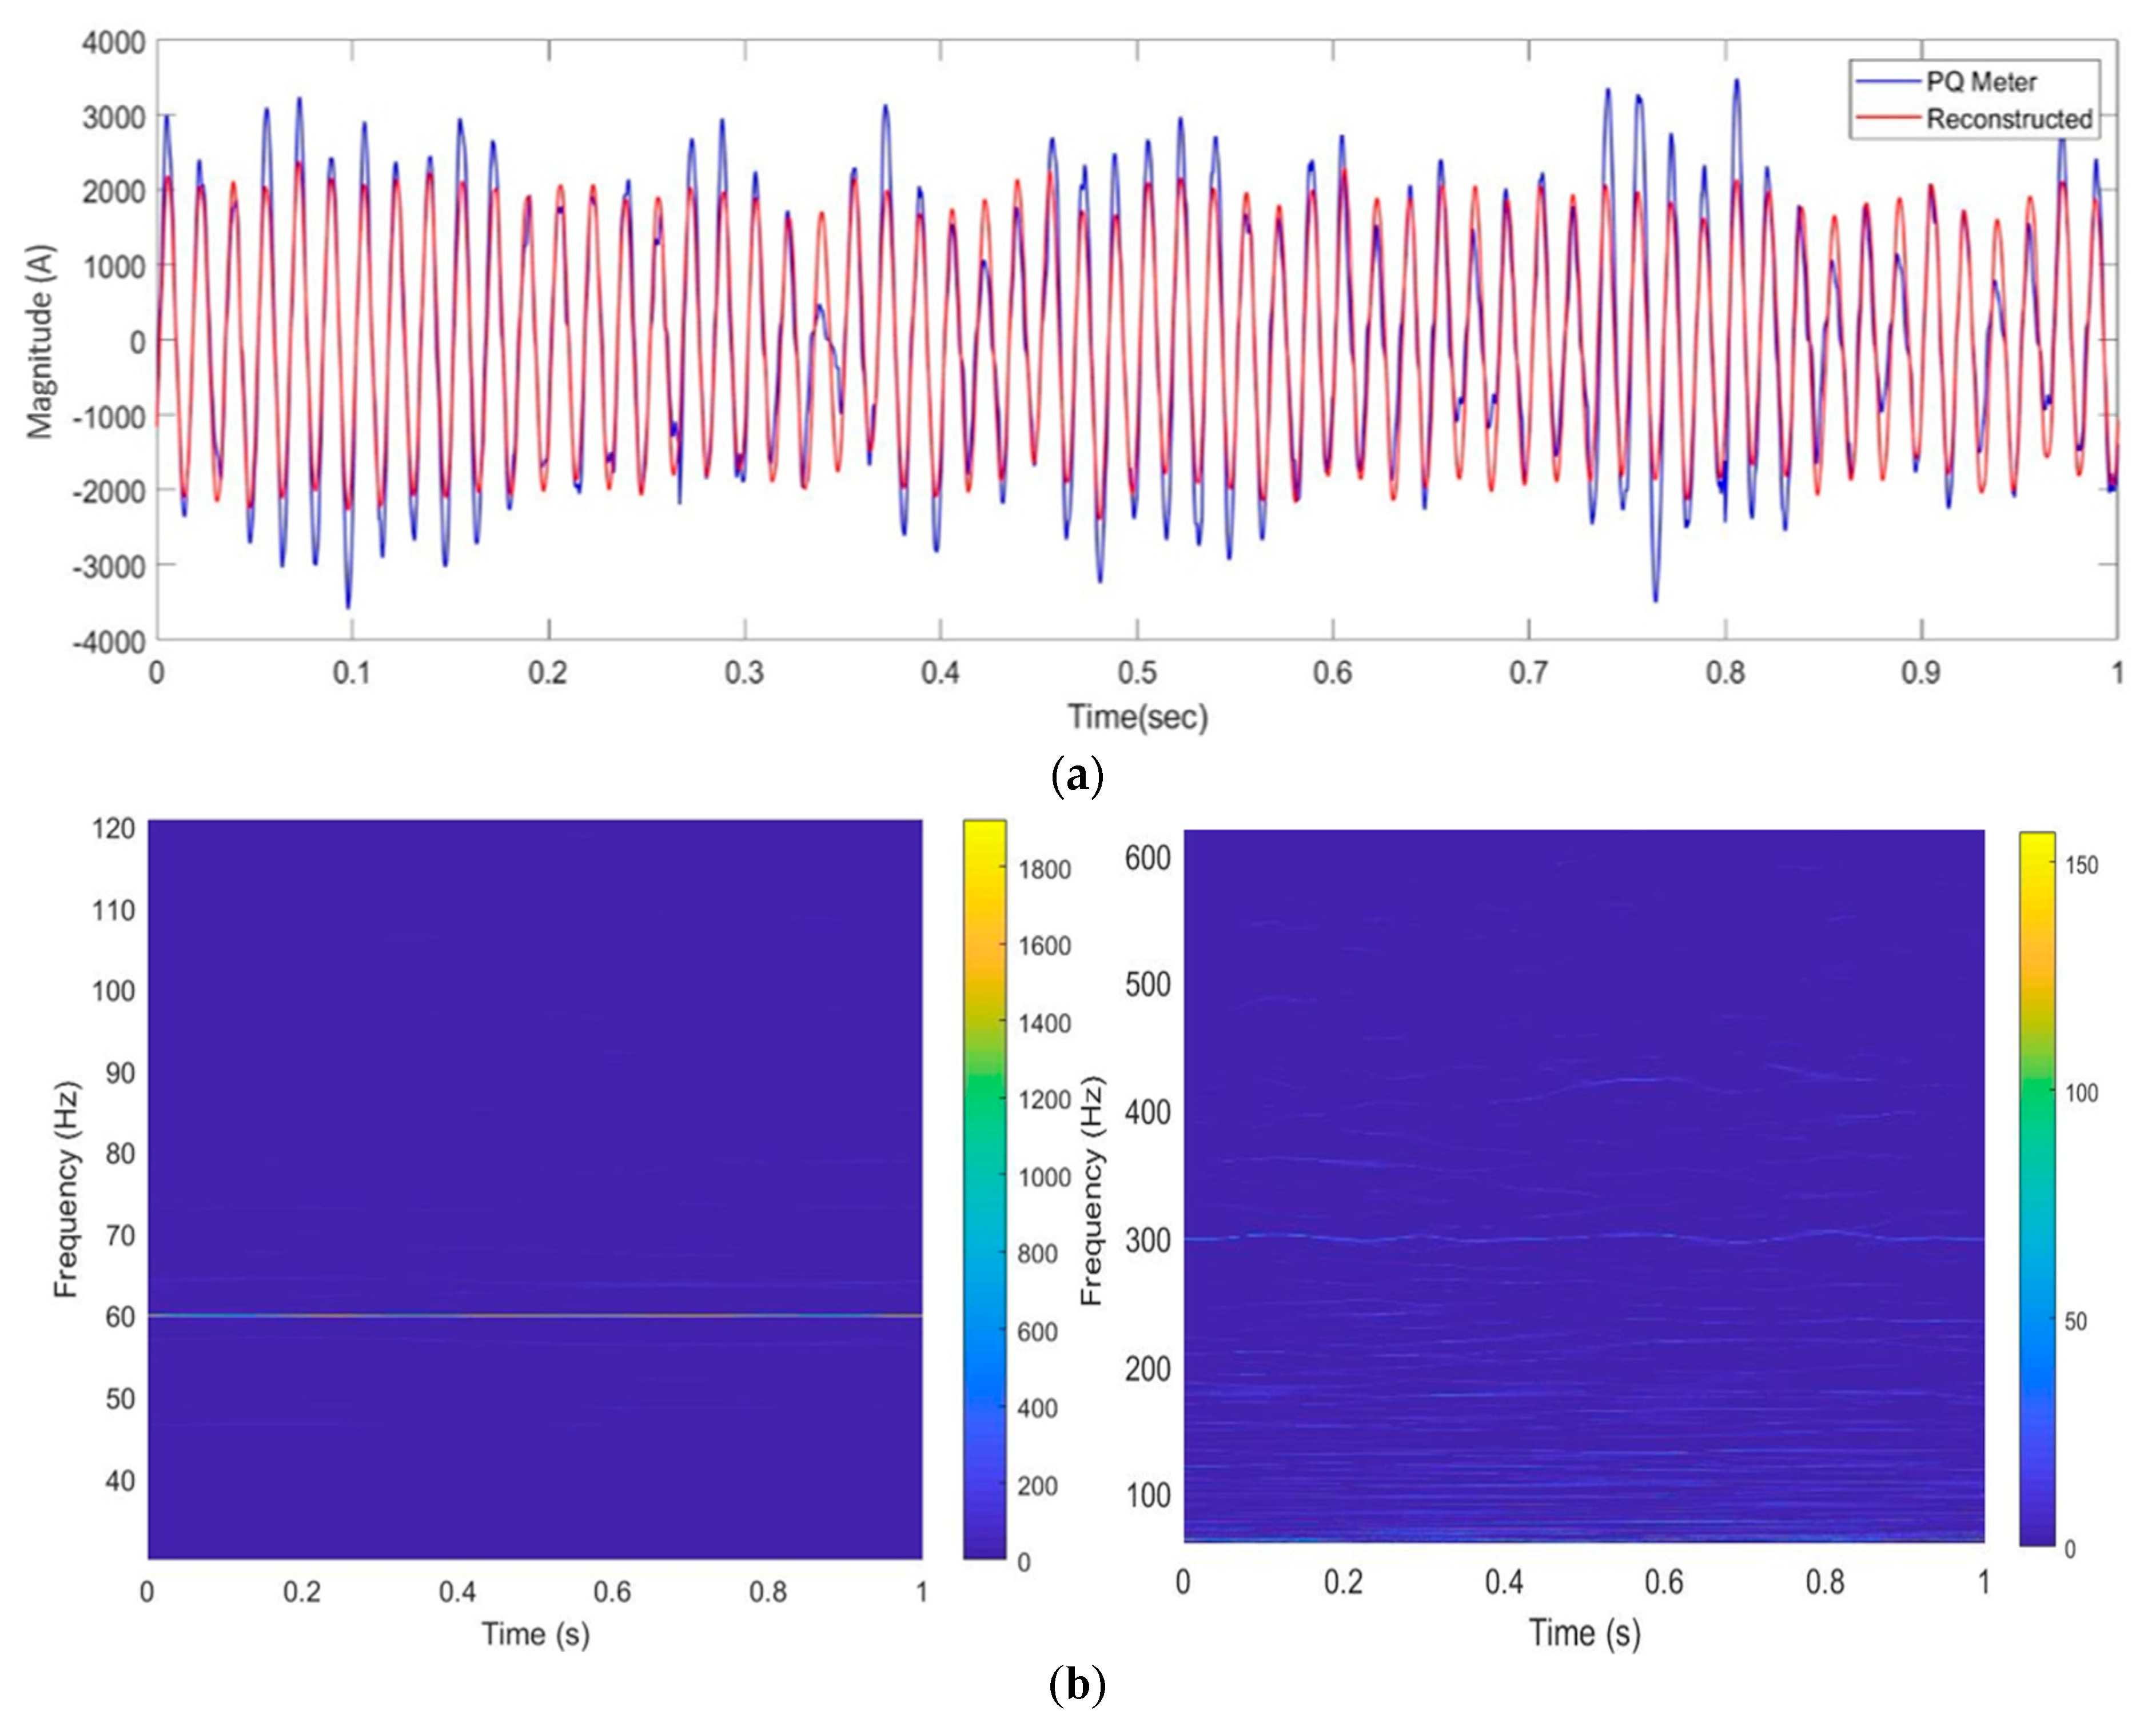
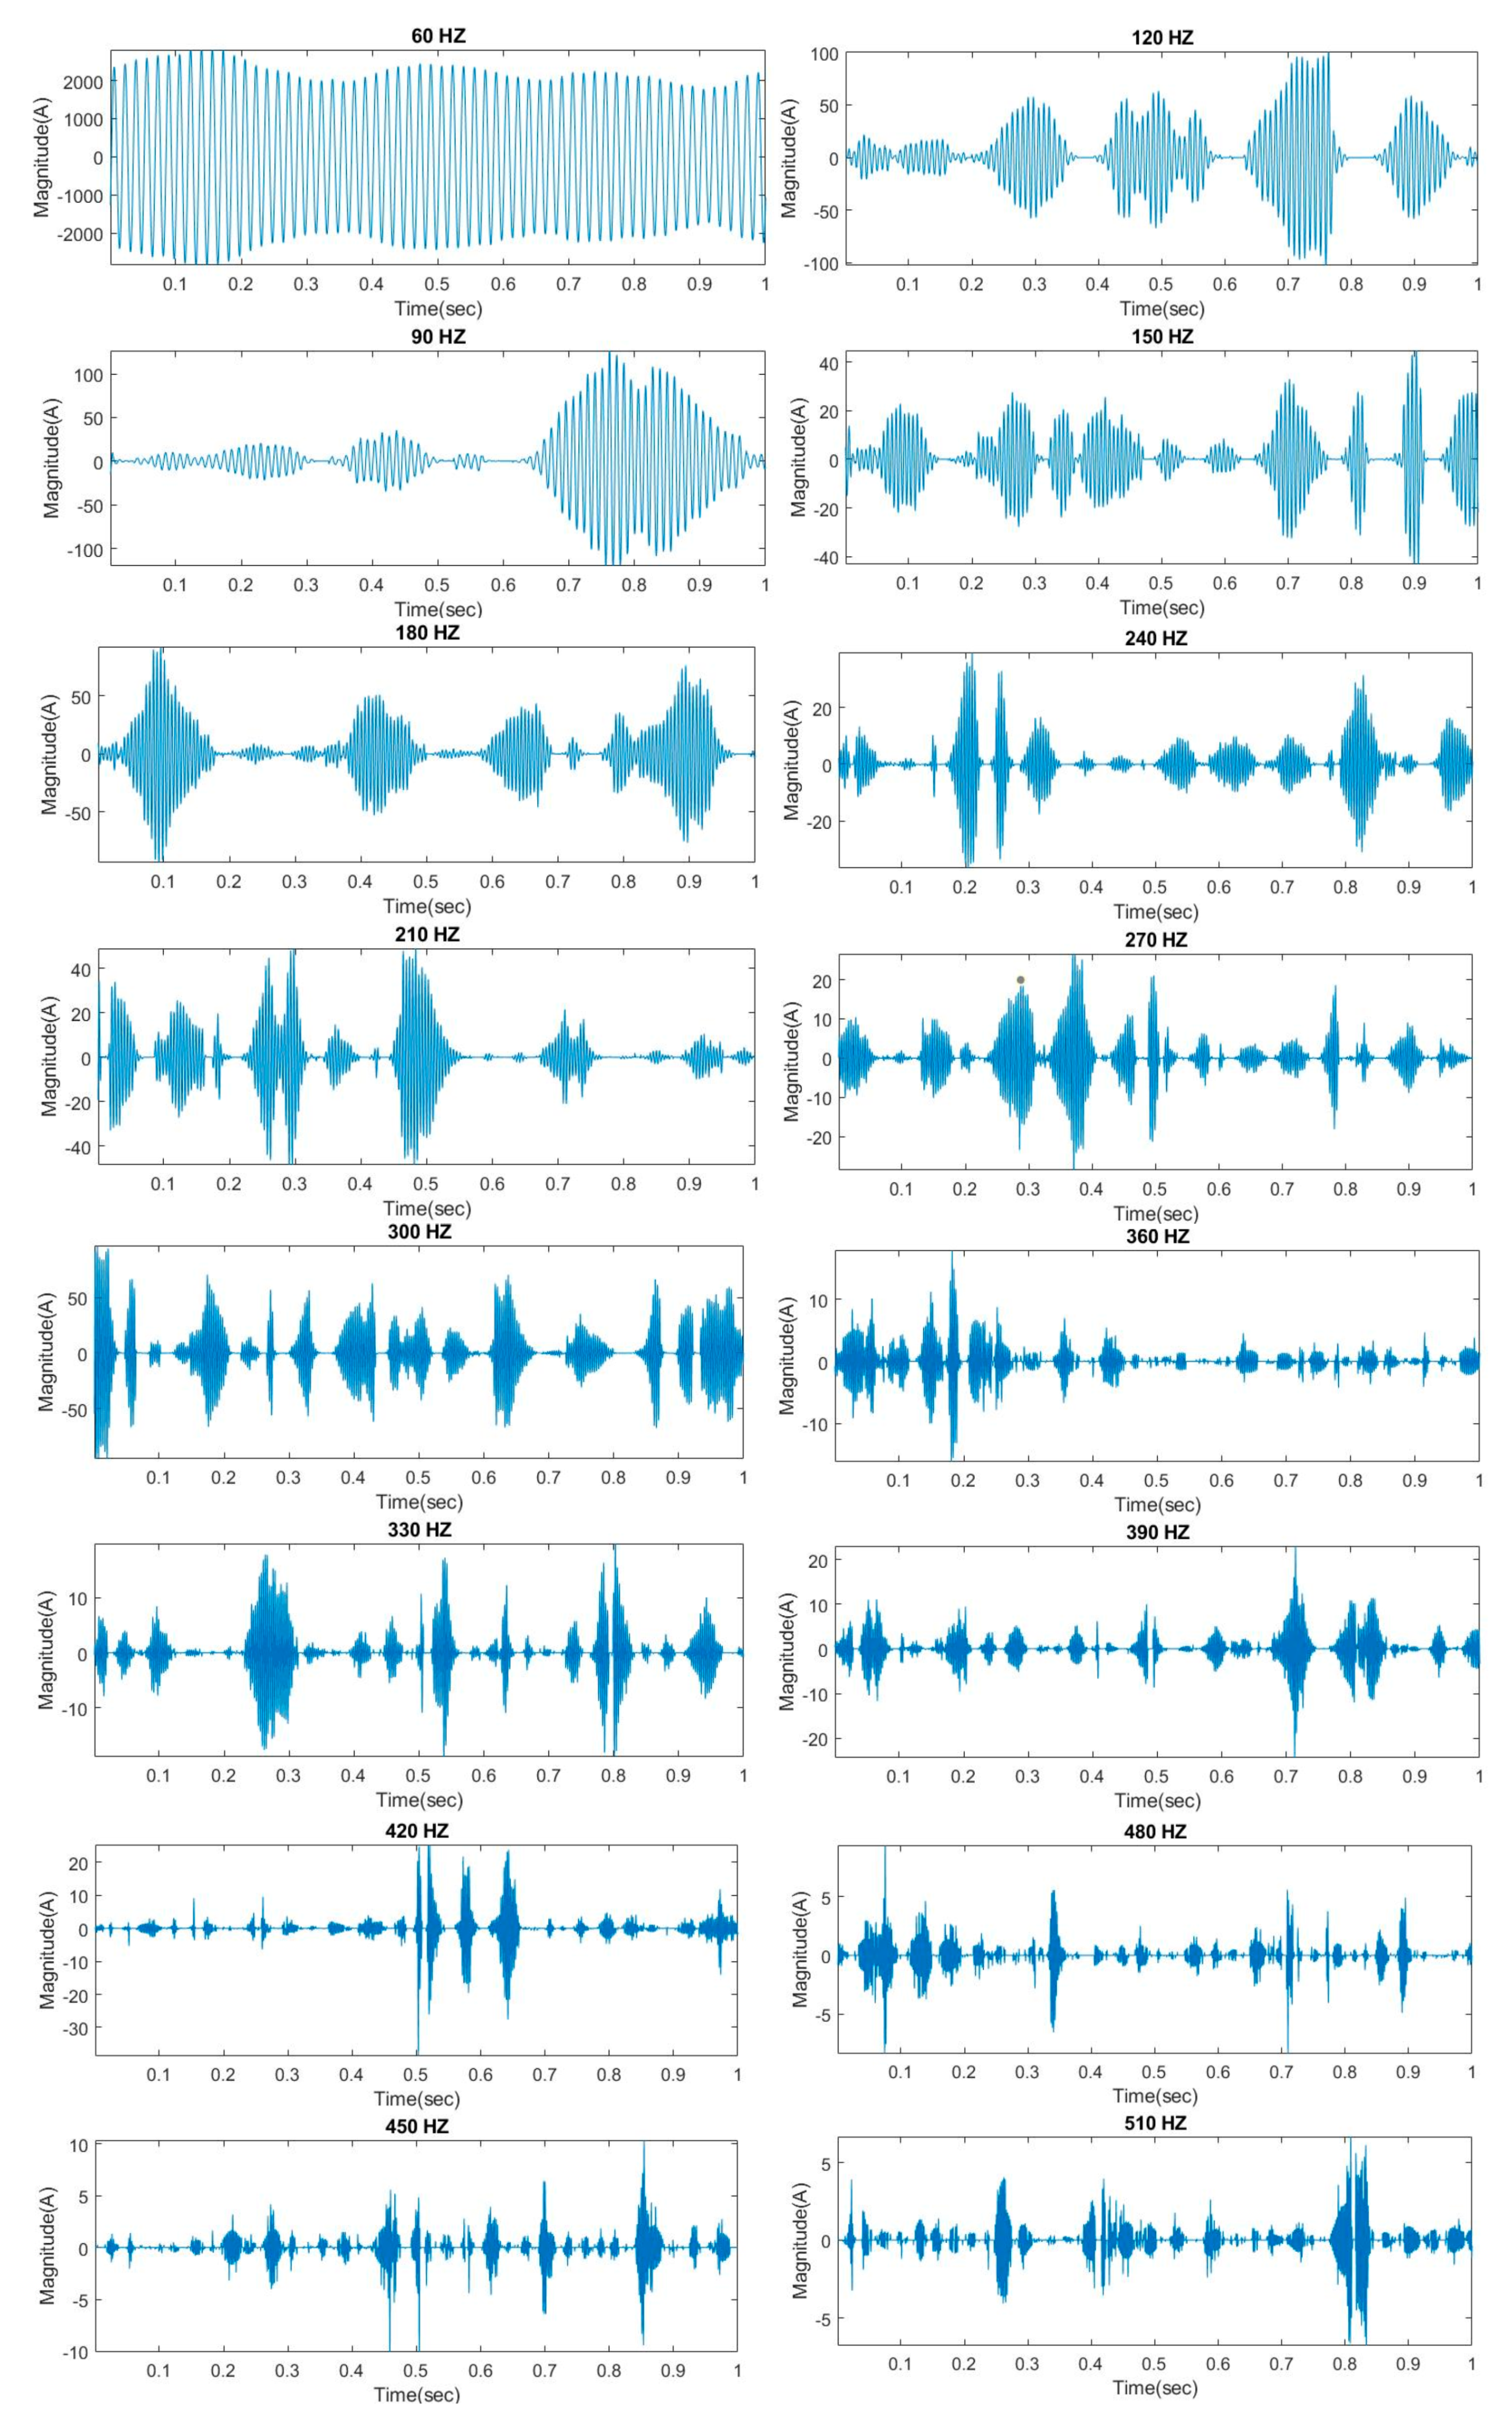
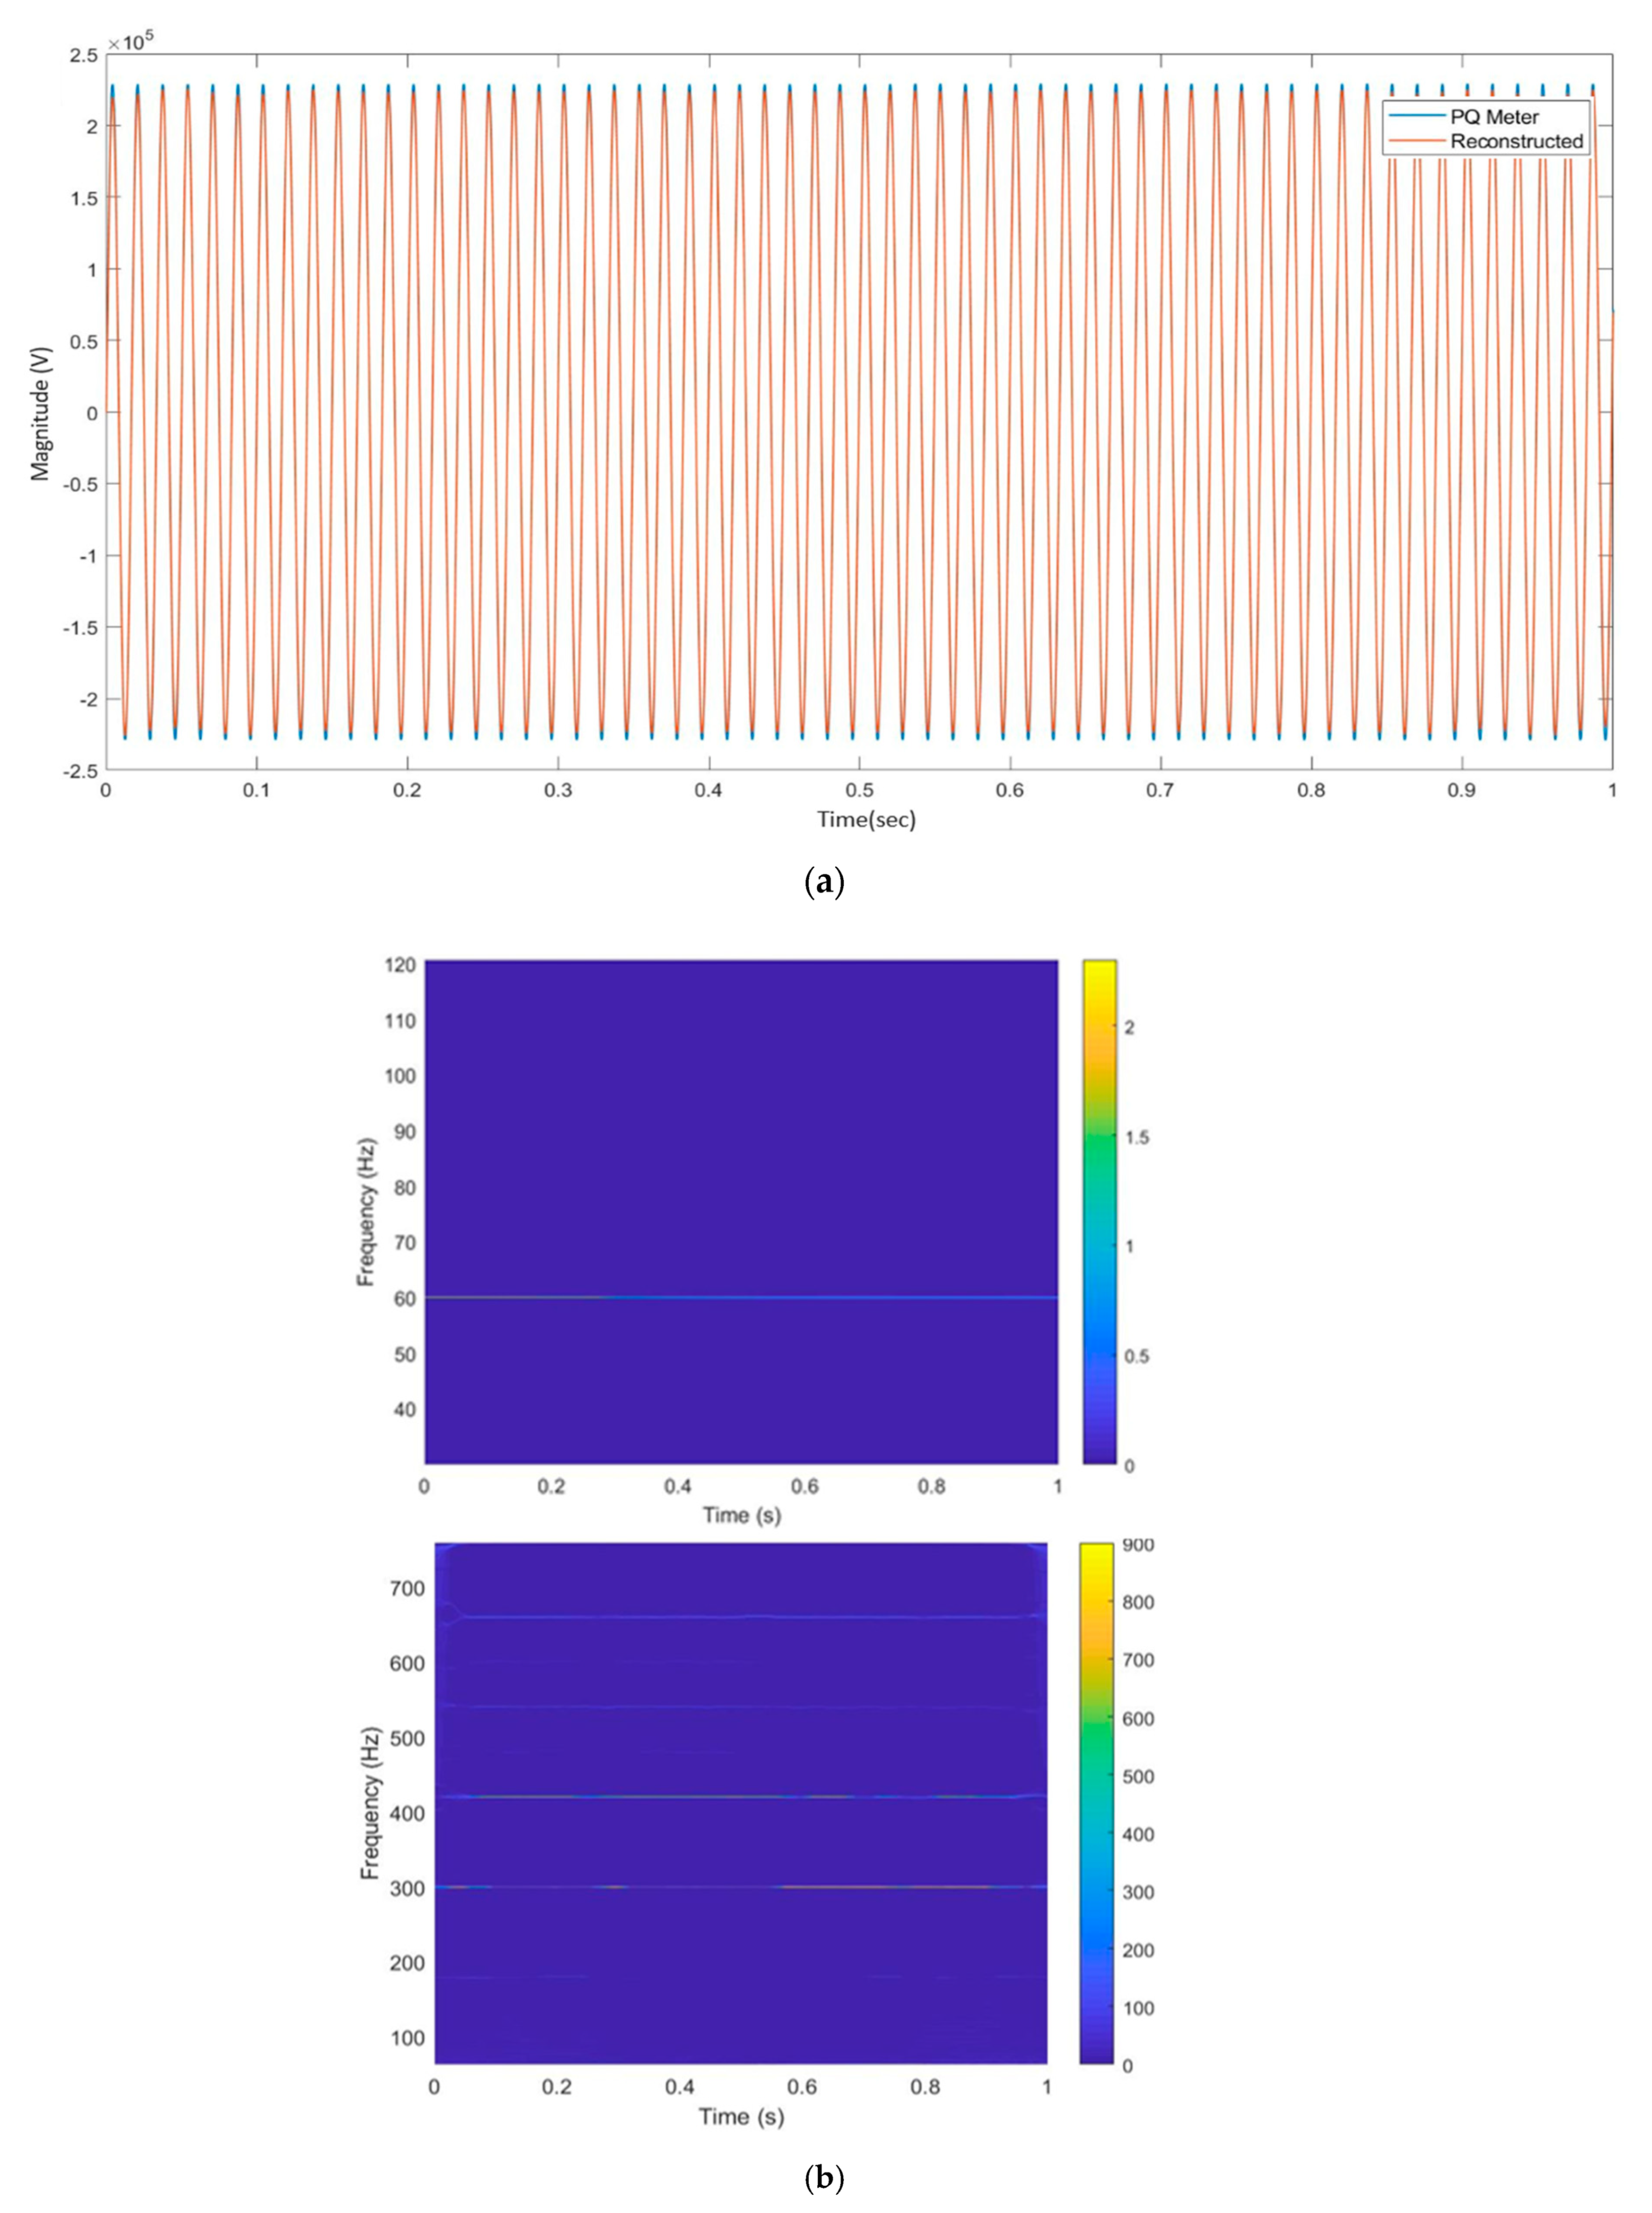
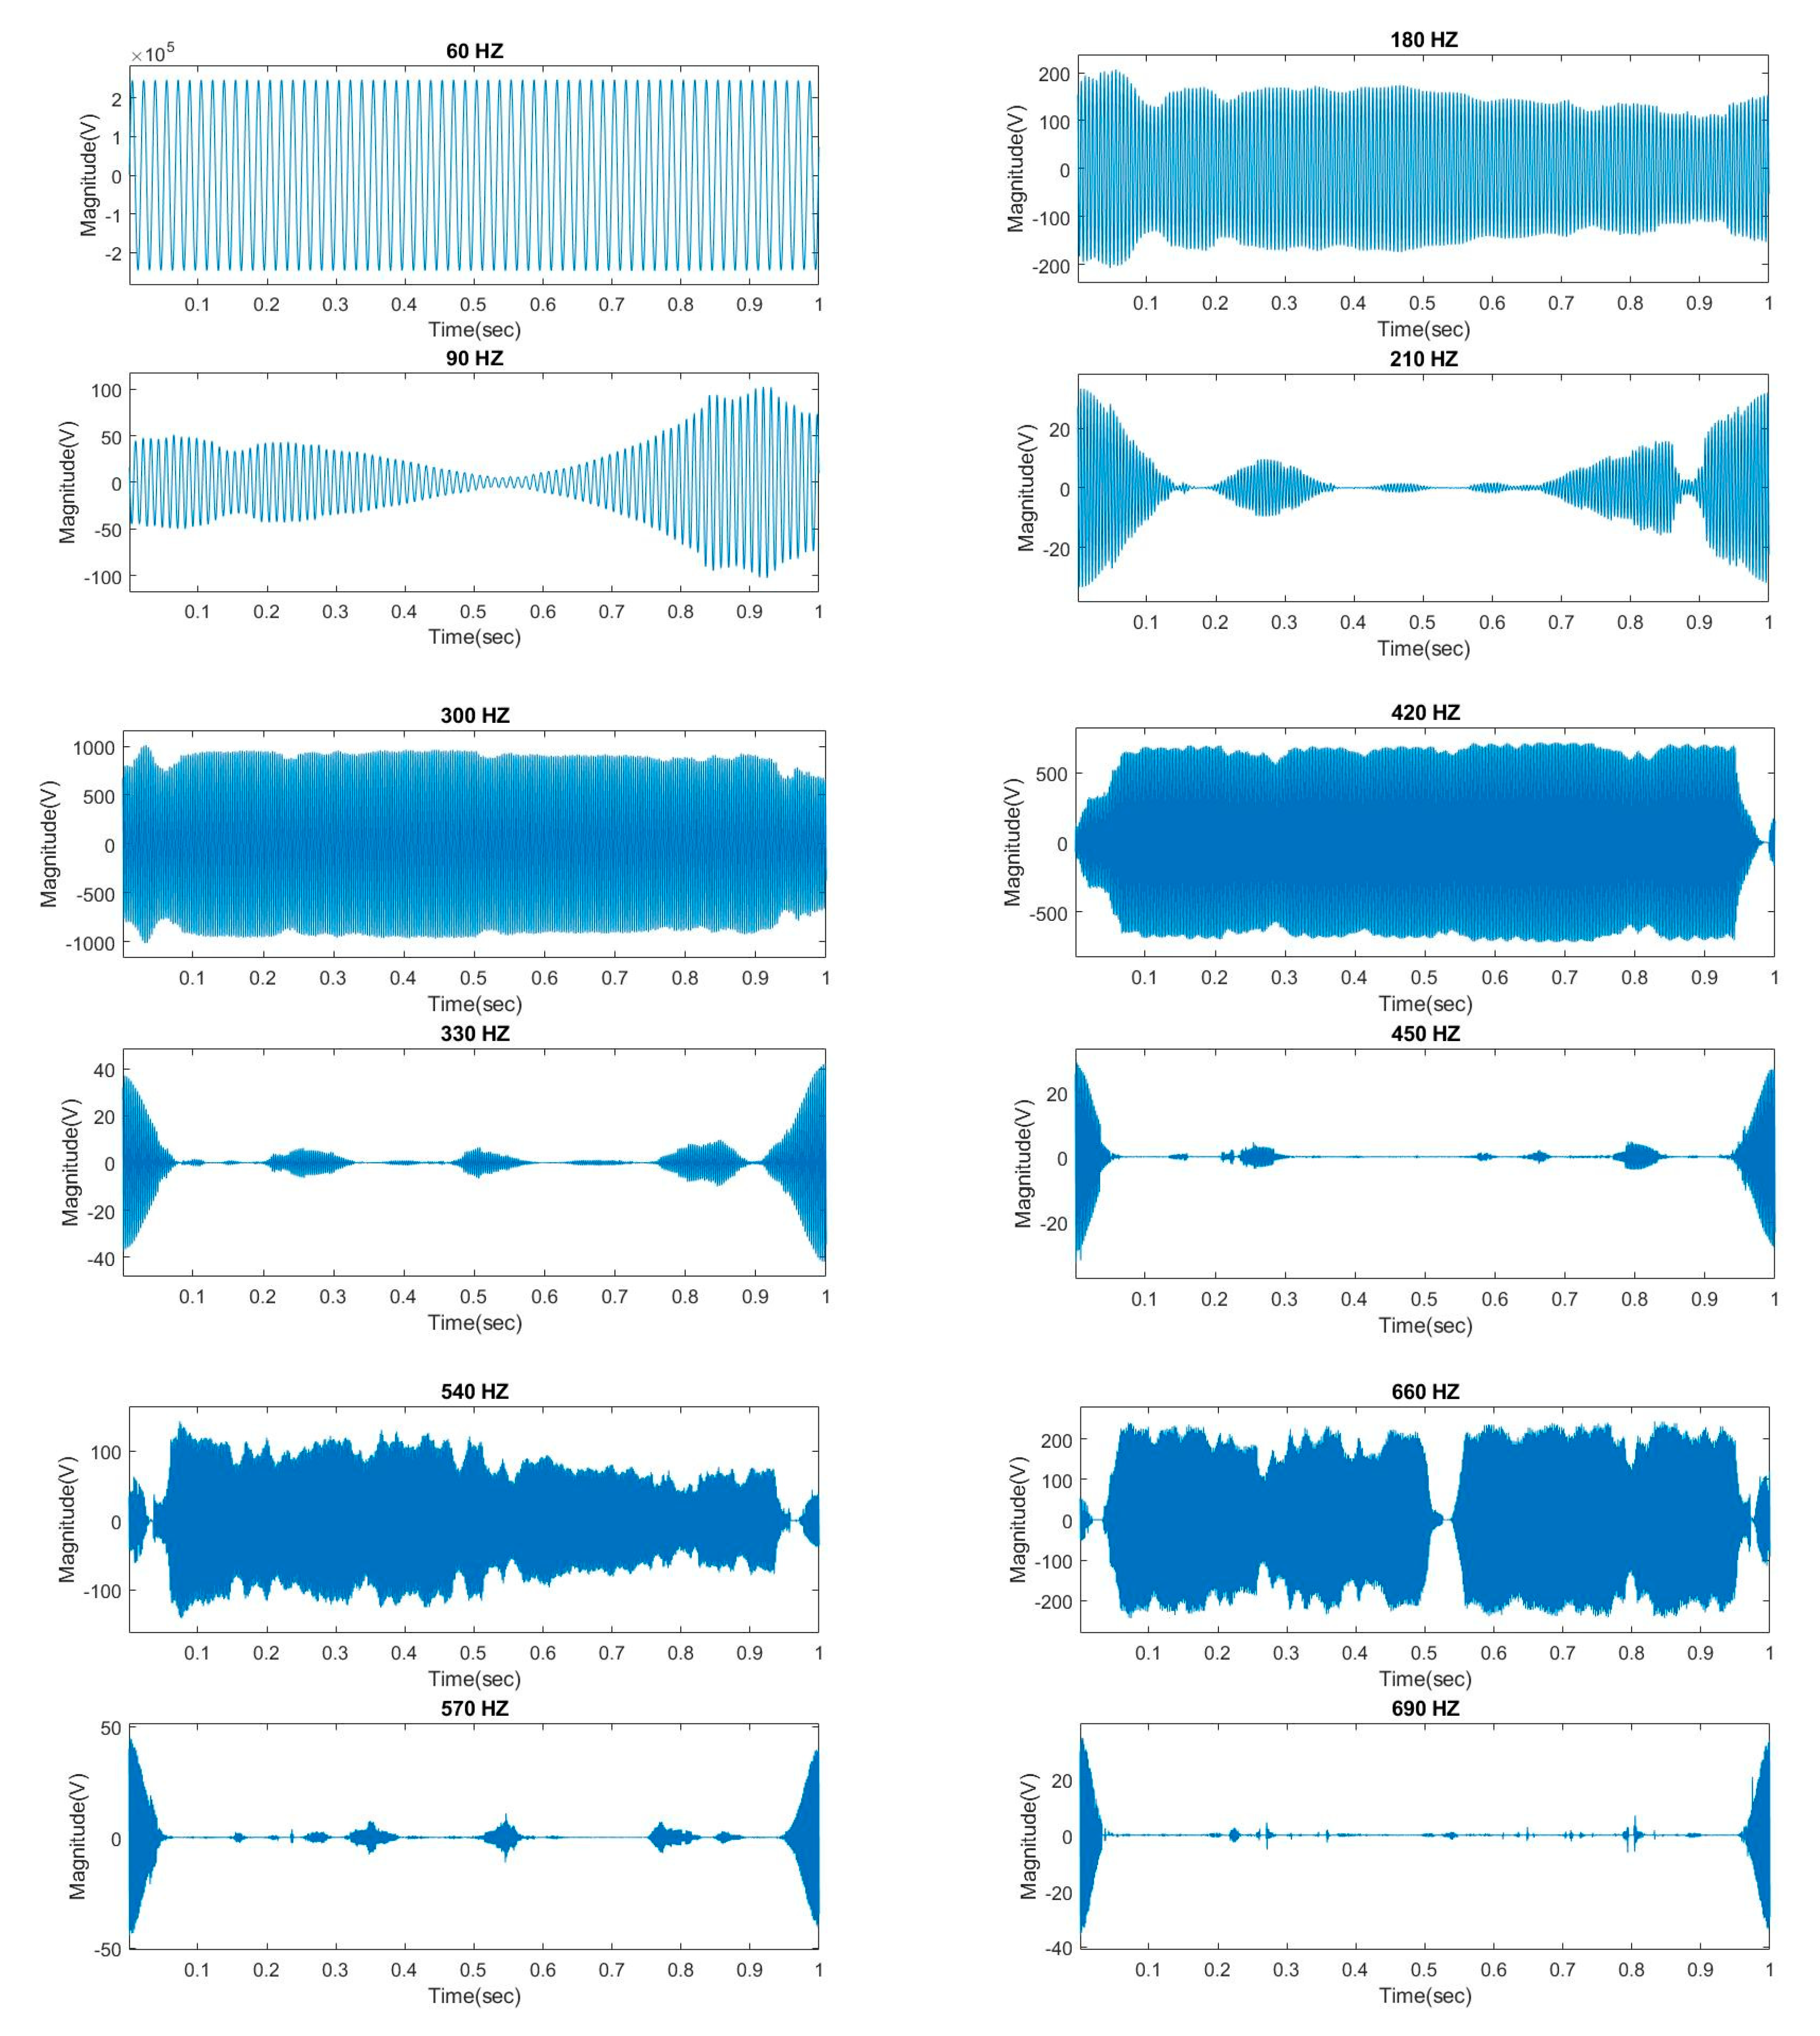
In this section, the measured current waveform of an EAF and the voltage waveform at a 161 kV bus connected with a 128 MW offshore wind farm by a commercialized power-quality meter (PQM) is applied. The results obtained from the proposed method are compared with the results analyzed by the PQM. Figure 10a illustrates the actual measured EAF current waveform by the PQM and the reconstructed one. Figure 10b depicts the time–frequency ridges. Figure 11 shows the reconstructed time-domain waveforms for selected frequency components up to 510 Hz using the inverse SSWT. For the offshore wind farm case, results are shown in Figure 12. Figure 13 illustrates the reconstructed time-domain waveforms for selected frequency components up to 690 Hz. Figure 14 also depicts the fundamental and major harmonic voltage magnitude variations of corresponding reconstructed time-domain waveforms in Figure 13.
In Figure 10, Figure 11, Figure 12, Figure 13 and Figure 14, several harmonic or interharmonic components with low magnitudes are recognized as noise. Some mismatches between actual measured and reconstructed current waveforms are observed because the highest frequency components are considered up to 510 Hz and 690 Hz, respectively. By observing Figure 10a and Figure 12a, the average errors between the reconstructed and actual measured waveforms are 2.1% and 14.7%, respectively. The average error is calculated by taking the sum of the absolute error between the difference of simulated and measured values at each point divided by the measured value for all points and then the sum of errors of all points is divided by the number of total measured points over one second. A larger average error is observed in Figure 12a, which is caused by neglecting the high-frequency terms in the waveform reconstruction and undetectable small-magnitude frequency components in the measured waveform. However, the reconstructed results obtained by the proposed method agree with the measured waveforms of PQM. Each time-varying frequency component of the measured waveforms can be accurately detected and the time-domain waveform for each frequency is well reconstructed.

6. Discussion

Observing the detected results of the study cases shows that the proposed method can estimate time-varying harmonics and interharmonics with better accuracy than FFT and other TFA methods provided that the optimized value of σ for the Morlet wavelet is properly initialized for the width of wavelet window. Also, it shows that the proposed method is effective for the measurement of time-varying signals; even two-harmonic or interharmonic components have close frequencies and the assessed signal has noise. The performance comparisons using a commercialized PQ meter are also shown to validate the effectiveness of the proposed hybrid method. Though the proposed hybrid method has the aforementioned advantages, it is seen that during the waveform reconstruction for each harmonic and interharmonic component in the time domain, the resulting reconstructed waveform has deviations from the actual measured waveforms. The cause of the substantial error in performing SSWT is mainly associated with small-magnitude and high-frequency components in the measured waveform that are difficult to accurately detect.

7. Conclusions

In this paper, the synchrosqueezing wavelet transform (SSWT)-based method for time-varying harmonic and interharmonic detection has been proposed. The proposed method applies synchrosqueezing wavelet transform with optimized width factors of the mother wavelet window and a clustering method for accurate harmonic and interharmonic frequency detection. Then the inverse SSWT is applied to reconstruct the time-domain function for each detected frequency and the corresponding magnitude can be calculated accordingly. It is concluded that the proposed method is more effective and accurate for the detection of harmonics and interharmonics in a time-varying nature. The proposed method serves as a new tool for PQ measurement, especially for weakly time-varying signals including both magnitudes and frequencies. It is suitable for harmonic and interharmonic assessment in power networks and microgrids that have high penetration of renewables or non-linear loads causing time-varying voltage or current waveforms.

Author Contributions

G.W.C. provided the methodology, supervision, validation, and writing of the paper text. Y.-L.L. was incharge of the simulations of the proposed method. Y.-J.L. provided results and text validation. G.H.S. and J.T.Y. performed simulations of cases Section 5.4 and Section 5.5. All authors have read and agreed to the published version of the manuscript.

Funding

This research received no external funding.

Institutional Review Board Statement

Not applicable.

Informed Consent Statement

Not applicable.

Data Availability Statement

Data used for cases Section 5.1 through Section 5.4 were produced by Matlab software in this study. Data sharing for case Section 5.5 is not applicable to this article.

Conflicts of Interest

The authors declare no conflict of interest.

References

  1. Hidalgo, R.M.; Fernandez, J.G.; Rivera, R.R.; Larrondo, H.A. A simple adjustable window algorithm to improve FFT measurements. IEEE Trans. Instrum. Meas. 2002, 51, 31–36. [Google Scholar] [CrossRef]
  2. Agrez, D. Weighted multipoint interpolated DFT to improve amplitude estimation of multifrequency signal. IEEE Trans. Instrum. Meas. 2002, 51, 287–292. [Google Scholar] [CrossRef]
  3. Testa, A.; Gallo, D.; Langella, R. On the Processing of Harmonics and Interharmonics: Using Hanning Window in Standard Framework. IEEE Trans. Power Deliv. 2004, 19, 28–34. [Google Scholar] [CrossRef]
  4. Bracale, A.; Caramia, P.; Carpinelli, G. Adaptive Prony method for waveform distortion detection in power systems. Int. J. Electr. Power Energy Syst. 2007, 29, 371–379. [Google Scholar] [CrossRef]
  5. Su, T.; Yang, M.; Jin, T.; Flesch, R.C.C. Power harmonic and interharmonic detection method in renewable power based on Nuttall double-window all-phase FFT algorithm. IET Renew. Power Gener. 2018, 12, 953–961. [Google Scholar] [CrossRef]
  6. Jain, S.K.; Singh, S.N. Low-Order Dominant Harmonic Estimation Using Adaptive Wavelet Neural Network. IEEE Trans. Ind. Electron. 2013, 61, 428–435. [Google Scholar] [CrossRef]
  7. Enayati, J.; Moravej, Z. Real-time harmonics estimation in power systems using a novel hybrid algorithm. IET Gener. Transm. Distrib. 2017, 11, 3532–3538. [Google Scholar] [CrossRef]
  8. Sheshyekani, K.; Fallahi, G.; Hamzeh, M.; Kheradmandi, M. A General Noise-Resilient Technique Based on the Matrix Pencil Method for the Assessment of Harmonics and Interharmonics in Power Systems. IEEE Trans. Power Deliv. 2017, 32, 2179–2188. [Google Scholar] [CrossRef]
  9. Oubrahim, Z.; Choqueuse, V.; Amirat, Y.; Benbouzid, M.E.H. Maximum-Likelihood Frequency and Phasor Estimations for Electric Power Grid Monitoring. IEEE Trans. Ind. Inform. 2017, 14, 167–177. [Google Scholar] [CrossRef]
  10. Prado, T.D.A.; Barros, A.M.; Guarneri, G.A. An Algorithm Based on Sparse Decomposition for Estimating Harmonic and Interharmonic Components of Stationary Signals in Power Systems. IEEE Access 2019, 7, 163958–163968. [Google Scholar] [CrossRef]
  11. Karimi-Ghartemani, M.; Iravani, M.R. Measurement of harmonics/inter-harmonics of time-varying frequencies. IEEE Trans. Power Deliv. 2005, 20, 23–31. [Google Scholar] [CrossRef]
  12. Lin, H.C. Fast Tracking of Time-Varying Power System Frequency and Harmonics Using Iterative-Loop Approaching Algorithm. IEEE Trans. Ind. Electron. 2007, 54, 974–983. [Google Scholar] [CrossRef]
  13. Chen, C.I.; Chang, G.W.; Hong, R.C.; Li, H.M. Extended Real Model of Kalman Filter for Time-Varying Harmonics Estimation. IEEE Trans. Power Deliv. 2010, 25, 17–26. [Google Scholar] [CrossRef]
  14. Dash, P.K.; Krishnanand, K.R.; Patnaik, R.K. Dynamic phasor and frequency estimation of time-varying power system signals. Int. J. Electr. Power Energy Syst. 2013, 44, 971–980. [Google Scholar] [CrossRef]
  15. Jain, S.K. Algorithm for dealing with time-varying signal within sliding-window for harmonics estimation. IET Sci. Meas. Technol. 2015, 9, 1023–1031. [Google Scholar] [CrossRef]
  16. Narduzzi, C.; Bertocco, M.; Frigo, G.; Giorgi, G. Fast-TFM—Multifrequency Phasor Measurement for Distribution Networks. IEEE Trans. Instrum. Meas. 2018, 67, 1825–1835. [Google Scholar] [CrossRef]
  17. Balouji, E.; Bäckström, K.; McKelvey, T.; Salor, Ö. Deep-Learning-Based Harmonics and Interharmonics Predetection Designed for Compensating Significantly Time-Varying EAF Currents. IEEE Trans. Ind. Appl. 2020, 56, 3250–3260. [Google Scholar] [CrossRef]
  18. Ashouri, M.; Silva, F.F.D.; Bak, C.L. Application of short-time Fourier transform for harmonic-based protection of meshed VSC-MTDC grids. J. Eng. 2019, 2019, 1439–1443. [Google Scholar] [CrossRef]
  19. Ravindran, V.; Busatto, T.; Rönnberg, S.K.; Meyer, J.; Bollen, M.H.J. Time-Varying Interharmonics in Different Types of Grid-Tied PV Inverter Systems. IEEE Trans. Power Deliv. 2020, 35, 483–496. [Google Scholar] [CrossRef]
  20. Mishra, S.; Bhende, C.N.; Panigrahi, B.K. Detection and Classification of Power Quality Disturbances Using S-Transform and Probabilistic Neural Network. IEEE Trans. Power Deliv. 2007, 23, 280–287. [Google Scholar] [CrossRef]
  21. Ashrafian, A.; Mirsalim, M. On-line recursive method of phasor and frequency estimation for power system monitoring and relaying. IET Gener. Transm. Distrib. 2016, 10, 2002–2011. [Google Scholar] [CrossRef]
  22. Santoso, S.; Grady, W.M.; Powers, E.J.; Lamoree, J.; Bhatt, S.C. Characterization of distribution power quality events with Fourier and wavelet transforms. IEEE Trans. Power Deliv. 2000, 15, 247–254. [Google Scholar] [CrossRef]
  23. Daubechies, I.; Lu, J.; Wu, H.-T. Synchrosqueezed wavelet transforms: An empirical mode decomposition-like tool. Appl. Comput. Harmon. Anal. 2011, 30, 243–261. [Google Scholar] [CrossRef] [Green Version]
  24. Oberlin, T.; Meignen, S.; Perrier, V. The fourier-based synchrosqueezing transform. In Proceedings of the IEEE International Conference on Acoustics, Speech and Signal Processing (ICASSP), Florence, Italy, 4–9 May 2014; pp. 315–319. [Google Scholar]
  25. Li, C.; Liang, M. A generalized synchrosqueezing transform for enhancing signal time–frequency representation. Signal Process. 2012, 92, 2264–2274. [Google Scholar] [CrossRef]
  26. Meignen, S.; Pham, D.-H.; McLaughlin, S. On Demodulation, Ridge Detection, and Synchrosqueezing for Multicomponent Signals. IEEE Trans. Signal Process. 2017, 65, 2093–2103. [Google Scholar] [CrossRef] [Green Version]
  27. Arlia, D.; Coppola, M. Experiments in Parallel Clustering with DBSCAN. In Proceedings of the 7th International Euro-Par Conference on Parallel Processing, Manchester, UK, 28–31 August 2001; pp. 28–31. [Google Scholar]
  28. Singh, A.K.; Fozdar, M. DBSCAN-based coherency identification of generators using complex wavelet transform. J. Eng. 2019, 2019, 4780–4784. [Google Scholar] [CrossRef]
  29. Wang, S.; Chen, X.; Tong, C.; Zhao, Z. Matching Synchrosqueezing Wavelet Transform and Application to Aeroengine Vibration Monitoring. IEEE Trans. Instrum. Meas. 2017, 66, 360–372. [Google Scholar] [CrossRef]
  30. Feng, Z.; Chen, X.; Liang, M. Iterative generalized synchrosqueezing transform for fault diagnosis of wind turbine planetary gearbox under nonstationary conditions. Mech. Syst. Signal Process. 2015, 52–53, 360–375. [Google Scholar] [CrossRef]
  31. Estevez, P.G.; Marchi, P.; Galarza, C.G.; Elizondo, M. Non-Stationary Power System Forced Oscillation Analysis using Synchrosqueezing Transform. IEEE Trans. Power Syst. 2020. [Google Scholar] [CrossRef]
  32. Huang, N.E.; Shen, Z.; Long, S.R.; Wu, M.C.; Shih, H.H.; Zheng, Q.; Yen, N.-C.; Tung, C.C.; Liu, H.H. The empirical mode decomposition and the Hilbert spectrum for nonlinear and non-stationary time series analysis. Proc. R. Soc. A Math. Phys. Eng. Sci. 1998, 454, 903–995. [Google Scholar] [CrossRef]
  33. Frey, B.J.; Dueck, D. Clustering by Passing Messages Between Data Points. Science 2007, 315, 972–976. [Google Scholar] [CrossRef] [PubMed] [Green Version]
  34. Comaniciu, D.; Meer, P. Mean shift: A robust approach toward feature space analysis. IEEE Trans. Pattern Anal. Mach. Intell. 2002, 24, 603–619. [Google Scholar] [CrossRef] [Green Version]
  35. Busch, P.; Heinonen, T.; Lahti, P. Heisenberg’s uncertainty principle. Phys. Rep. 2007, 452, 155–176. [Google Scholar] [CrossRef] [Green Version]
  36. Nikolaou, N.; Antoniadis, I. Demodulation of vibration signals generated by defects in rolling element bearings using complex shifted Morlet wavelets. Mech. Syst. Signal Process. 2002, 16, 677–694. [Google Scholar] [CrossRef]
  37. Wavelet Synchrosqueezing. Available online: https://www.mathworks.com/help/wavelet/gs/wavelet-synchrosqueezing.html (accessed on 15 April 2020).
  38. Time Frequency Representations. Available online: http://py-biomedical.lancs.ac.uk/ (accessed on 15 April 2020).
  39. DBSCAN Clustering Algorithm. Available online: https://www.mathworks.com/matlabcentral/fileexchange/52905-dbscan-clustering-algorithm (accessed on 25 April 2020).
Figure 1. (a) Input time-domain signal, (b) SSWT modulus, (c) the ridges extracted from SSWT, (d) signal reconstruction in intrinsic mode functions.
Applsci 11 00752 g001
Figure 2. Results of DBSCAN clustering.
Applsci 11 00752 g002
Figure 3. Core point, border point, and noise point.
Applsci 11 00752 g003
Figure 4. Density-reachable and density-connected.
Applsci 11 00752 g004
Figure 5. The flowchart of proposed solution procedure for harmonic and interharmonic detection.
Applsci 11 00752 g005
Figure 6. Performances of detection for multiple frequency components signal of (13): (a) frequency-modulated signal, and results of (b) STFT, (c) CWT, (d) FSST, (e) SSWT.
Applsci 11 00752 g006
Figure 7. Performances of detection for the noise-contaminated signal of (13) using (a) STFT, (b) CWT, (c) FSST, (d) SSWT.
Applsci 11 00752 g007aApplsci 11 00752 g007b
Figure 8. (a) Simulated waveform; TF plots obtained (b) STFT, (c) CWT, (d) FSST, (e) SSWT.
Applsci 11 00752 g008
Figure 9. (a) The simulated waveform, (b) the detected TF ridges, (c) zoomed-in view of two TF ridges with close frequencies by the proposed method, (d) the detected central frequencies shown in color dots of each rigid of (b) using DBSCAN.
Applsci 11 00752 g009aApplsci 11 00752 g009b
Figure 10. EAF case: (a) the actual measured current waveform and reconstructed one using the proposed method, (b) time–frequency ridges.
Applsci 11 00752 g010
Figure 11. EAF case: selected reconstructed time-domain waveforms up to 510 HZ corresponding to Figure 10b.
Applsci 11 00752 g011
Figure 12. Offshore wind farm case: (a) the actual measured current waveform and reconstructed one using the proposed method, (b) time–frequency ridges.
Applsci 11 00752 g012
Figure 13. Offshore wind farm case: selected reconstructed time-domain waveforms up to 690 Hz corresponding to Figure 12b.
Applsci 11 00752 g013
Figure 14. Offshore wind farm case: fundamental and major harmonic voltage magnitude variations of corresponding reconstructed time-domain waveforms in Figure 13.
Applsci 11 00752 g014aApplsci 11 00752 g014b
Table 1. The performance of time–frequency resolution under different sizes of Δt.
When Δt Is LargeWhen Δt Is Small
Large scaling factor(|a|), low frequencySmall scaling factor(|a|), high frequency
Good frequency resolutionPoor frequency resolution
Poor time resolutionGood time resolution
Table 2. Performance of frequency estimation of the proposed method.
Actual Frequency
(Hz)
f1
60.3
f2
116
f3
120.6
f4
301.5
f5
421.1
DBSCANDetected60.2465116.0265120.5671301.7181421.3898
Absolute Error0.05350.02650.03290.21810.2898
FFTDetected60115120300420
Absolute Error0.310.61.51.1
Publisher’s Note: MDPI stays neutral with regard to jurisdictional claims in published maps and institutional affiliations.