Article

Impact of Ferment Processing Parameters on the Quality of White Pan Bread

1
Technical Division of Cereals Canada, Canadian International Grains Institute, Main Street 1000-303, Winnipeg, MB R3C 3G7, Canada
2
Warburtons, Hereford House, Bolton B1L 8JB, UK
3
Warburtons Foods Ltd., Saint Francois Xavier, Antigonish, MB R4L 1A9, Canada
*
Author to whom correspondence should be addressed.
Appl. Sci. 2021, 11(21), 10203; https://doi.org/10.3390/app112110203
Submission received: 27 September 2021 / Revised: 23 October 2021 / Accepted: 25 October 2021 / Published: 31 October 2021
(This article belongs to the Special Issue Cereal-Based Foods)

Abstract

:
A controlled fermentation process using straight-grade wheat flour, commercially milled from a grist of Canada Western Red Spring (CWRS) wheat and English wheat, and fresh yeast (Saccharomyces cerevisiae) was found to be effective for developing a naturally derived product (ferment) that could be used for processing bread with the minimum use of dough improvers. The effects of ferment storage, fermentation time, and fermentation temperature on the quality of ferment and bread were evaluated to establish optimal conditions to produce a mature ferment. Trials were conducted on a pilot scale for greater relevance to industrialized bakeries. Ferment was assessed for total titratable acidity (TTA), pH, and viscosity. Breads made with ferment were evaluated for processing parameters, dough properties, and bread quality and compared to a control prepared without ferment. During fermentation, maximum TTA levels in the ferment were achieved at 100 min, then decreased by the end of fermentation, and increased by 24 h of storage at 4 °C. Viscosity was stable during fermentation but decreased by 24 h of storage. Inclusion of ferment resulted in reduced mixing times and improved dough extensibility and crumb softness. Specific loaf volume was not impacted; a slight reduction in crumb brightness and crumb structure was detected. Fermentation for 240 min at 35 °C was determined as optimal with a storage time for 24 h.

1. Introduction

Fermentation, initiated by naturally present microorganisms, has been used since ancient times to produce food from milk, meat and fish, fruit and vegetables, pulses, cereals and other grains to prevent spoilage and improve flavour and texture. The health and nutritional benefits of fermented foods are well recognized [1,2,3]. Leavened bread is made using a fermentation process that is initiated either by naturally present yeast and bacteria (known as sourdough fermentation) or by addition of baker’s yeast. Both processes involve the conversion of fermentable monosaccharides in the flour, derived from starch by the action of amylolytic enzymes into carbon dioxide, alcohol, organic acids, and flavour precursors with the involvement of other enzymes [4]. During fermentation, the dough undergoes complex chemical and biological processes which help develop and mature the dough, allowing for the production of bread with high volume and improved flavour [5]. There are many factors that impact the rate of fermentation and its effect on the dough, including amount of water, temperature, acidity level, availability of the fermentable monosaccharides and nutrients to maintain the yeast in an active state. The amount of salt and sugar in the formulation is equally important [4,5,6]. Therefore, it is essential to establish the optimal balance of these factors to produce high-quality bread.
Pan bread can be made using varying bread-making processes which depend on the number of mixing stages used for preparing the dough. In a single mixing process, also known as a straight-dough process, all ingredients are mixed into the dough at once. The dough is allowed to ferment between mixing and dividing into individual pieces, which is referred as floor time. Dough fermentation can take up to 2.5 h to achieve proper maturation, referred to as a long-time fermentation baking process [7]. In a two-stage mixing process, also known as a sponge- and dough-baking process, a sponge is first prepared from a portion of flour, water, and yeast that is mixed in the first stage and allowed to ferment for 3–4 h. In the second stage, the remaining ingredients are added to the sponge to prepare the final dough [7]. Bread processed using a sponge and dough method is more flavourful and has good loaf volume, superior crumb texture and delayed staling compared to bread processed using the straight-dough method [5,8]. Despite the superior bread quality associated with the sponge and dough process, the straight-dough process is widely used because of its efficiency and reduced production time. Further savings in production time can be achieved by using the no-time dough-baking process, where fermentation time is eliminated or reduced to a minimum. Dough development occurs during the mixing stage using a high-speed mixer with the use of dough additives, which facilitate dough development and eliminate the need for extended fermentation [5]. These dough additives include oxidants, reducing agents, emulsifiers, preservatives, and other additives, which may be blended together to impart the desired functionality and improve dough machinability and bread quality, and are referred to as dough improvers [9]. Despite having a reduced production time, bread made using the no-time dough-baking process lacks flavour and tends to stale quicker unless crumb softeners are added [5].
Liquid ferments have been used successfully by the baking industry in a modified sponge and dough process. Compared to a conventional sponge, liquid ferments contain a higher amount of water, allowing it to be transferred by pumping directly to the dough mixer [10]. Pyler described a ferment process using a tank equipped with a stirring device to disperse water into the ingredients, allowing fermentation to take place under constant agitation and heating until a stabile pH was achieved indicating a maturation state of the ferment [11]. After this point, the ferment was used immediately to produce bread or cooled to be used at a later time. The main purpose of preparing a ferment was to pre-condition the yeast to optimize its function during bread making, thus reducing fermentation time of the dough. The amount of flour in a liquid ferment varies from 0% to 50%, with a higher percentage of flour resulting in improved bread quality [12]. Other advantages include reduced floor space in the bakery, lower labour requirements, increased production flexibility, improved sanitation, increased hydration, reduced time for dough mixing, improved dough machineability, stronger and more uniform dough, and bread with a softer crumb, better keeping quality, and improved flavour [13].
Limited research has been conducted to evaluate the impact of ingredients and processing variables that are used to prepare ferment. Flour quality used for ferment preparation should be consistent and of good protein quality [14]. Adequate fermentation is required for the ferment to reach maturation by monitoring the level of acid development by measuring the pH or total titratable acidity (TTA) [15]. A range of pH in liquid ferments between 4.5 and 5.2 appeared to be the most desirable for optimal conditioning of the gluten, enzymatic reactions, and preventing mould growth in bread [16]. Inorganic salts appeared to be effective in preventing the pH from dropping below 4.5 [16]. The amount of flour used affects the pH of the ferment, with ferments containing higher flour levels resulting in a more gradual decline in pH probably due to the buffering effect of flour [17]. Fermentation temperature (26–30 °C) has also been found to affect pH and TTA levels of ferment [17]. Longer fermentation times were required to reach optimum fermentation when ferments were prepared using a lower flour to water ratio at a fermentation temperature of 26 °C [17]. Longer fermentation times are also recommended for ferments containing higher amounts of flour to improve flour hydration and flavour development to produce bread with improved crumb softness and flavour and slower staling [18].
Consumer preference for foods that are free from artificial ingredients and are “clean label” is growing. Food processors are looking to develop products that are made from fewer ingredients, but also made from naturally derived ingredients [19], suggesting that the use of liquid ferment in the production of bread will gain more attention. Limited research has been undertaken to examine the factors that influence the quality of liquid ferments and their effects on bread quality. Therefore, it was the objective of this study to examine the use of liquid ferment in white pan bread using a no-time dough-baking process. Specifically, the effects of ferment storage time, fermentation time, and fermentation temperature on the quality of ferment and bread quality were investigated.

2. Materials and Methods

2.1. Materials

Straight-grade wheat flour, commercially milled from a grist of Canada Western Red Spring (CWRS) and English wheat, was obtained from Nelstrop William & Co., Ltd. (Stockport, UK). Fleischmann’s compressed fresh yeast (Saccharomyces cerevisiae) (AB Mauri, LaSalle, QC, Canada), Sifto food-grade salt (Compass Minerals, Mississauga, ON, Canada), and Rogers granulated sugar (Lantic Inc., Vancouver, BC, Canada) were purchased from BakeMark Canada (Winnipeg, MB, Canada). Canola oil (no name, Loblaws Inc., Brampton, ON, Canada) was purchased from a local grocery store (Winnipeg, MB, Canada). Dough improver (AB Mauri, London, UK) was supplied by Warburtons (Bolton, UK).

2.2. Evaluation of Flour Quality

Protein content (N × 5.7) was determined according to Williams et al. [20] using the LECO FP-528 (LECO Corp, St. Joseph, MI, USA). Falling number was determined using AACC 56-81.04 [21] using a Shakematic 1095 (Perten Instruments, Huddinge, Sweden). Moisture content was determined according to AACC 44-15.02 [21] using the single-stage procedure (130 °C, 1 h) and was used to correct flour weight for bread processing. Ash content was determined according to AACC 08-01.01 [21]. Samples were weighed into dishes previously dried at 600 °C for a minimum of 1 h and then incinerated overnight at 600 °C. Starch damage was determined according to AACC 76-33.01 [21]. Farinographs were performed using the Farinograph-E (CW Brabender, South Hackensack, NJ, USA; 300 g bowl) according to AACC 54-21.02 [21]. Flour pasting properties were determined according to AACC 76-21.01 (STD1, 13 min profile using an RVA4 (Perten Instruments, Sweden) [21]. All tests were performed in duplicate.

2.3. Ferment Preparation

A pilot-scale fermentation vessel (Briggs of Burton Plc, Staffordshire, UK) was used to prepare the ferment using a standard four-stage fermentation cycle (Table 1). The ferment was prepared according to the formulation provided in Table 2.
All ingredients were added to the fermentation vessel and mixed for a total of 15 min (Stages 1–3), which included two 2 min stoppages to manually scrape down the agitators to ensure complete incorporation of all ingredients. Fermentation time began in Stage 4 after the initial 15 min of mixing. After fermentation, the ferment was transferred from the fermentation vessel to a plastic pail, sealed with a lid, placed in a blast freezer (−32 °C) for 30 min to cool to 24 °C and then stored in a refrigerator (4 °C) until used for baking. This allowed the ferment to cool and stabilize.
Four ferment processing trials were conducted which are summarized in Table 3. In Trial 1, the impact of ferment storage time on the quality of ferment and bread was examined. In Trial 2 the effect of fermentation time on the quality of ferment and bread was studied whereas in Trial 3 the effect of fermentation temperature was investigated. A validation trial (Trial 4) was also conducted to evaluate the effects of ferment storage time on the ferment made with the optimized processing parameters. Two replications of each processing trial were performed.

2.4. Evaluation of Ferment Quality

Samples of ferment were taken at set time intervals during fermentation and ferment storage (Table 4) for measurement of total titratable acid (TTA) and viscosity.
TTA was measured according to the method of Hugo et al. [22] and expressed as the amount of 0.1-M NaOH in mL required to reach a pH of 6.3. pH was measured using a Seven2Go pH meter (Mettler Toledo, Switzerland). Ferment viscosity was measured using a Rapid Visco-Analyzer (RVA4) (Perten Instruments, Sweden) according to AACC 76-21.01 (STD1, 13 min profile) [21] with modifications as recommended by the manufacture related to sample weight, maximum temperature and viscosity measurements. Ferment (12 g) and distilled water (18 g) were placed in a test canister and then into the instrument. The pasting profile involved heating to a maximum temperature of 80 °C. Viscosity (RVU) readings of the ferment were taken at 6, 7, 8, and 9 min during the heating cycle of the pasting profile.

2.5. Bread Processing

All baking studies were performed using pilot-scale baking equipment. White pan bread was processed using a no-time dough-baking process using a commercial formulation (Table 5).
The ferment was added to the dough at three inclusion levels (30%, 50%, and 70%, expressed in baker’s percentage). Bread, not containing ferment, was processed each day to monitor day-to-day variability in the bakery and to serve as a control. All ingredients were placed in a spiral mixer (Erka, Germany), mixed on slow speed (130 rpm) for 2 min, then fast speed (230 rpm) until optimum gluten development as determined by an experienced baker. Mixing time was recorded. The optimum amount of water needed to produce a soft dough was determined at the mixer on the control. Once this was established, the amount of water required for each ferment processing trial was determined by subtracting the amount of water in the ferment from the pre-determined amount of water required for the control. The targeted dough temperature after mixing was at 26–28 °C which was achieved by adjusting the temperature of the water added to the dough. The dough was scaled (460 g pieces), rounded using a Glimek CR-310 conical rounder (Glimakra, Sweden), rested on the bench (3 min), and then shaped into a cylinder using a B&B moulder (Oliver Packaging & Equipment Co., Grand Rapids, MI, USA). The dough was then placed in baking pans (19 cm L × 10.9 cm W × 11.5 cm D), proofed (80% RH; 42 °C) to a height of 0.7 cm below the top edge of the pan and baked (200 °C, 25 min) in a Picard reel oven (Drummondville, QC, Canada). Proof time was recorded. Five loaves were baked from each dough.
Dough handling properties, including dough softness, stickiness, moulding performance, and dough stability, which gives an indication of dough machinability at different stages of the bread-making process, were assessed by an experienced baker. Dough softness was assessed by touching the dough with the fingers when it was removed from the mixer, with a soft dough being desirable for white pan bread. Dough stickiness was determined during dough scaling by assessing the degree of stickiness to the hands, with low stickiness being desirable. Dough moulding performance was assessed visually after passing the dough ball through the moulder and assessing the tightness of the dough cylinder after being formed with the pressure board of the moulder. A balance of extensibility and resistance during sheeting and forming is desirable. A tight dough cylinder tends to produce a loaf with a fine and uniform crumb. Dough stability was determined after proofing by assessing the degree of spring back after the dough was gently pressed with the index finger. Doughs with high stability should spring back after being pressed without showing a finger indentation indicating a good balance of gas retention and gas production in the dough. A total of 28 days of ferment preparation and baking were required to complete two replications of each ferment processing trial.

2.6. Evaluation of Bread Quality

After baking, the loaves were cooled for one hour. One loaf was used to determine specific volume (cm3/g) according to AACC 10-14.01 [21] using the TexVol BVM-L370 (TexVol Instruments, Viken, Sweden). The remaining loaves were placed in plastic bags. The following day, two loaves were sliced using a commercial bread slicer (Oliver Machinery, Grand Rapids, MI, USA) and assessed for crumb colour, structure and firmness. All measurements were performed in duplicate.
Crumb colour was evaluated using the Minolta Chroma Meter CR-410 with a D65 illuminant. Colour measurements (CIE L*, a*, and b*) were taken in the centre of two stacked slices of bread selected from the centre of the loaf.
Crumb structure was evaluated using C-Cell imaging (Calibre Control International Ltd., Warrington, UK) according to AACC 10-18.01 [21] using two slices of bread taken from the centre of the loaf. Cell diameter (the average cell diameter with higher values indicating coarser, more open crumb structure), number of cells per slice area (the number of cells present in a slice per total area of a slice measured in mm2 with higher values indicating a finer cell structure), cell wall thickness (the average cell wall thickness with lower values indicating thinner cell walls), and cell contract (the ratio of the average brightness of the cells to the average brightness of the cell walls with higher values indicating more shallow and uniform cells) were determined.
Crumb firmness was determined according to AACC 74-09.01 [21] using the TA.HDplus Texture Analyser (Stable Micro Systems, Godalming, UK) equipped with a 30-kg load cell. A cylindrical probe (TA-4) was used to measure the force required to compress the centre of two stacked slices of bread taken from the centre of the loaf to 40% of the original height using a constant crosshead speed of 1.7 mm/s.
Bread scoring, conducted by two experienced bakers, was performed using one loaf of bread cut in half crosswise. The breads containing ferment were scored relative to the control (without ferment) which received a score of 10 for each parameter. The following parameters were scored: crumb colour (determined visually with a higher score given to loaves with whiter and brighter crumb colour), texture (determined visually with a higher score given to loaves with good cell shape, uniformity, and cell fineness), softness (determined by compression of the crumb using four fingers with a higher score given to loaves with a softer crumb), resilience (determined by finger compression of the crumb with a higher score given to loaves that exhibited good crumb recovery), and crumb strength (determined by rubbing the surface of the crumb with the fingers with a higher score given to loaves that had good crumb strength). A consensus judgment was reached for each parameter. Scores that were reduced by 0.5 indicate a minor difference was observed in the crumb attribute when compared to the control. A reduction of 1.0 in a bread score indicated a noticeable difference. External and internal photographs of the bread were taken using one loaf from each treatment.

2.7. Statistical Analysis

One-way ANOVA was used to analyze the data using JMP software version 11 (SAS Institute Inc., Cary, NC, USA). Tukey HSD test was used to determine differences among means. The type I error rate for significance was 0.05. Flour quality data, baking absorption and bread scores were not statistically analyzed.

3. Results and Discussion

3.1. Flour Quality

Results for flour protein, moisture, falling number, starch damage and ash are provided in Table 6 along with results for farinograph and RVA pasting properties. The flour was considered to have typical farinograph and RVA pasting properties and suitable protein and ash contents, falling number and starch damage for flour used to produce high volume white pan bread.

3.2. Ferment Storage Time

3.2.1. Effect of Storage Time on Ferment Quality

The ferment was evaluated for TTA and viscosity during the fermentation cycle and during storage of the ferment. Measuring of TTA is commonly used by the baking industry to monitor the rate of dough fermentation [15]. During fermentation, TTA level remained at 22.0 mL and then decreased significantly to 17.1 mL by the end of the 150 min fermentation stage (Figure 1).
During storage, TTA increased but this was not significantly different from the TTA levels observed during the fermentation stage. This suggested that ferment can be stored up to 72 h and still maintain the same rate of fermentation. Pyler reported that mature ferment upon completion of fermentation and conditioning can be used for dough mixing right after preparation or stored for 48 h or longer and maintain its fermentative vitality at 10 °C [11]. It has also been reported that baker’s yeast requires approximately 45 min to fully adapt to fermentation in a favourable environment [23].
Changes in the TTA of the ferment suggest that fermentation, initiated by baker’s yeast, reached a maximum rate at 50 min of fermentation which was maintained until 100 min. After 100 min of fermentation, TTA decreased likely due to an accumulation of alcohol in the liquid phase of the ferment, a by-product of yeast fermentation that may inhibit yeast activity [5]. Carbon dioxide, which is also a product of fermentation, dissolves to form bicarbonate ions, which acidify the dough. This may explain why TTA increased after 24 h of storage. Another possible explanation of the increase in TTA during storage might be initiation of spontaneous fermentation and production of acids as flour has a large population of natural microorganisms [24]. The pH of the ferment ranged from 5.5 to 5.3 during fermentation and over storage (results not shown). Both TTA and pH provide an indication of acid development in the ferment. However, pH measures a concentration of hydrogen ions which are produced by dissociation of acids depending on strength of the acid, whereas TTA measures the total amount of acid in a system [15]. Less drastic changes in pH compared to TTA is likely due to absorption of hydrogen ions in the ferment by the weak basic groups of proteins and their buffering effect [25].
A comparison of the RVA pasting curves of the ferment after 150 min of fermentation with wheat flour is shown in Figure 2a,b, respectively.
Although a direct comparison between the ferment and wheat flour cannot be made due to differences in the ingredients, preparation of the slurries, and the pasting profiles used, some general observations can be made. The pasting curve of the ferment showed an increase in viscosity during the heating cycle after which the viscosity plateaued as the cooling cycle started (Figure 2a), whereas the pasting curve of the wheat flour demonstrated a characteristic peak viscosity during the heating cycle as well as an increase in final viscosity upon cooling (Figure 2b). Visually the steepness of the ferment pasting curve appeared to be lower than for the wheat flour which suggests that the gelatinization of starch in ferment was delayed. Kusunose et al. studied the role of starch granules in dough expansion during baking and concluded that starch granules should gelatinize later during baking after complete dough expansion to produce a loaf with a greater volume [26]. The overall viscosity of the ferment was noticeably higher than the wheat flour possibly due to addition of canola oil during ferment preparation which is considered a non-polar system [27]. Medcalf et al. concluded that non-polar lipid fractions of wheat flour impact pasting properties of wheat starch and result in greater maximum viscosity possibly due to prevention of hydration of the micellar regions of starch granules [28]. Acids produced during fermentation may also be responsible for a reduced gelatinization temperature of the starch in the ferment and could produce gels with softer and less elastic properties upon heating [29].
Changes in ferment viscosity during the heating/holding stage of the pasting profile are shown in Figure 3.
Viscosity of the ferment gradually increased as the holding time increased. The lowest viscosity values were observed at 6 min and ranged from 29 RVU for ferment stored for 72 h, to 43 RVU when fermented for 150 min. The highest viscosity values were observed at 9 min of the holding cycle and ranged from 193 RVU, for ferment stored for 72 h, to 262 RVU when fermented for 150 min. Lund et al. investigated the influence of time, temperature, and other conditions on starch gelatinization and reported that viscosity increased at the beginning of heating mainly due to the release of amylose from the starch granule and continued to increase in viscosity in the later stages as a result of the interaction of extra-granular starch material and swelling of the granules [30]. As shown in Figure 3, there was a reduction in the viscosity of the ferment at the end of fermentation (150 min) and over 72 h of storage at 7, 8, and 9 min of holding time; however, this reduction was not significant.

3.2.2. Effect of Ferment Storage Time on Bread Processing

Bread was processed using three inclusion levels of ferment taken immediately after fermentation and cooled to 24 °C (0 h storage) and after being stored for 24 h, 48 h, and 72 h. Addition of ferment to the dough reduced mixing time but this was not found to be significantly different from the mixing time of the control with the exception of the dough prepared with ferment stored for 48 h at an inclusion level of 50% and for doughs prepared with ferment stored for 72 h for all three inclusion levels (Table 7).
Within a ferment storage trial, mixing time tended to decrease as ferment inclusion level increased. There was a significant reduction in the mixing time for the ferment stored at 48 h, added at 50% and 70% inclusion and for the ferment stored at 72 h, added at all three levels of inclusion compared to the control. These findings are in agreement with Thompson, who reported that use of flour-containing ferments resulted in reduced mixing times [31], therefore improving production efficiency in a bakery. When fresh ferment was used (0 h stored), proof times decreased as ferment inclusion level increased indicating higher rate of fermentation in the dough. The same observation was reported by Kulp, when the final dough was prepared using flour-containing ferments, indicating reduced proof times as the level of flour increased in the ferment [32]. In this study, ferments that were stored showed the opposite trend with longer proof times tending to increase as ferment inclusion level increased. The longest proof time was observed for the dough prepared with ferment stored for 72 h added at a level of inclusion of 70%. This is likely due to poor dough handling properties which exhibited excessive softness and stickiness after mixing and high extensibility and medium stability after proofing. When compared to the control, the changes in proof times among the ferment storage intervals and inclusion levels were not statistically significant. Overall, based on visual observations, doughs mixed with ferment were softer, stickier, and more extensible compared to the control at the equivalent amount of water in all final doughs. In the current study, the impact on dough handling properties was affected by the level of ferment inclusion, with the most noticeable changes observed when 70% ferment was added. Stability of the dough after proofing was not affected for most of ferment treatments. Pyler suggested that organic acids produced in the ferment caused the dough to be stickier; however, the increase in dough stickiness did not negatively affect bread quality as improved loaf volume and crumb structure were observed [11]. Kulp concluded that ferments, prepared with flour, resulted in softer final doughs due to a loss of some absorptive capacity by the flour [32]. When fresh ferment (0 h stored) was used for dough preparation in our study, even at 30% inclusion, the dough was noticeably softer and stickier, however at 70% inclusion the dough became excessively soft and sticky. The control dough (no ferment) exhibited optimal softness and minimal stickiness. Regardless of the level of inclusion, addition of fresh ferment (0 h stored) resulted in a dough with better balanced dough properties and improved extensibility during the moulding stage compared to the control dough which exhibited resistant properties. Moderate dough stability was observed after proofing when fresh ferment (0 h stored) was included at 50% and 70% inclusion rates compared to the control. The dough prepared with 30% fresh ferment (0 h stored) demonstrated high stability after proofing. Ferment stored for 24 h and used at 30% and 50% inclusion levels resulted in a dough that had slightly softer properties and minor stickiness compared to the control. However, when used at a 70% inclusion level, the dough was softer and had increased stickiness compared to the control. Doughs were more balanced and had increased extensibility when the ferment was used at 50% and 70% levels of inclusion. Moulding performance was good for the doughs containing 30% and 50% ferment inclusion, while the dough containing 70% ferment showed average moulding. After proofing, regardless of the level of inclusion, all doughs exhibited high dough stability. Storage of the ferment for 48 h and 72 h had an impact on dough softness and stickiness in the same manner as the fresh ferment. Ferment, stored for 48 h and used at 30% and 50% levels of inclusion, enhanced the balance between extensibility and resistance of the dough and resulted in dough that had medium to high stability after proofing. However, when used at a 70% level of inclusion, the dough exhibited greater extensibility which was undesirable and medium stability after proofing. Ferment, when stored for 72 h, resulted in a dough with excessive extensibility and medium stability after proofing when used at 50% and 70% levels of inclusion. Based on these observations, it was determined that ferment stored for 24 h, to a maximum of 48 h, should be used for bread making at inclusion levels not exceeding 50% to produce dough with optimal properties.

3.2.3. Effect of Ferment Storage Time on Bread Quality

Quality parameters of the breads processed without ferment (control) and with ferment stored for varying periods of time at three levels of inclusion, are provided in Table 7 and Table 8. Images of bread and bread slices are provided in Figure 4 and Figure 5.
Addition of ferment to the dough did not significantly affect specific volume of the breads regardless of the level of inclusion and storage period compared to the control. Kulp reported slightly improved specific loaf volumes for breads made with flour ferments in comparison to the control which was processed using a sponge- and dough-baking process [32]. In the current study, breads processed with ferment had significantly lower crumb firmness compared to the control regardless of the ferment storage period and level of inclusion (Table 7). Lorenz et al. also observed that the addition of ferment made from flour, water, and baker’s yeast favourably affected final proofing, bread volume, and crumb softness [33].
Breads processed with fresh ferment (0 h stored) had decreased crumb brightness (L*) compared to the control when 30% and 50% inclusion levels were used. The same trend was observed for the ferment stored for 48 h for all inclusion levels and for the ferment stored for 72 h added at 50% and 70% inclusion levels. Ferment stored for 24 h did not significantly reduce crumb brightness (L*) when used at all three levels of inclusion. Breads processed with ferments that were stored for 48 h and 72 h, had slightly reduced crumb redness (a*) for all levels of inclusion; however, these differences were not significant. Although the addition of ferment tended to increase the b* values of the bread, the only significant difference was found between the ferment stored for 72 h and used at an inclusion level of 70% and the control. Bread produced with ferment stored for 24 h had comparable crumb colour to the control. Komlenić et al. concluded that bread prepared with a Lactobacillus brevis preferment had significantly different crumb colour compared to the control which was made without addition of the preferment. It was reported that crumb lightness (L*) decreased and a* and b* values increased [34].
Crumb structure of the breads processed with ferment tended to be less fine with slightly larger cells compared to the control as indicated by slightly lower values for the number of cells per slice area and slightly greater values for cell diameter (Table 8). However, these differences were not significant with the exception of bread processed with ferment stored for 72 h and added at a 70% inclusion level.
Bread scores for the control and breads made with ferment are provided in Table 8 and used as supplementary data. Breads made with ferment had a slight decrease in crumb colour scores (whiteness/brightness), compared to the control. The lowest crumb texture scores were observed for the breads made with fresh ferment (0 h stored) and ferment stored for 24 h at an inclusion level of 50%. The same trend was observed for breads prepared with fresh ferment (0 h stored) and ferment stored for 48 h and 72 h and used at an inclusion level of 70%. All breads containing ferment scored equal to, or higher than the control, for crumb softness, regardless of storage time and inclusion level. The highest scores for crumb softness were for breads containing ferment at an inclusion level of 70% that was fresh (0 h stored) and stored for 48 h and 72 h. A slight decrease in crumb resilience was observed for breads made with fresh ferment (0 h stored) and added at an inclusion level of 70% and for breads made with ferment stored for 48 h and added at 50% and 70% inclusion levels. The breads containing ferment scored slightly lower than, or equal to the control, for crumb resilience. Crumb strength scores slightly decreased for breads made with ferment that was stored for 48 h and 72 h regardless of the ferment inclusion level. The other breads containing ferment scored equal to, or higher than the control, for crumb strength. Kulp reported that breads produced with flour ferments had total bread scores which were comparable to the control bread, processed using a sponge- and dough-baking process [32]. The scores were comparable for external characteristics (volume, loaf symmetry, crust colour, break and shred) and internal characteristics (crumb grain, texture, aroma, mouthfeel) with the exception for flavour which was less enhanced [32]. Overall, the scoring results of this study showed that the most noticeable improvement in the ferment containing breads was seen in crumb softness. Bread processed with fresh ferment (0 h stored) at a 70% inclusion level and breads processed with ferments stored for 48 h and 72 h, at inclusion levels of 50% and 70%, exhibited a decrease in bread crumb characteristics. This trend was observed for crumb colour, crumb strength and texture.

3.3. Fermentation Time

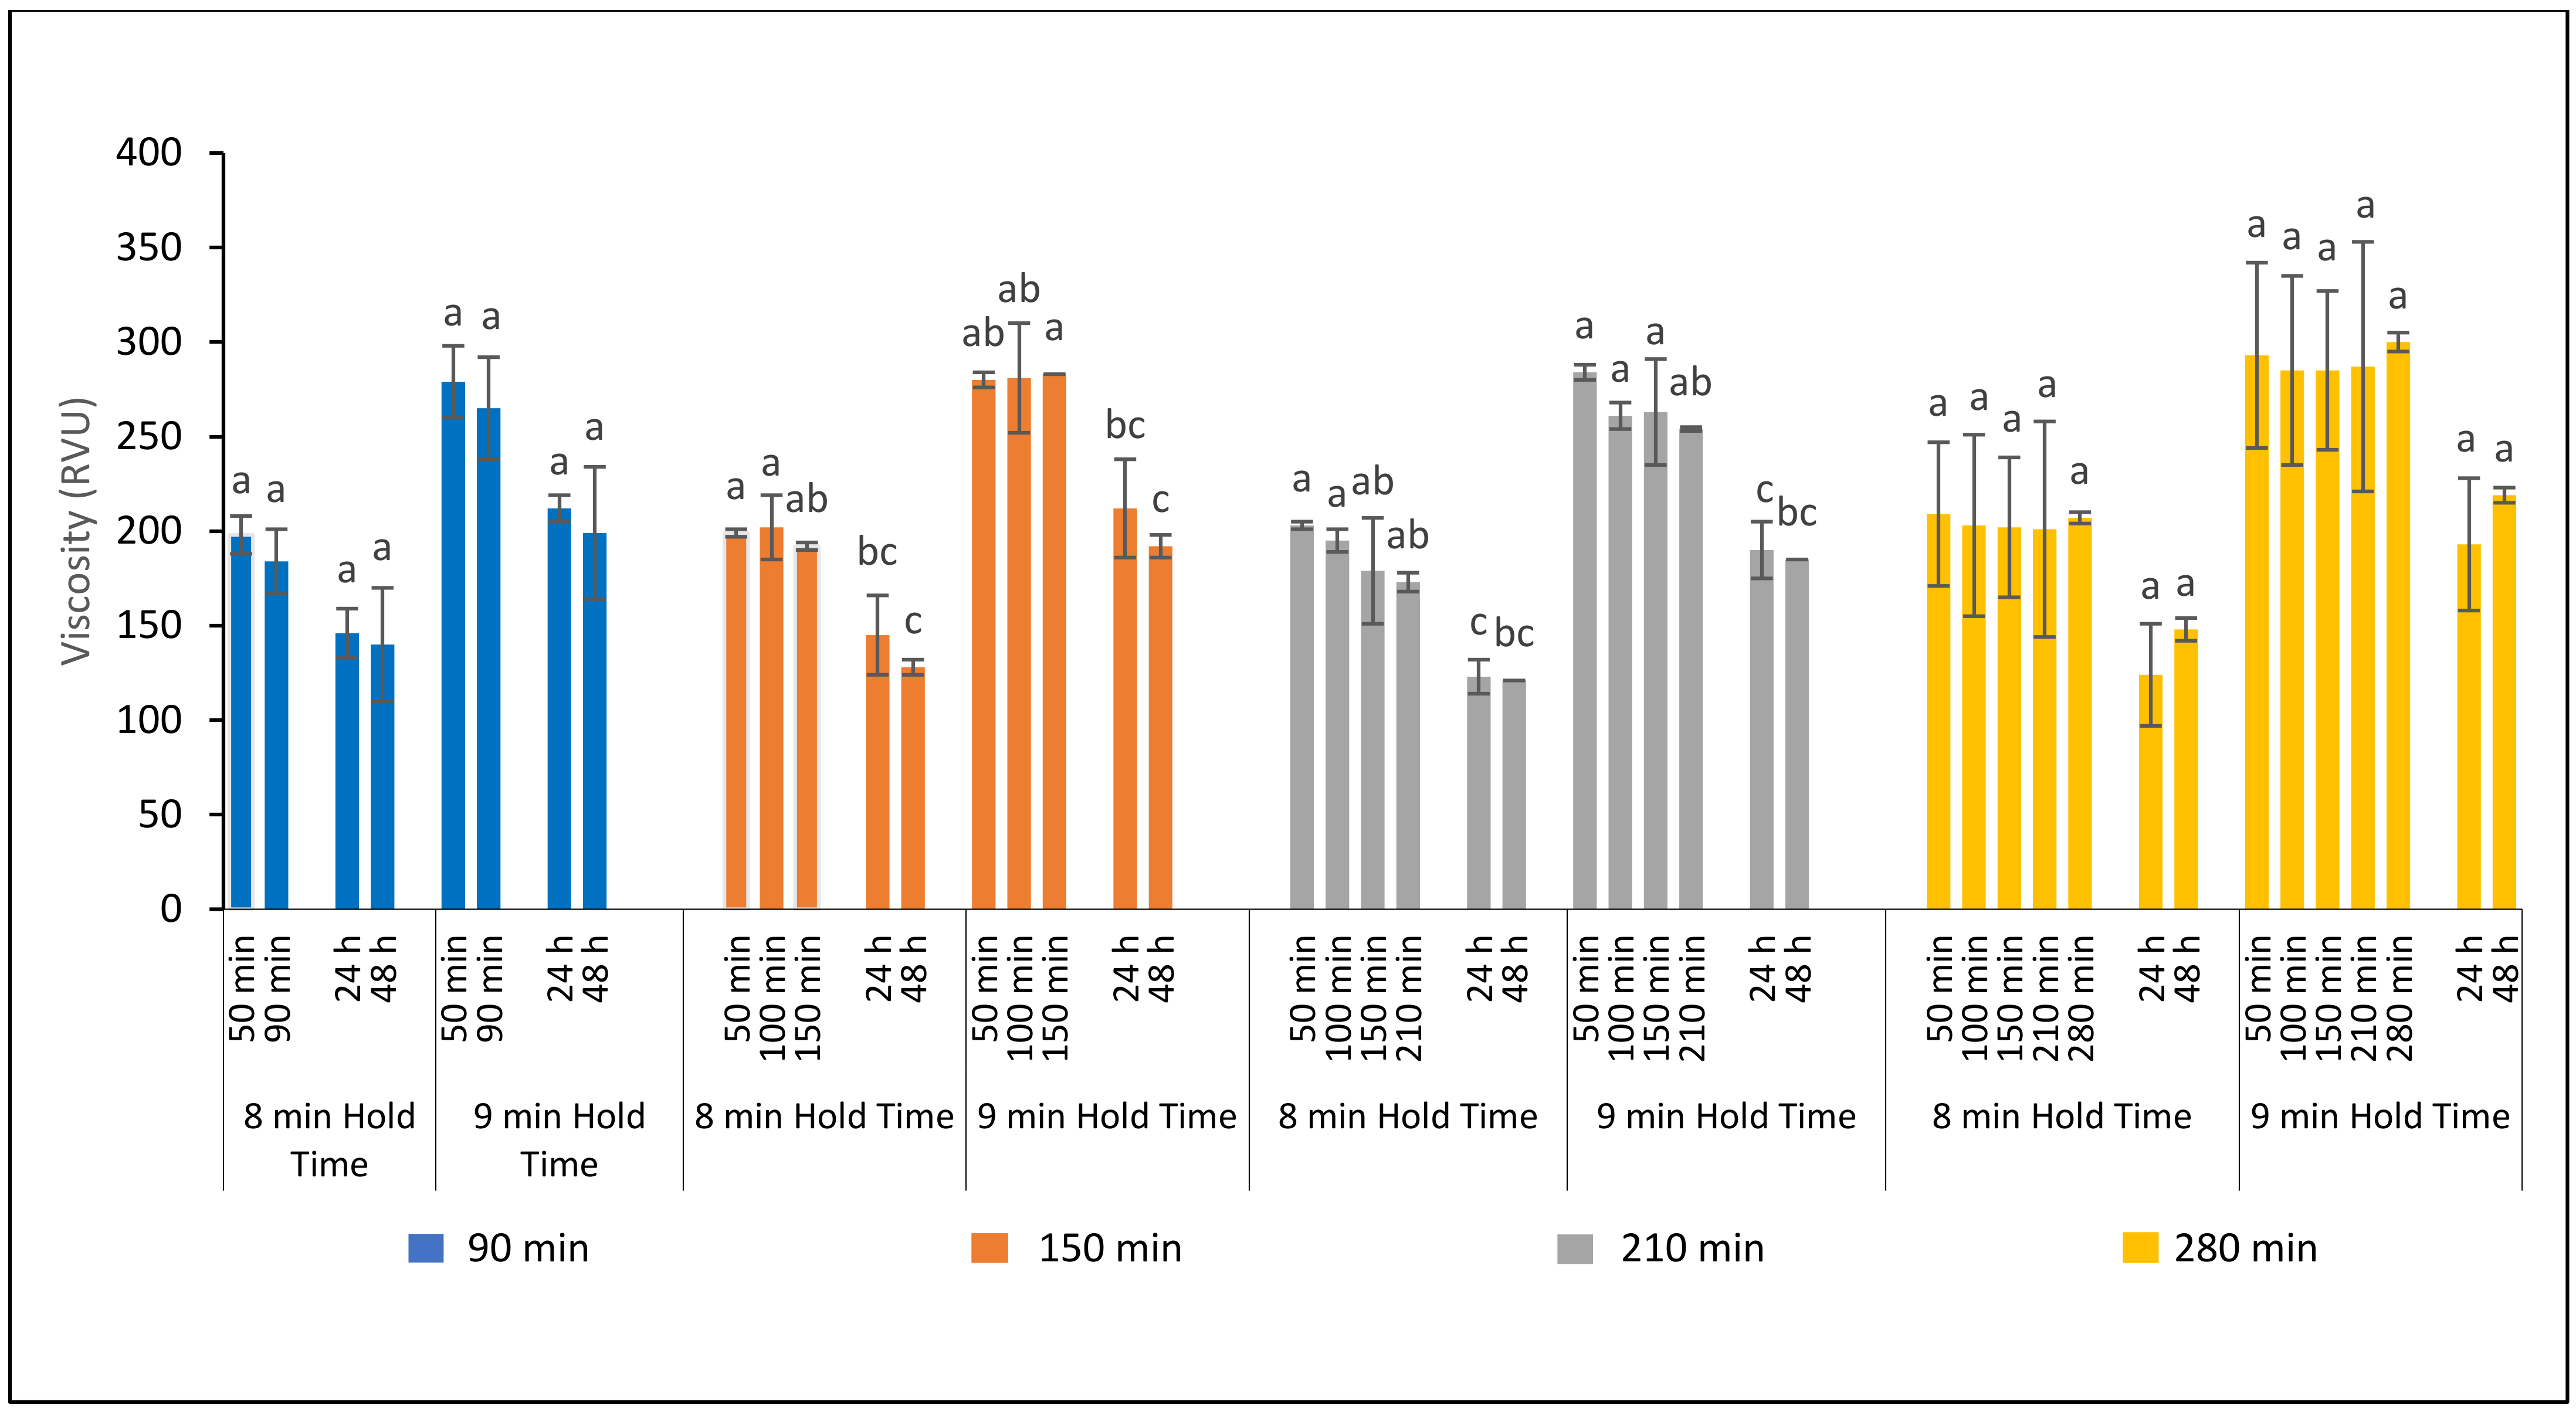
3.3.1. Effect of Fermentation Time on Ferment Quality

The effect of fermentation time on TTA levels during the fermentation cycle and after storage at 24 and 48 h is shown in Figure 6. Regardless of the fermentation time, all ferments had the highest TTA levels within 90 or 100 min of fermentation and then showed a steady decline after 100 min of fermentation.
Overall, longer fermentation times (210 and 280 min) resulted in lower TTA levels by the end of the fermentation cycle. This is likely due to the accumulation of alcohol in the liquid phase of the ferment which may inhibit yeast activity [5]. The TTA level of the ferment that was fermented for 90 min did not change significantly between 50 min and 90 min or after 24 or 48 h of storage. This may indicate that fermentation was halted at the peak of baker’s yeast activity. For the ferment that was fermented for 210 min there was a significant reduction in TTA levels at 134 min of fermentation which continued to decrease as fermentation time increased reaching a TTA value of 14.3 mL by the end of the fermentation stage. Doerry et al. observed that ferments containing 40% and 50% flour reached their highest TTA level after 135 min of fermentation and then decreased for the reminder of the fermentation period [17]. The ferment that was fermented for 280 min was monitored for TTA with shorter time intervals between 210 and 280 min to try and identify the time when the ferment had reached a constant level of acid accumulation and could be considered as a mature ferment indicating a completion of fermentation. Changes in TTA for the ferment that was fermented for 280 min followed the same trend as the ferments fermented for a shorter period of time. After 100 min of fermentation, there was a steady decline in TTA levels with the lowest TTA level of 13.6 mL found for the sample of ferment tested at 240 min. The reduction in TTA levels was likely due to the generation of alcohol and its inhibiting impact on yeast activity [5]. Between 225 and 280 min of fermentation, TTA levels did not change significantly indicating that the acid development was constant during this time. Based on the TTA results a fermentation time of 240 min was determined as the optimal fermentation time as the TTA levels remained constant. During storage, all ferments that were fermented for the four fermentation times demonstrated a sharp increase in TTA when stored for 24 h, which might be due to formation of carbonic acid from carbon dioxide and water and initiation of spontaneous fermentation by natural microorganisms that are present on flour and yeast [24]. The TTA level appeared to remain constant since the TTA levels after 48 h of storage were not significantly different from those observed at the maximum acid accumulation during 90 and 100 min of fermentation and at 24 h of storage indicating that the ferment retained its fermentation rate during storage. The pH of the ferments ranged from 5.5 to 5.3 during preparation and storage regardless of the fermentation time (results not shown).
Changes in the viscosity of the ferment that was fermented for different fermentation times and measured at 8 and 9 min holding time of the pasting profile are shown in Figure 7.
Regardless of the length of fermentation, there were no differences in viscosity observed among the ferments measured at 8 and 9 min of holding time indicating that fermentation time did not significantly impact viscosity. At 8 min holding time, the viscosity of the ferment ranged from 173 RVU for the ferment at the end of the 210 min fermentation cycle to 209 RVU at 50 min of fermentation for the ferment fermented using the 280 min fermentation cycle. At 9 min holding time, the viscosity of the ferment viscosity ranged from 254 RVU for the ferment at the end of the 210 min fermentation cycle to 300 RVU for ferment at the end of the 280 min fermentation cycle. As the ferments were prepared with a sufficient amount of water under constant agitation and heating above room temperature but below starch gelatinization temperature (Table 1), the starch in the ferment may have only been partially hydrated and swollen by the end of ferment period [30,35,36]. The wheat starch in the ferment exhibited the same degree of changes in viscosity under constant heating at 80 °C during RVA testing regardless of the fermentation time used. When stored for 24 h, all ferments exhibited a reduction in viscosity at 8 and 9 min holding time which remained constant during storage, regardless of the fermentation time used to prepare the ferment. However, this reduction in viscosity was not significant for the ferments prepared using 90 min and 280 min fermentation time. Ferment prepared using 150 min demonstrated a significant reduction in viscosity at 8 min holding time between the end of fermentation stage and at 48 h of storage with a drop in the viscosity values from 192 RVU to 128 RVU. At 9 min holding time, the ferment prepared using 150 min had a significant reduction in viscosity when stored for 24 h. Ferment prepared using 210 min followed the same trend as the ferment prepared using 150 min. At 8 min holding time, there was a significant reduction in viscosity observed between 100 min of fermentation time and during 24 h of storage with a drop in the viscosity values from 195 RVU to 123 RVU. At 9 min holding time, there was a significant reduction in viscosity between the end of fermentation stage and at 24 h of storage with a drop in the viscosity values from 245 RVU to 190 RVU. The reduction in viscosity could be due to a loss in the integrity of the starch granules [30] which may be a result of storing the ferment without agitation. Mohamed et al. studied the effect of mixing of wheat starch and extracted wheat gluten on the thermal properties of starch [37]. It was concluded that without mixing, water can migrate between starch and protein and be absorbed by protein leaving less water available for starch thereby affecting gelatinization. A reduction in the viscosity of the ferment during storage would be desirable as it would improve the mobility and ease of pumping of the ferment when used for bread making. The viscosity of the ferment at 6 and 7 min of holding time did not change significantly and followed the same trends as observed at 8 min holding time regardless of fermentation time and storage time (results not shown).

3.3.2. Effect of Fermentation Time on Bread Processing

Ferments prepared using four different fermentation times and stored for 24 h, were used for processing bread at three inclusion levels of ferment. Addition of ferments to the dough significantly reduced mixing times when compared to the control (Table 9).
Mixing times progressively decreased as ferment inclusion levels increased. Doughs made with ferment at an inclusion level of 70% had the shortest mixing times compared to the control regardless of the fermentation time used. Proof times were not significantly affected by fermentation time and level of ferment inclusion when compared to the control.
Based on visual observations, ferment prepared over 90 min resulted in softer dough compared to the control. As the level of ferment inclusion to the dough increased, so did dough softness. Using 30% and 50% inclusion levels of the ferment resulted in doughs with slightly stickier properties compared to the control. Ferment that was fermented over 90 min and used at an inclusion level of 70% resulted in the dough which was noticeably sticky. In contrast, the dough made from ferment that was fermented for 90 min and used at an inclusion rate of 50% resulted in dough with improved dough extensibility and more balanced dough properties. Lower ferment inclusion levels of this same ferment did not show this trend and higher ferment inclusion levels resulted in reduced dough resistance and excessive extensibility, both of which are undesirable. At 30% and 50% inclusion levels, the ferment produced doughs that formed a tight cylinder and exhibited a good moulding performance while at 70% inclusion, moulding was less tight and the dough showed only average moulding performance. Moderate dough stability was observed for the dough containing 70% ferment after proofing, while all other doughs including the control had high dough stability. Dough mixed using the ferment that was fermented for 150 min resulted in a slightly softer dough with minor stickiness when used at inclusion levels of 30% and 50% compared to the control, while dough prepared using a 70% inclusion level was noticeably softer and stickier. Regardless of the level of ferment inclusion, all doughs exhibited more extensible and balanced properties during the moulding stage and were considered to have good moulding performance. Similar to the control, all doughs made from ferment than had been fermented for 150 min demonstrated strong dough properties after proofing regardless of the ferment inclusion level used. Doughs made with ferments prepared using 210 and 280 min fermentation times had dough handling properties similar to doughs made with ferment prepared using 150 min fermentation time. However, for the ferment prepared using 210 min fermentation time, balanced dough handling properties were only observed at 50% and 70% levels of inclusion. Ferment prepared using 280 min fermentation time resulted in doughs that exhibited excessive softness and extensibility when a 70% inclusion level was used. Overall, all doughs exhibited good moulding performance and strong properties after proofing. These observations suggest that fermentation times between 150 min and 280 min and inclusion levels not exceeding 50% can improve dough extensibility. Observations on dough handling properties in this study are in agreement with other researchers. Using large deformation rheological measurements with a TA.HDi 500 Texture Analyzer, Balestra et al. reported increased softness of the gluten in the dough prepared with ferment that was made from flour, water and baker’s yeast and fermented for 24 h at 18 °C [38]. Angioloni et al. found that increased acidification alters the gluten network by changing the overall net charge from neutral to positive and thus enhancing protein solubility and facilitating repulsion forces which prevent formation of disulfide bonds and enhancing access of proteolytic enzymes and thus changing dough viscoelastic behaviour [39]. According to Cauvain, addition of ferment results in a more extensible gluten network after dough mixing and fermentation [40]. Other advantages derived from using liquid ferments containing 30% to 50% of the total flour in the baking formulation are reported to be increased hydration, stronger and more uniform doughs, reduced mixing, and improved machineability [13].

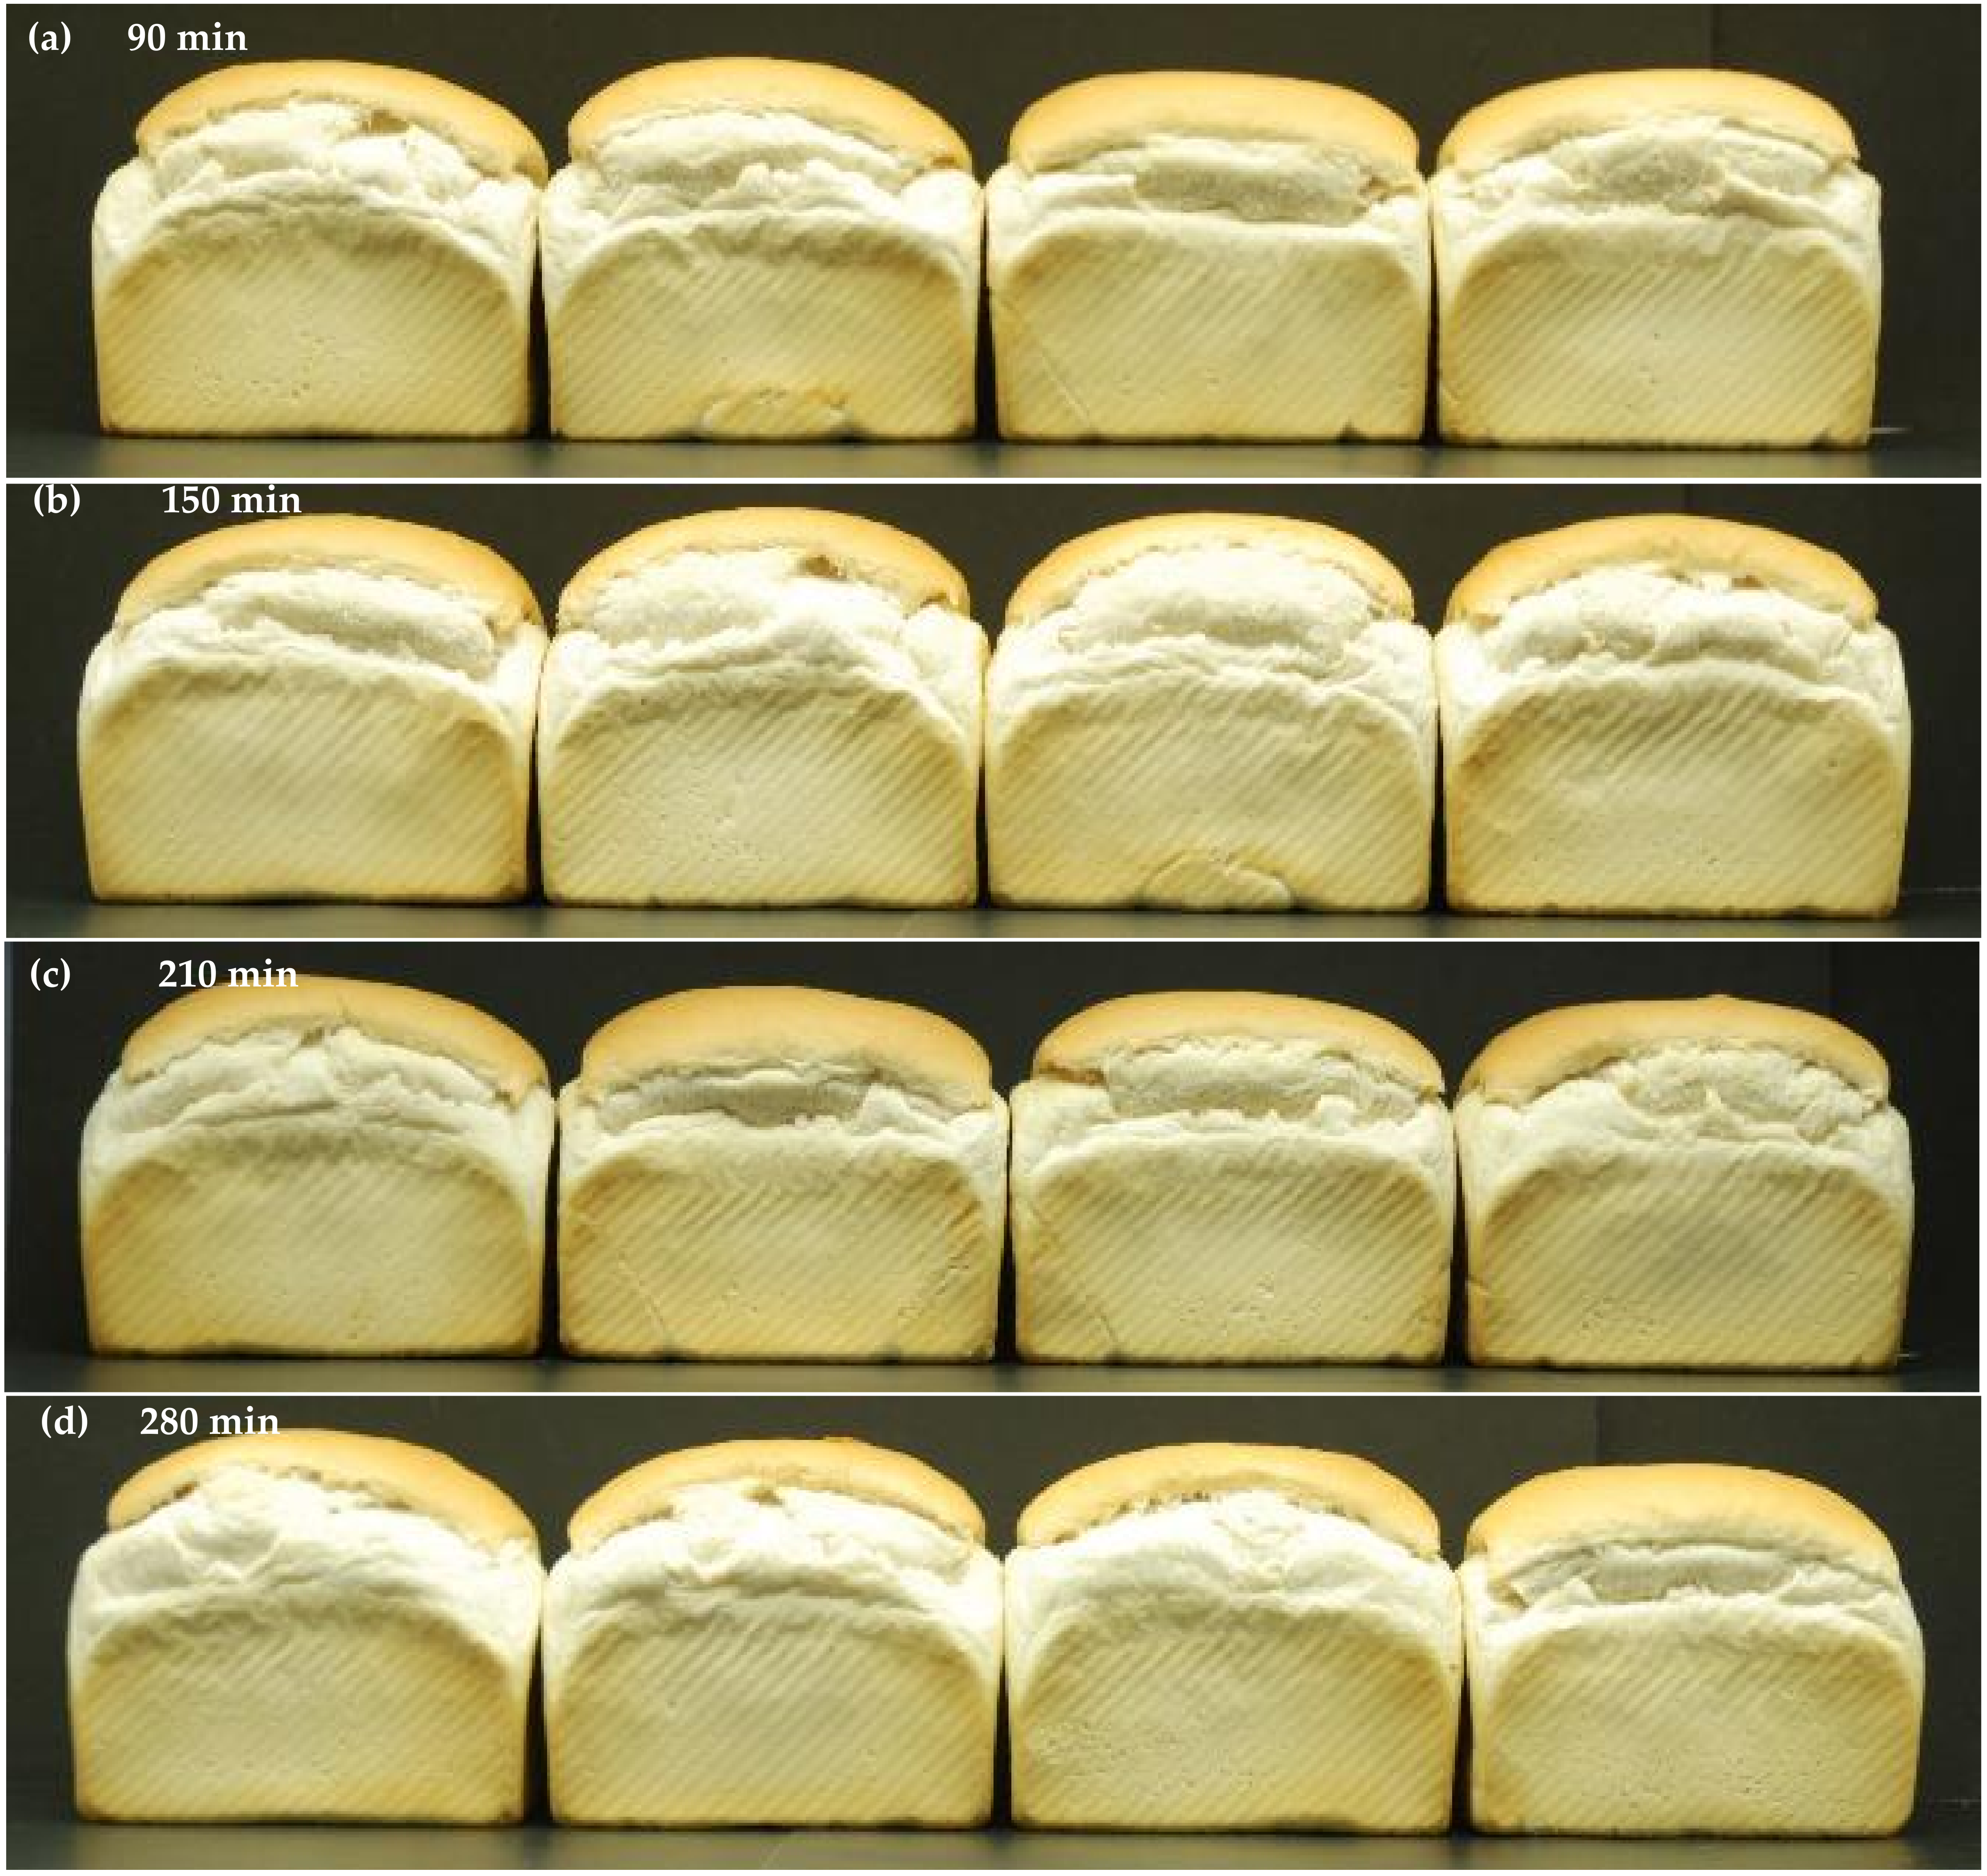
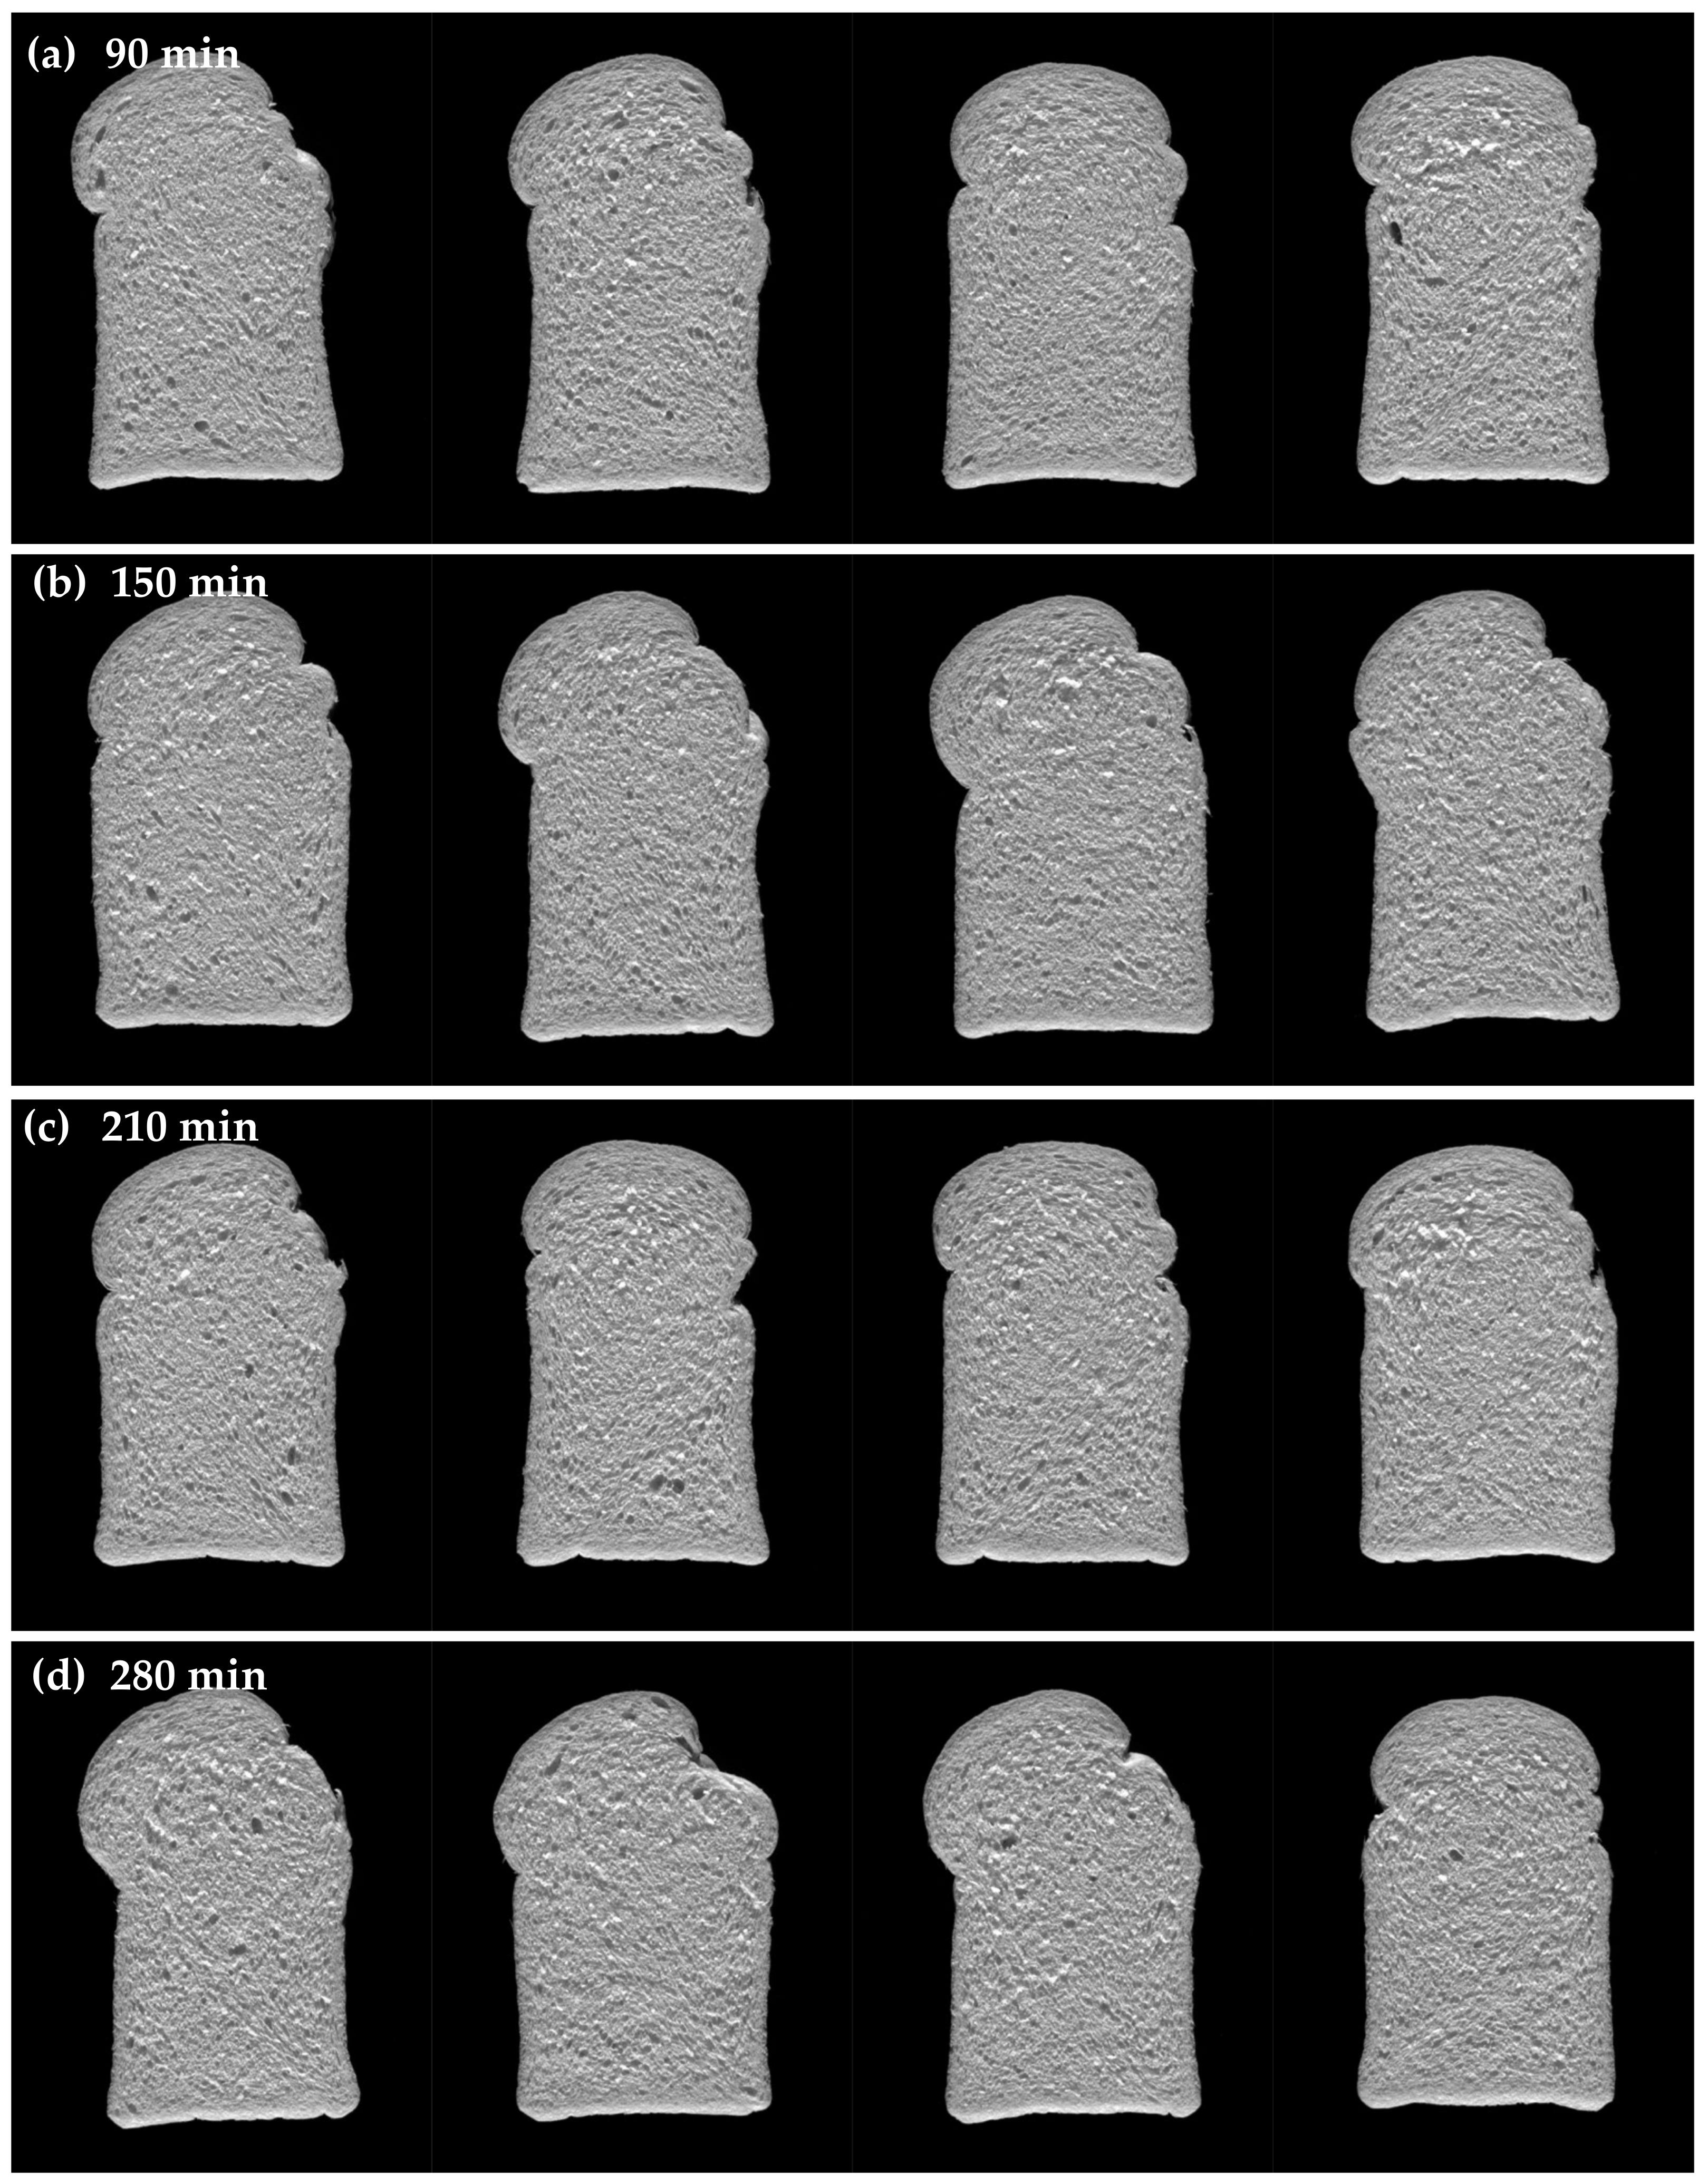
3.3.3. Effect of Fermentation Time on Bread Quality

Quality parameters of the breads processed without ferment (control) and with ferment prepared using four different fermentation times and added at varying inclusion levels are provided in Table 9 and Table 10. Images of the bread and bread slices are provided in Figure 8 and Figure 9.
Addition of ferment to the dough did not significantly impact specific volume of the breads regardless of fermentation time used to prepare the ferment nor the level of ferment inclusion used to prepare the bread compared to the control bread. Crumb firmness was reduced when ferment was used to prepare the bread compared to the control indicating that the bread containing ferment had softer crumb. However, this improvement was only significant for the breads processed with ferment that was fermented for 90 min and used at 50% and 70% levels of inclusion and ferment fermented for 150 min and added at a 30% inclusion level. Similar trends were found for ferment that was prepared using the 280 min fermentation time and used at 30% and 50% inclusion levels. Breads processed with ferment had slightly lower crumb brightness (L*) but this was not significant with the exception of the ferment that had been fermented for 90 min and used at an inclusion level of 70% which had a significantly lower L* value compared to the control. Crumb redness (a*) was not significantly affected by fermentation time of the ferment nor the level of ferment inclusion used in the bread. The highest a* value was observed for the breads processed with the ferment, that was prepared using a fermentation time of 210 min and added at 30% and 50% inclusion levels but this difference was not significant. Ferment prepared using a 280 min fermentation time produced bread that had the lowest a* (redness) value but this was not significant. Yellowness (b*) increased slightly in the breads processed with ferment but this was not significant compared to the control. Using a fermentation time of 150 min to produce the ferment resulted in bread that had the lowest crumb yellowness (b*) compared to the control when a 30% and 50% level of inclusion was used. Longer fermentation times of 210 min and 280 min resulted in increased crumb yellowness at all three inclusion levels. Overall, ferment prepared using a 150 min fermentation time produced bread with a crumb colour that was most comparable to the control regardless of the level of inclusion.
Breads processed with ferment resulted in a crumb structure with significantly larger cell diameter which was coarser compared to the control (Table 10). Only the breads made with the ferments prepared using the 150 min fermentation time added at a 30% of inclusion level and using the 90 min fermentation time added at a 50% of inclusion level did not follow this trend and instead had a crumb structure that was comparable to the control. Breads made with ferment had significantly thicker cell walls than the control bread with the exception of the breads made with the ferment that was prepared using the 150 min fermentation time added at a 30% inclusion level and using 90 min and 150 min fermentation times added at a 50% level of inclusion. Cell contrast was not significantly impacted by the addition of ferment regardless of fermentation time used to prepare the ferment.
Bread scores for the control and breads made with ferment are provided in Table 10 and used as supplementary data. Differences were observed in the scores for breads containing ferment compared to the control. Crumb colour scores for the breads processed with ferment were slightly higher, or comparable to the control. However, when ferment was prepared using a fermentation time of 280 min and added at an inclusion level of 70%, the bread had a lower score for crumb colour indicating a slight reduction in crumb whiteness and brightness. Crumb texture scores for the breads processed with ferment tended to be slightly higher than, or comparable to the control with a few exceptions. Bread processed with ferment, prepared using a fermentation time of 210 min and added at an inclusion level of 50%, had a slightly lower score for crumb texture. The same trend was seen for bread made with ferment, that was fermented using a fermentation time of 280 min and added at an inclusion level of 70%. Crumb softness scores increased as ferment inclusion levels increased for breads made with ferments that were prepared using fermentation times of 90 min and 280 min. Breads processed with ferments that were fermented for 150 min and 210 min had crumb softness scores that were equal to, or slightly higher, than the control. Crumb resilience scores were comparable to the control with the exception of breads made with ferment added at an inclusion level of 70% where a significant decrease in crumb resilience was observed regardless of fermentation time. All the breads containing ferment scored comparable to the control for crumb strength with the exception of the bread made with ferment prepared using a fermentation time of 150 min and added at an inclusion level of 50% which scored higher for crumb strength. Crumb resilience appeared to be negatively affected when the ferment was added at an inclusion level of 70% regardless of the fermentation time used. Crumb softness was improved for breads processed with ferment that were fermented for 90 min and 280 min and added at inclusion levels of 50% and 70%. Doerry et al. investigated the impact of fermentation time (2 h and 3 h) used to prepare liquid preferment on bread quality and concluded that longer fermentation times resulted in slight increases in scores for volume, crumb grain and texture, aroma, taste, and mouthfeel, but not crumb colour [17].

3.4. Fermentation Temperature

3.4.1. Effect of Fermentation Temperature on Ferment Quality

The effect of fermentation temperature on TTA levels during the fermentation cycle and after storage of the ferment for 24 and 48 h is shown in Figure 10. Ferments prepared using 30, 35, and 40 °C exhibited similar trends in production of acids during fermentation with the highest TTA levels observed at 100 min of fermentation with the values of 22.9 mL, 20.5 mL, and 21.6 mL, respectively. All ferments showed an increase in TTA after storage at 24 h and 48 h regardless of fermentation temperature.
This trend was consistent with the results for the other ferment treatments (ferment storage and fermentation time) that were investigated (Figure 1 and Figure 6). Ferment prepared using a temperature of 30 °C showed a significant reduction in TTA level between 100 min and 184 min of fermentation from 22.9 mL to 15.5 mL, respectively, which continued to decrease until the end of the 240 min fermentation cycle reaching a value of 13.6 mL. However, these results were not found to be statistically significant. Ferment prepared using a fermentation temperature of 35 °C followed the same trend, however, a significant reduction in TTA was observed between 100 min and 220 min of fermentation from 20.5 mL to 13.3 mL, respectively. Ferment prepared at 40 °C also followed the same trend, with the lowest TTA level (15.5 mL) observed at the end of the fermentation cycle although this was not significantly different from the TTA levels observed during preparation of the ferment and during ferment storage. Ferment prepared using a temperature of 45 °C demonstrated the highest accumulation of acids without any reduction in the TTA levels reaching a value of 24.7 mL by the end of fermentation cycle without any significant differences in the TTA levels over the fermentation period and storage of the ferment. Maloney et al. reported that higher temperatures generally initiate a higher rate of fermentation for commercial yeast with the optimal fermentation temperature approximately 38 °C [4]. Regardless of the fermentation temperature, all ferments exhibited the same level of acid development at 150 min of fermentation as seen in Figure 10. Based on our results, 35 °C was determined to be the optimal fermentation temperature as the ferment produced exhibited gradual changes of TTA level during fermentation compared to the other fermentation temperatures examined indicating a more controlled fermentation rate. Pyler recommended a temperature range between 35–43 °C to produce a satisfactory ferment in six hours when yeast food, malt, sugar, nonfat dry milk, and salt were used in the formulation [11]. Pyler also concluded that when temperatures lower than 32 °C are used, fermentation time must be extended and when temperatures greater than 49 °C are used, the resulting ferment has unacceptable quality [11]. The pH of the ferments prepared at 30, 35, and 40 °C ranged from 5.5 to 5.3 during fermentation and during storage regardless of the temperature used to prepare the ferment (results not shown).
RVA pasting curves of the ferment prepared using different fermentation times are not shown as they followed the same trend as discussed previously (Figure 2). The curve of the ferments exhibited a gradual increase in viscosity during the heating cycle and then reached a plateau indicating that the ferment withstood heating during the holding cycle under mechanical shear stress of mixing without a reduction in viscosity and thus showed more stable properties [41]. Changes in the viscosity of the ferment prepared using different fermentation temperatures and measured at 8 and 9 min holding time of the pasting profile are shown in Figure 11.
Fermentation temperature did not have a significant impact on viscosity of the ferment during preparation and storage. Ferment prepared using 45 °C had lower viscosity during fermentation and ferment storage compared to the other fermentation temperatures prepared using lower temperatures although the results were not statistically significant. This may be due to the highest TTA levels observed in the ferment indicating greater acidification and higher rate of fermentation (Figure 10). Clarke et al. studied the effect of acidification on the rheological properties of ferments and doughs containing ferments and detected a decrease in both elasticity and viscosity [42]. Using laser-scanning microscopy, they observed that the gluten strands were dissolved to a more amorphous structure during fermentation indicating increased solubility of the gluten. This could possibly lead to a reduced amount of water available for starch hydration and thus decreased viscosity of the ferment. Another possible explanation for the reduced viscosity of the ferment prepared using a fermentation temperature of 45 °C could be due to degradation of the starch molecules by acetic and lactic acids [29].

3.4.2. Effect of Fermentation Temperature on Bread Processing

The quality of bread processed with ferment prepared at four different fermentation temperatures and stored for 24 h was assessed at three different inclusion levels. The results are summarized in Table 11 and Table 12.
Doughs made with ferment had significantly lower mixing times compared to the control regardless of fermentation temperature or inclusion level with the exception of ferment prepared at 30 °C at a 30% inclusion level. Higher ferment inclusion levels generally resulted in decreased mixing times, regardless of fermentation temperature. Ferment prepared using a fermentation temperature of 45 °C, resulted in the largest reduction in mixing time of the doughs compared to the other ferment treatments however the difference was not significant. This may be a result of the higher TTA levels in the ferment prepared at 45 °C (Figure 10) which may have caused changes in dough structure, mainly in protein, and reduced mixing time and weakened the dough [43]. Proof times were not significantly impacted by ferment inclusion levels regardless of fermentation temperature when compared to the control (Table 11). The only exception was observed for the dough made with the ferment prepared at 45 °C which had a significantly longer proof time when added at an inclusion level of 70%. This may be due to a decreased dough fermentation rate resulting from partial inhibition of the yeast enzymes which might have occurred during the fermentation since the fermentation temperature exceeded 41 °C [5].
Ferment prepared at 30 °C did not impact dough handling properties when used at an inclusion level of 30% as the dough was comparable to the control. At higher inclusion levels, the doughs containing ferment exhibited some softness and stickiness. The doughs became more balanced, demonstrating good extensibility when inclusions levels of 50% and 70% were used. Regardless of the level of inclusion, all doughs had good moulding performance and formed a tight cylinder and showed high stability after proofing.
Dough made with ferment prepared at 35 °C had improved dough extensibility when a 30% inclusion level was used. Dough extensibility further improved as inclusion level increased. Dough made with ferment prepared at 35 °C at an inclusion level of 70% exhibited the softest and the most extensible dough properties, which were considered acceptable even though they had higher stickiness compared to the control and other ferment treatments. Moulding performance was good for all doughs containing the ferment, prepared at 35 °C for all inclusion levels. After proofing, all doughs made with the ferment prepared at 35 °C demonstrated good strength with the exception of the dough prepared with using a 70% inclusion level which showed slightly lower strength. When ferment was prepared at 40 °C, the dough exhibited softer and more extensible dough properties at a 30% inclusion level compared to the control. At the highest level of inclusion (70%), the impact was more noticeable, and the dough exhibited high stickiness and excessive softness and extensibility. Only the dough containing a 30% ferment showed good moulding performance. Ferment prepared at 40 °C and added at the higher levels of inclusion resulted in dough that had average moulding performance as it did not coil tightly during the moulding stage. However, regardless of the level of ferment inclusion, the dough showed good strength after proofing. Ferments prepared at 45 °C had a greater impact on dough handling properties compared to the other ferment temperatures. Only the dough containing a 30% ferment inclusion level demonstrated good dough properties with good strength after proofing but softer properties when compared to the control. At a ferment inclusion level of 50%, the dough exhibited excessive softness and stickiness and lacked balance by being overly extensible. At an inclusion level of 70%, the dough was extremely soft and sticky and had poor handling properties. Ferment added at 50% and 70% inclusion levels exhibited average dough moulding performance and medium stability after proofing. Overall, a fermentation temperature of 35 °C resulted in the most noticeable improvements to the dough handling properties without exhibiting stickiness at ferment inclusion levels of 30% and 50%.

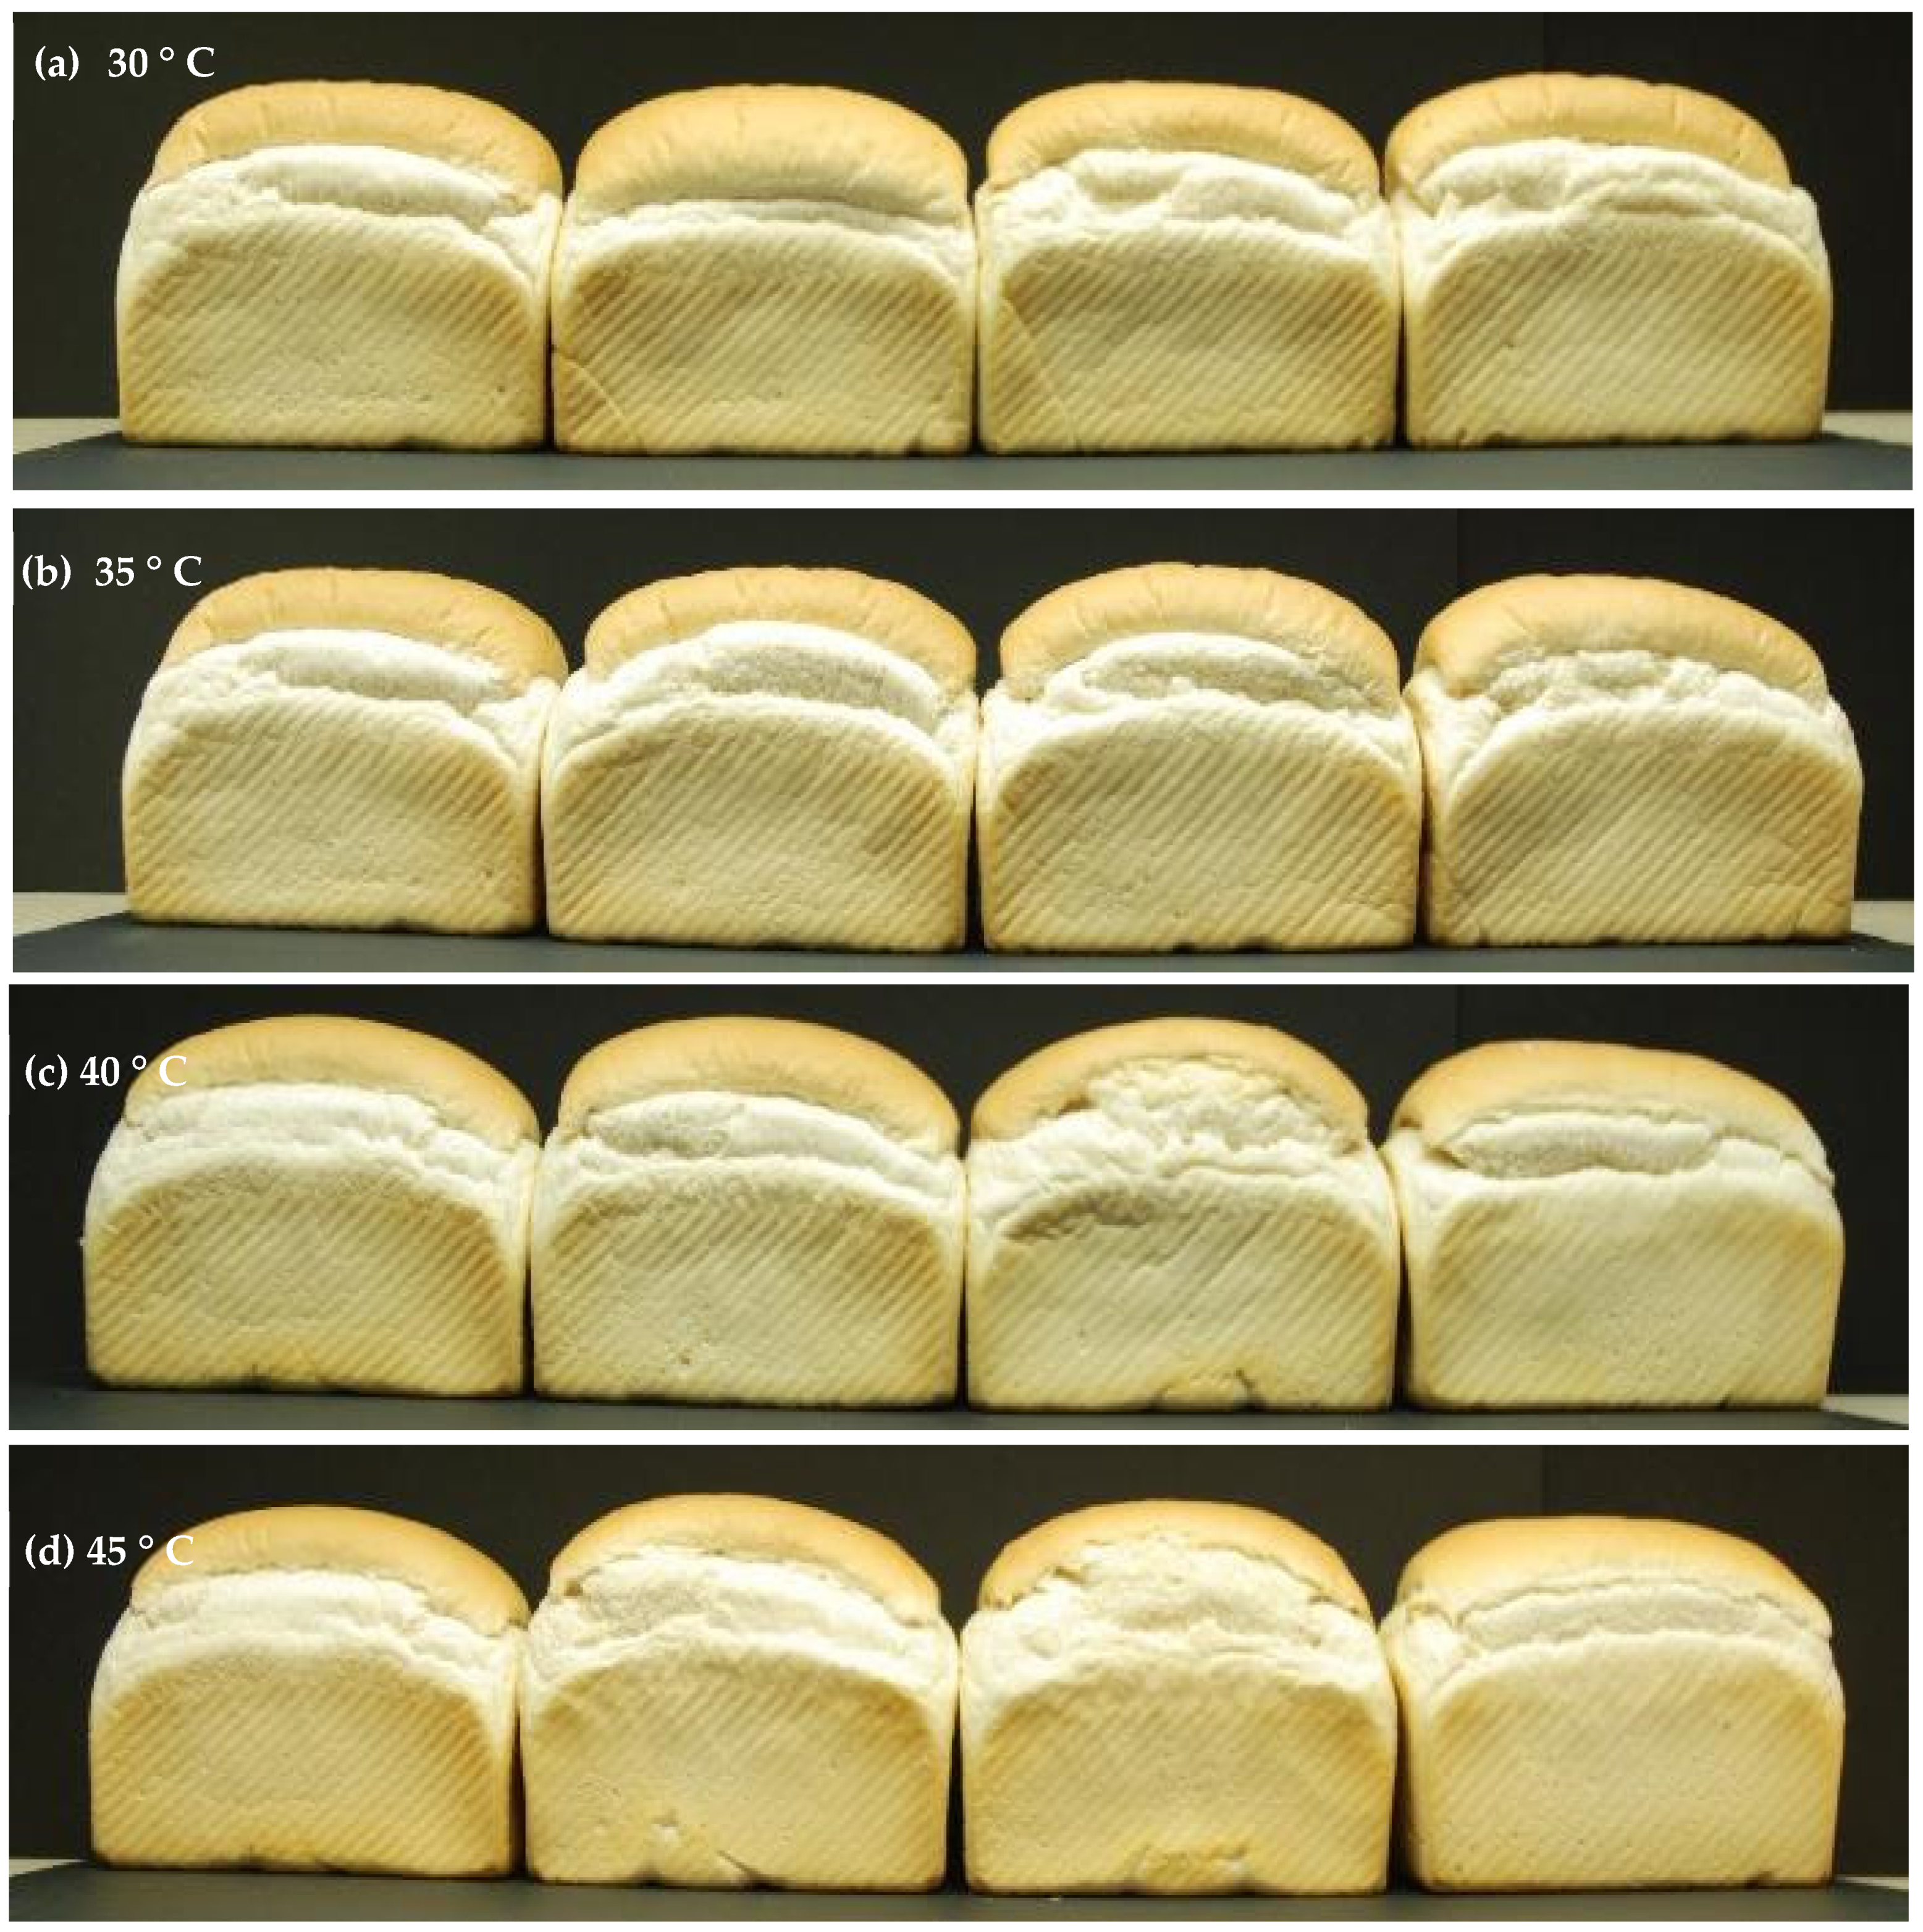
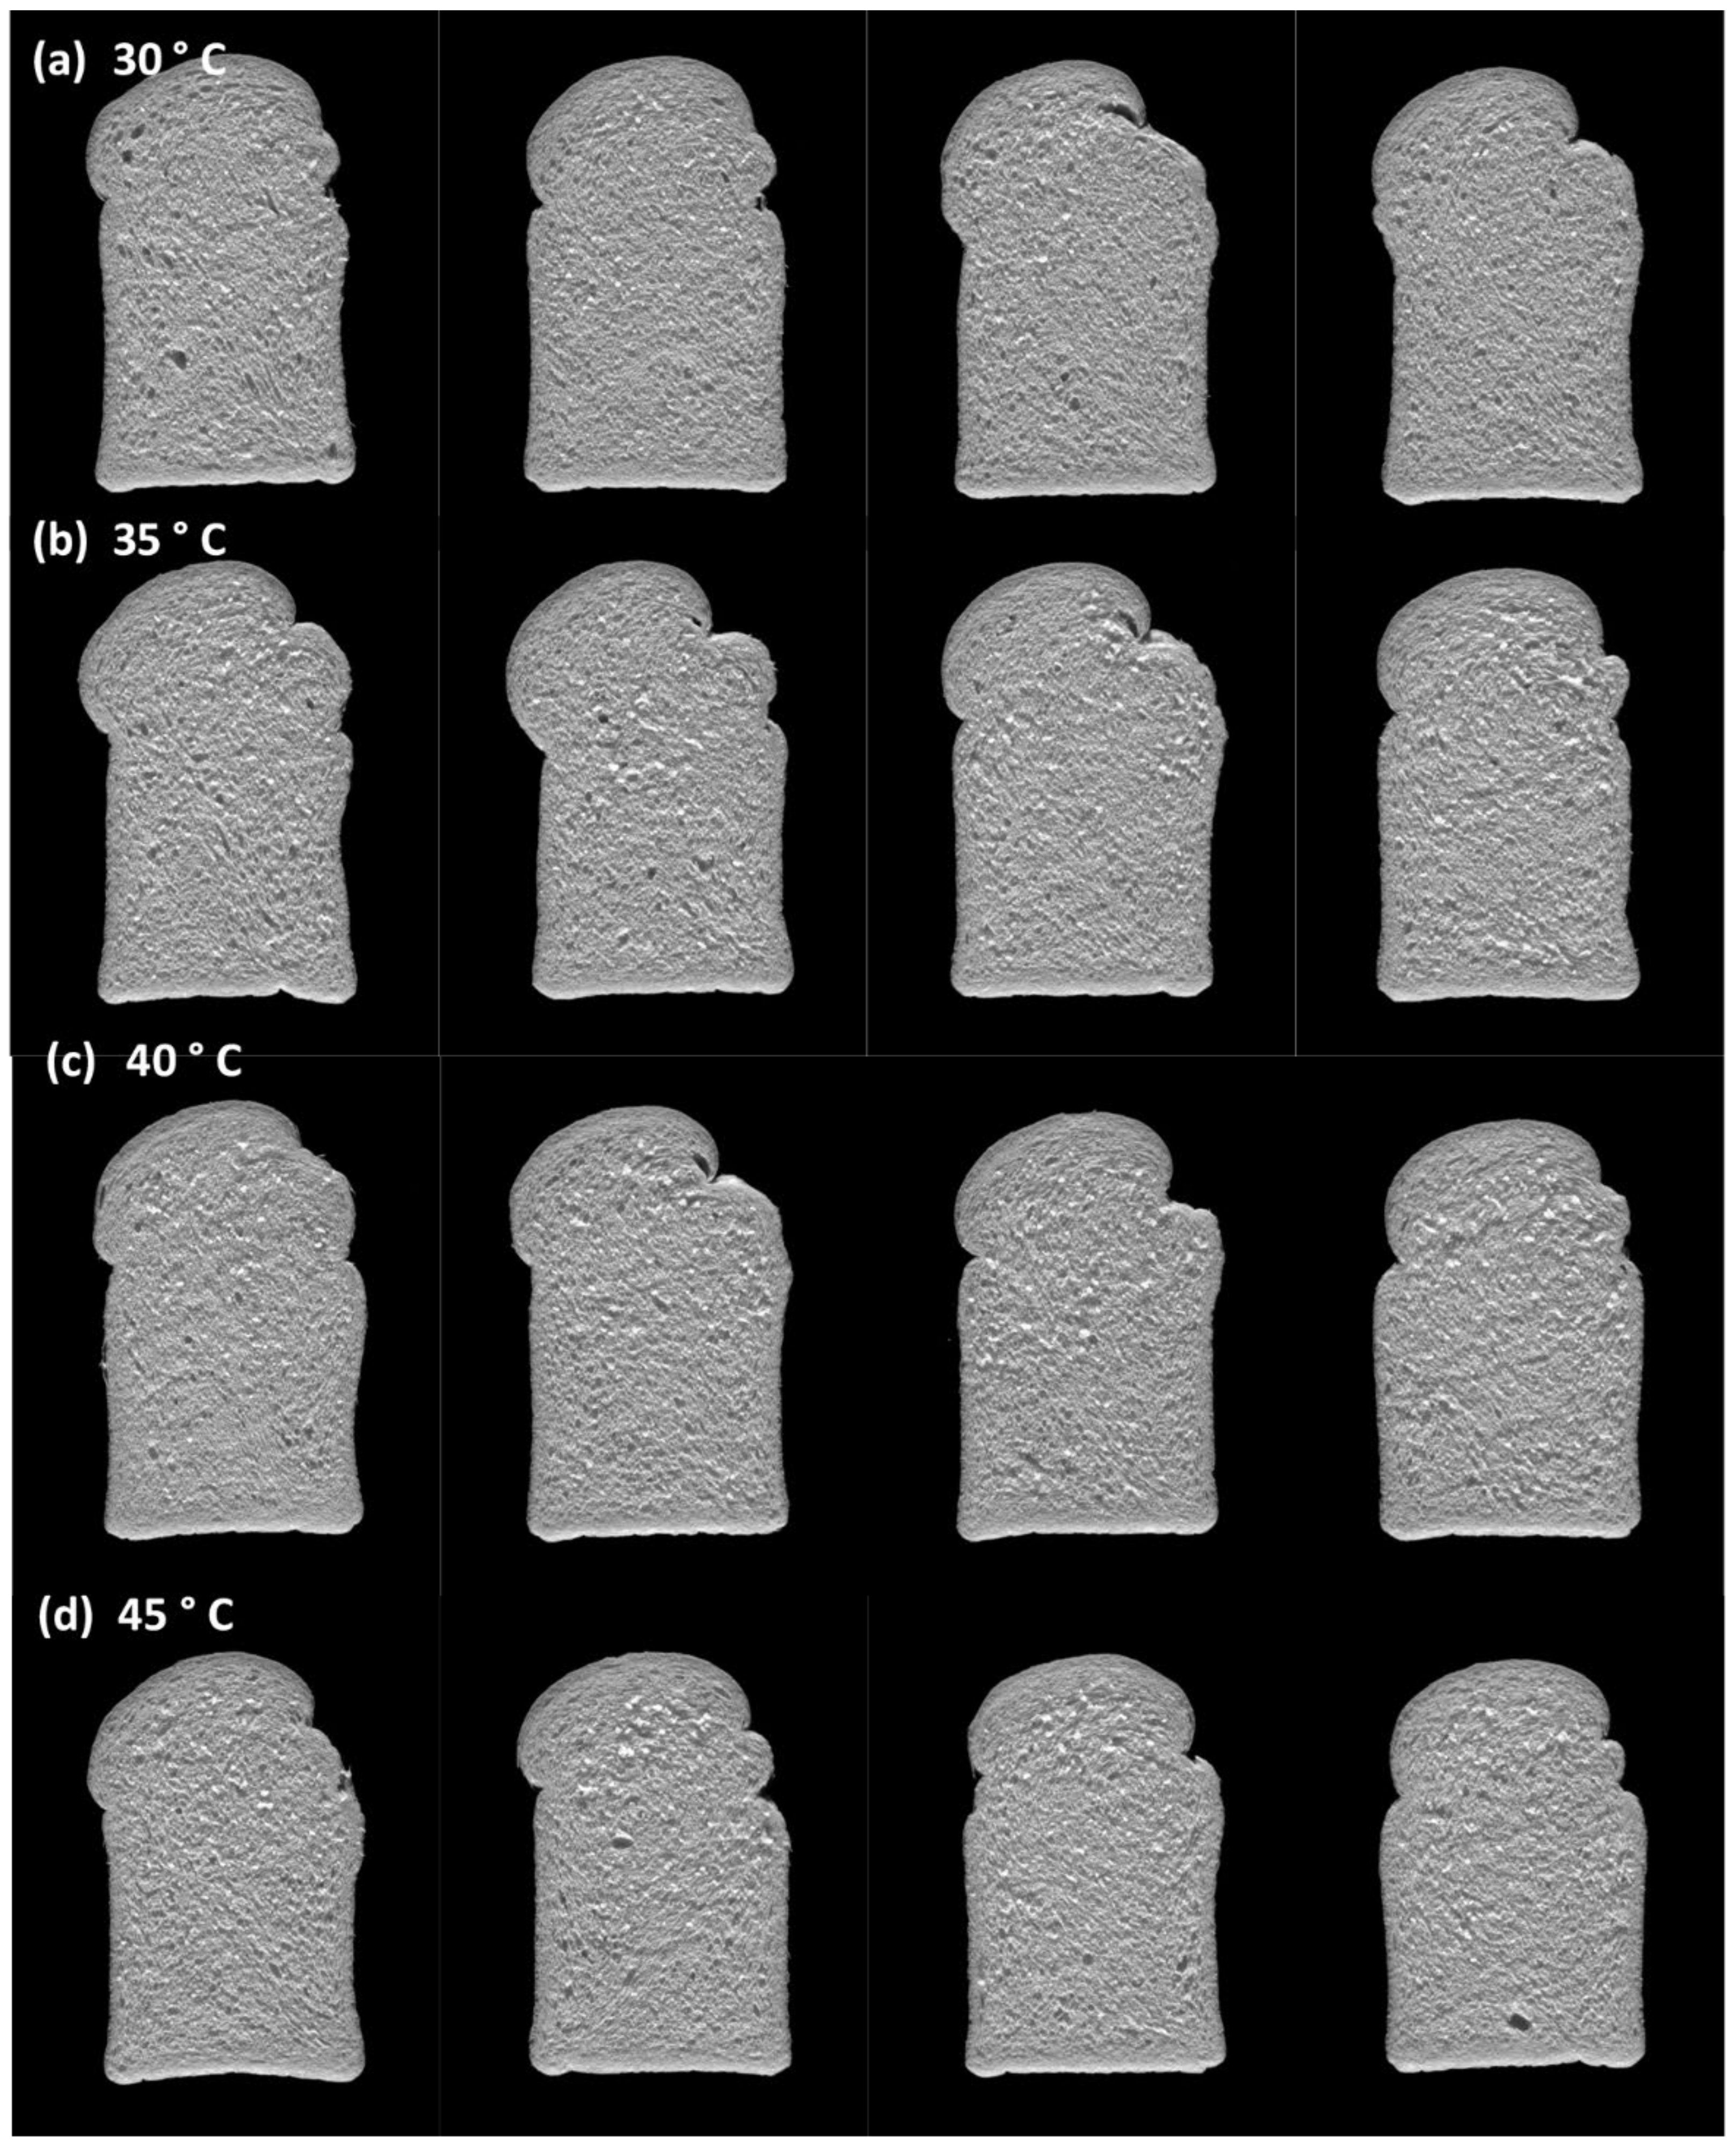
3.4.3. Effect of Fermentation Temperature on Bread Quality

Results for the quality parameters of the breads processed without ferment (control) and with ferment prepared at four different fermentation temperatures and added at three inclusion levels are summarized in Table 11 and Table 12. Images of the bread and bread slices are provided in Figure 12 and Figure 13.
Compared to the control bread, the addition of the ferment did not significantly affect specific volume of the breads regardless of the fermentation temperature used to prepare the ferment or the ferment inclusion level. Salovaara and Valjakka reported that specific volume of the breads made with wheat sours decreased when higher fermentation temperature was used for preparation of sours (25 to 30 °C) due to an increased concentration of acids at 30 °C [44]. In this study, breads processed with ferment prepared at 40 °C and added at the three levels of inclusion had the lowest crumb firmness indicating the softest crumb although this was not found to be significant different from the control bread. Bread prepared from ferment at 45 °C had the highest crumb firmness compared to the control bread and the other ferment treatments which was significant at the 30% and 70% inclusion levels. This may be due to the high TTA levels found for this ferment treatment (Figure 10) indicating greater acidification of the ferment. Barber et al. concluded that breads exhibited firmer crumb when lactic or acetic acids were added to the dough [45]. Breads processed with ferments exhibited an improvement in crumb brightness (L*) but this difference was not significant compared to the control. Only the ferment prepared at 45 °C resulted in a slight reduction of crumb brightness (L*) when added at a level of inclusion of 30%. Crumb redness (a*) was significantly reduced when bread was made with the ferment prepared at 35 °C at an inclusion level of 50%. The same trend was seen for the breads made with the ferment prepared at 40 °C and added at 30% and 50% and with the ferment prepared at 45 °C and used at 50% and 70% inclusion levels. Crumb yellowness (b*) was significantly higher in the bread prepared with ferment prepared at 45 °C at an inclusion level of 30%. The same trend was observed for the breads processed with the ferments that were prepared at temperatures higher than 30 °C with a 70% inclusion level. Fermentation temperatures of 35 °C and 40 °C seemed to be effective in increasing crumb brightness (L*) and reducing crumb redness (a*) when a 50% inclusion level was used.
Ferment inclusion did not significantly affect crumb structure compared to the control bread regardless of the fermentation temperature used for preparing the ferment or the level of ferment inclusion (Table 12). Bread made with the ferment prepared at 45 °C and added at a 30% inclusion level had the finest crumb structure as indicated by the highest value for number of cells per slice area.
Bread scores for the control bread and breads made with ferment are provided in Table 12 and used as supplementary data. Differences in scores were observed for the breads containing ferment compared to the control bread. Crumb colour scores were higher for breads made with ferment prepared at 35 °C at inclusion levels of 50% and 70% and the control bread indicating a whiter and brighter crumb colour. Ferments that were prepared using the other fermentation temperatures and added at varying inclusion levels, had crumb colour that was equal to, or in some cases slightly higher than the control bread. Crumb texture scores for the breads containing ferment were comparable to, or slightly higher, than the control. The lowest score for crumb texture was found for the bread containing ferment that was prepared at 40 °C and added at an inclusion level of 70% which is in agreement with the results for C-Cell which showed the largest cell diameter. Crumb softness scores were higher for breads containing ferments compared to the control bread regardless of the fermentation temperature used when added at inclusion levels of 50% and 70%. All other ferment treatments had scores for crumb softness equivalent to, or slightly higher, than the control. Crumb resilience scores were lower for the breads processed with ferments prepared at varying fermentation temperatures at an inclusion level of 70%. The same trend was seen for the bread made with ferment that was prepared at 35 °C and added at an inclusion level of 50%. All other ferment treatments resulted in crumb resilience scores that were comparable to, or slightly higher, than the control. Breads containing ferment had lower crumb strength scores for most treatments compared to the control bread. The biggest reduction in crumb strength scores was observed for the breads made with ferments prepared at 30 °C and 40 °C and added at inclusion levels of 50% and 70%. When ferments were added at an inclusion level of 30%, crumb strength was reduced, or equal to the control regardless of the fermentation temperature used. Overall, improvements were observed in crumb softness, texture, and colour, but crumb strength and crumb resilience were negatively impacted with the addition of ferment. Bread scores were affected to a greater extent for the breads made with ferment added at a 70% inclusion level regardless of the fermentation temperature used for preparing the ferment.

3.5. Validation Trial

A validation trial was conducted to verify the optimal fermentation processing variables that were identified in this study and to confirm the optimal ferment storage time. The results from the validation trial confirmed that a fermentation time of 240 min combined with a fermentation temperature of 35 °C and a ferment storage time of 24 h produced at all three levels of inclusion produced good-quality ferment and bread (data not included). Flavour of the bread containing the ferment was mild and pleasant and comparable to the control.

4. Conclusions and Future Work

This research adds to the scientific literature on the processing conditions that are required to produce a high-quality liquid ferment for the production of white pan bread with improved dough properties and enhanced bread softness. Optimal fermentation conditions were found to be a fermentation temperature of 35 °C combined with a fermentation time of 240 min and a ferment storage time of 24 h at 4 °C to stabilize acid production. The resulting ferment had a viscosity that would allow for it to be easily transferred by pumping directly into the mixer in a commercial bakery. Measurement of TTA during the preparation of the ferment and during storage was found to be an effective way to monitor ferment quality. Addition of ferment to the dough resulted in reduced mixing time which would help improve production efficiency in commercial bakeries. Furthermore, the addition of ferment improved the dough handling properties including improved extensibility with more balanced properties without compromising dough stability after proofing, all of which are important in commercial bread making. Bread made with ferment had enhanced softness as observed by instrumental firmness results and subjective bread scores. Overall, our research has shown that the use of ferment is a viable alternative processing method to produce “clean label” bread with naturally derived ingredients and minimum additives.
There are several limitations in our study that should be addressed in future research. First, it is recommended that the crust colour formation of the bread be measured to determine if the use of ferment affects colour formation in the crust. Secondly, given the effects of ferment addition on the dough handling properties it is recommended that a subjective scoring system for evaluating the dough handling properties be developed along with assessment of the rheological properties of the dough at various stages during the bread-making process. Understanding the impact of ferment addition of the flavour profile (both crust and crumb) should be also undertaken along with the studies to monitor the shelf-life of the bread. Additional work to optimize the preparation of the ferment by investigating agitator speed and the use of pressure during fermentation would also be beneficial.

Author Contributions

Conceptualization, L.M., A.D., S.J. and L.B.; methodology, L.B., K.M., Y.B. and S.J.; validation, K.M., L.B. and Y.B.; formal analysis, Y.B., L.B. and K.M.; investigation, L.B., K.M. and Y.B.; resources, A.D. and E.S.; data curation, L.B., K.M. and Y.B.; writing—original draft preparation, Y.B.; writing—review and editing, Y.B., L.M. and E.S.; visualization, L.M.; supervision, E.S. and L.M.; project administration, E.S., L.M. and A.D.; funding acquisition, A.D. and L.M. All authors have read and agreed to the published version of the manuscript.

Funding

This project was made possible from funding from the Government of Manitoba and The Government of Canada through the Growing Forward 2, Growing Innovation - Grain Innovation Hub Program.

Institutional Review Board Statement

Not applicable.

Informed Consent Statement

Not applicable.

Acknowledgments

The authors would like to thank the Canadian International Grains Institute technology staff for conducting analytical testing and assisting with fermentation and baking trials and the communications staff for assisting with design of the figures.

Conflicts of Interest

The authors declare no conflict of interest.

References

  1. Dimidi, E.; Cox, S.R.; Rossi, M.; Whelan, K. Fermented foods: Definitions and characteristics, impact on the gut microbiota and effects on gastrointestinal health and disease. Nutrients 2019, 11, 1806. [Google Scholar] [CrossRef] [Green Version]
  2. Melini, F.; Melini, V.; Luziatelli, F.; Ficca, A.G.; Ruzzi, M. Health-promoting components in fermented foods: An up-to-date systematic review. Nutrients 2019, 11, 1189. [Google Scholar] [CrossRef] [PubMed] [Green Version]
  3. Poutanen, K.; Flander, L.; Katina, K. Sourdough and cereal fermentation in a nutritional perspective. Food Microbiol. 2009, 26, 693–699. [Google Scholar] [CrossRef] [PubMed]
  4. Maloney, D.H.; Foy, J.J. Yeast fermentations. In Handbook of Dough Fermentations; Kulp, K., Lorenz, K., Eds.; Marcel Dekker, Inc.: New York, NY, USA, 2003; ISBN 0-8247-4264-8. [Google Scholar]
  5. Gorton, L.A. Fundamental bakery dough processes. In Baking Science and Technology, 4th ed.; Pyler, E.J., Gorton, L.A., Eds.; Sosland Publishing Co.: Kansas City, MO, USA, 2009; Volume II, pp. 1–124. ISBN 978-0-9820239-1-4. [Google Scholar]
  6. Sluimer, P. Principles in brief. In Principles of Breadmaking. Functionality of Raw Materials and Process Steps; Sluimer, P., Ed.; American Association of Cereal Chemists, Inc.: St. Paul, MN, USA, 2005; pp. 1–15. ISBN 1-891127-45-4. [Google Scholar]
  7. O’Donnell, K. Methods of bread dough making. AIB Tech. Bull. 1996, XVIII, 1–6. [Google Scholar]
  8. Gorton, L.A.; Bakhoum, M.; van der Maarel, H. Formulating. In Baking Science and Technology, 4th ed.; Pyler, E.J., Gorton, L.A., Eds.; Sosland Publishing Co.: Kansas City, MO, USA, 2009; Volume II, pp. 167–369. ISBN 978-0-9820239-1-4. [Google Scholar]
  9. Strouts, B. Secondary ingredients for baking: Dough conditioners, enzymes, dough strengtheners, crumb softeners and preservatives. AIB Tech. Bull. 2012, XXXIV, 1–11. [Google Scholar]
  10. Kulp, K. Technology of brew system in bread production. Bak. Dig. 1983, 57, 20–23. [Google Scholar]
  11. Pyler, E.J. Liquid ferment process. Their technical evolution and practical adaptation. Bak. Dig. 1970, 44, 34–40. [Google Scholar]
  12. Fields, E.T. Flour pre-ferments. In BakingTech Presentations, Proceedings of the American Society of Baking 61st Annual Meeting, Chicago Marriot Hotel, Chicago, IL, USA, 3–6 March 1985; American Society of Bakery Engineers: Chicago, IL, USA, 1986. [Google Scholar]
  13. Watkins, F.H. High-flour liquid ferments. In BakingTech Presentations, Proceedings of the American Society of Baking 67th Annual Meeting, Chicago Marriot Hotel, Chicago, IL, USA, 3–6 March 1991; The Society: Chicago, IL, USA, 1991. [Google Scholar]
  14. Stakley, D.M. Water pre-ferments. In BakingTech Presentations, Proceedings of the American Society of Baking 61st Annual Meeting, Chicago Marriot Hotel, Chicago, IL, USA, 3–6 March 1985; American Society of Bakery Engineers: Chicago, IL, USA, 1986. [Google Scholar]
  15. Sutherland, R. Hydrogen ion concentration (pH) and total titratable acidity tests. AIB Tech. Bull. 1989, XI, 1–6. [Google Scholar]
  16. Reed, D.G. pH in liquid ferments. Bak. Dig. 1965, 39, 32–36. [Google Scholar]
  17. Doerry, W.T.A.; Ross, A.; Baker, A. Liquid preferments: A study of factors affecting fermentation parameters and bread quality. AIB Tech. Bull. 1985, VII, 1–9. [Google Scholar]
  18. Perrou, E. Liquid ferments vs. sponge and dough. In Proceedings of the American Society of Baking 76th Annual Technical Conference, Chicago Marriot Hotel, Chicago, IL, USA, 5–8 March 2000. [Google Scholar]
  19. Nascimento, K.O.; Nascimento Dias Paes, S.; Augusta, I.M. A review ‘clean labeling’: Applications of natural ingredients in bakery products. J. Food Nutr. 2018, 6, 285–294. [Google Scholar] [CrossRef]
  20. Williams, P.; Sobering, D.; Antoniszyn, J. Protein testing methods. In Wheat Protein, Production and Marketing, Proceedings of the Wheat Protein Symposium, Saskatoon, SK, Canada, 9–10 March 1998; Fowler, D.B., Geddes, W.E., Johnston, A.M., Preston, K.R., Eds.; University of Saskatchewan Press: Saskatoon, SK, Canada, 1998; pp. 37–47. [Google Scholar]
  21. AACC International. Approved Methods of the American Association of Cereal Chemists, 11th ed.; AACC International: St. Paul, MN, USA, 2010. [Google Scholar]
  22. Hugo, L.; Rooney, L.W.; Taylor, J.R.N. Fermented sorghum as a functional ingredient as composite breads. Cereal Chem. 2003, 80, 495–499. [Google Scholar] [CrossRef]
  23. Jackel, S.S. Fermentation—today and tomorrow. In Proceedings of the American Society of Baking 45th Annual Meeting, Chicago, IL, USA, 3–5 March 1969. [Google Scholar]
  24. Doerry, W.T.A. Sour dough and breads. AIB Tech. Bull. 1998, XX, 1–9. [Google Scholar]
  25. Sluimer, P. Fermentation and proof. In Principles of Breadmaking. Functionality of Raw Materials and Process Steps; Sluimer, P., Ed.; American Association of Cereal Chemists, Inc.: St. Paul, MN, USA, 2005; pp. 82–139. ISBN 1-891127-45-4. [Google Scholar]
  26. Kusunose, C.; Fujii, T.; Matsumoto, H. Role of starch granules in controlling expansion of dough during baking. Cereal Chem. 1999, 76, 920–924. [Google Scholar] [CrossRef]
  27. Yara-Varón, E.; Li, Y.; Balcells, M.; Canela-Garayoa, R.; Fabiano-Tixier, A.-S.; Chemat, F. Vegetable oils as alternative solvents for green oleo-extraction, purification and formulation of food and natural products. Molecules 2017, 22, 1474. [Google Scholar] [CrossRef]
  28. Medcalf, D.G.; Youngs, V.L.; Gilles, K.A. Wheat starches. II. Effect of polar and nonpolar lipid fractions on pasting characteristics. Cereal Chem. 1968, 45, 88–95. [Google Scholar]
  29. Majzoobi, M.; Beparva, P. Effects of acetic and lactic acid on physiochemical characteristics of native and cross-linked wheat starches. Food Chem. 2014, 147, 312–317. [Google Scholar] [CrossRef]
  30. Lund, D.; Lorenz, K.J. Influence of time, temperature, moisture, ingredients, and processing conditions on starch gelatinization. C R C Crit. Rev. Food Sci. Nutr. 1984, 20, 249–273. [Google Scholar] [CrossRef] [PubMed]
  31. Thompson, D.R. State of the art—Bakery fermentation. Bak. Dig. 1980, 54, 28–31. [Google Scholar]
  32. Kulp, K. Influence of liquid ferments on quality characteristics of white pan bread. AIB Tech. Bull. 1986, VIII, 1–9. [Google Scholar]
  33. Lorenz, K.; Bruemmer, J.-M. Preferments and sourdoughs for German breads. In Handbook of Dough Fermentations; Kulp, K., Lorenz, K., Eds.; Marcel Dekker, Inc.: New York, NY, USA, 2003; ISBN 0-8247-4264-8. [Google Scholar]
  34. Komlenić, D.K.; Ugarčić-Hardi, Ź.; Jukić, M.; Planinić, M.; Bucić-Kojić, A.; Strelec, I. Wheat dough rheology and bread quality effected by Lactobacillus brevis preferment, dry sourdough and lactic acid addition. Int. J. Food Sci. Technol. 2010, 45, 1417–1425. [Google Scholar] [CrossRef]
  35. Biliaderis, C.G.; Maurice, T.J. Starch gelatinization phenomena studied by differential scanning calorimetry. J. Food Sci. 1980, 45, 1669–1674. [Google Scholar] [CrossRef]
  36. French, D. Organization of starch granules. In Starch: Chemistry and Technology, 2nd ed.; Whistler, R.L., Paschall, E.F., Bemiller, J.N., Eds.; Academic Press: London, UK, 1984; pp. 184–248. ISBN 0-12746207-8. [Google Scholar]
  37. Mohamed, A.A.; Rayas-Duarte, P. The effect of mixing and wheat protein/gluten on the gelatinization of wheat starch. Food Chem. 2003, 81, 533–545. [Google Scholar] [CrossRef]
  38. Balestra, F.; Pinnavaia, G.G.; Romani, S. Evaluation of the effects of different fermentation methods on dough characteristics. J. Texture Stud. 2015, 46, 262–271. [Google Scholar] [CrossRef]
  39. Angioloni, A.; Romani, S.; Pinnavaia, G.G.; Dalla Rosa, M. Characteristics of bread making doughs: Influence of sourdough fermentation on the fundamental rheological properties. Eur. Food Res. Technol. 2006, 222, 54–57. [Google Scholar] [CrossRef]
  40. Cauvain, S.P. Breadmaking. In Cereals Processing Technology; Owens, D., Ed.; CRC Press LLC: Boca Raton, FL, USA, 2001; pp. 204–230. ISBN 0-8493-1219-1. [Google Scholar]
  41. Ragaee, S.; Abdel-Aal, E.M. Pasting properties of starch and protein in selected cereals and quality of their food products. Food Chem. 2006, 95, 9–18. [Google Scholar] [CrossRef]
  42. Clarke, C.I.; Schober, T.J.; O’Sullivan, K.; Arendt, E.K. Wheat sourdough fermentation: Effects of time and acidification on fundamental rheological properties. Cereal Chem. 2004, 81, 409–417. [Google Scholar] [CrossRef]
  43. Maher Galal, A.; Varriano-Marston, E.; Johnson, J.A. Rheological dough properties as affected by organic acids and salt. Cereal Chem. 1978, 55, 683–691. [Google Scholar]
  44. Salovaara, H.; Valjakka, T. The effect of fermentation temperature, flour type, and starter on the properties of sour wheat bread. Int. J. Food Sci. Technol. 1987, 22, 591–597. [Google Scholar] [CrossRef]
  45. Barber, B.; Ortolá, C.; Barber, S.; Fernández, F. Storage of packaged white bread. III. Effects of sour dough and addition of acids on bread characteristics. Z. für Lebensm. Unters. Und Forsch. 1992, 194, 442–449. [Google Scholar] [CrossRef]
Figure 1. Changes in total titratable acidity of the ferment during fermentation and over storage time. Bars represent the means and standard deviations of two replication. Bars with different letters indicate significant differences for the results at p < 0.05 (Tukey–Kramer test).
Applsci 11 10203 g001
Figure 2. RVA pasting curves of the ferment (a) and wheat flour (b) (RVU—rapid visco units).
Applsci 11 10203 g002
Figure 3. Ferment viscosity at 6–9 min holding time of the pasting profile during fermentation and over a 72 h storage. Bars represent the means and standard deviations of two replications. No significant differences were detected for the results at p < 0.05 (Tukey–Kramer test) for each holding time as indicated with the bars with the same letter.
Applsci 11 10203 g003
Figure 4. Breads made with fresh ferment and stored over a 72 h period. (a) 0 h of storage, (b) 24 h of storage, (c) 48 h of storage, and (d) 72 h of storage. Left to right: control (no ferment), 30% ferment inclusion, 50% ferment inclusion, and 70% ferment inclusion.
Applsci 11 10203 g004
Figure 5. Slices of bread made with fresh ferment and stored over a 72 h period. (a) 0 h of storage, (b) 24 h of storage, (c) 48 h of storage, and (d) 72 h of storage. Left to right: control (no ferment), 30% ferment inclusion, 50% ferment inclusion, and 70% ferment inclusion.
Applsci 11 10203 g005
Figure 6. Changes in total titratable acidity of the ferment during fermentation and over a 48 h storage. Bars represent the means and standard deviations of two replication. Bars with different letters indicate significant differences for the results for each fermentation time at p < 0.05 (Tukey–Kramer test). Results for 280 min of fermentation at 48 h of storage are not available.
Applsci 11 10203 g006
Figure 7. Impact of fermentation time on ferment viscosity measured at 8 and 9 min holding time of the pasting profile during fermentation and ferment storage at 24 h and 48 h. Bars represent the means and standard deviations of two replications. Bars with different letters indicate significant differences for the results for each fermentation time at p < 0.05 (Tukey–Kramer test).
Applsci 11 10203 g007
Figure 8. Breads made with ferment prepared using varying fermentation times. (a) 90 min, (b) 150 min, (c) 210 min, and (d) 280 min. Left to right: control (no ferment), 30% ferment inclusion, 50% ferment inclusion, and 70% ferment inclusion.
Applsci 11 10203 g008
Figure 9. Slices of bread made with ferment prepared using varying fermentation times. (a) 90 min, (b) 150 min, (c) 210 min, and (d) 280 min. Left to right: control (no ferment), 30% ferment inclusion, 50% ferment inclusion, and 70% ferment inclusion.
Applsci 11 10203 g009
Figure 10. Changes in total titratable acidity of the ferment during fermentation and over a 48 h storage. Bars represent the means and standard deviations of two replication. Bars with different letters indicate significant differences for the results for each fermentation temperature at p < 0.05 (Tukey–Kramer test).
Applsci 11 10203 g010
Figure 11. Impact of fermentation temperature on ferment viscosity measured at 8 and 9 min holding time of the pasting profile during fermentation and ferment storage at 24 h and 48 h. Bars represent the means and standard deviations of two replications. No significant differences were detected for the results for each fermentation temperature and hold time at p < 0.05 (Tukey–Kramer test) as indicated with the bars with the same letter.
Applsci 11 10203 g011
Figure 12. Breads made with ferment prepared using varying fermentation temperatures. (a) 30 °C, (b) 35 °C, (c) 40 °C, and (d) 45 °C. Left to right: control (no ferment), 30% ferment inclusion, 50% ferment inclusion, and 70% ferment inclusion.
Applsci 11 10203 g012
Figure 13. Slices of bread made with ferment prepared using varying fermentation temperatures. (a) 30 °C, (b) 35 °C, (c) 40 °C, and (d) 45 °C. Left to right: control (no ferment), 30% ferment inclusion, 50% ferment inclusion, and 70% ferment inclusion.
Applsci 11 10203 g013
Table 1. Ferment processing conditions (standard four-stage fermentation cycle).
Processing ParameterStage 1Stage 2Stage 3Stage 4
Agitator 1 speed (Hz)10355010
Agitator 2 speed (Hz)10355010
Sparge/air (15 L/min)ON
Fermentation time (min)15 + 2 (stoppage)5 + 2 (stoppage)150–280 1
Fermentation temperature (°C)35353530–45 1
1 Varied depending on the processing trial. Refer to Table 3 for details.
Table 2. Formulation used to prepare ferment.
IngredientBaker’s %Weight (g)
Water1128400
Wheat flour1007500
Yeast3.1235
Oil2150
Table 3. Ferment processing trials.
Processing ParameterProcessing Trial
1234
Ferment storage time (h)0, 24, 48, 720, 24, 48 10, 24, 48 10, 24, 48, 72
Fermentation time (min)15090, 150, 210, 280240240
Fermentation temperature (°C)353530, 35, 40, 4535
1 Bread was only baked using ferment that was stored for 24 h.
Table 4. Sampling intervals for measuring TTA and viscosity during each ferment processing trial.
Ferment Processing TrialTime Intervals for Measuring TTATime Intervals for Measuring Viscosity
Trials 1: Ferment Storage Time
Fermentation stage (min)50, 100, 15050, 100, 150
Ferment storage time (h)24, 48, 7224, 48, 72
Trial 2: Fermentation Time
90 min50, 9050, 90
150 min50, 100, 15050, 100, 150
210 min50, 100, 117, 134, 150, 167, 184, 210 150, 100, 150, 210
280 min50, 100, 150, 210, 225, 240, 280 150, 100, 150, 210, 280
Trial 3: Fermentation Temperature50, 100, 156, 167, 184, 200, 220, 240 250, 100, 150, 240 2
Trial 4: Validation
Fermentation stage (min)240240
Ferment storage time (h)24, 48, 7224, 48, 72
1 More frequent measurement of TTA was performed to determine if there was a stable period of acid development which would indicate maturation of the ferment. 2 Time intervals used for all fermentation temperatures tested.
Table 5. Bread formulation with adjusted levels of wheat flour and water to compensate for addition of ferment.
IngredientBaker’s %Ferment Inclusion Level (%)
Ingredient Weight (g)
0305070
Wheat flour 11002619224519951746
Water65–69 21702–18071290–13961016–1121742–847
Fermentvariable0786 313101833
Yeast6.5170170170170
Salt1.539393939
Dough improver126262626
Oil126262626
Sugar0.513131313
1 Flour weight is based on 14% moisture. 2 Variable; based on the amount of water added to the control sample (no ferment) to produce a soft dough. 3 Ferment contributed 1 part of flour to 1.12 parts of water to the final dough formula. The amounts of flour and water in the ferment varied depending on the inclusion level.
Table 6. Flour quality parameters.
Parameter 1Value
Protein (%)11.6
Moisture (%)14.8
Ash (%)0.63
Falling number (sec)405
Starch damage (UCD)25.1
Farinograph Properties
Absorption (%)62.7
Dough development time (min)2.1
Stability (min)15.0
Mixing tolerance index (BU)14
RVA Pasting Properties
Peak viscosity (RVU)160
Hot paste viscosity (RVU)88
Breakdown (RVU)72
Final viscosity (RVU)177
Setback (RVU)89
Pasting time (min)5.98
1 Results reported on 14% flour moisture basis.
Table 7. Processing parameters, bread specific volume, crumb firmness and colour of the control and breads containing ferment stored for varying periods of time 1.
Ferment Storage
and
Inclusion Level
Mixing
Time
(min)
Proof
Time
(min)
Specific Volume (cm3/g)Crumb
Firmness
Force (g)
Crumb Colour
L*a*b*
Control7.3 ± 0.4 a39.8 ± 1.7 ab4.7 ± 0.1 a264 ± 11 a79.9 ± 0.2 a1.53 ± 0.02 a13.1 ± 0.1 b
0 h
30%6.7 ± 0.3 a–c40.5 ± 2.1 a,b4.9 ± 0.1 a207 ± 12 b78.8 ± 0.6 b,c1.47 ± 0.05 a13.4 ± 0.8 a,b
50%6.4 ± 0.1 a–c38.5 ± 2.1 a,b4.8 ± 0.1 a191 ± 20 b78.9 ± 0.2 b,c1.48 ± 0.15 a13.5 ± 0.1 a,b
70%6.2 ± 0.1 a–c35.5 ± 0.7 b4.9 ± 0.1 a186 ± 15 b78.9 ± 0.4 a–c1.55 ± 0.14 a13.7 ± 0.2 a,b
24 h
30%6.6 ± 0.6 a–c36.5 ± 2.1 a,b4.9 ± 0.1 a214 ± 18 b79.2 ± 0.4 a,b1.46 ± 0.03 a13.6 ± 0.4 a,b
50%6.4 ± 0.2 a–c37.5 ± 0.7 a,b4.9 ± 0.1 a217 ± 33 b79.2 ± 0.5 a,b1.45 ± 0.06 a13.7 ± 0.3 a,b
70%6.4 ± 0.1 a–c39.0 ± 2.8 a,b5.0 ± 0.1 a200 ± 27 b79.0 ± 0.2 a–c1.46 ± 0.10 a13.9 ± 0.1 a,b
48 h
30%6.2 ± 0.1 a–c41.0 ± 4.2 a,b4.9 ± 0.3 a209 ± 21 b78.8 ± 0.6 b,c1.32 ± 0.34 a14.0 ± 0.7 a,b
50%5.9 ± 0.1 b,c42.5 ± 0.7 a,b4.9 ± 0.1 a196 ± 16 b78.0 ± 0.2 c1.33 ± 0.24 a14.4 ± 0.6 a,b
70%6.9 ± 0.9 a,b39.5 ± 3.5 a,b5.0 ± 0.0 a207 ± 14 b78.4 ± 0.2 b,c1.26 ± 0.23 a14.3 ± 0.7 a,b
72 h
30%6.1 ± 0.4 b,c38.5 ± 2.1 a,b5.0 ± 0.0 a206 ± 20 b79.0 ± 0.3 a–c1.29 ± 0.21 a13.9 ± 0.7 a,b
50%5.9 ± 0.1 b,c42.0 ± 4.2 a,b5.1 ± 0.1 a219 ± 12 b78.4 ± 0.7 b,c1.26 ± 0.17 a14.3 ± 0.7 a,b
70%5.5 ± 0.1 c46.5 ± 5.0 a5.0 ± 0.0 a198 ± 16 b78.9 ± 0.3 b,c1.28 ± 0.21 a14.5 ± 0.9 a
1 Different letters within the same column indicate significant differences for the results for each parameter at p < 0.05 (Tukey–Kramer test).
Table 8. Crumb structure parameters and bread scores of the control and breads containing ferment stored for varying periods of time 1.
Ferment Storage
and
Inclusion Level
Crumb StructureBread Crumb Scores
CD 2 (mm) NC/SA 2 CWT 2CC 2ColourTextureSoftnessResilienceStrength
Control1.92 ± 0.18 b,c0.62 ± 0.04 a0.45 ± 0.01 a0.79 ± 0.01 a10.0 ± 0.010.0 ± 0.010.0 ± 0.010.0 ± 0.010.0 ± 0.0
0 h
30%2.02 ± 0.04 a–c0.58 ± 0.02 a,b0.46 ± 0.01 a0.77 ± 0.01 a,b9.3 ± 0.410.3 ± 0.410.3± 0.410.0 ± 0.010.5 ± 0.7
50%2.03 ± 0.01 a–c0.58 ± 0.01 a,b0.47 ± 0.00 a0.77 ± 0.01 a,b9.3 ± 0.49.3 ± 0.410.5 ± 0.710.0 ± 0.010.5 ± 0.7
70%2.11 ± 0.06 a–c0.56 ± 0.01 a,b0.47 ± 0.00 a0.77 ± 0.01 a,b9.5 ± 1.49.5 ± 1.410.8 ± 0.49.5 ± 0.710.0 ± 1.4
24 h
30%1.87 ± 0.70 c0.62 ± 0.04 a0.45 ± 0.01 a0.78 ± 0.01 a,b9.0 ± 0.09.8 ± 0.410.0 ± 0.010.0 ± 0.010.0 ± 0.0
50%1.93 ± 0.11 a–c0.60 ± 0.03 a,b0.46 ± 0.01 a0.78 ± 0.01 a,b9.0 ± 0.09.5 ± 0.710.0 ± 0.09.8 ± 0.410.0 ± 0.0
70%1.95 ± 0.02 a–c0.60 ± 0.02 a,b0.46 ± 0.00 a0.78 ± 0.00 a,b8.8 ± 0.410.0 ± 0.710.3 ± 0.410.0 ± 0.010.5 ± 0.7
48 h
30%2.11 ± 0.13 a–c0.57 ± 0.02 a,b0.47 ± 0.01 a0.77 ± 0.01 a,b9.8 ± 0.410.3 ± 0.410.3 ± 0.410.0 ± 0.09.5 ± 0.7
50%2.09 ± 0.12 a–c0.57 ± 0.02 a,b0.47 ± 0.01 a0.76 ± 0.01 b9.5 ± 0.710.0 ± 0.710.3 ± 0.49.5 ± 0.79.5 ± 0.7
70%2.11 ± 0.08 a–c0.56 ± 0.02 a,b0.47 ± 0.01 a0.77 ± 0.00 a,b9.3 ± 0.49.5 ± 0.010.8 ± 0.49.3 ± 0.49.5 ± 0.7
72 h
30%2.05 ± 0.14 a–c0.58 ± 0.03 a,b0.46 ± 0.01 a0.78 ± 0.01 a,b9.8 ± 0.410.0 ± 0.010.3 ± 0.410.0 ± 0.09.5 ± 0.7
50%2.17 ± 0.13 a,b0.56 ± 0.02 a,b0.47 ± 0.01 a0.77 ± 0.01 a,b9.5 ± 0.79.8 ± 0.410.5 ± 0.010.0 ± 0.09.3 ± 0.4
70%2.22 ± 0.21 a0.55 ± 0.04 b0.47 ± 0.01 a0.77 ± 0.01 a,b9.3 ± 0.49.5 ± 0.011.0 ± 0.010.0 ± 0.09.3 ± 0.4
1 Different letters within the same column indicate significant differences for the results for each parameter at p < 0.05 (Tukey–Kramer test). 2 Abbreviations used: CD is cell diameter; NC/SA is number of cells per slice area; CWT is cell wall thickness; CC is cell contrast.
Table 9. Processing parameters, bread specific volume, crumb firmness and colour of the control and breads containing ferment prepared during varying fermentation times 1.
Fermentation Time
and
Inclusion Level
Mixing
Time
(min)
Proof
Time
(min)
Specific
Volume (cm3/g)
Crumb
Firmness
Force (g)
Crumb Colour
L*a*b*
Control7.4 ± 0.2 a39.7 ± 1.7 a,b5.0 ± 0.1 a227 ± 27 a79.9 ± 0.9 a1.27 ± 0.16 a13.5 ± 0.9 a
90 min
30%6.6 ± 0.1 b39.0 ± 1.4 a,b5.0 ± 0.1 a198 ± 17 a,b79.3 ± 0.5 a,b1.31 ± 0.17 a13.9 ± 0.8 a
50%6.2 ± 0.3 b,c40.0 ± 2.8 a,b5.1 ± 0.1 a187 ± 18 b79.1 ± 0.2 a,b1.29 ± 0.20 a14.1 ± 0.6 a
70%6.1 ± 0.5 b,c41.0 ± 1.4 a,b5.0 ± 0.1 a187 ± 21 b78.7 ± 0.4 b1.34 ± 0.11 a14.6 ± 0.6 a
150 min
30%6.7 ± 0.2 b38.0 ± 0.0 a,b5.2 ± 0.1 a186 ± 14 b79.6 ± 0.6 a,b1.27 ± 0.20 a13.6 ± 0.7 a
50%6.0 ± 0.1 b,c37.0 ± 0.0 b5.1 ± 0.1 a205 ± 19 a,b79.5 ± 0.3 a,b1.22 ± 0.19 a13.9 ± 0.8 a
70%5.7 ± 0.1 c39.0 ± 1.4 a,b5.1 ± 0.1 a197 ± 23 a,b79.3 ± 0.2 a,b1.26 ± 0.26 a14.3 ± 0.7 a
210 min
30%6.8 ± 0.1 a,b38.5 ± 0.7 a,b4.9 ± 0.1 a207 ± 18 a,b79.1 ± 0.6 a,b1.45 ± 0.19 a14.0 ± 0.2 a
50%6.1 ± 0.1 b,c37.0 ± 0.0 b4.9 ± 0.1 a195 ± 15 a,b79.0 ± 0.5 a,b1.37 ± 0.18 a14.3 ± 0.4 a
70%5.7 ± 0.1 c42.5 ± 0.7 a5.1 ± 0.1 a196 ± 16 a,b78.8 ± 0.7 a,b1.30 ± 0.10 a14.4 ± 0.5 a
280 min
30%6.3 ± 0.2 b,c38.5 ± 0.7 a,b5.1 ± 0.1 a183 ± 9 b79.2 ± 0.3 a,b1.14 ± 0.16 a14.2 ± 0.1 a
50%5.9 ± 0.1 b,c39.5 ± 0.7 a,b5.2 ± 0.1 a186 ± 10 b79.2 ± 0.2 a,b1.11 ± 0.02 a14.4 ± 0.3 a
70%5.5 ± 0.5 c42.0 ± 0.0 a,b5.0 ± 0.1 a197 ± 16 a,b79.1 ± 0.1 a,b1.20 ± 0.04 a14.9 ± 0.2 a
1 Different letters within the same column indicate significant differences for the results for each parameter at p < 0.05 (Tukey–Kramer test).
Table 10. Crumb structure parameters and bread scores of the control and breads containing ferment prepared during varying fermentation times 1.
Fermentation Time and
Inclusion Level
Crumb StructureBread Crumb Scores
CD 2 (mm)NC/SA 2CWT 2CC 2ColourTextureSoftnessResilienceStrength
Control2.06 ± 0.05 c0.59 ± 0.01 a0.46 ± 0.00 b0.77 ± 0.00 a10.0 ± 0.010.0 ± 0.010.0 ± 0.010.0 ± 0.010.0 ± 0.0
90 min
30%2.38 ± 0.21 a,b0.52 ± 0.04 b0.49 ± 0.02 a0.76 ± 0.01 a9.8 ± 0.49.8 ± 1.110.0 ± 0.010.0 ± 0.010.0 ± 0.0
50%2.21 ± 0.06 b,c0.54 ± 0.01 a,b0.48 ± 0.00 a,b0.77 ± 0.01 a9.8 ± 0.410.3 ± 0.410.5 ± 0.09.8 ± 0.410.0 ± 0.0
70%2.38 ± 0.02 a,b0.52 ± 0.01 b0.49 ± 0.00 a0.76 ± 0.00 a10.3 ± 0.410.5 ± 0.711.0 ± 0.79.3 ± 0.49.8 ± 0.4
150 min
30%2.31 ± 0.11 a–c0.53 ± 0.02 b0.49 ± 0.01 a,b0.77 ± 0.01 a10.0 ± 0.010.0 ± 0.010.0 ± 0.010.0 ± 0.010.0 ± 0.0
50%2.39 ± 0.13 a,b0.53 ± 0.02 b0.49 ± 0.01 a,b0.77 ± 0.00 a9.8 ± 0.49.8 ± 0.410.0 ± 0.010.0 ± 0.010.3 ± 0.4
70%2.30 ± 0.18 a,b0.53 ± 0.03 b0.49 ± 0.02 a0.77 ± 0.01 a9.8 ± 0.49.8 ± 0.410.3 ± 0.49.5 ± 0.09.8 ± 0.4
210 min
30%2.42 ± 0.17 a,b0.52 ± 0.02 b0.49 ± 0.01 a0.76 ± 0.01 a10.0 ± 0.010.0 ± 0.010.3 ± 0.410.0 ± 0.010.0 ± 0.0
50%2.57 ± 0.16 a0.51 ± 0.02 b0.50 ± 0.01 a0.76 ± 0.01 a9.8 ± 0.49.5 ± 0.710.3 ± 0.410.0 ± 0.010.0 ± 0.0
70%2.52 ± 0.09 a,b0.51 ± 0.01 b0.50 ± 0.01 a0.76 ± 0.01 a9.8 ± 0.49.8 ± 0.410.5 ± 0.79.5 ± 0.09.8 ± 0.4
280 min
30%2.44 ± 0.12 a,b0.51 ± 0.03 b0.50 ± 0.02 a0.76 ± 0.01 a10.0 ± 0.09.8 ± 1.110.5 ± 0.710.0 ± 0.010.0 ± 0.0
50%2.44 ± 0.11 a,b0.51 ± 0.02 b0.49 ± 0.01 a0.76 ± 0.01 a10.3 ± 0.410.0 ± 0.010.8 ± 0.49.5 ± 0.010.0 ± 0.0
70%2.42 ± 0.08 a,b0.52 ± 0.02 b0.49 ± 0.01 a0.77 ± 0.00 a9.5 ± 0.09.0 ± 0.011.0 ± 0.09.5 ± 0.09.8 ± 0.4
1 Different letters within the same column indicate significant differences for the results for each parameter at p < 0.05 (Tukey–Kramer test). 2 Abbreviations used: CD is cell diameter; NC/SA is number of cells per slice area; CWT is cell wall thickness; CC is cell contrast.
Table 11. Processing parameters, bread specific volume, crumb firmness and colour of the control and breads containing ferment prepared during varying fermentation temperatures 1.
Fermentation
Temperature and
Inclusion Level
Mixing
Time
(min)
Proof
Time
(min)
Specific
Volume
(cm3/g)
Crumb
Firmness
Force (g)
Crumb Colour
L*a*b*
Control6.8 ± 0.4 a37.9 ± 1.6 b5.0 ± 0.1 a209 ± 36 b–d78.7 ± 0.3 ab1.30 ± 0.11 a14.0 ± 0.2 e,f
30 °C
30%6.2 ± 0.2 a,b37.5 ± 0.7 a,b5.2 ± 0.1 a203 ± 23 c,d79.4 ± 0.6 a1.21 ± 0.09 a,b13.8 ± 0.5 f
50%5.6 ± 0.2 b,c35.5 ± 2.1 b5.2 ± 0.1 a209 ± 14 b–d79.6 ± 0.4 a1.12 ± 0.11 a,b14.2 ± 0.3 c–f
70%5.3 ± 0.4 b,c37.5 ± 3.5 a,b5.2 ± 0.1 a203 ± 17 c,d79.4 ± 0.5 a1.12 ± 0.08 a,b14.5 ± 0.3 a–e
35 °C
30%5.8 ± 0.4 b,c36.5 ± 2.1 b5.0 ± 0.1 a220 ± 26 a–d79.0 ± 0.3 a,b1.19 ± 0.15 a,b14.3 ± 0.2 b–f
50%5.4 ± 0.6 b,c36.5 ± 2.1 b5.2 ± 0.1 a220 ± 26 a–d79.6 ± 0.1 a1.05 ± 0.05 b14.3 ± 0.1 b–f
70%5.3 ± 0.3 b,c39.0 ± 4.2 a,b5.0 ± 0.1 a237 ± 32 a–c79.4 ± 0.1 a1.11 ± 0.04 a,b14.8 ± 0.2 a–c
40 °C
30%5.8 ± 0.3 b,c35.0 ± 1.4 b5.2 ± 0.1 a186 ± 14 d79.2 ± 0.2 a1.08 ± 0.05 b14.1 ± 0.1 d–f
50%5.5 ± 0.0 b,c38.5 ± 2.1 a,b5.1 ± 0.2 a193 ± 15 c,d79.4 ± 0.4 a1.05 ± 0.03 b14.6 ± 0.4 a–e
70%5.1 ± 0.1 b,c41.5 ± 0.7 a,b5.1 ± 0.1 a185 ± 11 d79.5 ± 0.1 a1.08 ± 0.06 a,b14.7 ± 0.2 a–d
45 °C
30%5.3 ± 0.4 b,c39.5 ± 3.5 a,b4.9 ± 0.1 a267 ± 29 a78.1 ± 0.7 b1.20 ± 0.13 a,b14.9 ± 0.1 a,b
50%5.1 ± 0.1 b,c43.5 ± 5.0 a,b4.8 ± 0.1 a256 ± 13 a,b79.2 ± 0.3 a1.08 ± 0.08 b14.7 ± 0.3 a–e
70%4.9 ± 0.2 c46.5 ± 5.0 a4.8 ± 0.0 a264 ± 36 a78.9 ± 0.2 a,b1.08 ± 0.04 b15.1 ± 0.3 a
1 Different letters within the same column indicate significant differences for the results for each parameter at p < 0.05 (Tukey–Kramer test).
Table 12. Crumb structure parameters and bread scores of the control and breads containing ferment prepared during varying fermentation temperatures 1.
Fermentation Temperature and
Inclusion Level
Crumb StructureBread Crumb Scores
CD 2 (mm)NC/SA 2CWT 2CC 2ColourTextureSoftnessResilienceStrength
Control2.37 ± 0.10 a0.51 ± 0.02 b0.49 ± 0.01 a0.76 ± 0.01 a10.0 ± 0.010.0 ± 0.010.0 ± 0.010.0 ± 0.010.0 ± 0.0
30 °C
30%2.34 ± 0.07 a0.53 ± 0.02 a,b0.48 ± 0.01 a0.77 ± 0.00 a10.0 ± 0.09.8 ± 1.110.0 ± 0.010.0 ± 0.09.5 ± 0.7
50%2.30 ± 0.07 a0.53 ± 0.02 a,b0.48 ± 0.01 a0.77 ± 0.00 a10.0 ± 0.710.0 ± 0.710.8 ± 0.410.0 ± 0.08.5 ± 2.1
70%2.28 ± 0.05 a0.53 ± 0.01 a,b0.48 ± 0.00 a0.77 ± 0.00 a10.0 ± 0.710.3 ± 0.411.0 ± 0.09.3 ± 0.47.8 ± 2.5
35 °C
30%2.24 ± 0.15 a0.55 ± 0.02 a,b0.48 ± 0.01 a0.77 ± 0.00 a10.0 ± 0.010.3 ± 0.410.3 ± 0.410.0 ± 0.010.0 ± 0.0
50%2.33 ± 0.06 a0.54 ± 0.01 a,b0.48 ± 0.00 a0.77 ± 0.00 a11.0 ± 0.710.3 ± 0.410.8 ± 0.49.5 ± 0.79.8 ± 0.4
70%2.41 ± 0.32 a0.53 ± 0.05 a,b0.49 ± 0.02 a0.77 ± 0.01 a10.8 ± 0.410.0 ± 0.711.0 ± 0.79.3 ± 0.49.0 ± 0.0
40 °C
30%2.36 ± 0.05 a0.52 ± 0.01 a,b0.49 ± 0.00 a0.76 ± 0.00 a10.3 ± 0.410.3 ± 0.410.3 ± 0.410.0 ± 0.010.0 ± 0.0
50%2.33 ± 0.04 a0.53 ± 0.01 a,b0.49 ± 0.00 a0.77 ± 0.01 a10.0 ± 1.410.5 ± 0.010.8 ± 0.49.8 ± 0.48.3 ± 1.8
70%2.49 ± 0.05 a0.51 ± 0.01 b0.50 ± 0.01 a0.77 ± 0.01 a10.5 ± 0.79.3 ± 0.411.0 ± 0.09.5 ± 0.08.0 ± 1.4
45 °C
30%2.19 ± 0.23 a0.58 ± 0.05 a0.47 ± 0.02 a0.77 ± 0.01 a10.0 ± 0.010.0 ± 0.010.0 ± 0.010.0 ± 0.010.0 ± 0.0
50%2.34 ± 0.10 a0.54 ± 0.01 a,b0.49 ± 0.01 a0.77 ± 0.00 a10.3 ± 1.110.5 ± 0.710.5 ± 0.010.0 ± 0.09.5 ± 0.7
70%2.35 ± 0.13 a0.54 ± 0.02 a,b0.48 ± 0.01 a0.77 ± 0.00 a9.8 ± 1.19.8 ± 1.110.8 ± 0.49.3 ± 0.49.0 ± 0.7
1 Different letters within the same column indicate significant differences for the results for each parameter at p < 0.05 (Tukey–Kramer test). 2 Abbreviations used: CD is cell diameter; NC/SA is number of cells per slice area; CWT is cell wall thickness; CC is cell contrast.
Publisher’s Note: MDPI stays neutral with regard to jurisdictional claims in published maps and institutional affiliations.

