
Effect of Boundary Conditions on the Mechanical Behavior of the Geogrid–Soil Interface


Abstract
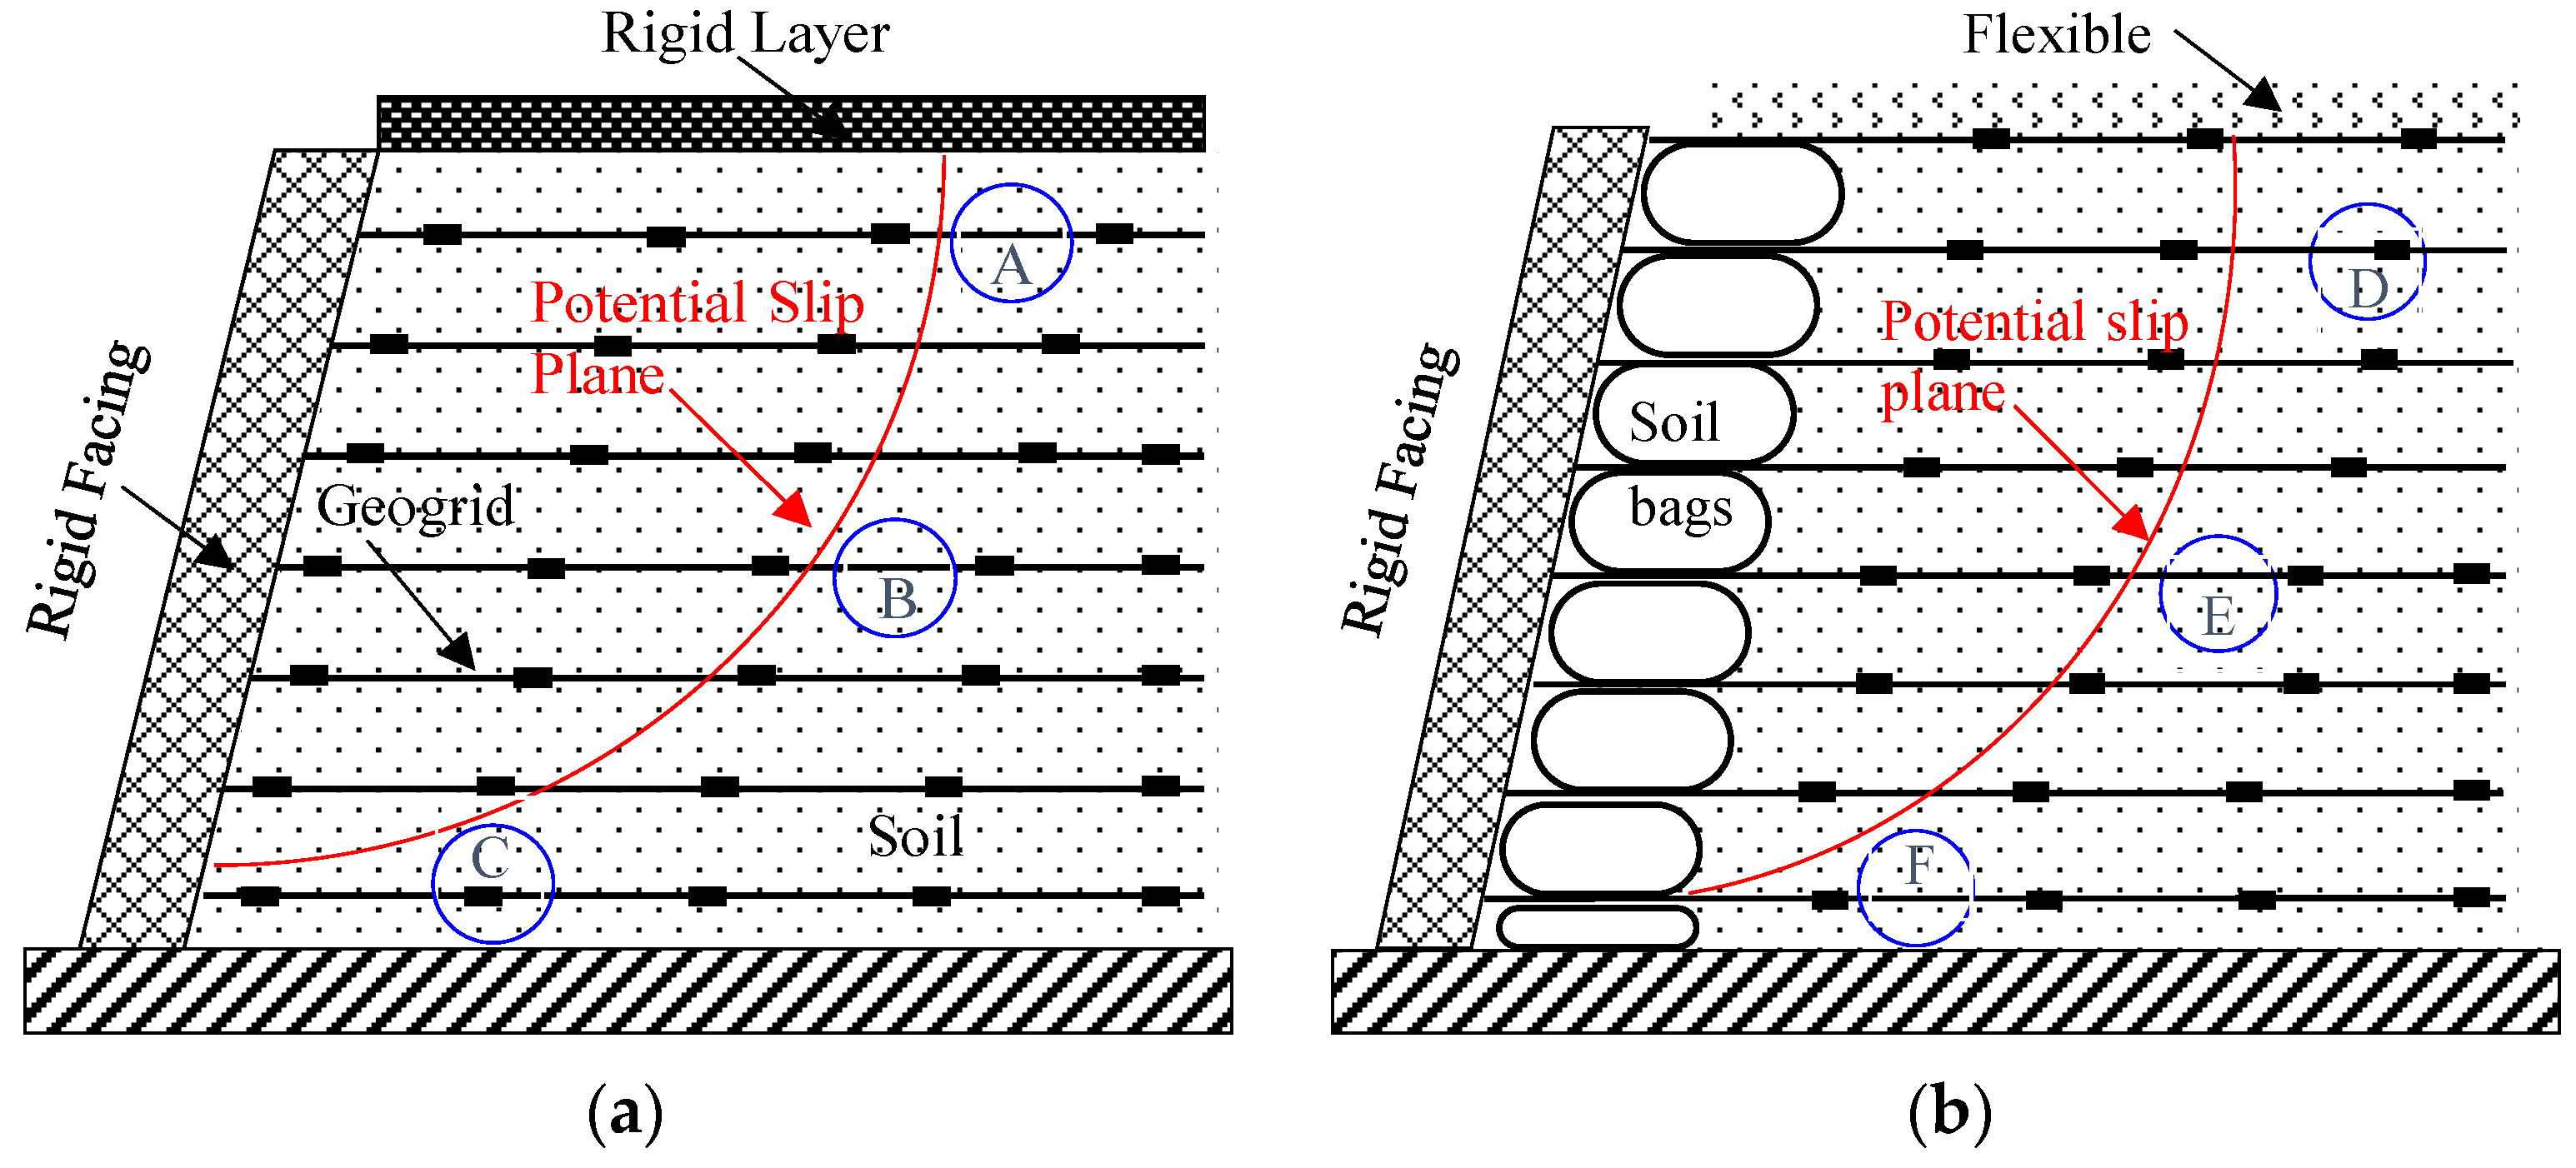
:1. Introduction
2. Materials and Methods
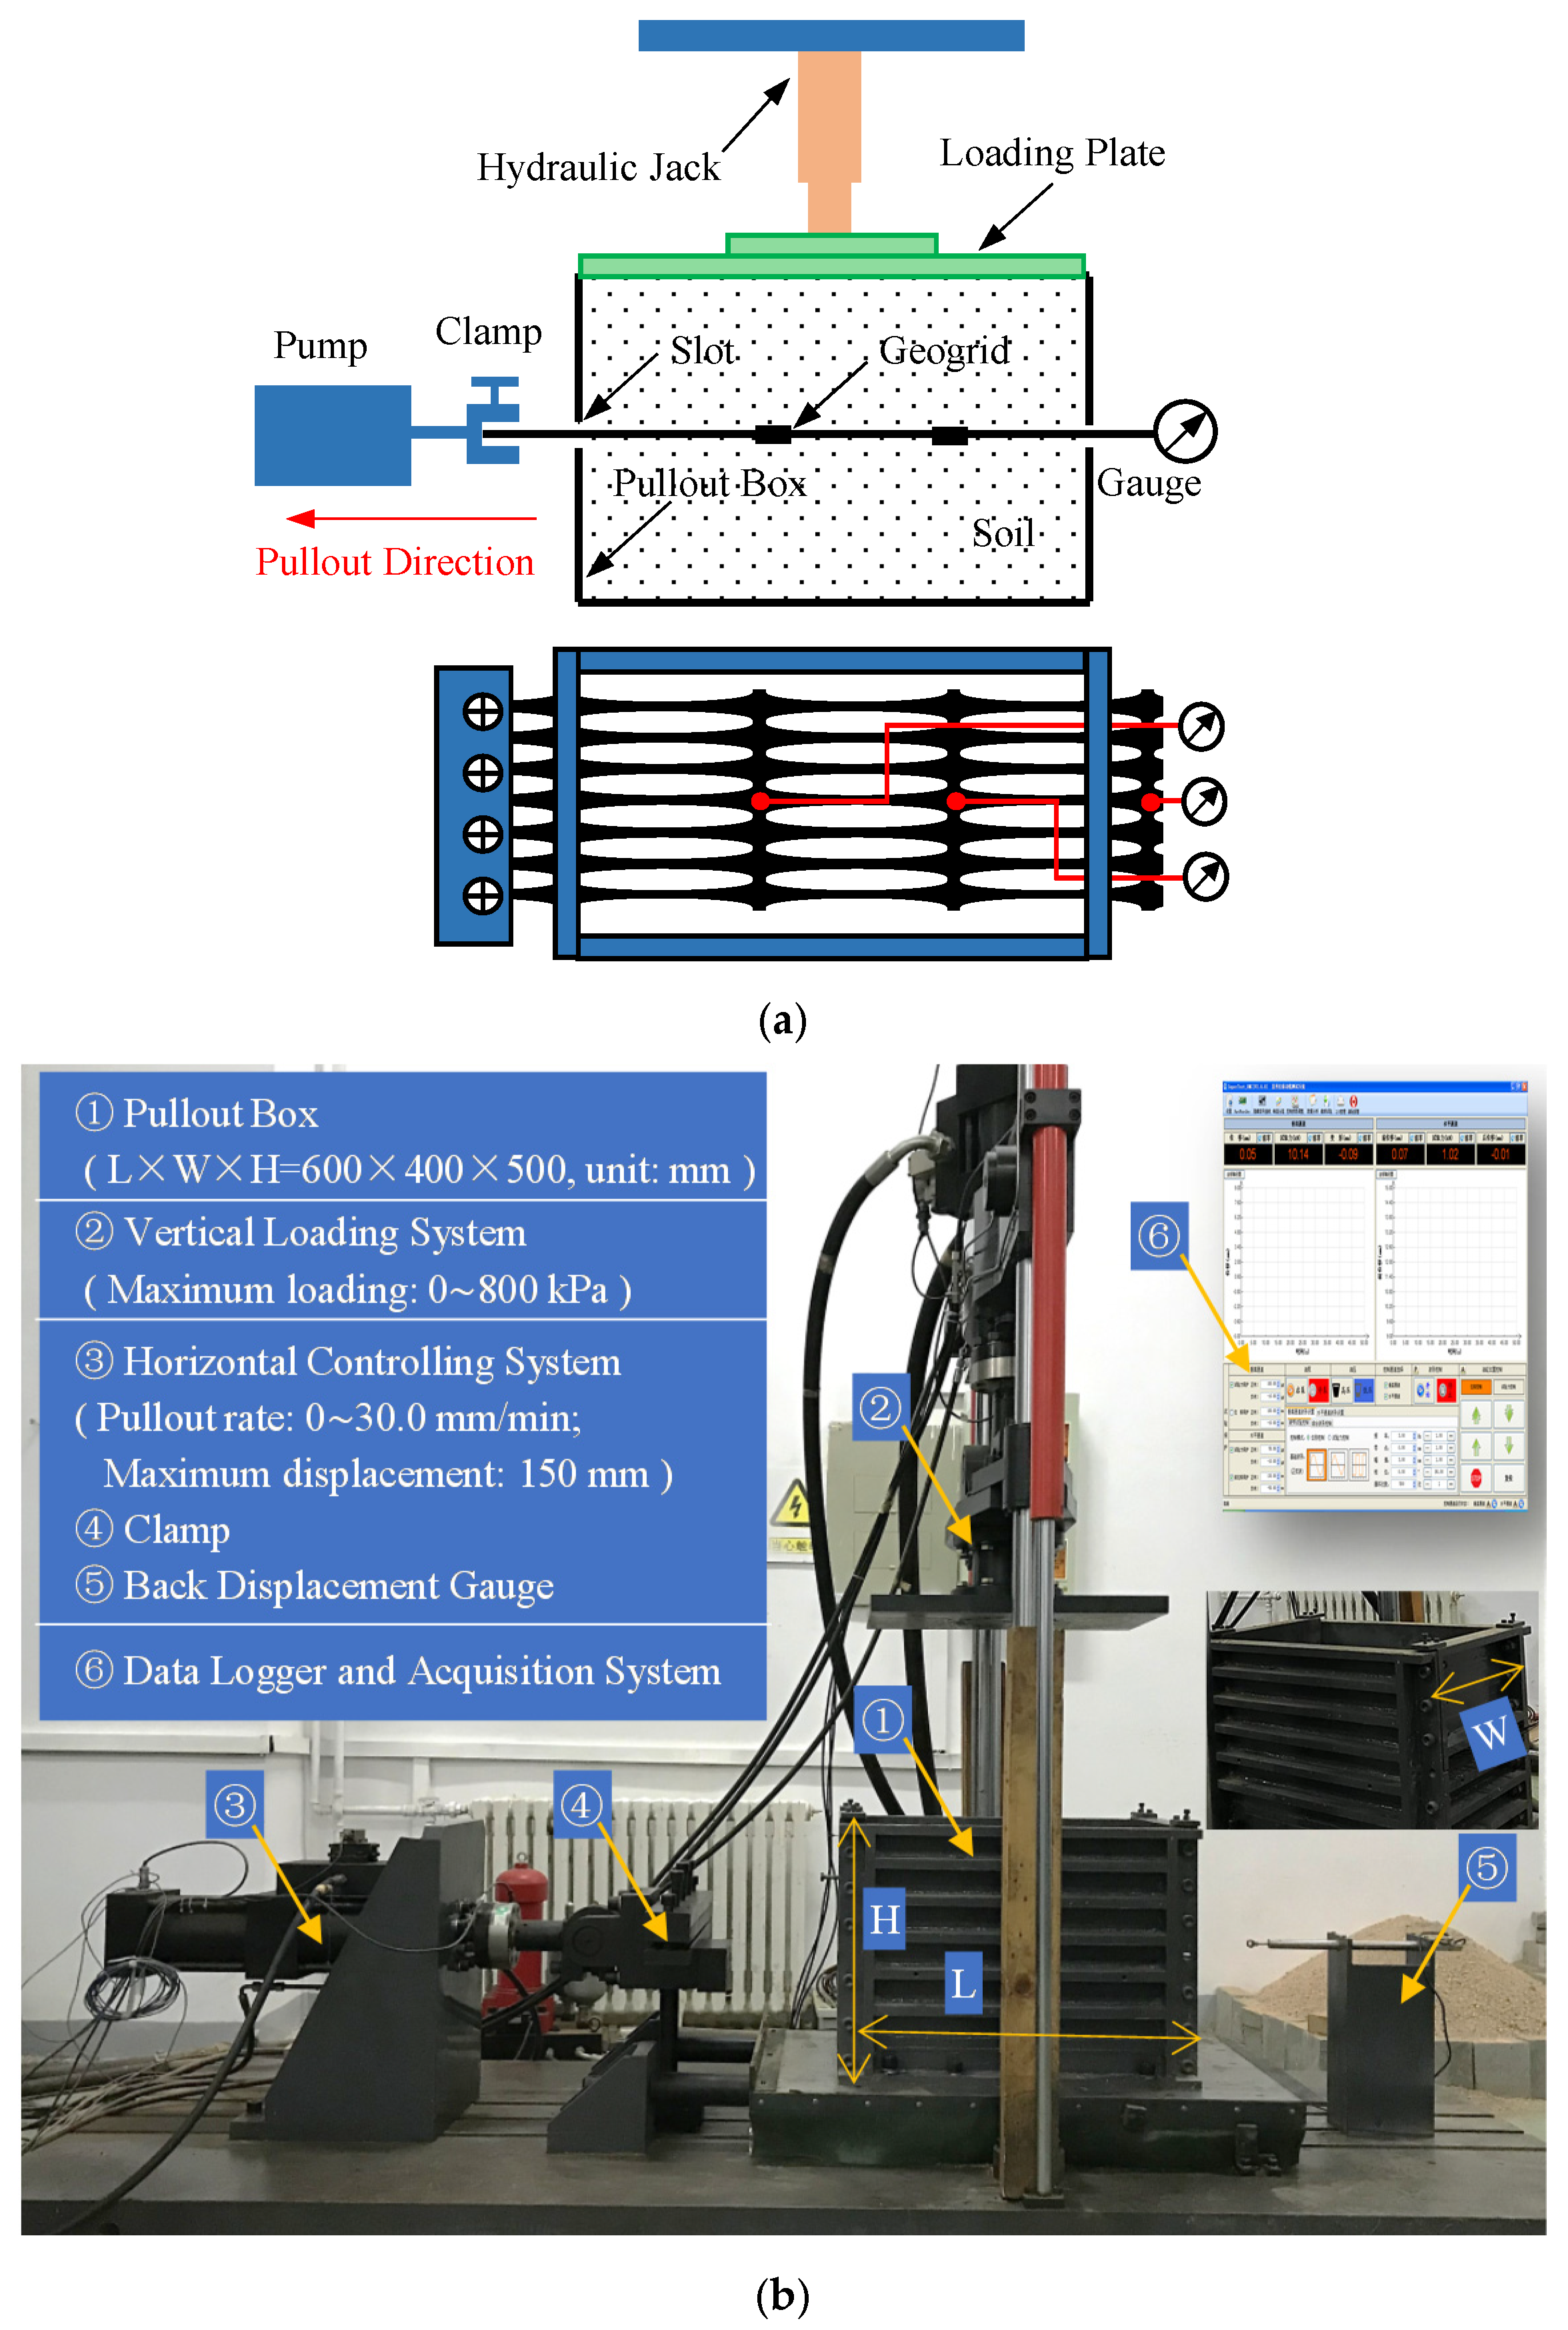
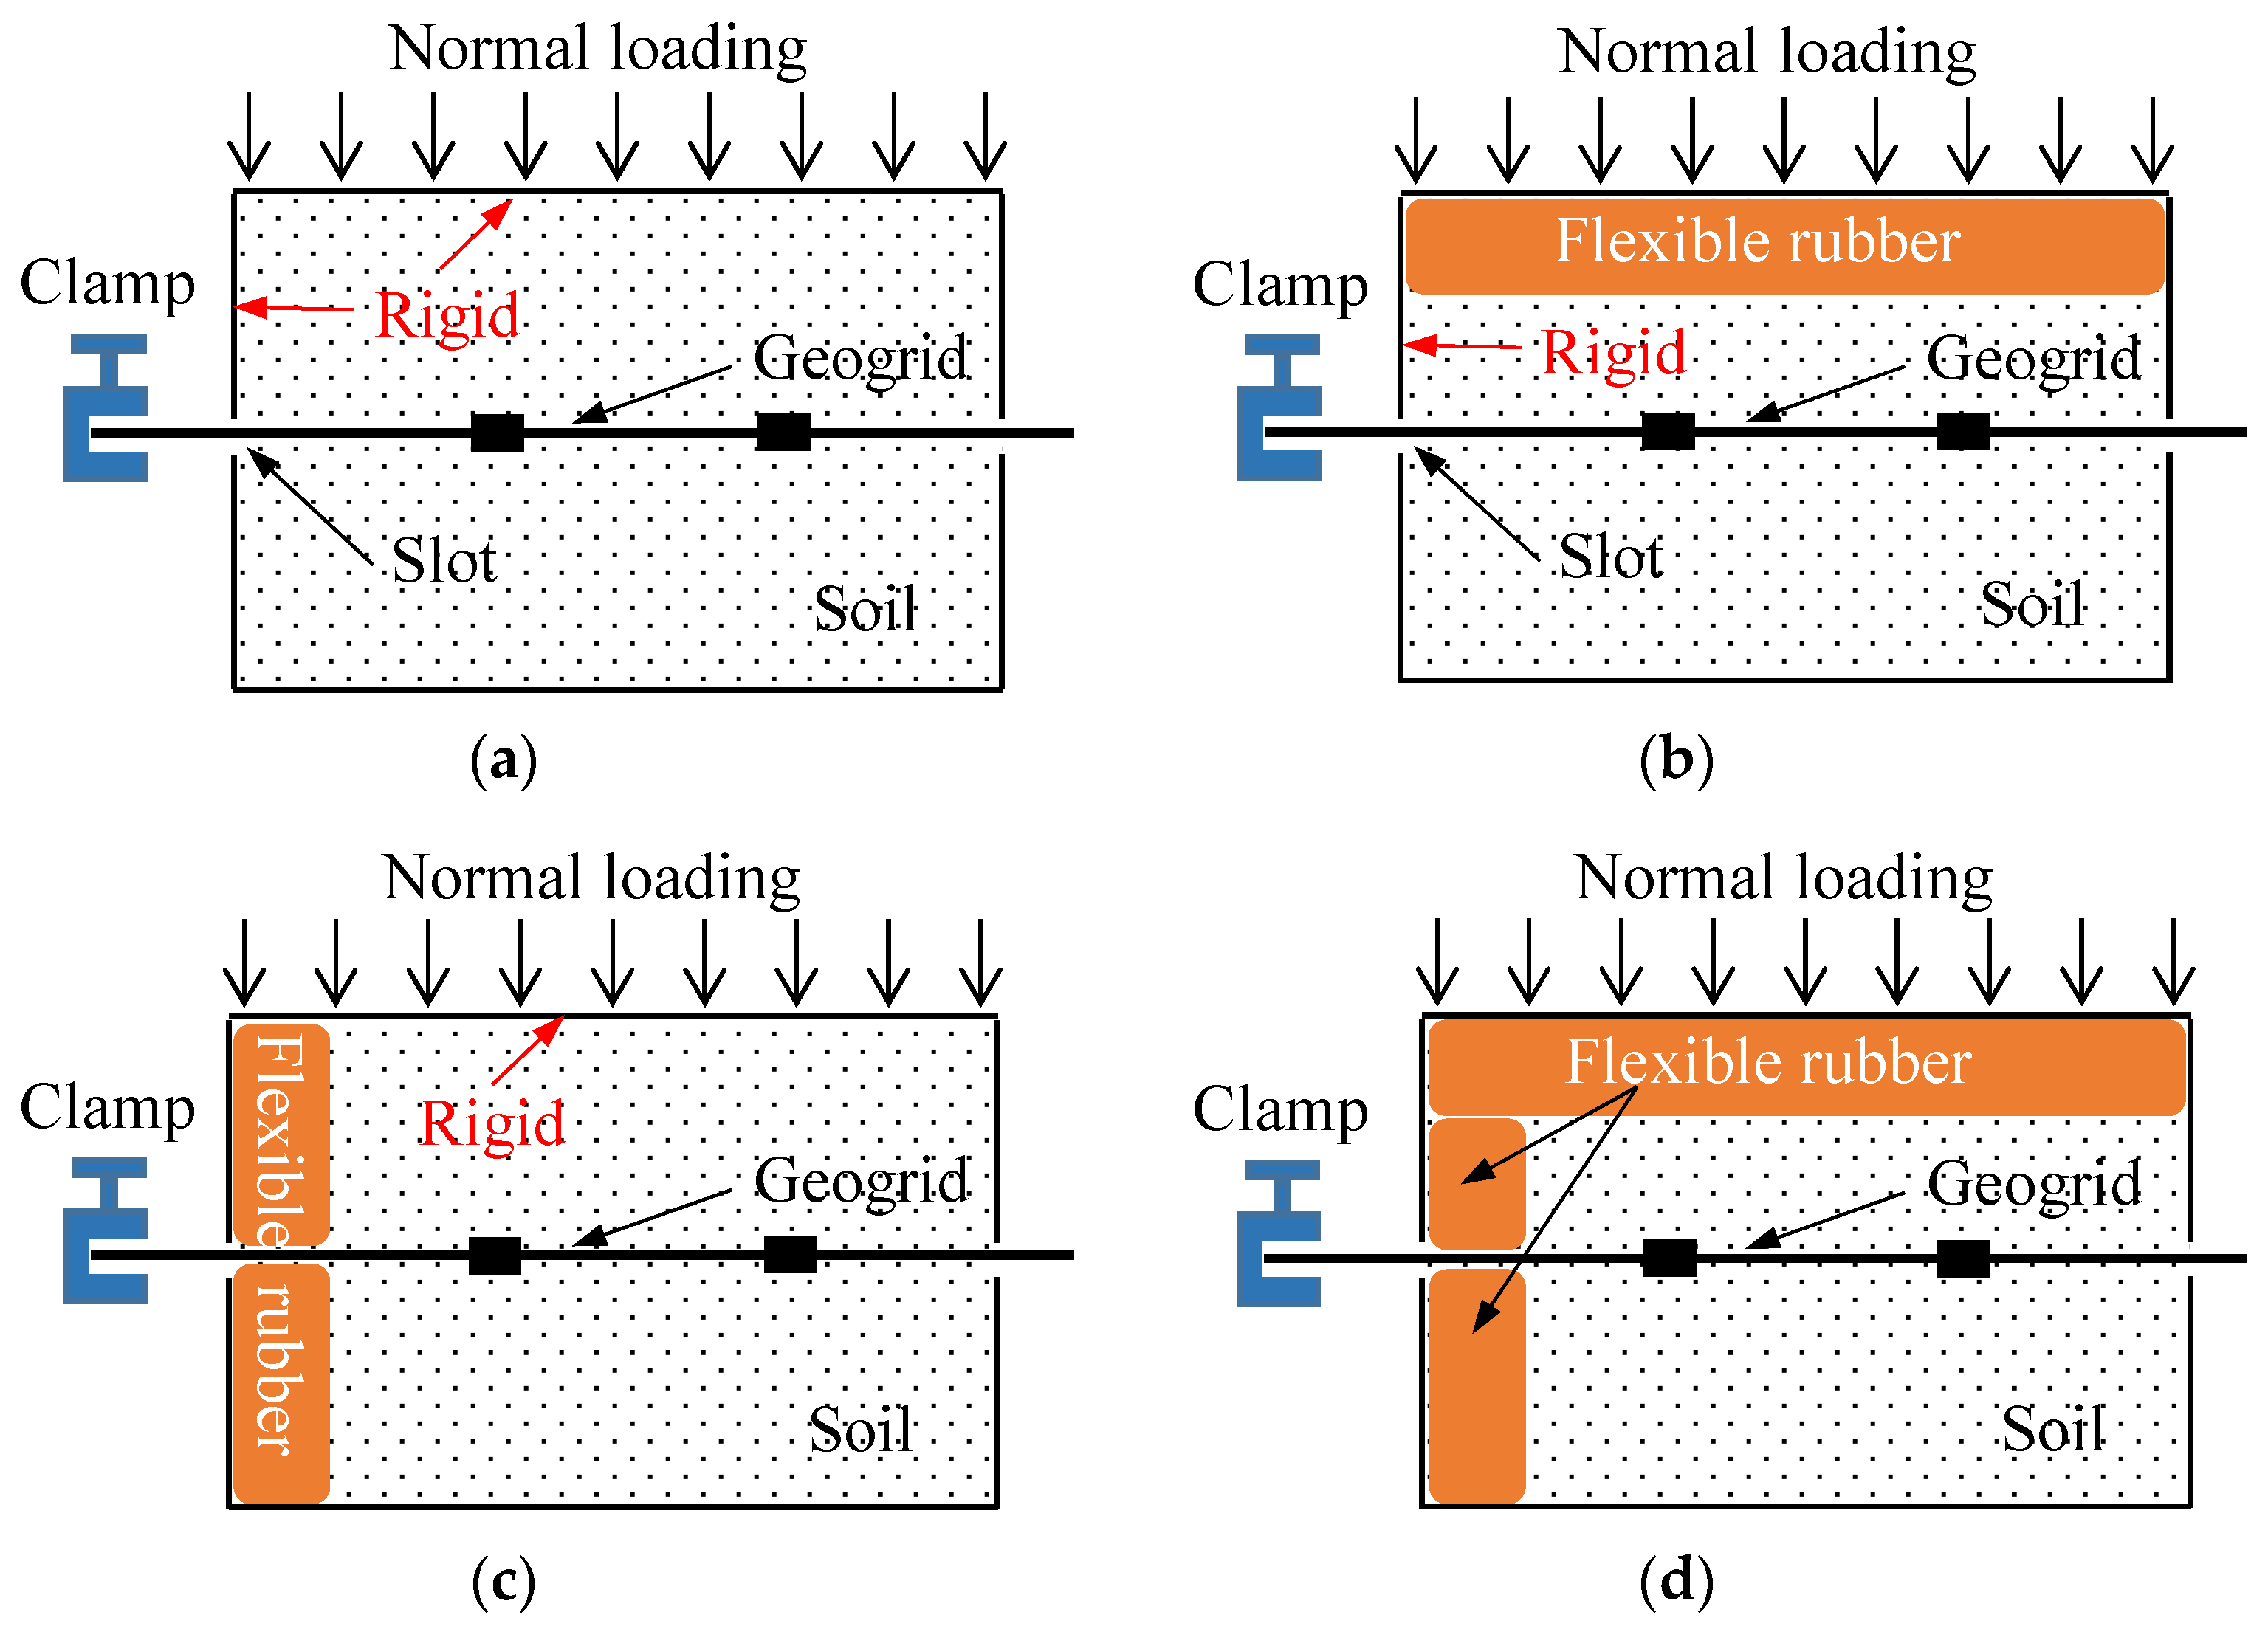
2.1. Pullout Equipment
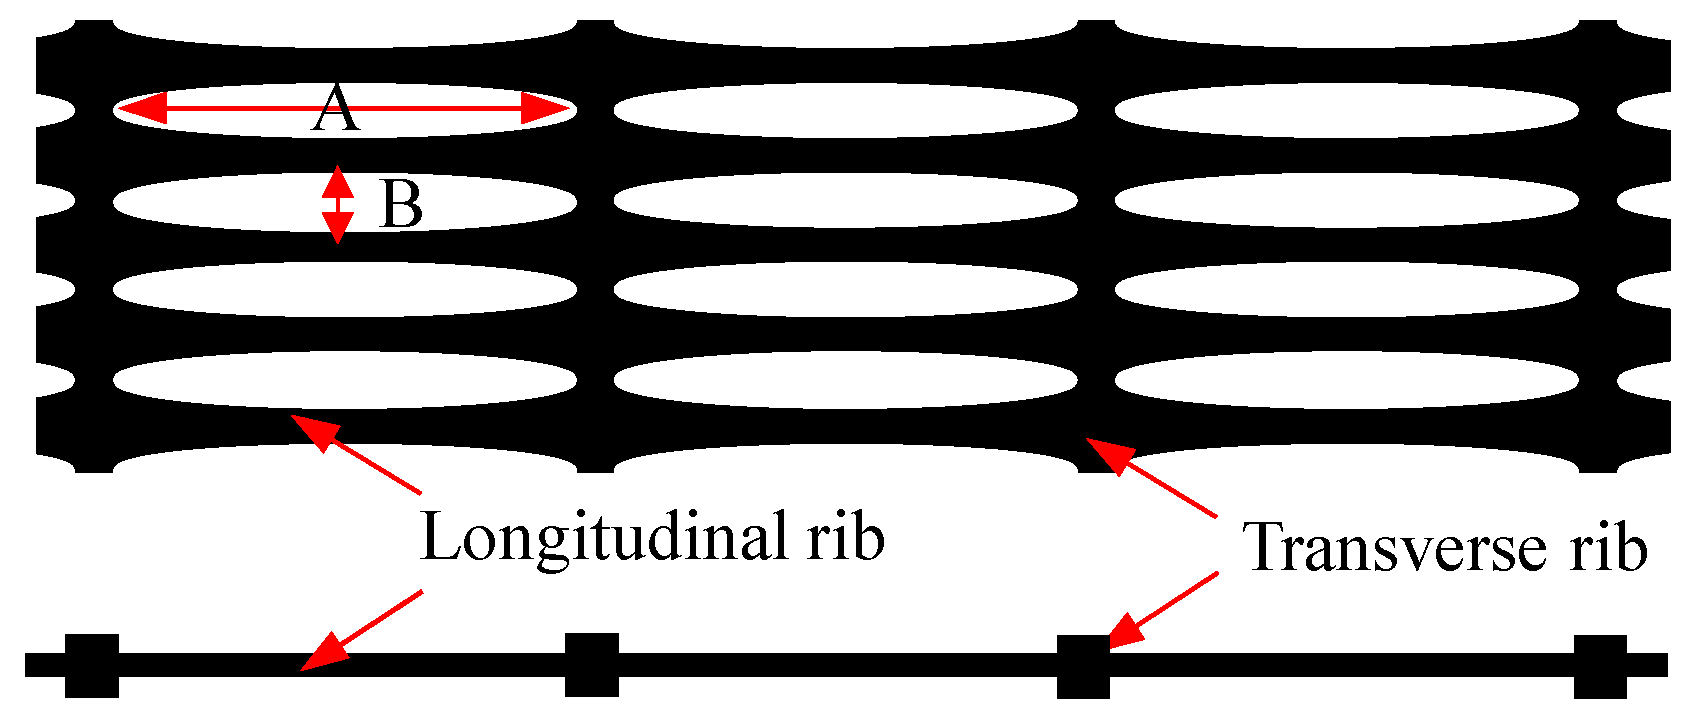
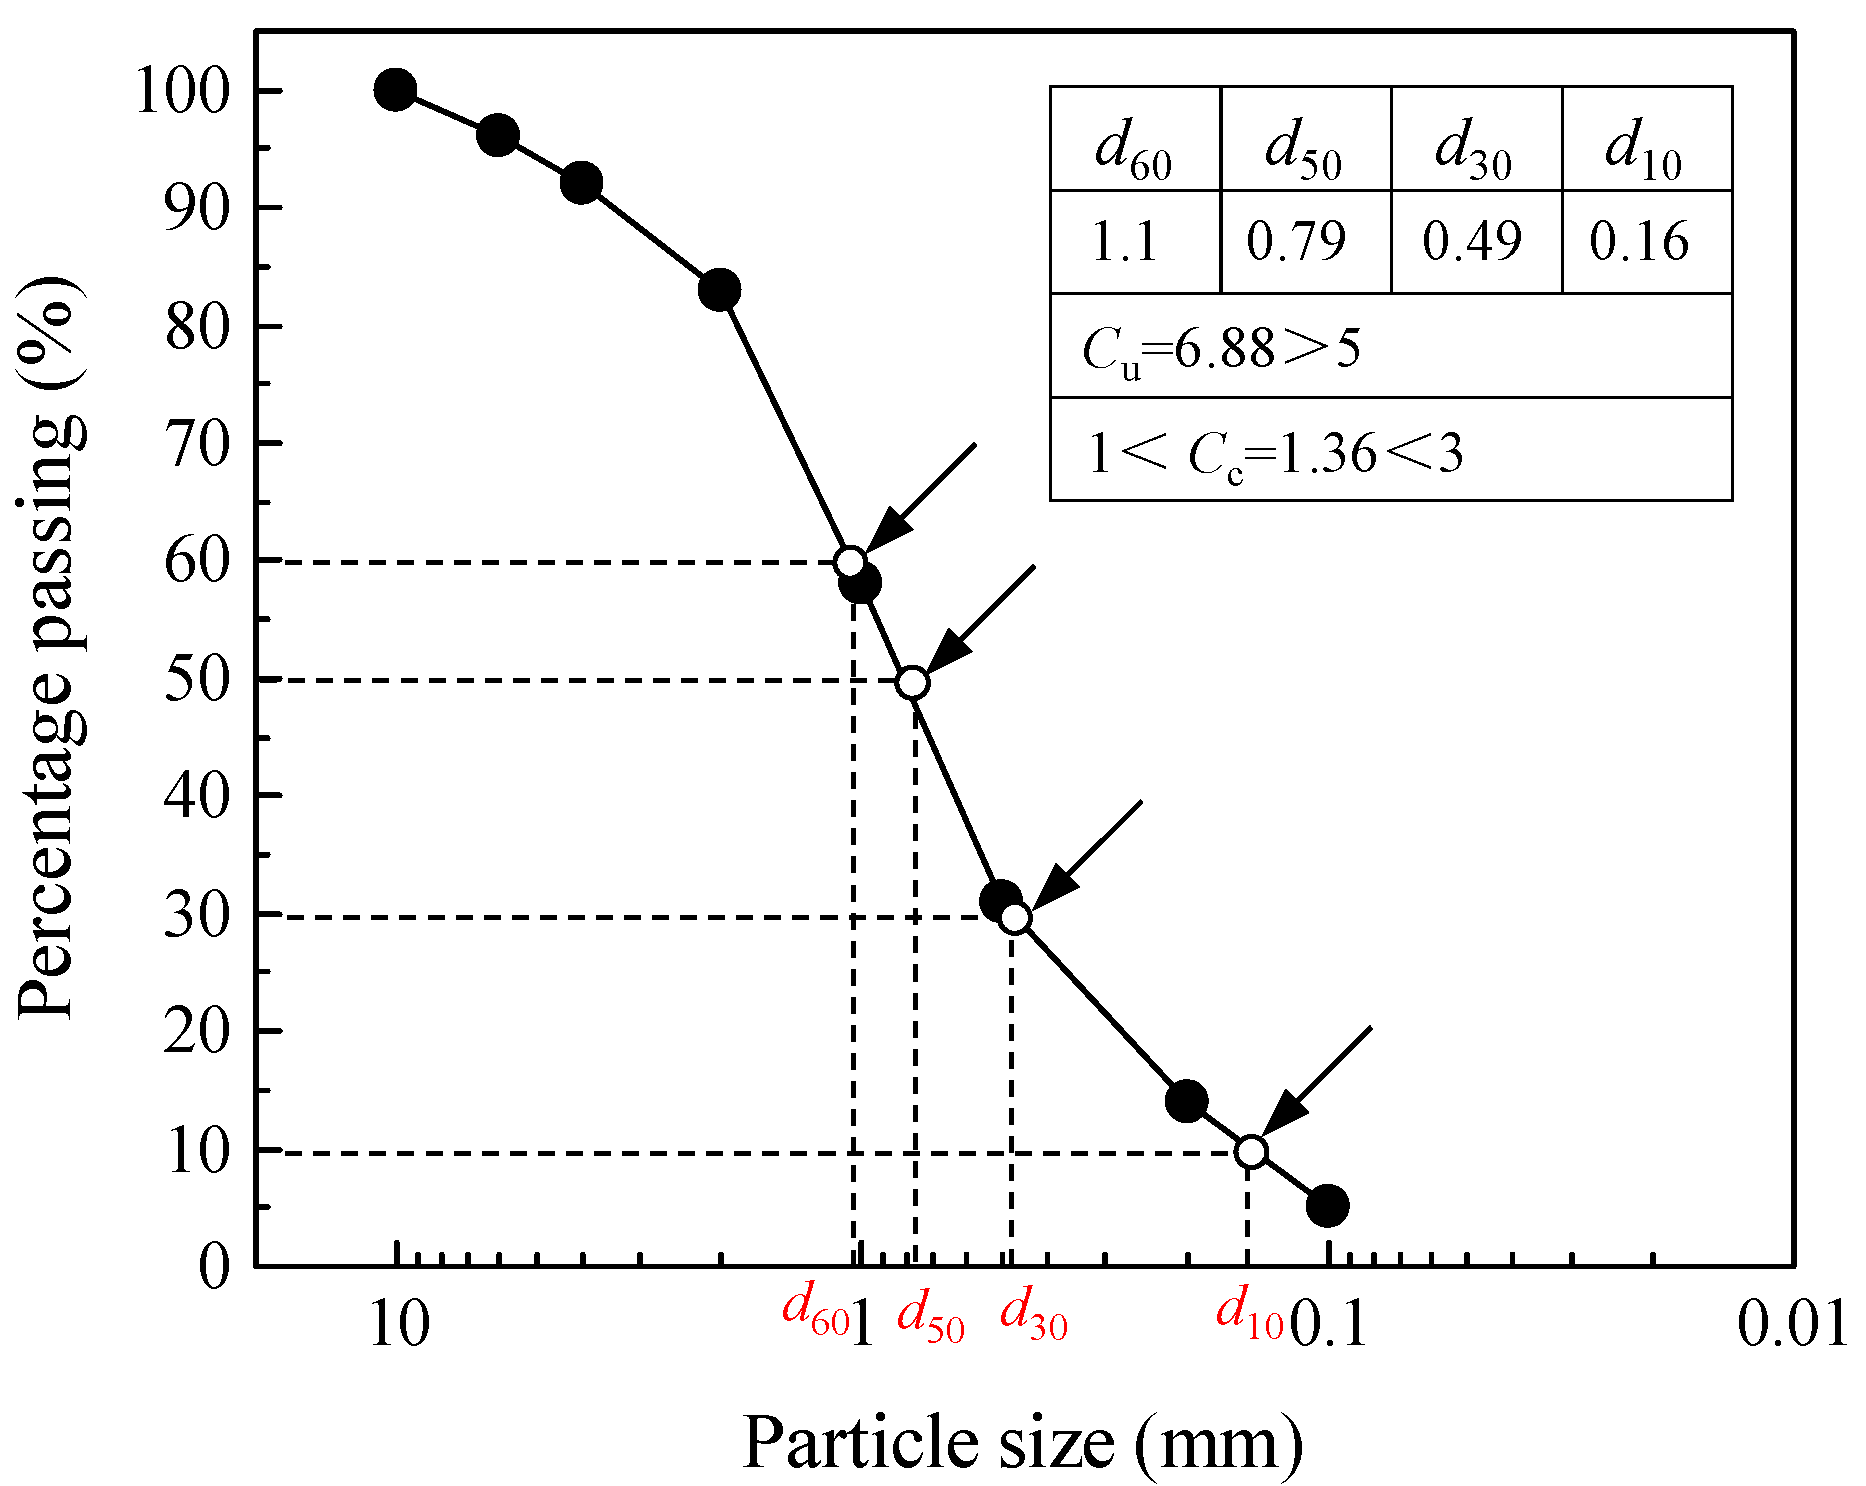
2.2. Tested Materials
2.3. Experimental Program
3. Results and Discussion
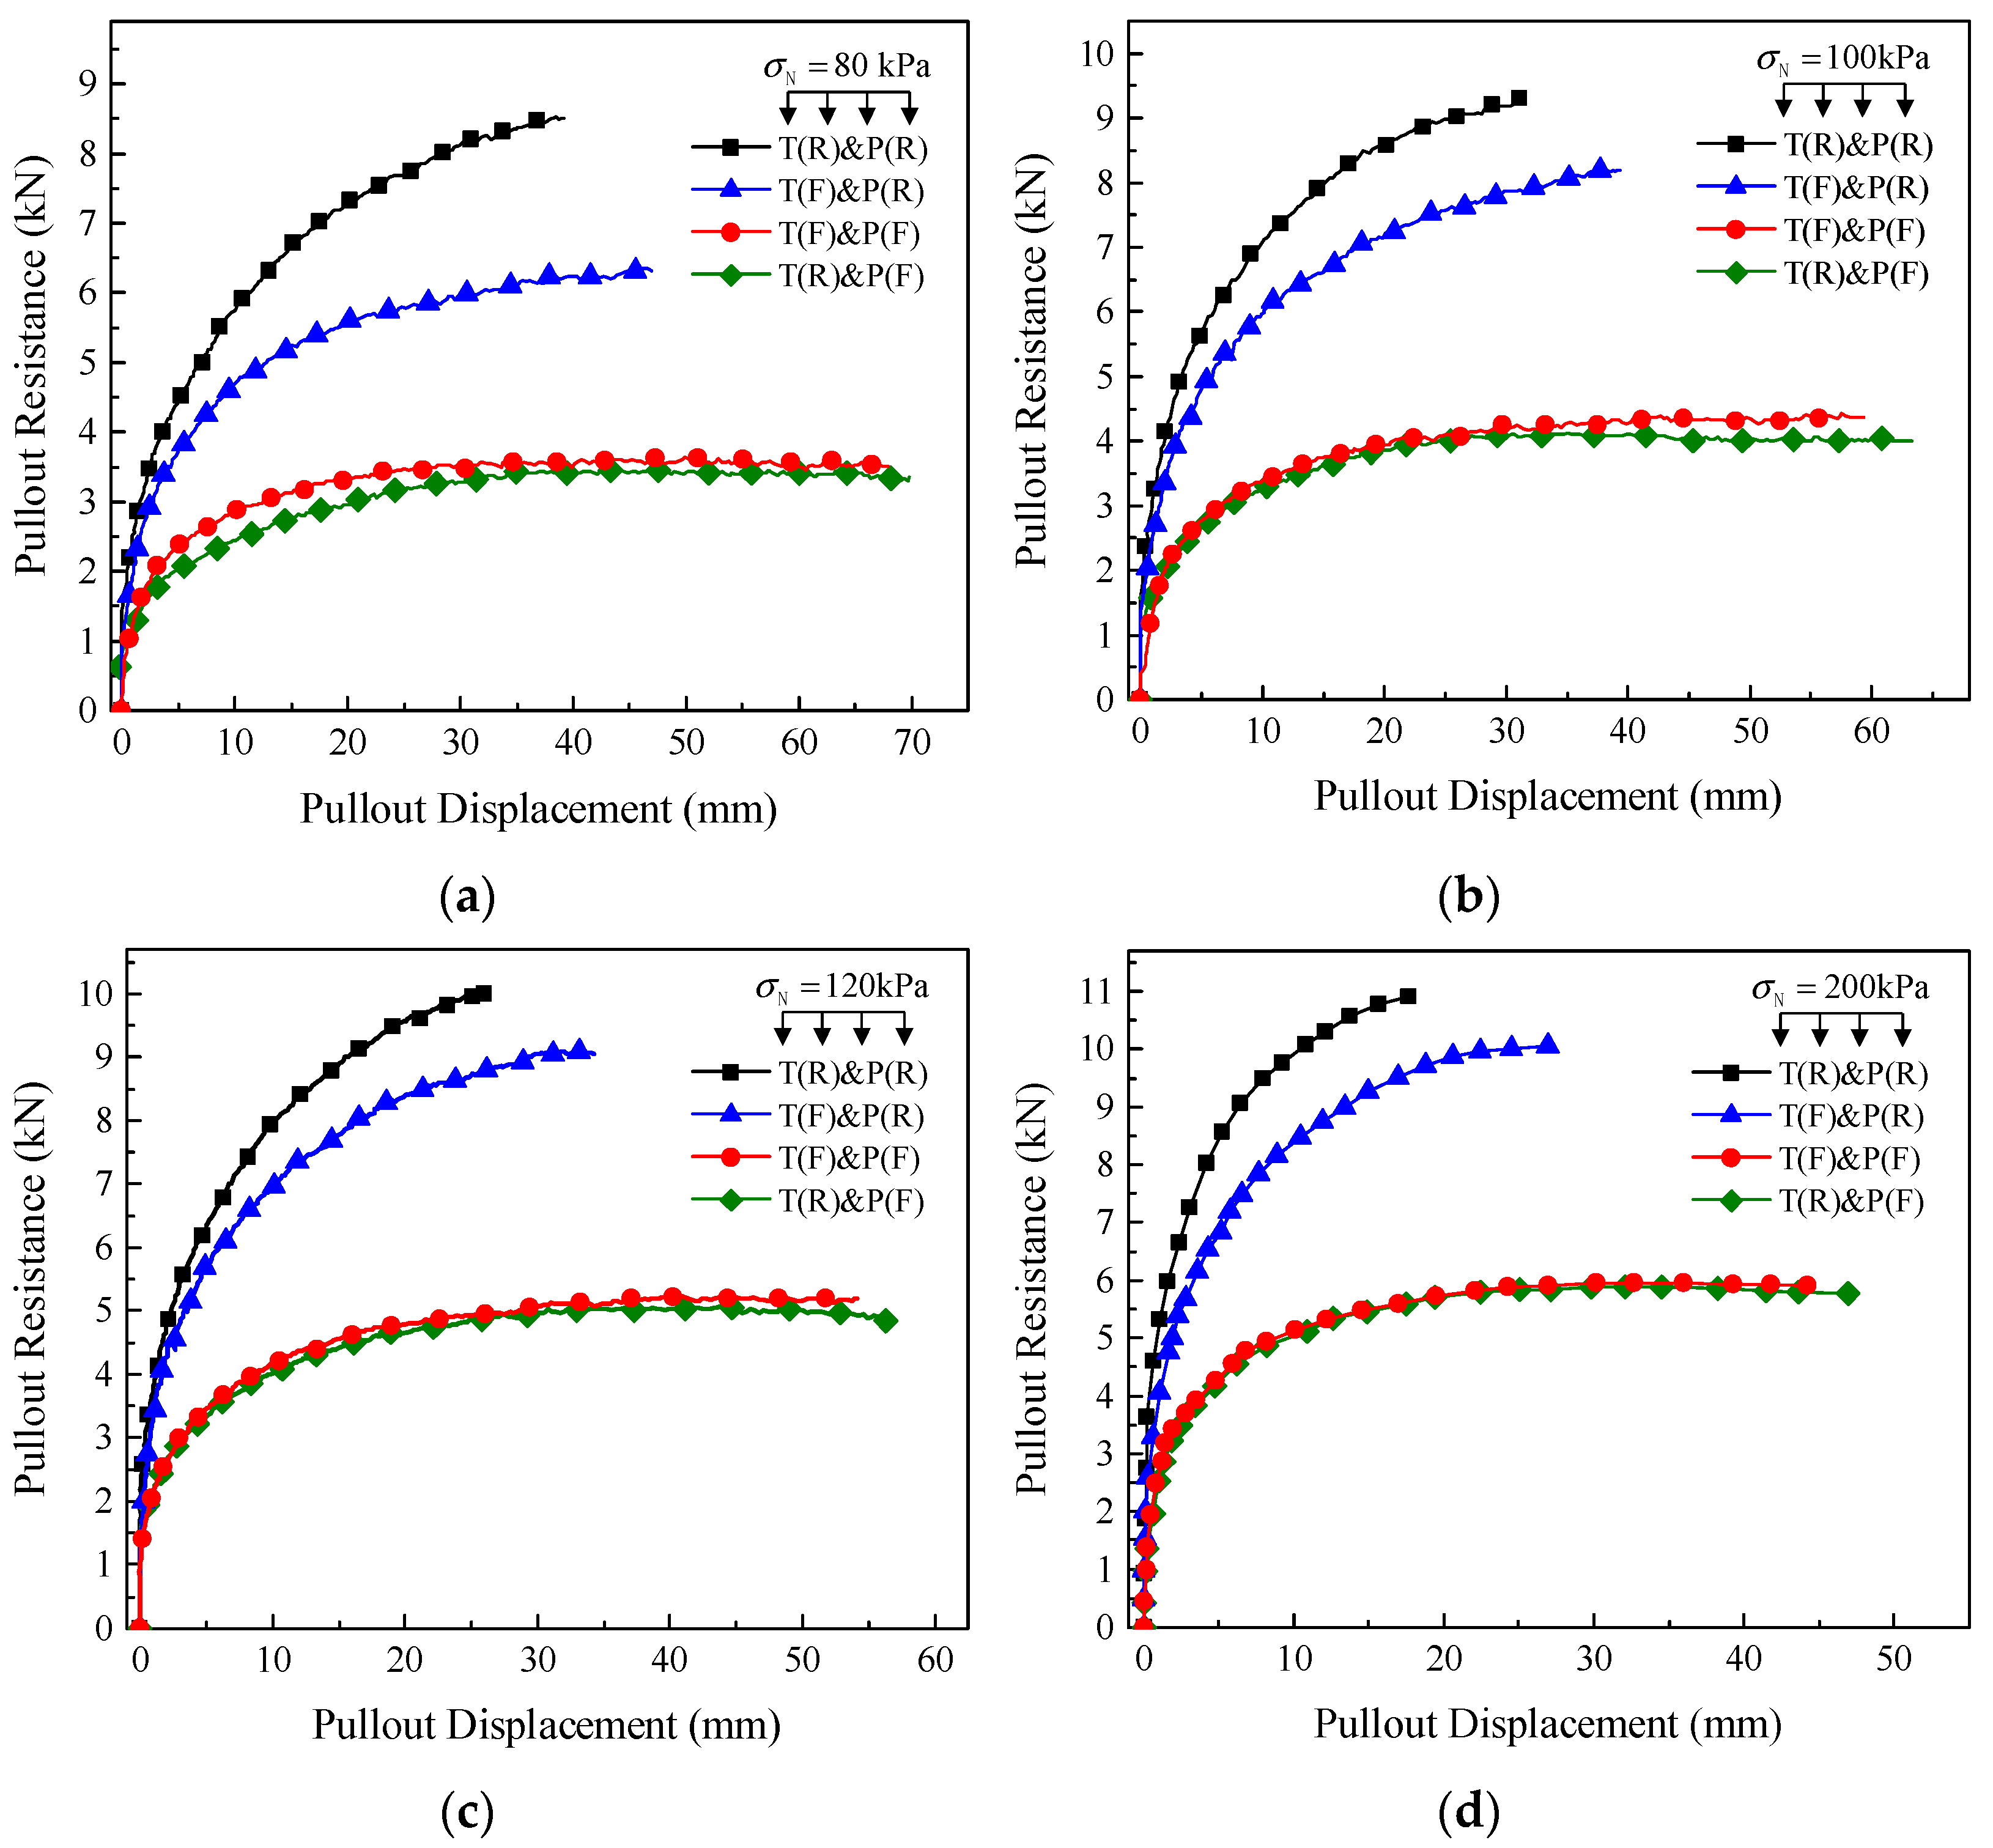
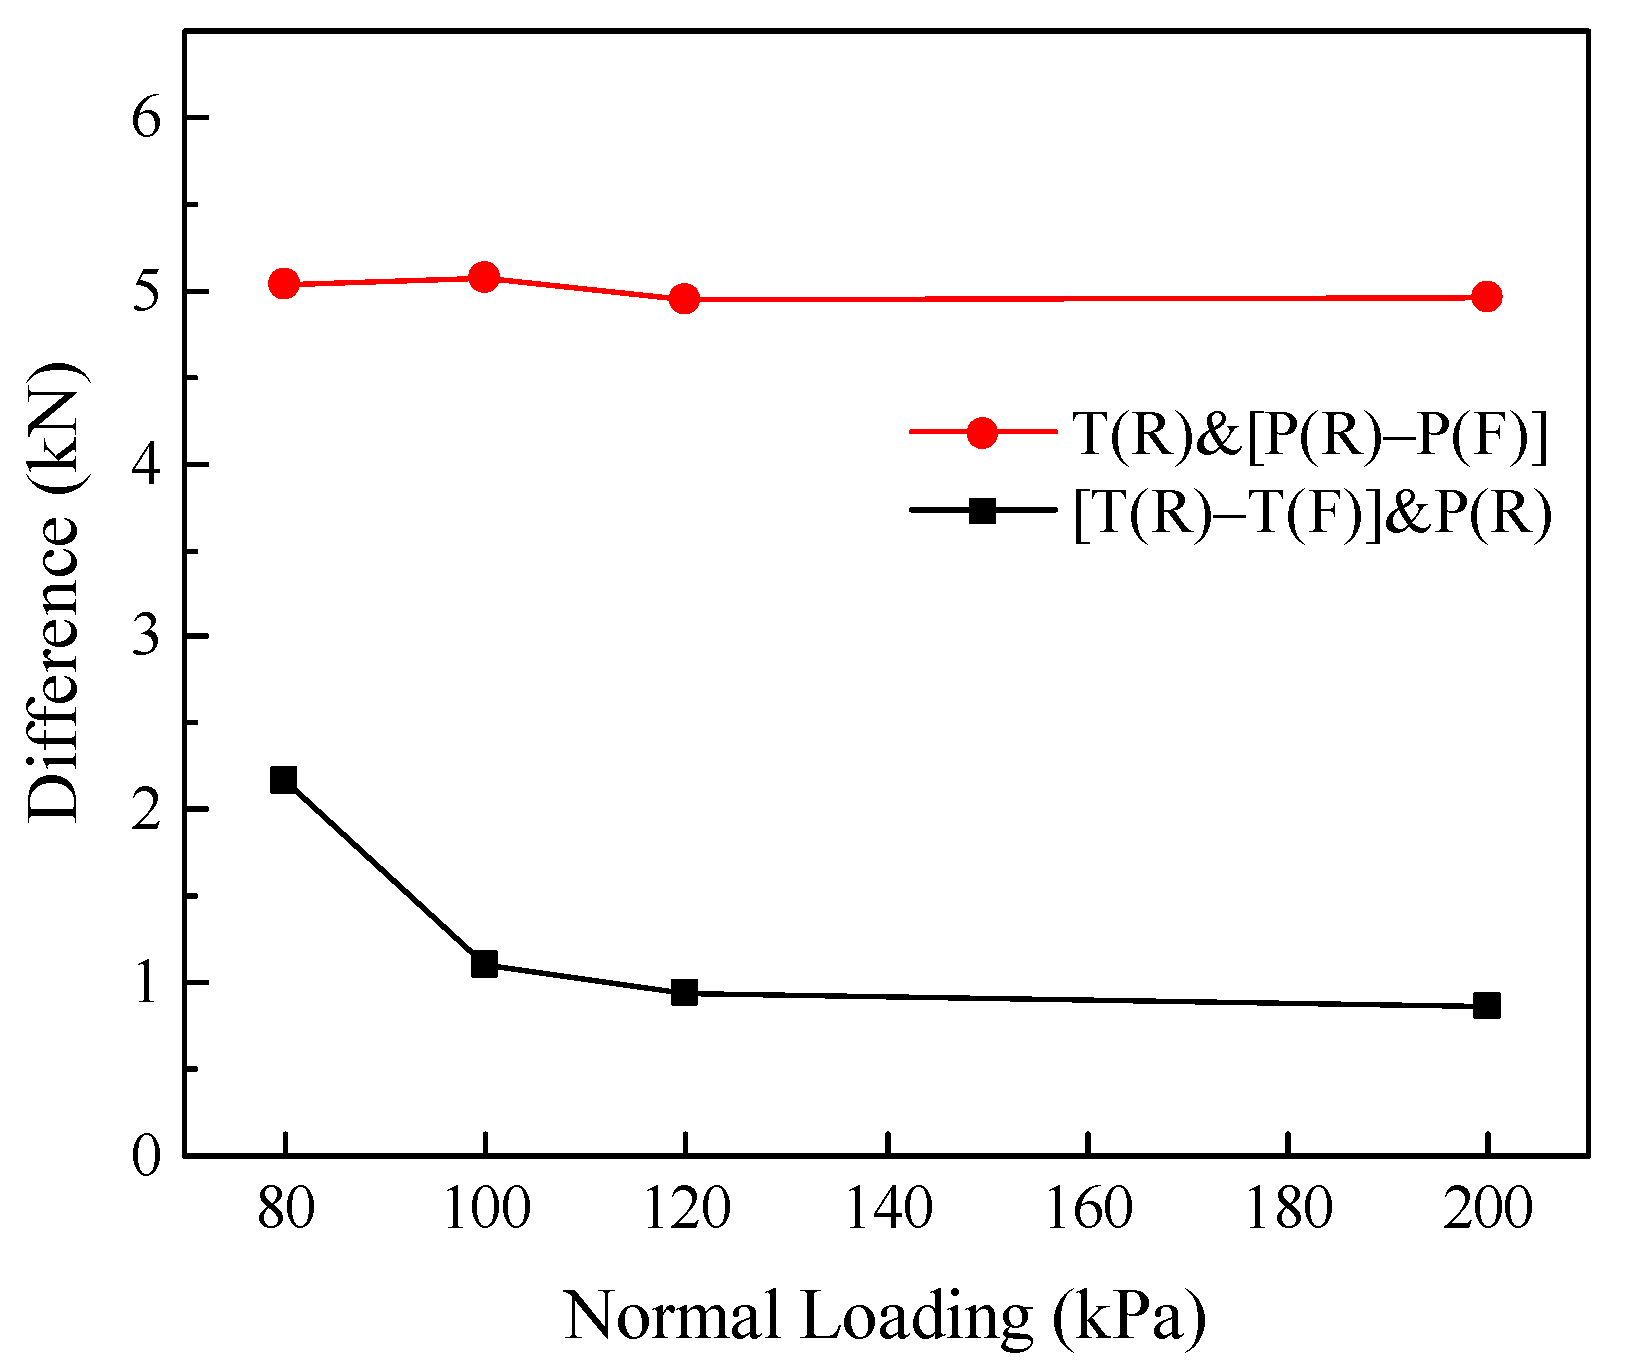
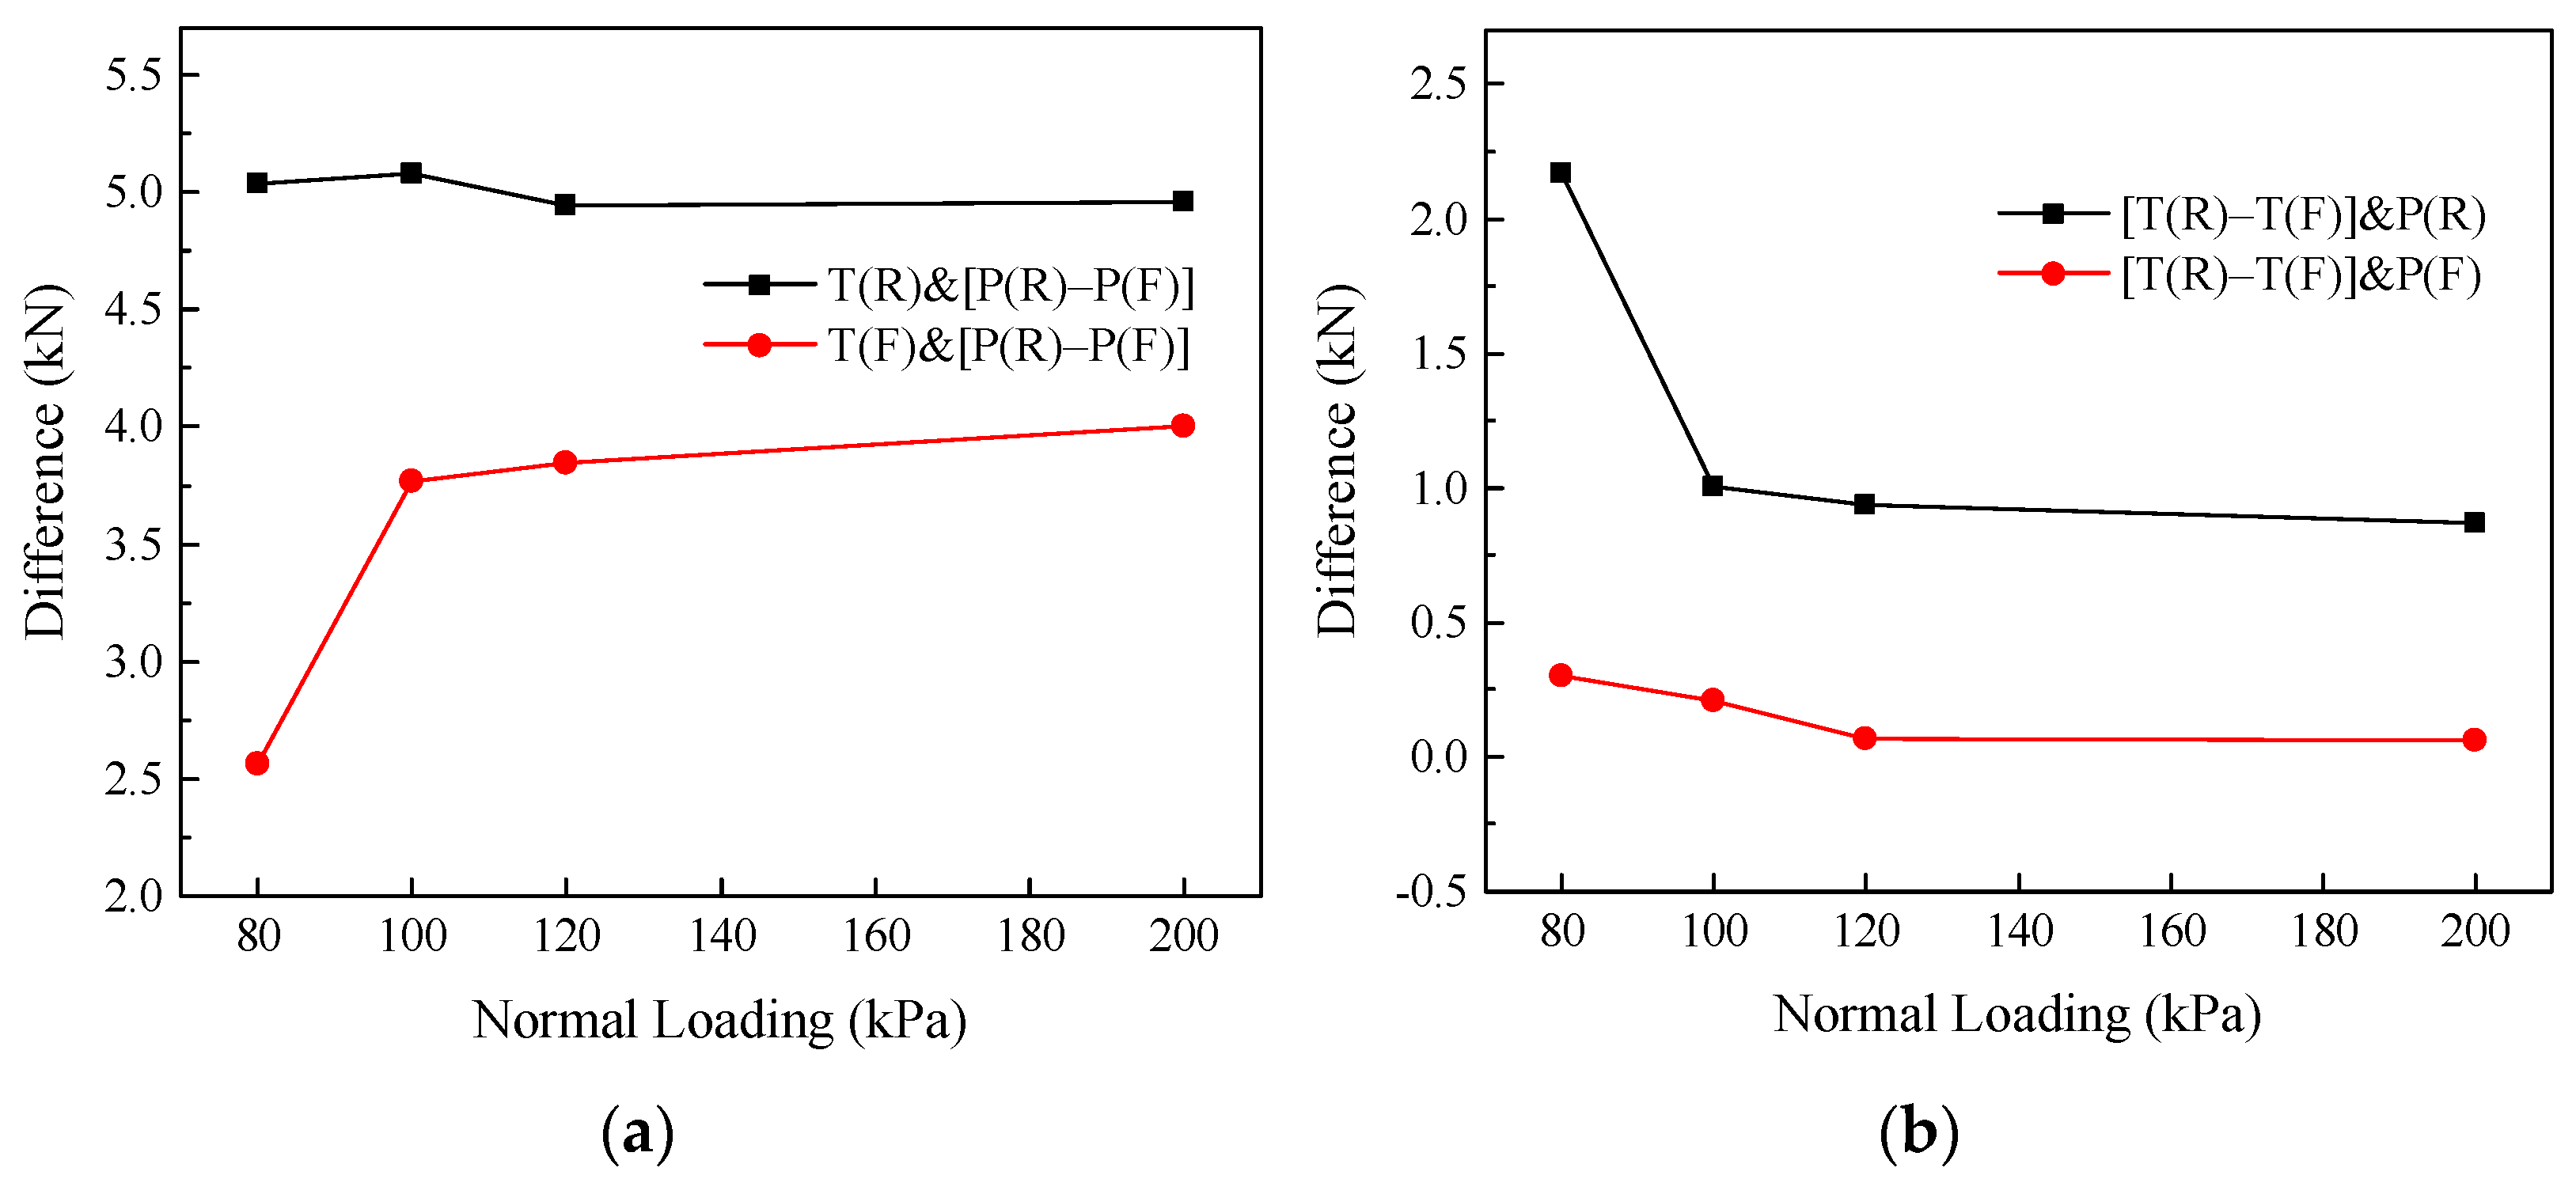
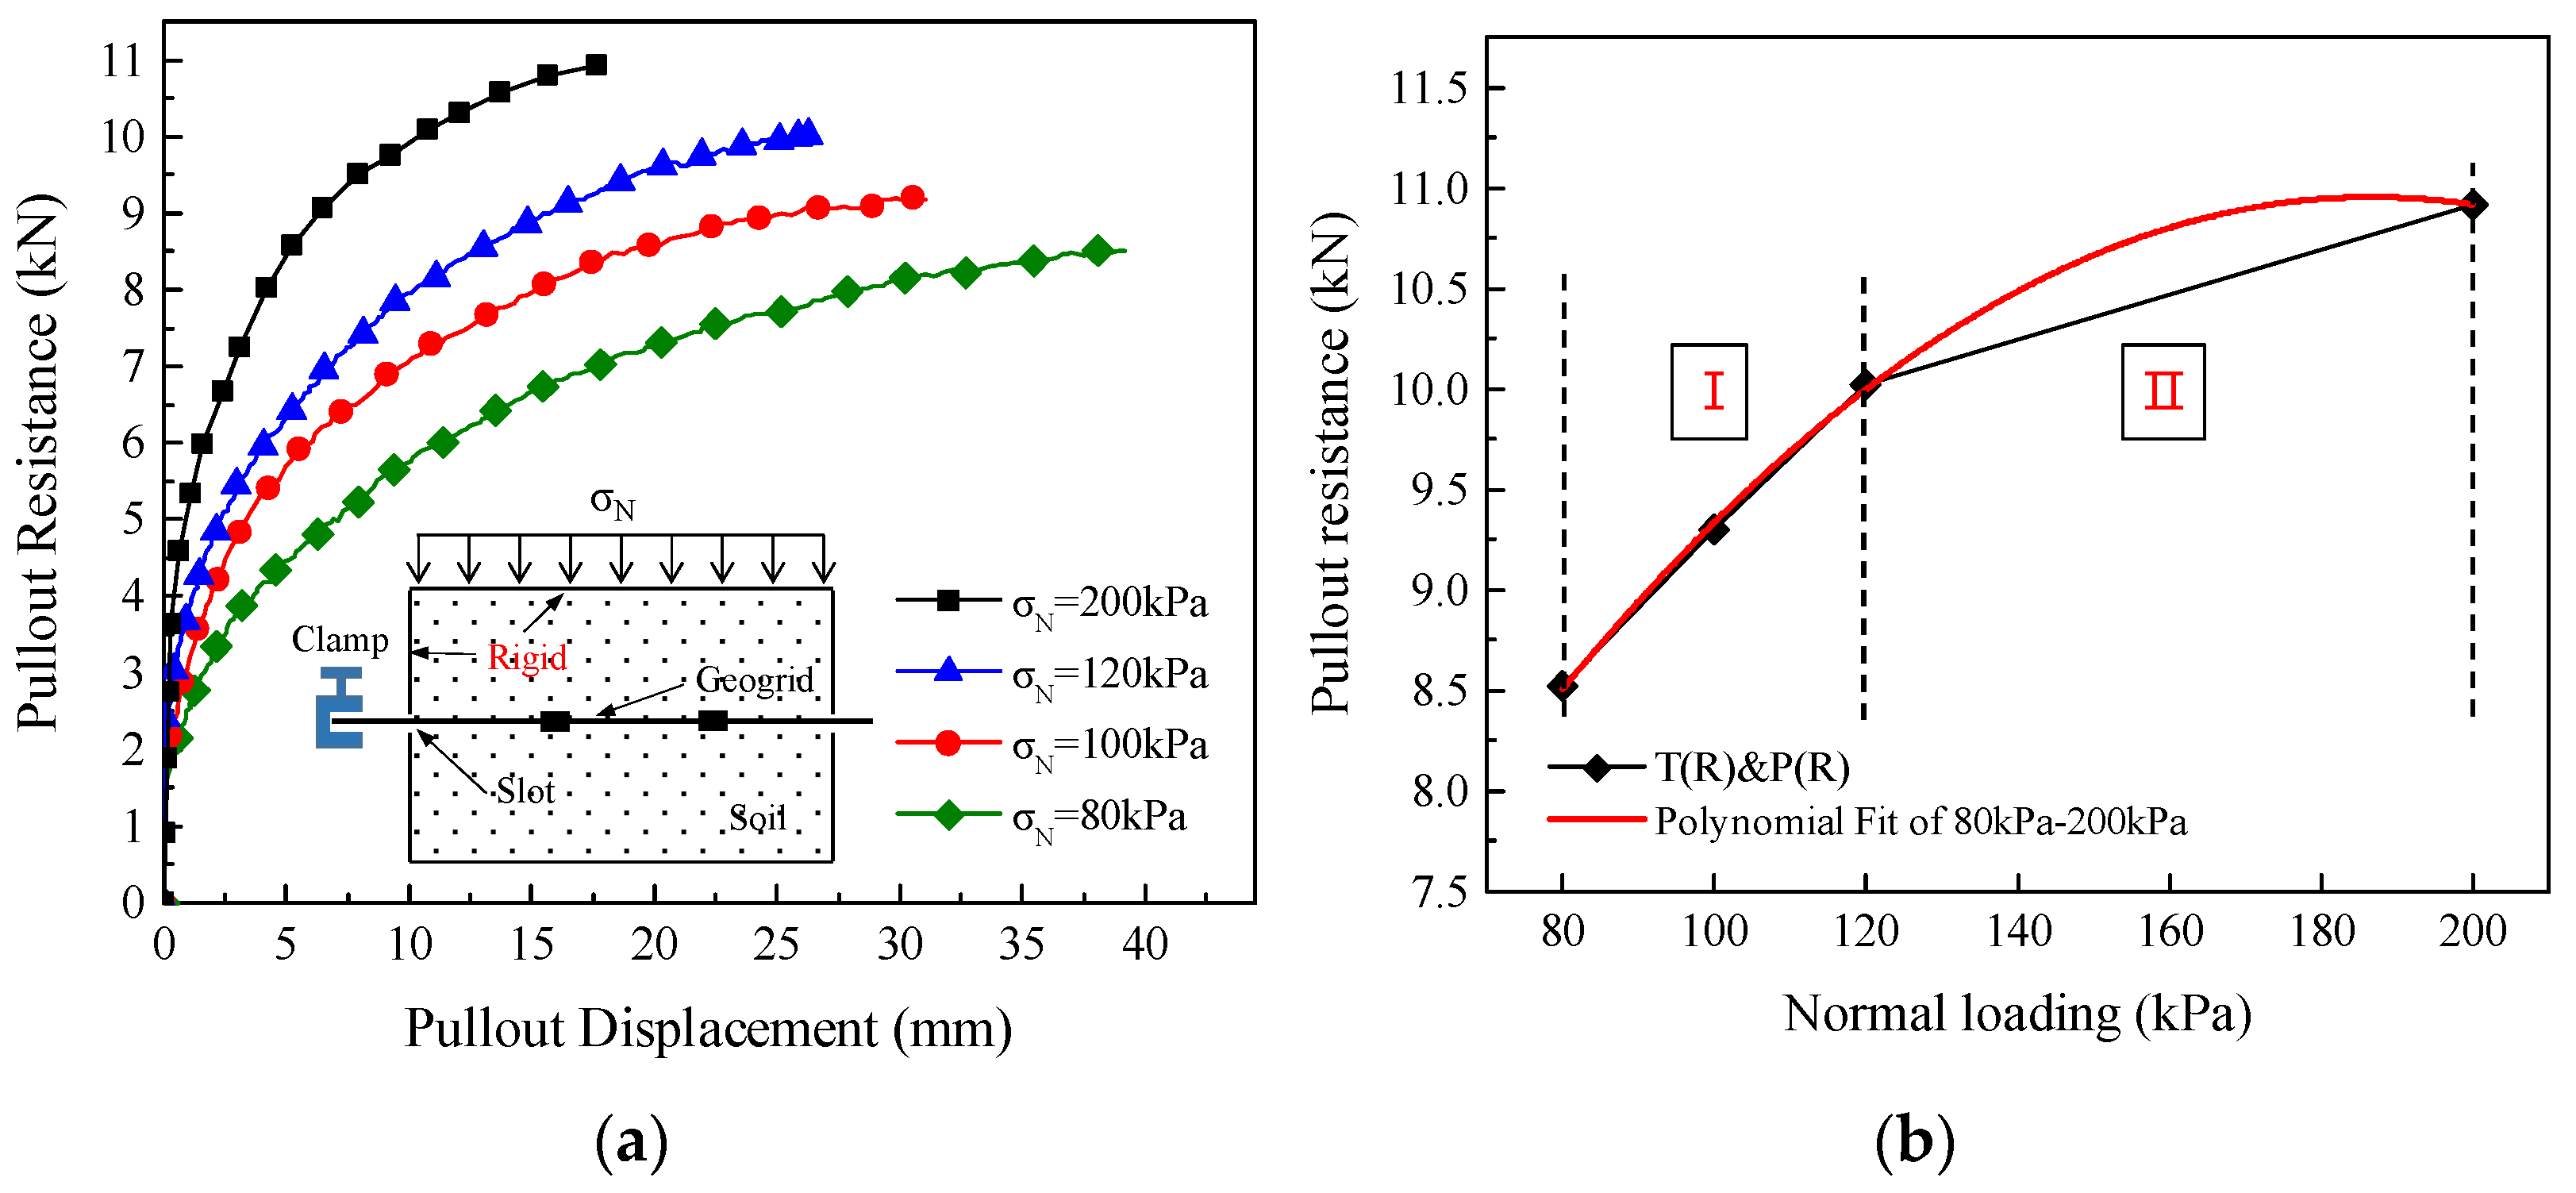
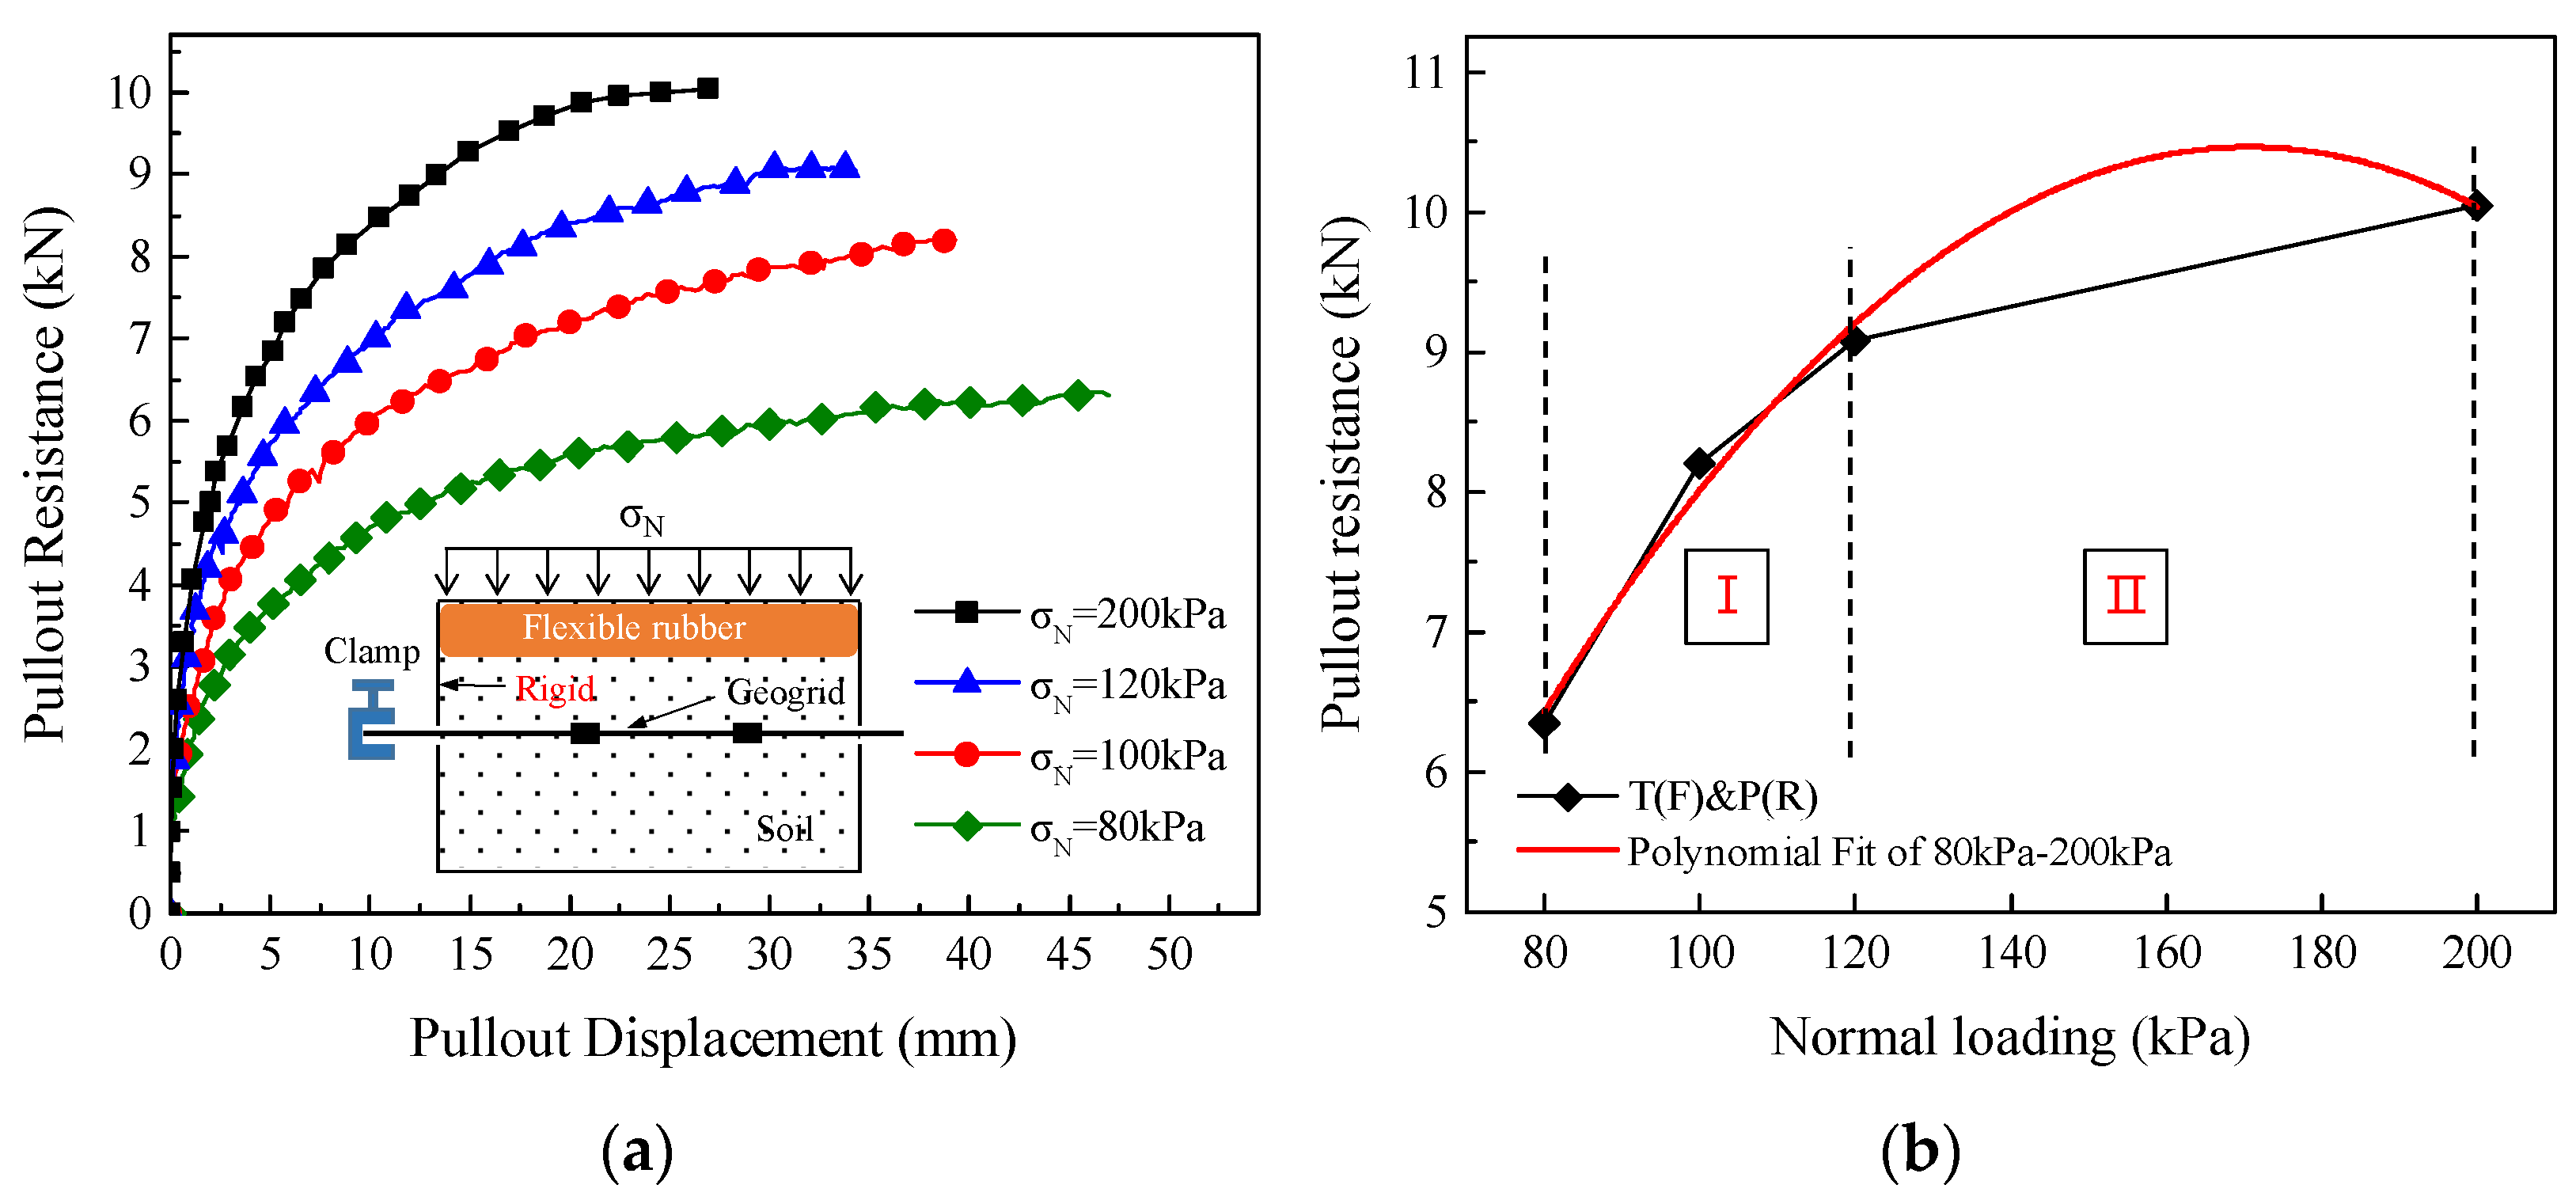
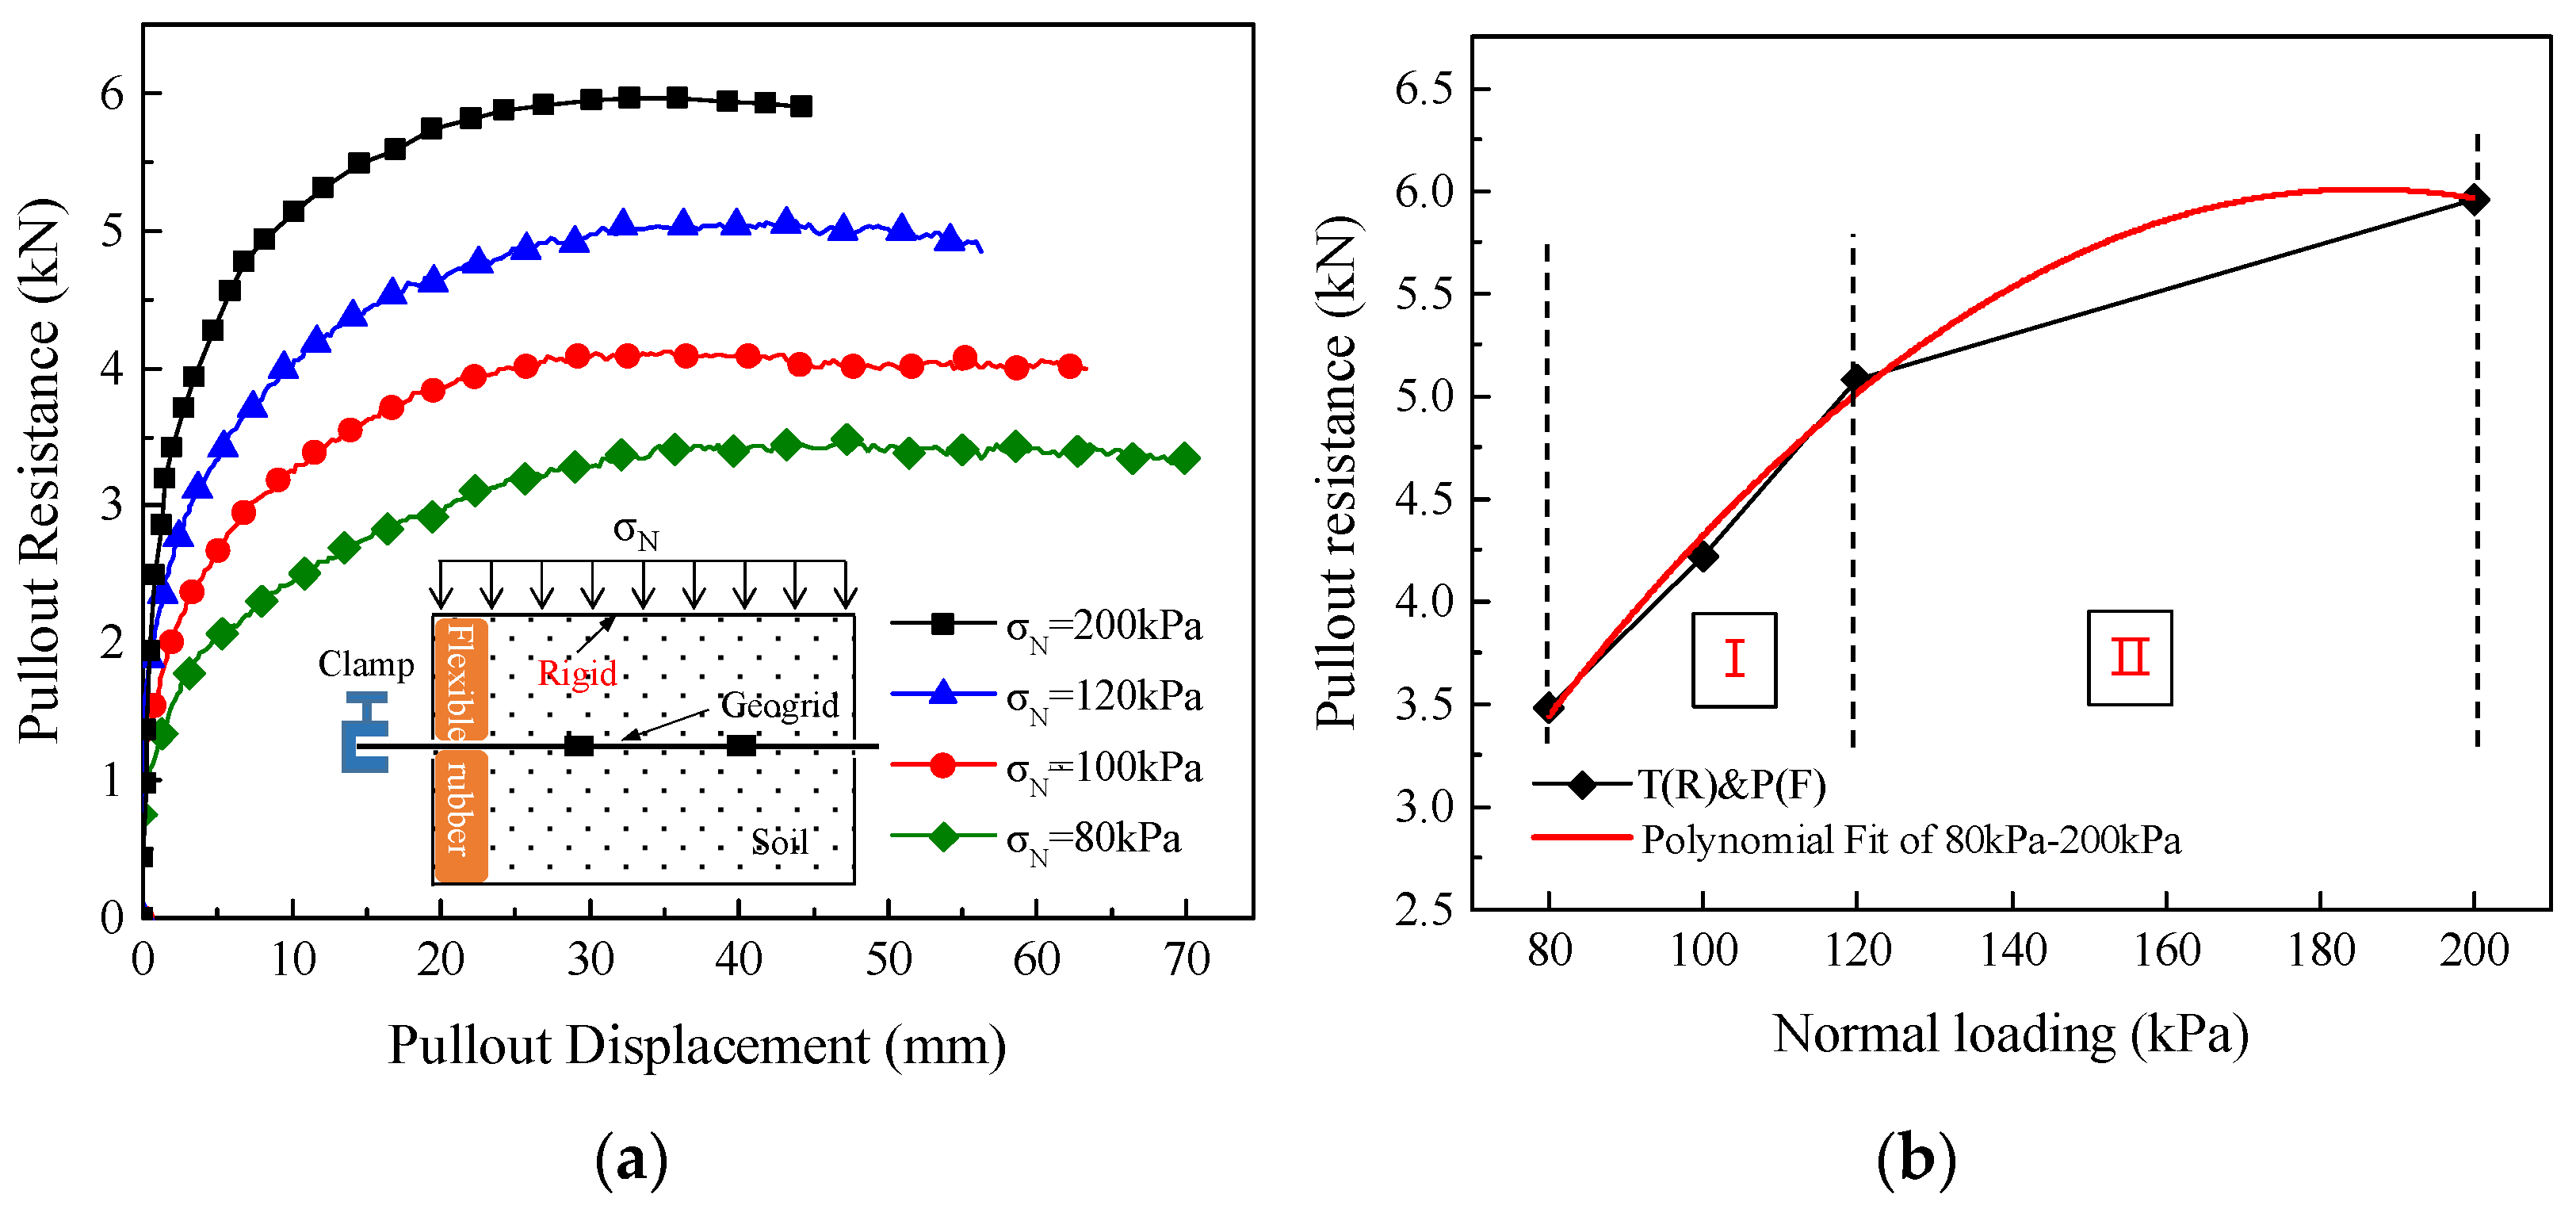
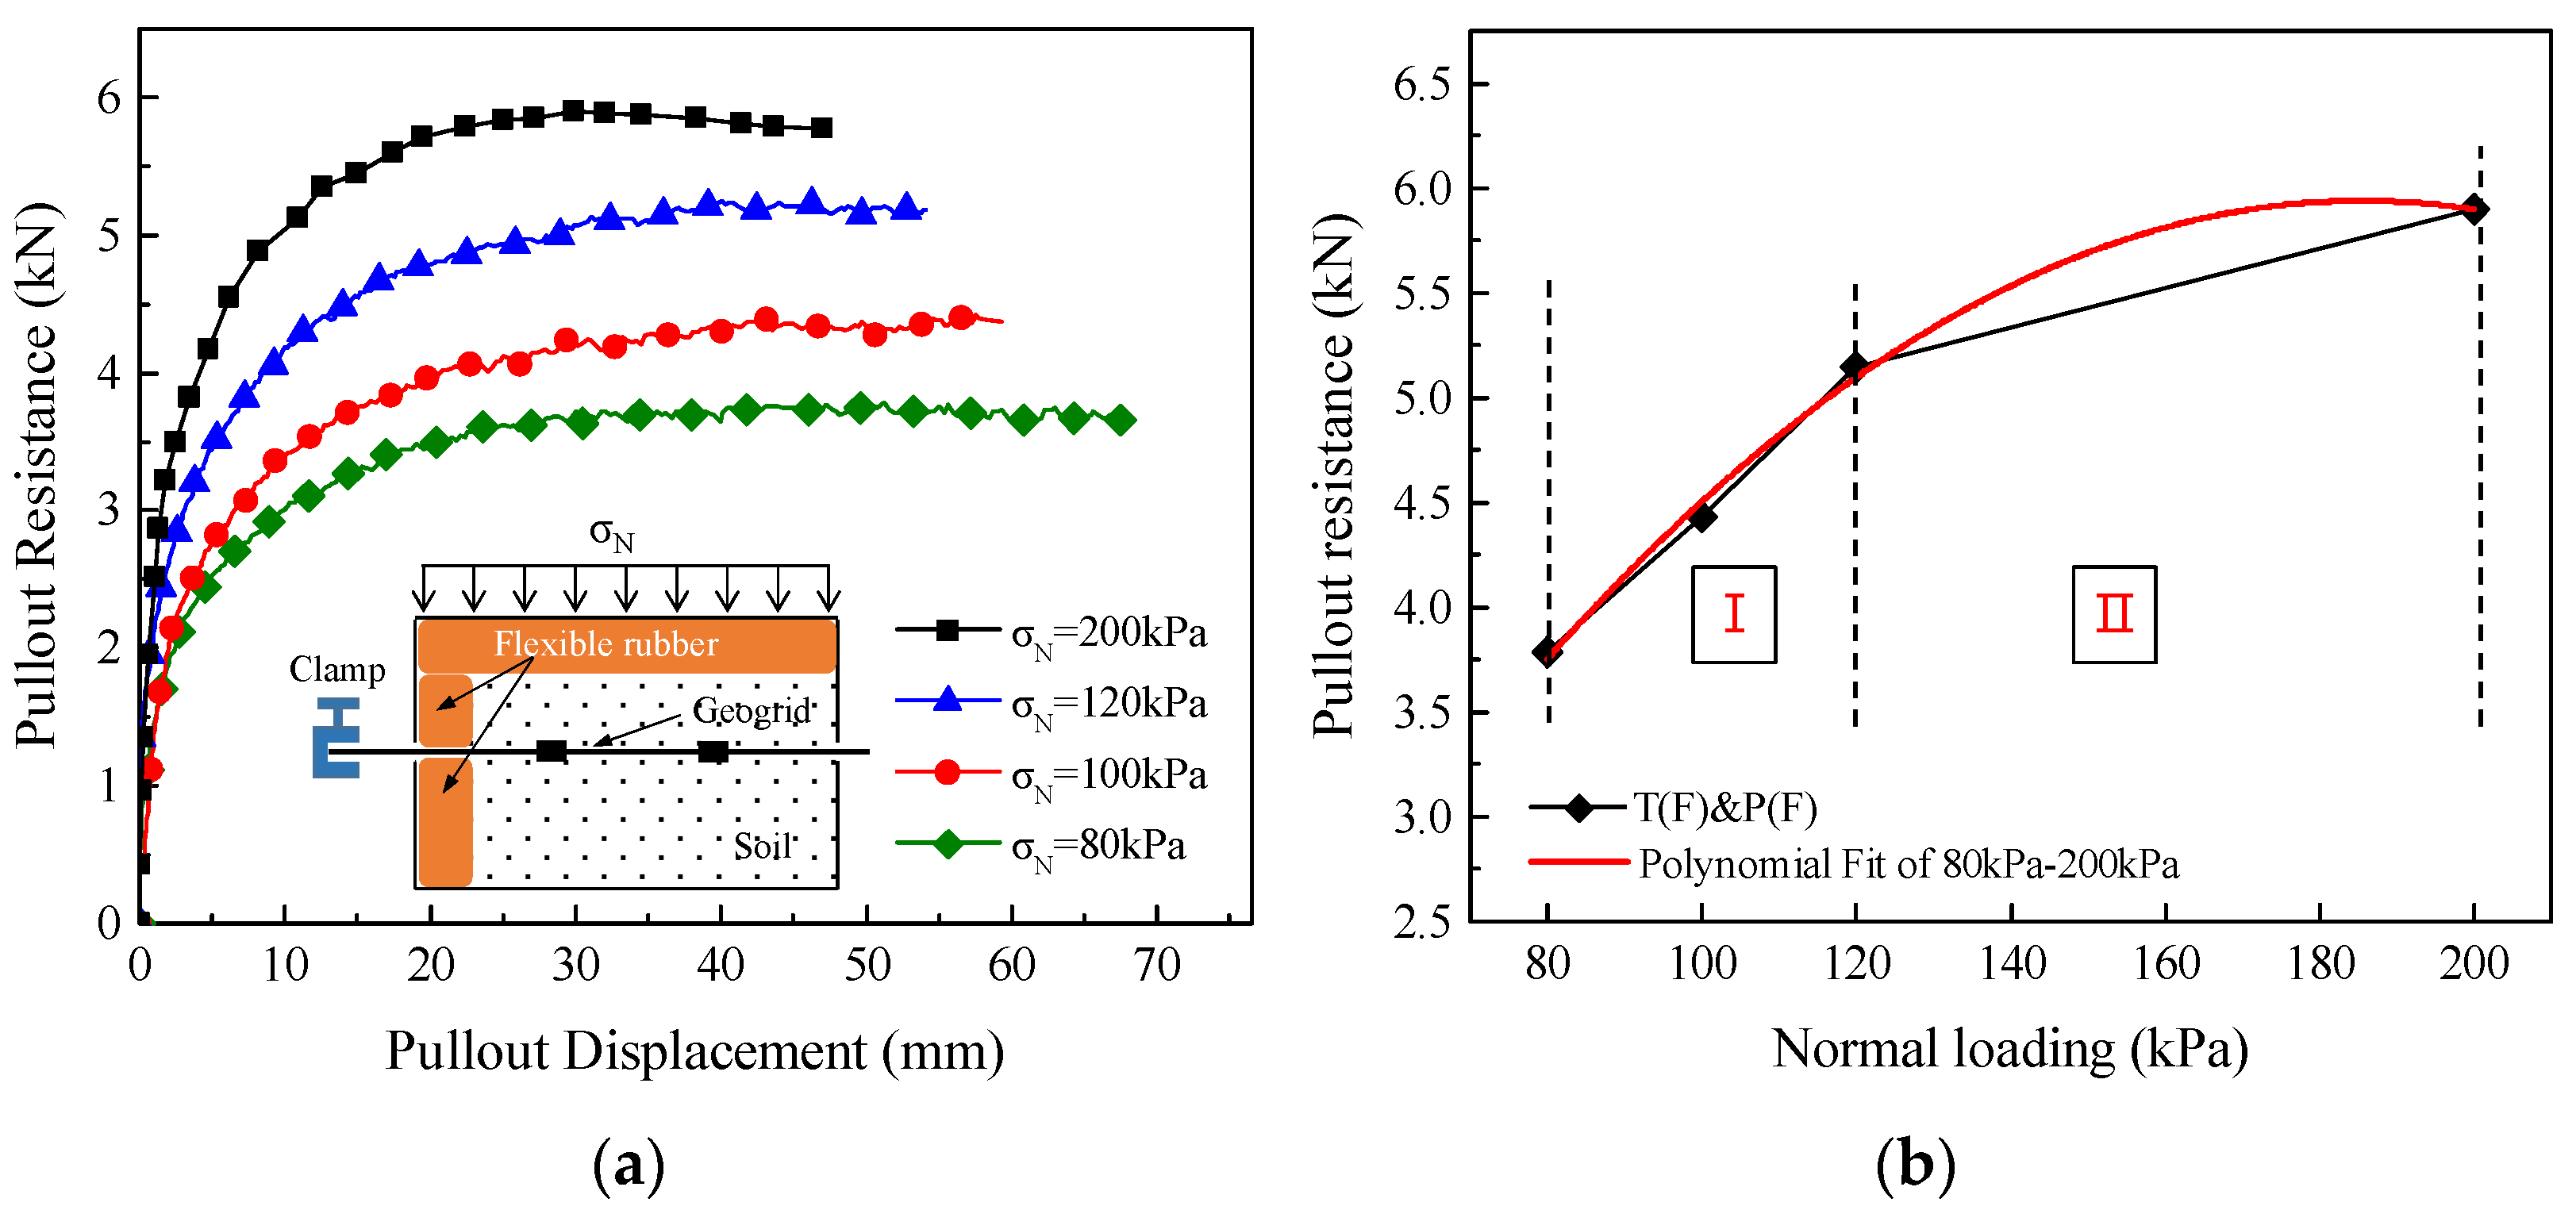
3.1. Effect of Boundary Conditions on the Mechanical Response of the Geogrid–Soil Interface
3.2. Growth Pattern and Fitting of Pullout Resistance under Different Boundary Conditions
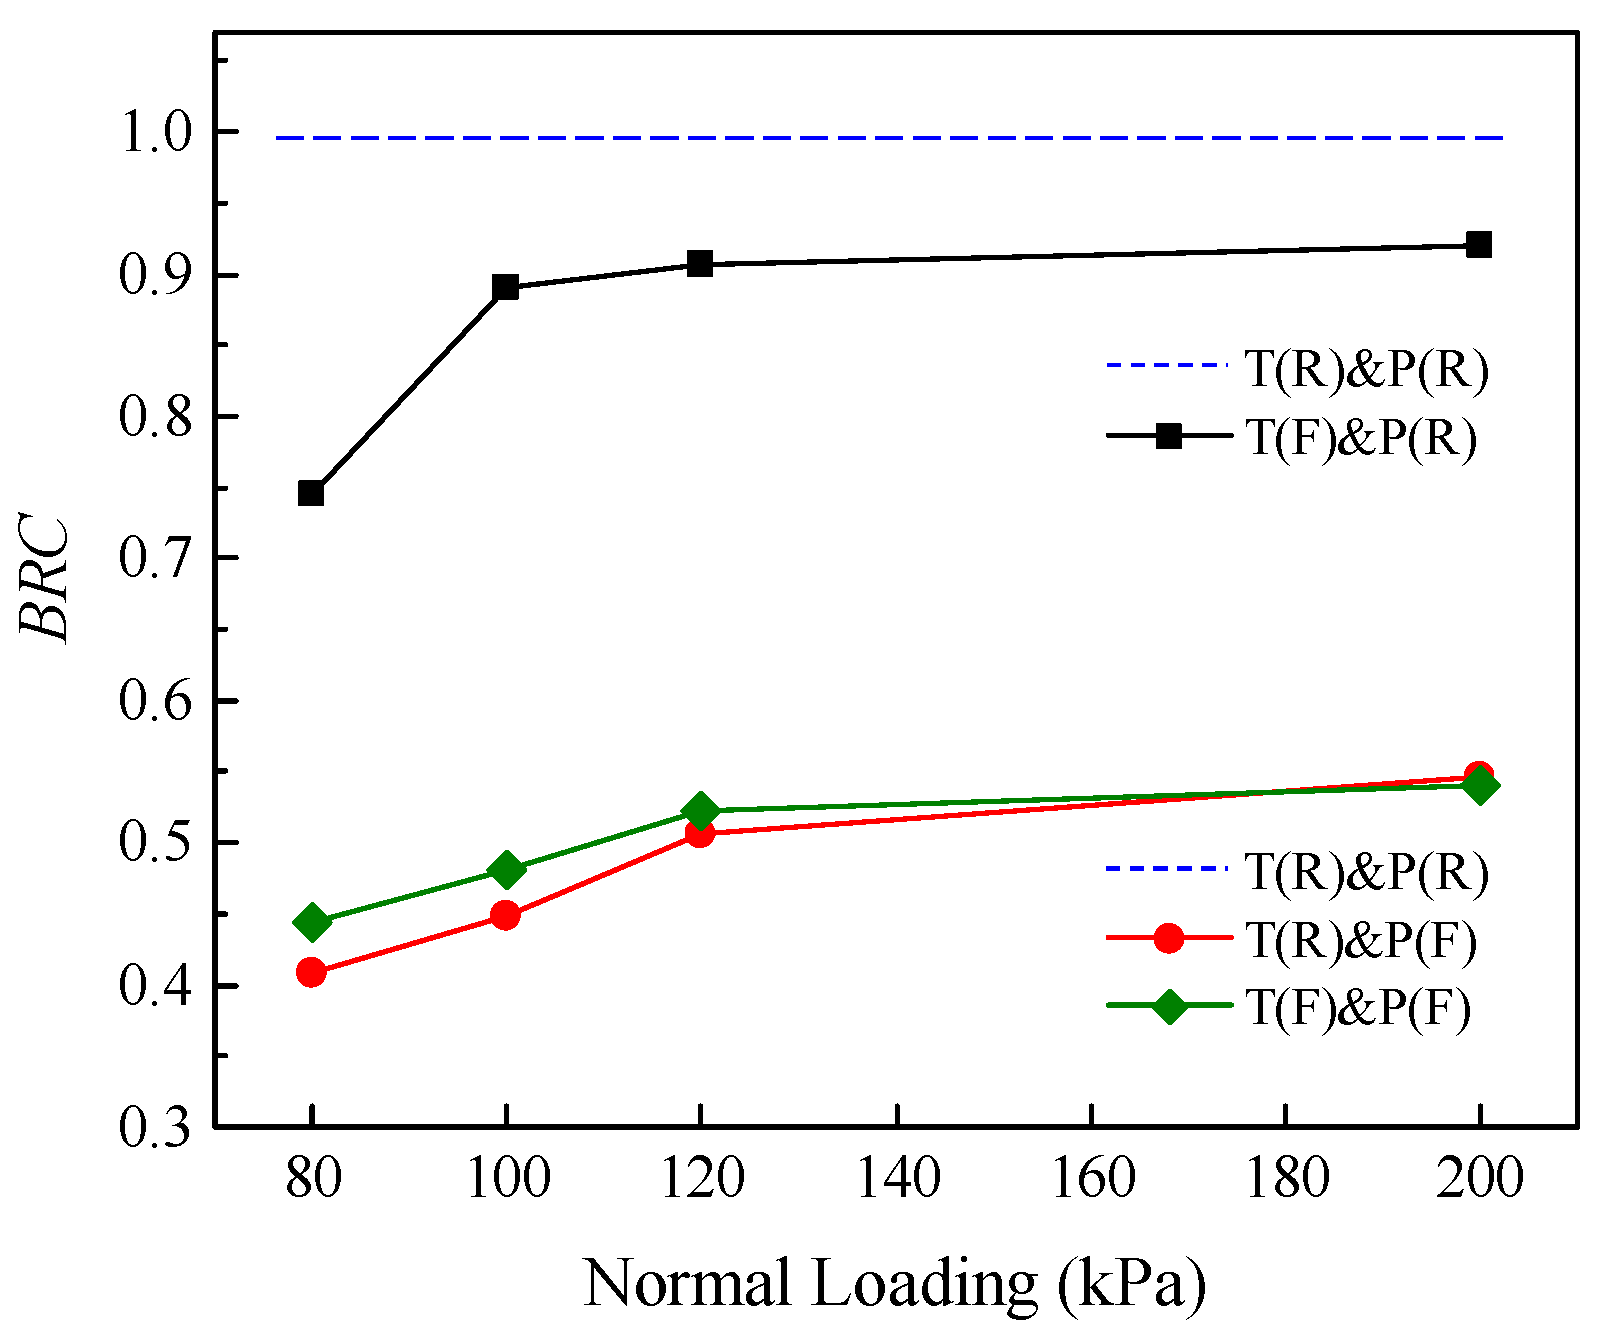
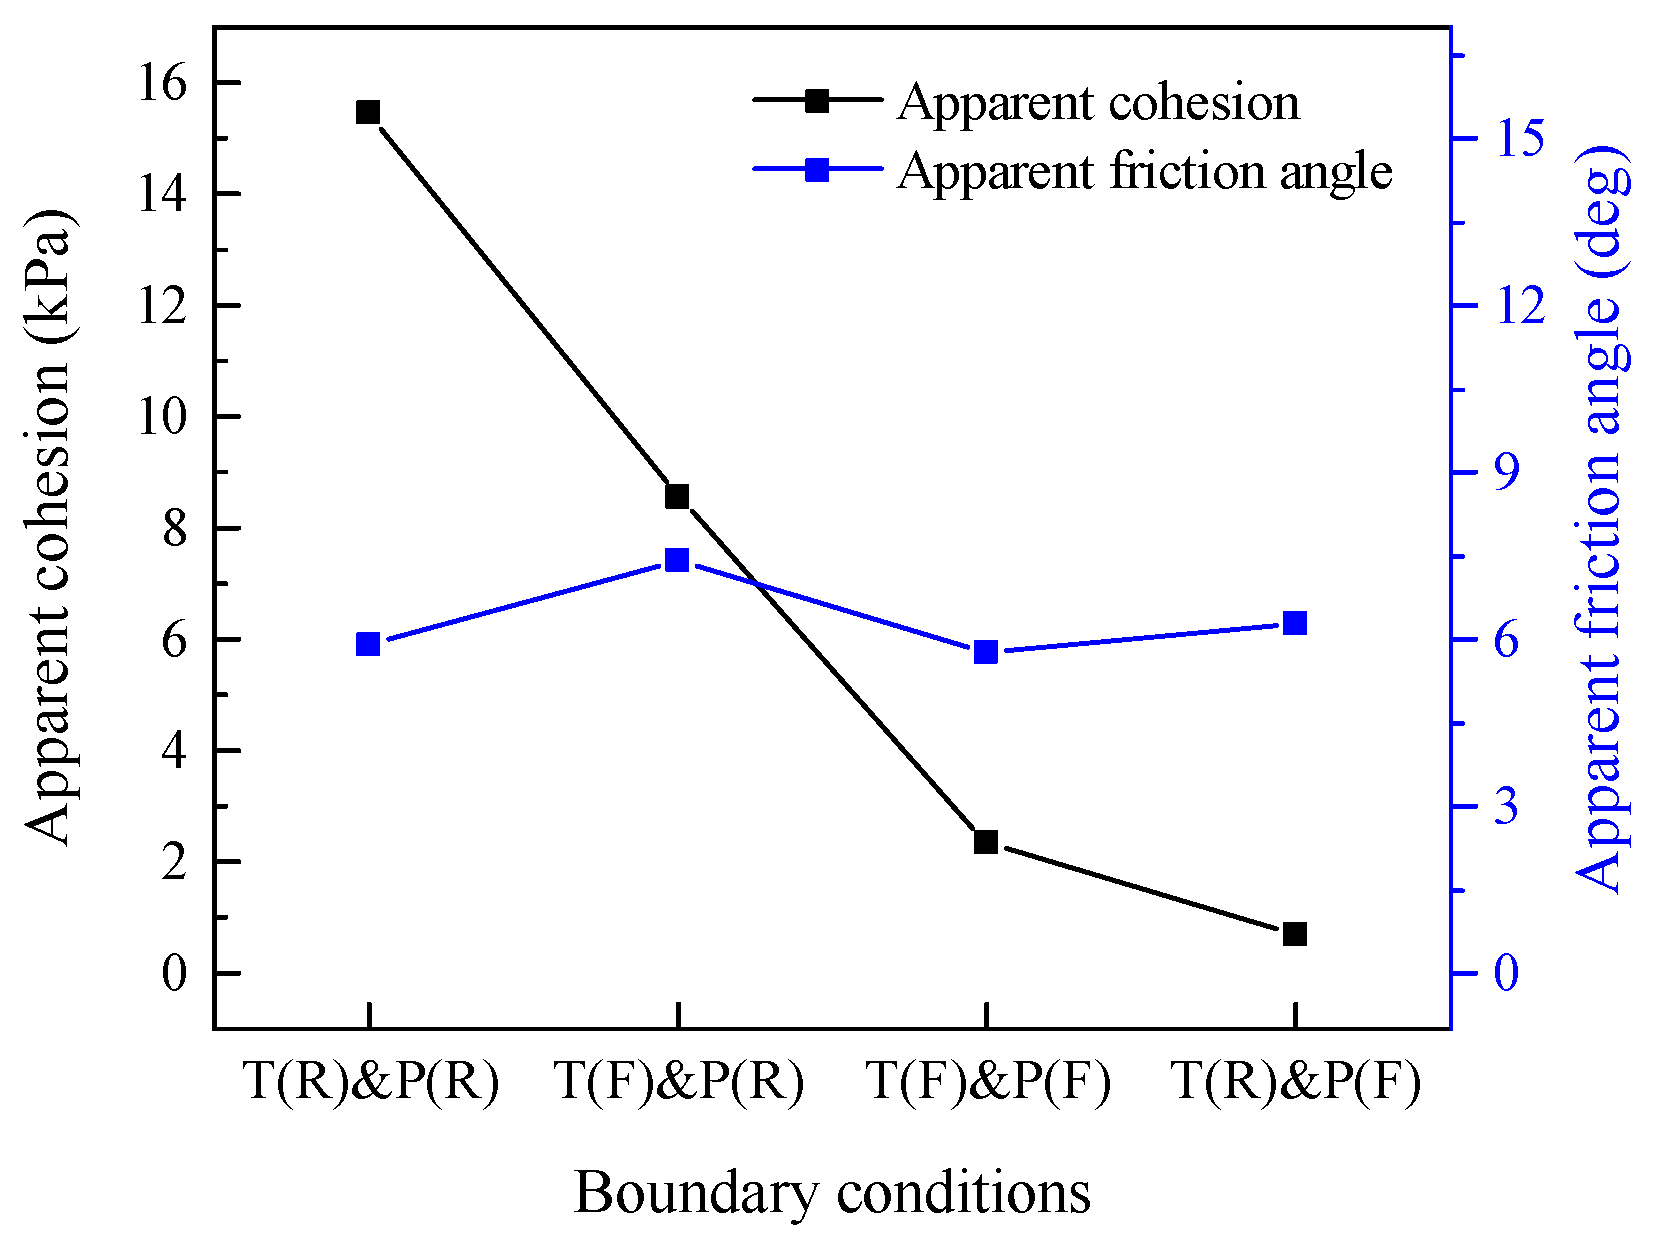
3.3. Variation Laws of Interfacial Shear Strength Indexes Subjected to Different Boundary Conditions
4. Conclusions
Author Contributions
Funding
Institutional Review Board Statement
Informed Consent Statement
Data Availability Statement
Conflicts of Interest
References
- Kim, Y.J.; Kotwal, A.R.; Cho, B.Y.; Wilde, J.; You, B.H. Geosynthetic reinforced steep slopes: Current technology in the United States. Appl. Sci. 2019, 9, 2008. [Google Scholar] [CrossRef] [Green Version]
- Zhang, W.; Du, D.; Bai, X.H. In Situ Testing of Square Footing Resting on Geobelt-Reinforced Gravel Thin Cushion on Soft Silt. Adv. Mater. Sci. Eng. 2018, 2018, 3563914. [Google Scholar] [CrossRef] [Green Version]
- Robinson, W.J.; Howard, I.L.; Tingle, J.S.; Norwood, G.J. Analysis of full-scale geosynthetic reinforced airfield pavement subjected to accelerated aircraft loading. J. Transp. Eng. Part B Pave. 2020, 146, 04020052. [Google Scholar] [CrossRef]
- Wang, X.; Ding, L.; Gao, W.; Zhang, M.; Fu, L. Research on Subgrade Differential Settlement Control Standard and Treatment Technology Based on Driving Comfort. Adv. Mater. Sci. Eng. 2020, 2020, 8956458. [Google Scholar] [CrossRef] [Green Version]
- Zhuang, Y.; Cui, X.Y.; Wang, K.Y.; Zhang, J. A simple design approach to analyse the piled embankment including tensile reinforcement and subsoil contributions. Geotext. Geomembr. 2021, 49, 466–474. [Google Scholar] [CrossRef]
- Burak, P.E.; Vefa, A.M. Comparison of Effects of Using Geosynthetics and Lime Stabilization to Increase Bearing Capacity of Unpaved Road Subgrade. Adv. Mater. Sci. Eng. 2016, 2016, 7129356. [Google Scholar]
- Wang, X.; Zhou, X.; Zhou, M.; Tian, Y. Behavior of large geotextile mat cofferdam with a new arrangement of geotextile reinforcement stiffness lying on soft sediments. Int. J. Geomech. 2020, 20, 04020121. [Google Scholar] [CrossRef]
- Sharma, V.; Kumar, A.; Kapoor, K. Sustainable deployment of crushed concrete debris and geotextile to improve the load carrying capacity of granular soil. J. Clean. Prod. 2019, 228, 124–134. [Google Scholar] [CrossRef]
- Luo, F.Y.; Huang, R.L.; Zhang, G. Centrifuge modeling of the geogrid-reinforced slope subjected to differential settlement. Acta. Geotech. 2020, 15, 3027–3040. [Google Scholar] [CrossRef]
- Altay, G.; Kayadelen, C.; Taşkıran, T.; Ziya, K.Y. A laboratory study on pull-out resistance of geogrid in clay soil. Measurement 2019, 139, 301–307. [Google Scholar] [CrossRef]
- Cardile, G.; Gioffre, D.; Moraci, N.; Calvarano, L.S. Modelling interference between the geogrid bearing members under pullout loading conditions. Geotext. Geomembr. 2019, 45, 169–177. [Google Scholar] [CrossRef]
- Aali, P.; Manoj, D.; Ramana, G.V.; Bansal, D. Measurement of Role of Transverse and Longitudinal Members on Pullout Resistance of PET Geogrid. Measurement 2019, 148, 106944. [Google Scholar]
- Li, F.L.; Ma, T.R.; Yang, Y.G. Numerical study on the rate-dependent behavior of geogrid reinforced sand retaining walls. Geomech. Eng. 2021, 25, 195–205. [Google Scholar]
- Jacobs, F.; Ruiken, A.; Ziegler, M. Investigation of kinematic behavior and earth pressure development of geogrid reinforced soil walls. Transp. Geotech. 2016, 8, 57–68. [Google Scholar] [CrossRef]
- Ke, H.; Ma, P.; Lan, J.W.; He, H. Field behaviors of a geogrid reinforced msw slope in a high-food-waste-content msw landfill: A case study. Geotext. Geomembr. 2020, 49, 430–441. [Google Scholar] [CrossRef]
- Xu, H.; Ren, X.; Chen, J.N.; Liu, C.N.; Xia, L.; Liu, Y.W. Centrifuge model tests of geogrid-reinforced slope supporting a high embankment. Geosynth. Int. 2019, 26, 629–640. [Google Scholar] [CrossRef]
- Zhang, J.; Liu, S.W.; Pu, H.F. Evaluation of an Improved Technique for Geosynthetic-Reinforced and Pile-Supported Embankment. Adv. Mater. Sci. Eng. 2015, 2015, 612760. [Google Scholar] [CrossRef] [Green Version]
- Kayadelen, C.; Önal, T.Ö.; Altay, G. Experimental study on pull-out response of geogrid embedded in sand. Measurement 2018, 117, 390–396. [Google Scholar] [CrossRef]
- Wang, Z.; Jacobs, F.; Ziegler, M. Experimental and DEM investigation of the geogrid-soil interaction under pullout loads. Geotext. Geomembr. 2016, 44, 230–246. [Google Scholar] [CrossRef]
- Park, K.; Kim, D.; Park, J.; Na, H. The Determination of pullout parameters for sand with a geogrid. Appl. Sci. 2021, 11, 11010355. [Google Scholar]
- Maleki, A.; Lajevardi, S.H.; Briançon, L.; Nayeri, A.; Saba, H. Experimental study on the L-shaped anchorage capacity of the geogrid by the pullout test. Geotext. Geomembr. 2021, 49, 1046–1057. [Google Scholar] [CrossRef]
- Abdi, M.R.; Arjomand, M.A. Pullout tests conducted on clay reinforced with geogrid encapsulated in thin layers of sand. Geotext. Geomembr. 2011, 29, 588–595. [Google Scholar] [CrossRef]
- Chen, J.F.; Gu, Z.A.; Rajesh, S.; Yu, S.B. Pullout Behavior of triaxial geogrid embedded in a transparent soil. Int. J. Geomech. 2021, 21, 04021003. [Google Scholar] [CrossRef]
- Abdi, M.R.; Mirzaeifar, H. Experimental and PIV evaluation of grain size and distribution on soil-geogrid interactions in pullout test. Soils Found. 2017, 57, 1045–1058. [Google Scholar] [CrossRef]
- Wang, J.; Liu, F.Y.; Zheng, Q.T.; Cai, Y.Q.; Gou, C.F. Effect of aperture ratio on the cyclic shear behaviour of aggregate-geogrid interfaces. Geosynth. Int. 2021, 28, 158–173. [Google Scholar] [CrossRef]
- Ghaaowd, I.; McCartney, J.S. Pullout of geogrids from tire-derived aggregate having large particle size. Geosynth. Int. 2020, 27, 671–684. [Google Scholar] [CrossRef] [Green Version]
- Zuo, Z.; Yang, G.Q.; Wang, Z.J.; Wang, H. Experimental investigations on pullout behavior of HDPE geogrid under static and dynamic loading. Adv. Mater. Sci. Eng. 2020, 2020, 5408064. [Google Scholar] [CrossRef]
- Cardile, G.; Pisano, M.; Moraci, N. The influence of a cyclic loading history on soil-geogrid interaction under pullout condition. Geotext. Geomembr. 2019, 47, 552–565. [Google Scholar] [CrossRef]
- Palmeira, E.M.; Milligan, G.W. Scale and other factors affecting the results of pull-out tests of grids buried in sand. Geotechnique 1990, 40, 519–521. [Google Scholar] [CrossRef]
- Sugimoto, M.; Alagiyawanna, A.M.N.; Kadoguchi, K. Influence of rigid and flexible face on geogrid pullout tests. Geotext. Geomembr. 2001, 19, 257–277. [Google Scholar] [CrossRef]
- Hsieh, C. Hsieh, M.W. Load plate rigidity and scale effects on the frictional behavior of sand/geomembrane interfaces. Geotext.Geomembr. 2003, 21, 25–47. [Google Scholar] [CrossRef]
- Wang, H.P.; Li, S.C.; Yue, X.L.; Wang, Q. Study on Design and Test of Flexible Uniform Pressure Loading Device. Adv. Sci. Lett. 2011, 4, 646–650. [Google Scholar] [CrossRef]


| NO. | Top | Positive | Representation | Normal Loads (kPa) |
|---|---|---|---|---|
| 1 | Rigid | Rigid | T(R)&P(R) | 80 |
| 2 | Flexible | Rigid | T(F)&P(R) | |
| 3 | Rigid | Flexible | T(R)&P(F) | |
| 4 | Flexible | Flexible | T(F)&P(F) | |
| 5 | Rigid | Rigid | T(R)&P(R) | 100 |
| 6 | Flexible | Rigid | T(R)&P(F) | |
| 7 | Rigid | Flexible | T(F)&P(R) | |
| 8 | Flexible | Flexible | T(F)&P(F) | |
| 9 | Rigid | Rigid | T(R)&P(R) | 120 |
| 10 | Flexible | Rigid | T(R)&P(F) | |
| 11 | Rigid | Flexible | T(F)&P(R) | |
| 12 | Flexible | Flexible | T(F)&P(F) | |
| 13 | Rigid | Rigid | T(R)&P(R) | 200 |
| 14 | Flexible | Rigid | T(R)&P(F) | |
| 15 | Rigid | Flexible | T(F)&P(R) | |
| 16 | Flexible | Flexible | T(F)&P(F) |
| Boundary Conditions | Polynomial Fitting Equation |
|---|---|
| T(R)&P(R) | y = 3.456 + 0.08x − 2.15 × 10−4x2 (R2 = 0.99) |
| T(F)&P(R) | y = −3.834 + 0.17x − 4.91 × 10−4x2 (R2 = 0.98) |
| T(R)&P(F) | y = −1.906 + 0.085x − 2.29 × 10−4x2 (R2 = 0.98) |
| T(F)&P(F) | y = −0.811 + 0.073x − 1.96 × 10−4x2 (R2 = 0.99) |
| Boundary Conditions | Fitting Equation | Apparent Cohesion/kPa | Apparent Friction Angle/Degree |
|---|---|---|---|
| T(R)&P(R) | y = 0.103x + 15.46 (R2 = 0.99) | 15.46 | 5.88 |
| T(F)&P(R) | y = 0.111x + 8.56 (R2 = 0.99) | 8.56 | 7.41 |
| T(F)&P(F) | y = 0.101x + 2.34 (R2 = 0.99) | 2.34 | 5.77 |
| T(R)&P(F) | y = 0.110x + 0.68 (R2 = 0.99) | 0.68 | 6.28 |
Publisher’s Note: MDPI stays neutral with regard to jurisdictional claims in published maps and institutional affiliations. |
© 2021 by the authors. Licensee MDPI, Basel, Switzerland. This article is an open access article distributed under the terms and conditions of the Creative Commons Attribution (CC BY) license (https://creativecommons.org/licenses/by/4.0/).
Share and Cite
Zuo, Z.; Yang, G.; Wang, Z.; Wang, H.; Jin, J. Effect of Boundary Conditions on the Mechanical Behavior of the Geogrid–Soil Interface. Appl. Sci. 2021, 11, 9942. https://doi.org/10.3390/app11219942
Zuo Z, Yang G, Wang Z, Wang H, Jin J. Effect of Boundary Conditions on the Mechanical Behavior of the Geogrid–Soil Interface. Applied Sciences. 2021; 11(21):9942. https://doi.org/10.3390/app11219942
Chicago/Turabian StyleZuo, Zheng, Guangqing Yang, Zhijie Wang, He Wang, and Jing Jin. 2021. "Effect of Boundary Conditions on the Mechanical Behavior of the Geogrid–Soil Interface" Applied Sciences 11, no. 21: 9942. https://doi.org/10.3390/app11219942