Abstract
The noise caused by rail corrugation seriously affects the operation quality of metro vehicles. In this work, the rail corrugation, interior noise and wheel–rail noise of a metro line were tested, and the test results were compared with those after two kinds of treatments. The results show that rail corrugation is the main cause of the abnormal interior noise. The interior noise in many sections exceeds the limit, where clear rail corrugations from 31.5~63 mm are found. When the train passes through the rail corrugation section, the interior noise shows a clear increase, and the maximum increase is higher than 25 dB(A). After increasing the lateral stiffness of the track and rail grinding, the interior noise is reduced by 11.4 dB(A). After a long renovation time, the interior noise is effectively equal to that when the renovation was completed. The research results of this work can provide a reference for rail corrugation treatment and noise control.
1. Introduction
Railway corrugation refers to the wave-type wear on the wheel–rail rolling contact surface [1,2]. Rail corrugation not only worsens the wheel rail contact state and increases structural vibration, but also causes a series of problems such as the loosening of rail fasteners and vehicle damage, etc. [3,4,5]. Consequently, vehicle noise increases substantially and affects passenger comfort. In addition, the noise in the station and the environmental noise along the subway also attract extensive attention [6]. In summary, the noise caused by rail corrugation has become an important factor that seriously affects the operational quality of metro.
Until recently, many experts and scholars conducted much research on the noise inside the metro system [7,8,9]. Generally, the speed of a metro train is 60~120 km/h, and the main source of its internal noise is the wheel–rail noise [10,11]. Wheel–rail roughness, especially in the case of rail corrugation, is the main excitation source [12,13]. The wheel–rail noise caused by rail corrugation is transmitted to the interior of the train through the air. In addition, the wheel–rail vibration is transmitted upward to the train body, causing the vibration of the train body structure and radiating to the interior of the train [14].
In order to understand the characteristics of rail corrugation, Grassie developed test equipment with a measurement accuracy of several microns [15], and studied the causes and treatment methods of rail corrugation via a field test [16,17]. Thompson studied the relationship between wheel–rail roughness and rolling noise, and put forward experimental evidence from various sources to confirm the linear relationship between them [18]. Feng found that rail corrugation with a 30~50 mm wavelength was the main cause of abnormal vibrations and noise in the test train, using an onsite investigation of corrugation and noise testing in the train [19]. Han found that the noise sources in the vehicle come from the wheel–rail interaction, using the research methods of vehicle noise source identification and spectrum analysis [20]. Chen measured in detail the interior noise of the same carriage at different positions and different speeds, and studied the distribution law of the interior noise of the metro carriage [21]. Zhao installed dampers on tracks and measured the interior noise before and after installation [22]. Guo conducted an in-depth study on the relationship between rail corrugation and cab interior noise [23].
In summary, the existing studies conducted much research on rail corrugation, but there are many factors that affect the formation of rail corrugation. The differences in train structure, operation state and track structure may lead to different rail corrugation characteristics. At present, rail grinding is widely used in rail corrugation treatment. However, rail corrugation will appear in a certain period after grinding [24]. A rail damping was also studied to renovate rail corrugation [25,26]. The rail damping is found to be able to suppress the pinned–pinned resonance, and thus its use may lead to attenuating the development of short pitch rail corrugation [27]. However, there are many types of rail dampers, and different rail damper designs may give different results [28]. Therefore, the on-site treatment needs a specific analysis for specific problems, and different treatment methods are necessary for different types of rail corrugation.
In this work, the rail corrugation, the noise inside the train and the wheel–rail noise were tested during train operation in some sections of a metro line. According to the test results, the test section was selected for a comprehensive treatment, and the interior noise after treatment was tested many times. According to the comparative analysis of the test results, the influence of rail corrugation on the noise level and frequency characteristics in the vehicle was studied.
2. Methods
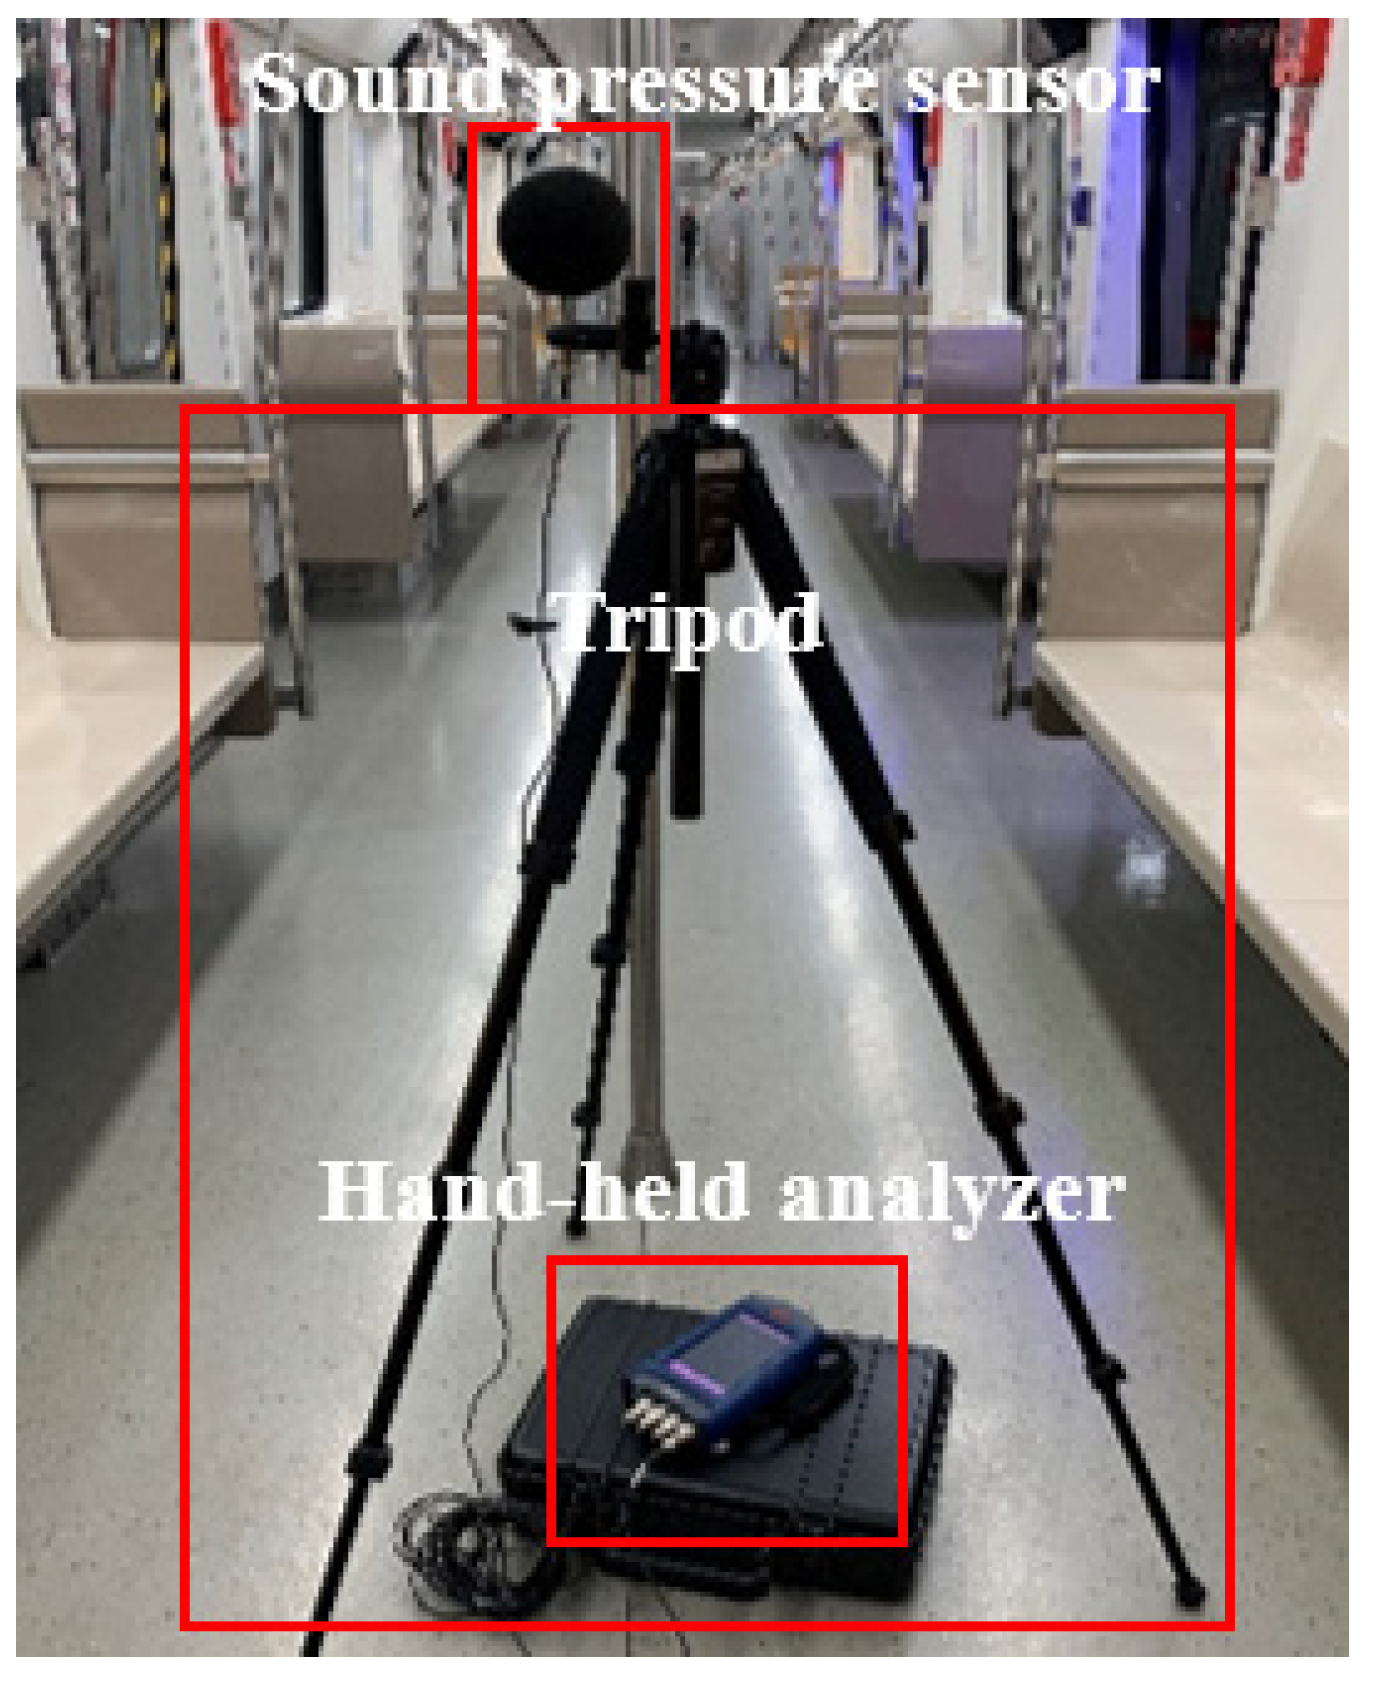
A metro line in Beijing was selected to test the interior noise. This line has the characteristics of a fast train operating speed, short departure intervals and a large passenger volume. Moreover, the generation period of rail corrugation is short; the shortest time is 2–3 months. The noise test equipment used in the test included a sound pressure sensor, high-performance hand-held analyzer, tripod, etc. The sound pressure sensor and high-performance, hand-held analyzer are manufactured by China Orient Institute of Noise and Vibration (Beijing, China). Detailed parameters of the noise test equipment are shown in Table 1. The basic principle of the test instrument is to convert the mechanical quantity into electric quantity by the sensor, and then measure and analyze the electric quantity, so as to obtain the measured mechanical vibration quantity. Before measurement, the sound calibrator is put on the sensor to calibrate the whole measurement system with one or more frequencies within the test frequency range.

Table 1.
Detailed parameters of the noise test equipment.
Referring to the Chinese standards, GB/T 3449-2011 [29] and GB/T 14892-2006 [30], the noise in the head, middle and rear carriages was tested, respectively. These standards specify the noise limits, measurement methods and main contents of test reports of urban rail transit trains. According to the standards, the sound pressure sensors were arranged at 1.2 m above the front bogie of the train, and there was no other noise source within 1 m. The specific measuring points were shown in Figure 1.

Figure 1.
Layout of interior noise measuring points.
The interior noise of the vehicle was tested in the static and running condition. The test was conducted during an off-peak period and there were few passengers on the train. During the test, the running speed of the train was 85 km/h. The running gear of the train had no recent out-of-roundness faults, and the wheel surfaces were in good condition.
The noise in the station was also measured when the train entered the station. The measuring instruments were placed 2 m away from the platform shield doors. The sound pressure sensor was placed at the train entrance with a height of 1.6 m and there were no passengers nearby.
For the noise measurement results, a spectrum analysis was carried out, and the noise equivalent A sound level was calculated by the following formula:
where is A-weighted sound pressure level, dB(A); is the i-th octave band sound pressure level, dB(A).
After the analysis of the interior noise, the section with abnormal noise inside the train was selected to test the rail corrugation. Corrugation Analysis Trolley (CAT) was used in the test. It is manufactured by the Rail Measurement Company (Cambridge, Britain, UK) for measurement and analysis of rail corrugation. The appearance of the instrument is shown in Figure 2, and the detailed parameters are shown in Table 2. The instrument integrates the acceleration sensor on the high hardness steel balls. The irregularity of the contact point is determined by the vertical micro vibration of the steel balls. The sampling interval is 2 mm.
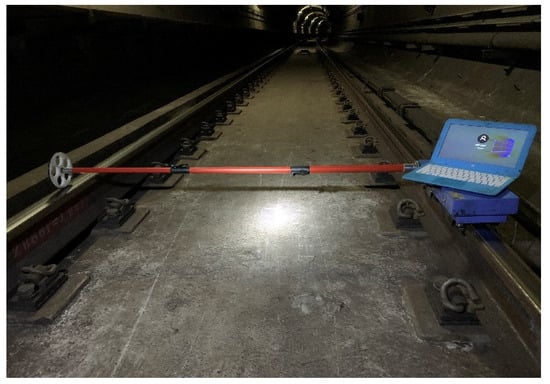
Figure 2.
Corrugation Analysis Trolley.
Table 2.
Detailed parameters of CAT.
During the test for rail corrugation, the instrument was placed on the surface of the rail, and connected to the notebook computer via the data line. Then, the instrument was driven back and forth at twice the speed of 1 m/s in the test section to complete the measurement of the corrugation characteristics of the left and right rails.
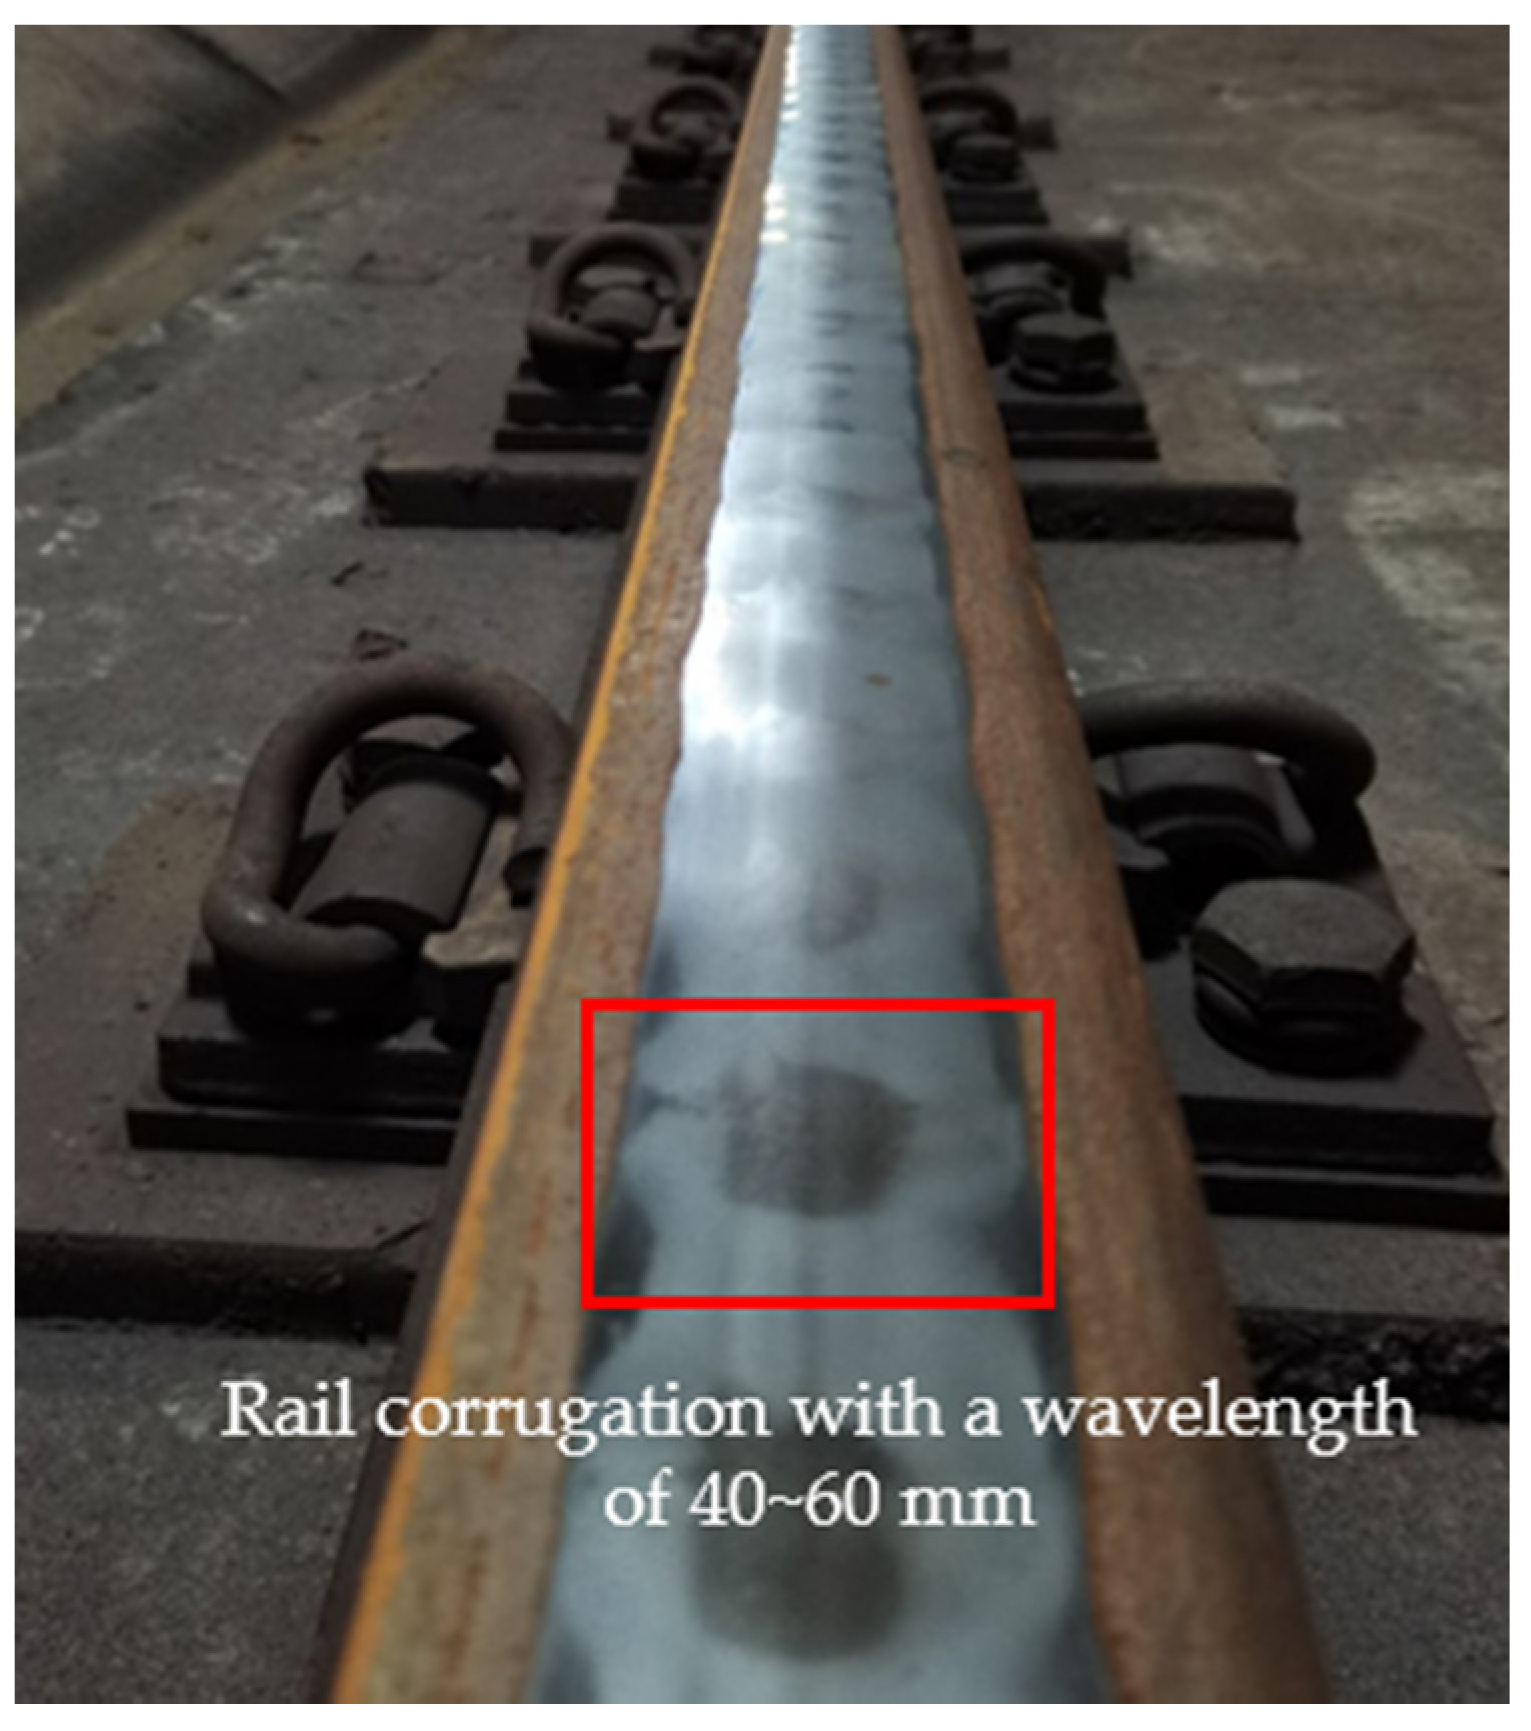
In the serious rail corrugation area, sensors were installed to test wheel–rail noise during metro operation. The corrugation of the line is shown in Figure 3.
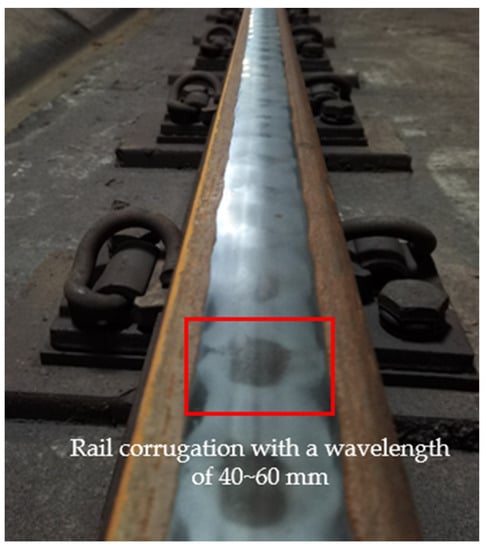
Figure 3.
Rail corrugation condition.
According to above test results, the test section for treatment was selected. The treatment measures include replacing the fasteners and grinding the rail. After the treatment, the same train was selected to test the interior noise several times.
3. Results of Interior Noise
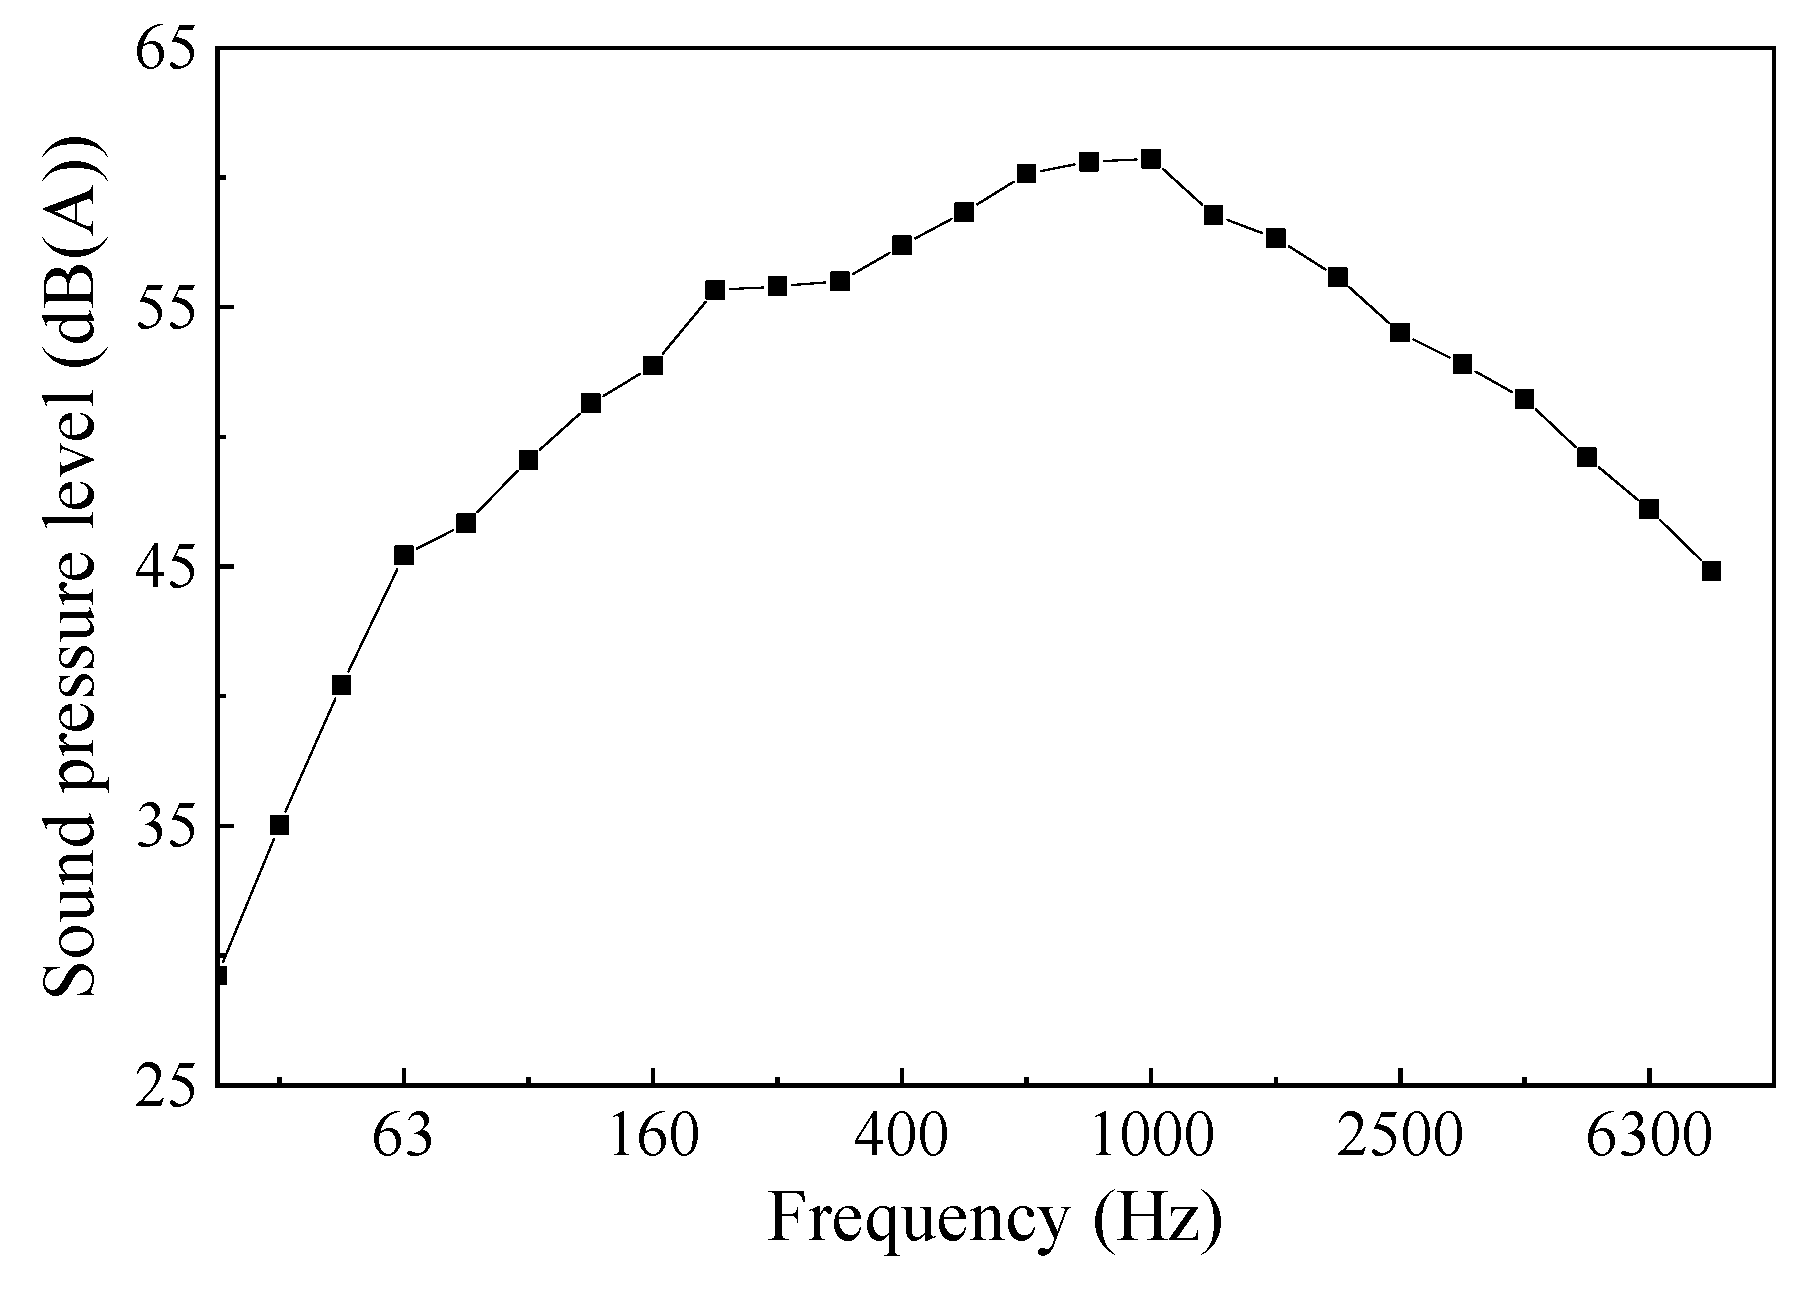
As shown in Figure 4, the interior noise of the train in the static state was measured when the train was stopping. The equivalent A-level of vehicle interior noise is 69.9 dB(A) when the vehicle is stationary. It is much lower than the limit value of the metro vehicle interior noise specified in the standard [30], which is 83 dB(A). There is no obvious peak frequency, which eliminates the influence of the noise of vehicle parts and auxiliary equipment on the internal noise of train operation.

Figure 4.
One-third octave diagram of standing noise.
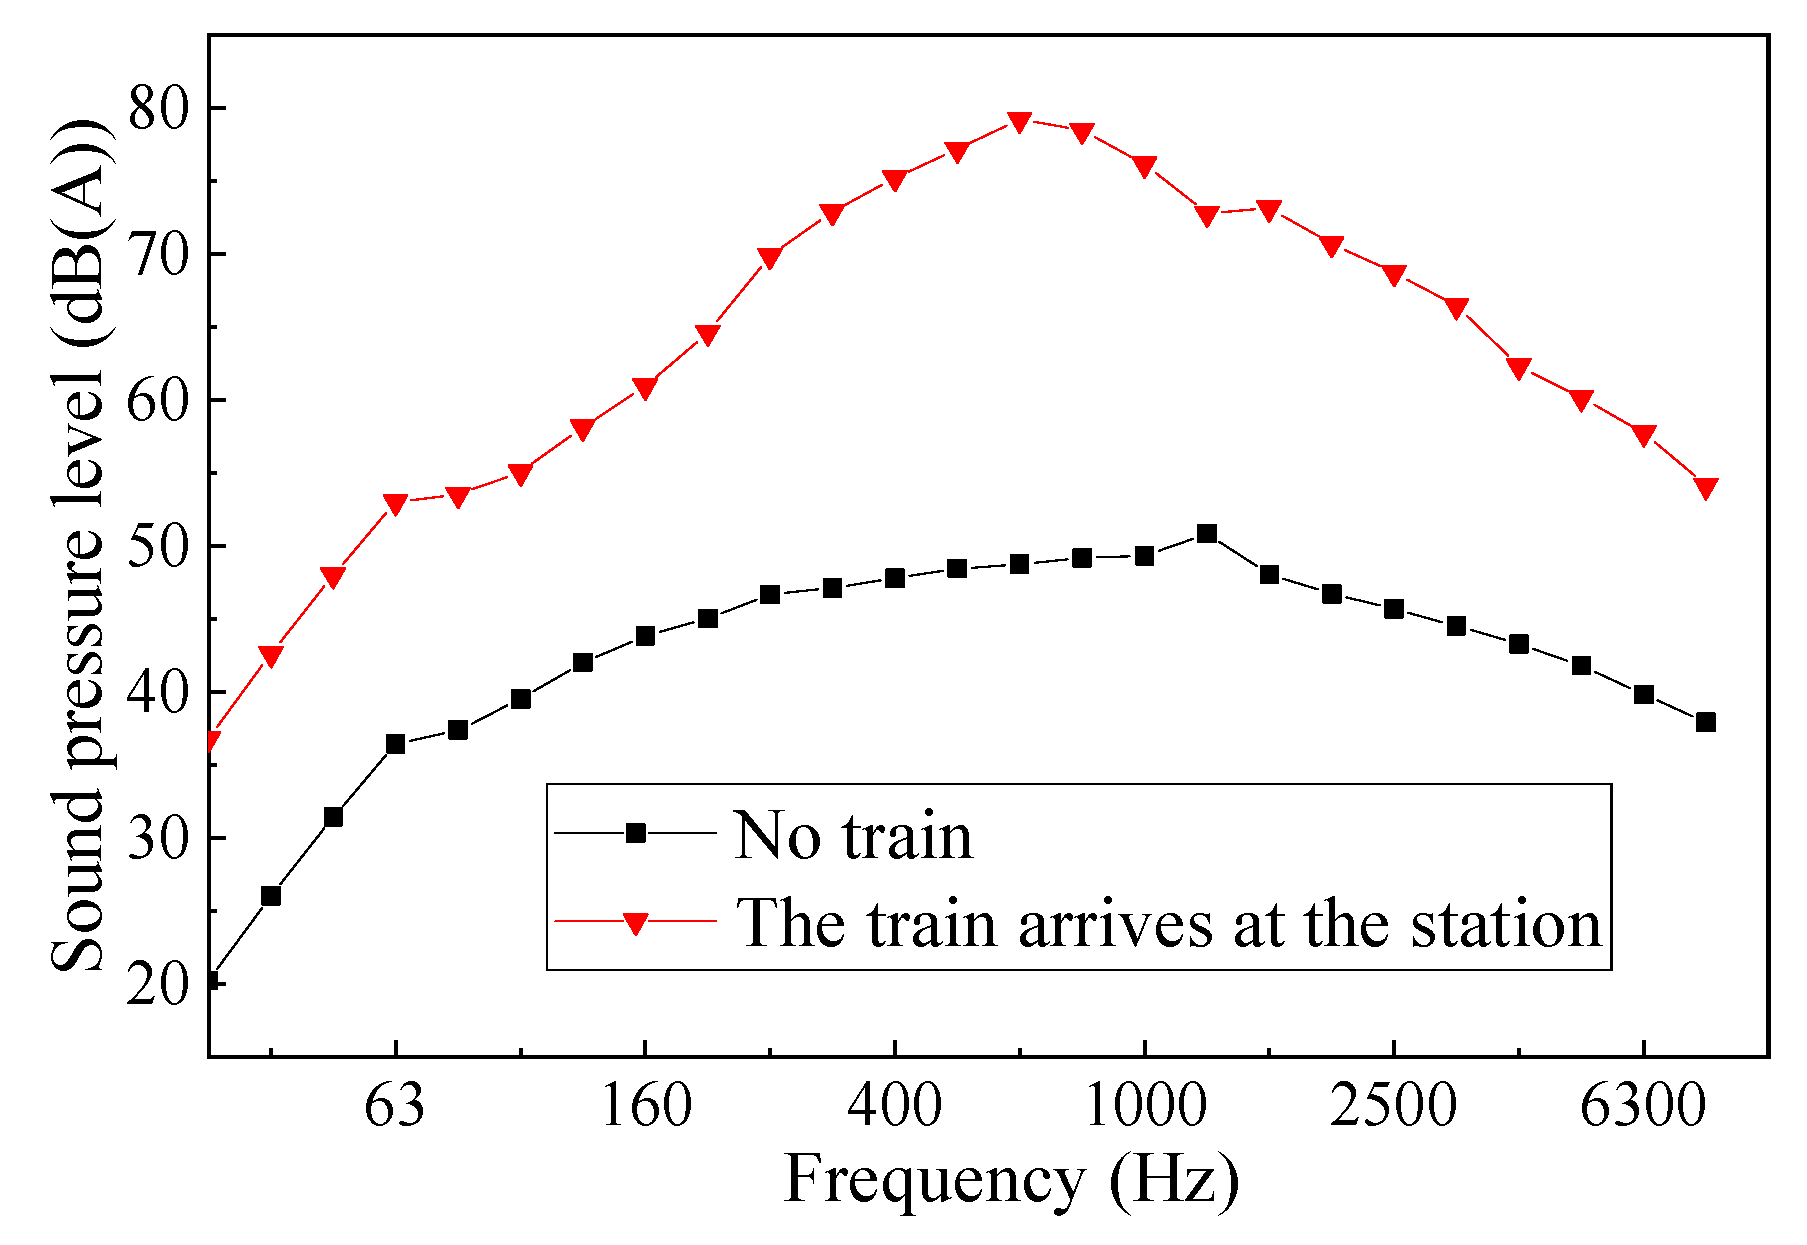
The noise measurement results in the station are shown in Figure 5. The noise in the station increases from 59.7 dB(A) to 85.8 dB(A) when the train arrives at the station. The noise has no obvious peak when the train does not arrive at the station, which eliminates the possible influence of other abnormal noise sources in the station. The metro tunnel resulted in a high absorption at a low frequency. When the train arrives at the station, the noise at the frequencies from 200~2500 Hz increases greatly, while there is less of an increase in noise at the low frequency.
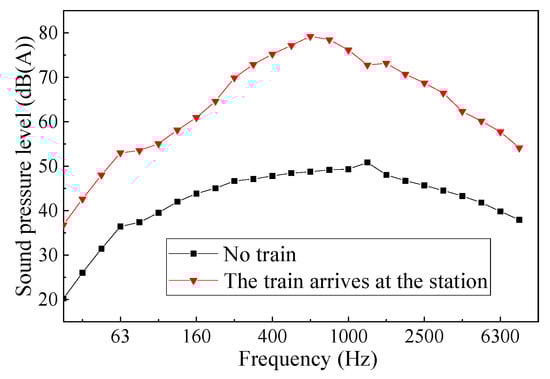
Figure 5.
The noise measurement results in the station.
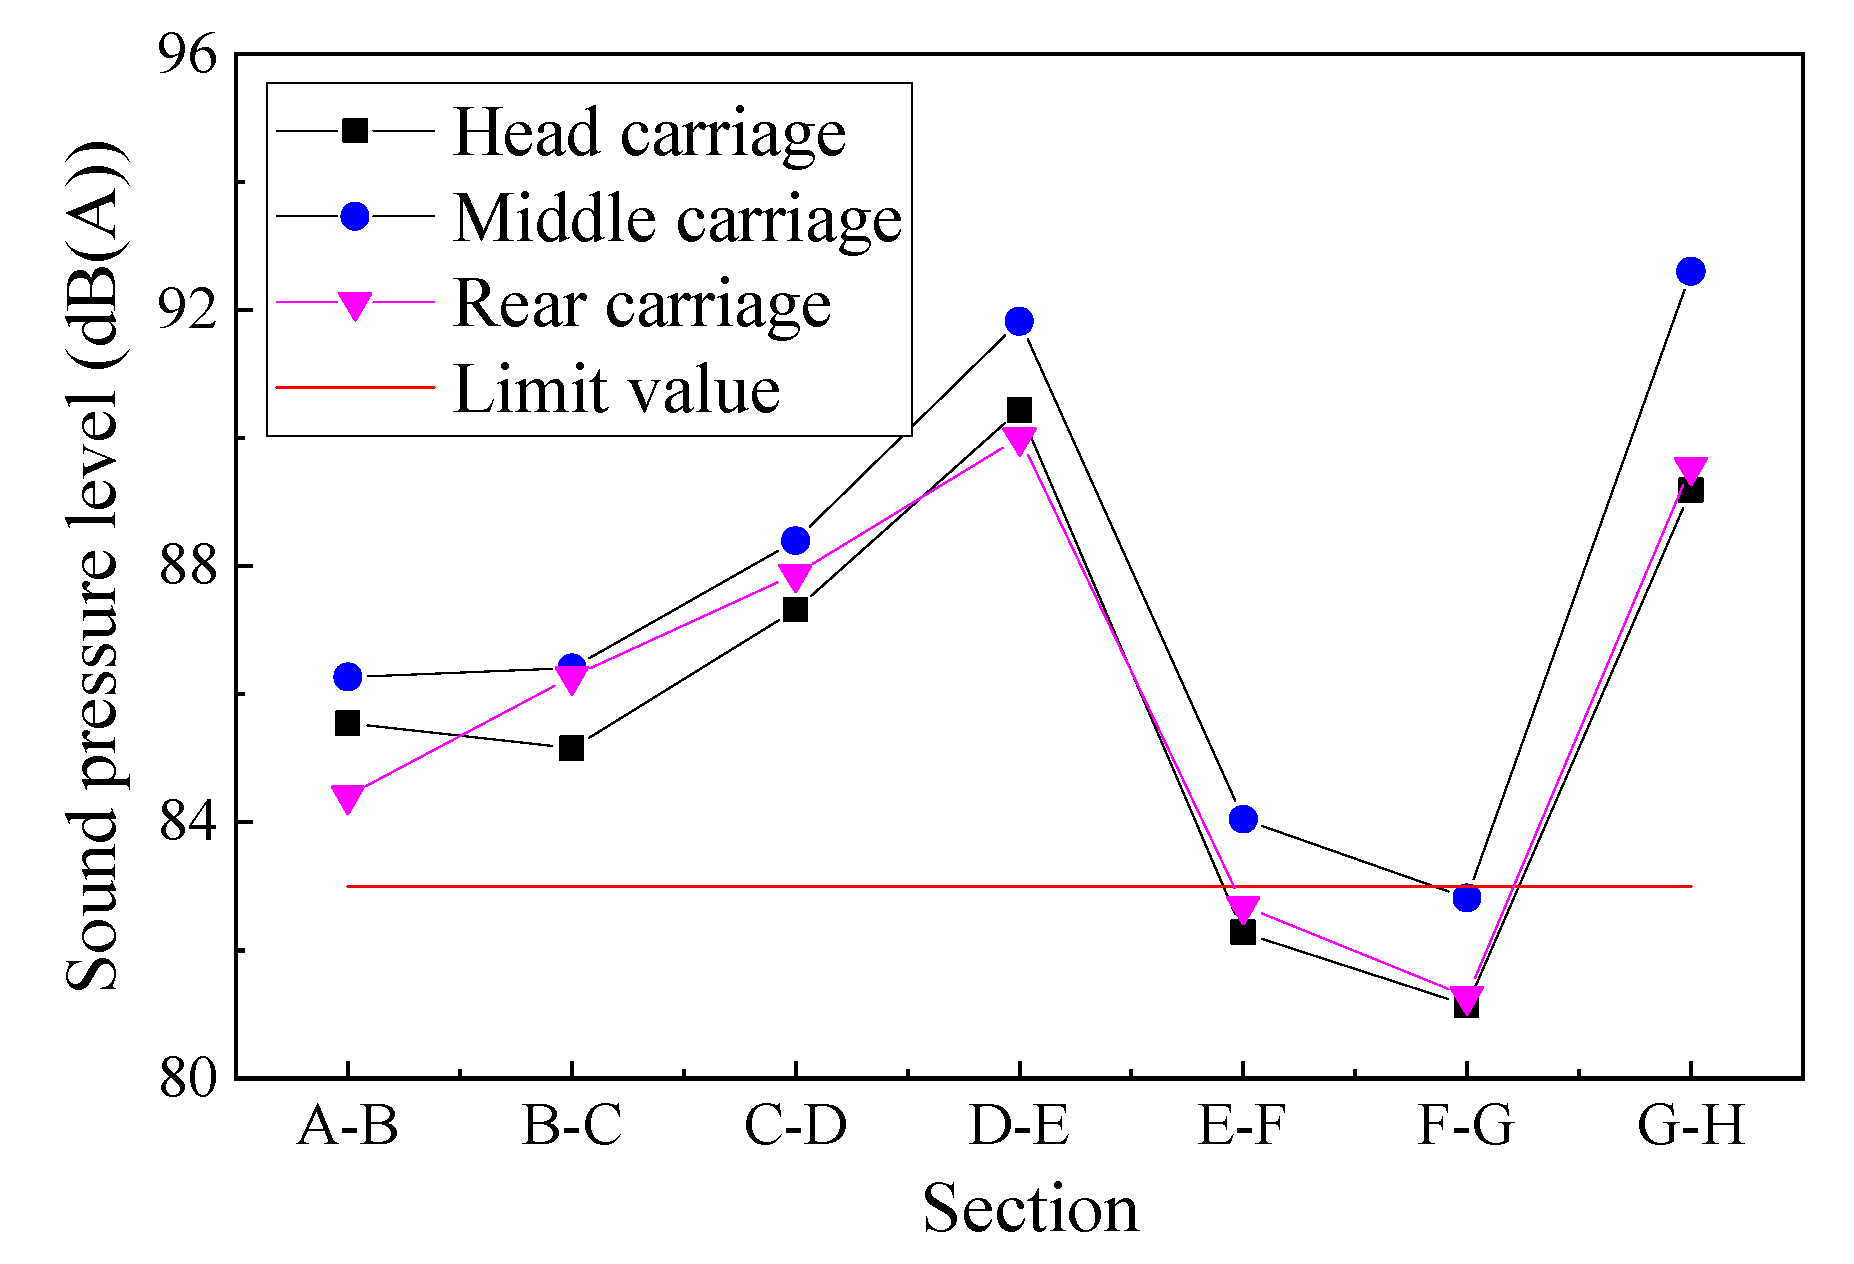
In order to eliminate the influence of passengers on the noise test results, the total value of the noise of three measuring points in the train during the off-peak period is calculated, and the results are shown in Figure 6. A–H sections refers to the seven sections with the most complaints from passengers. The train has higher speeds in these sections.
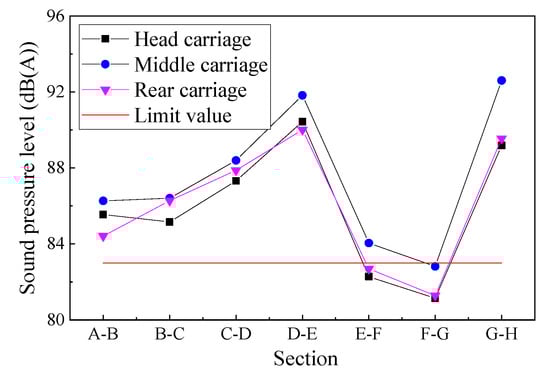
Figure 6.
Interior noise test results.
The measurement result of the interior noise is large, and there are many intervals exceeding the interior noise limit of 83 dB(A). Among them, the noise value of the middle carriage in D–E section reaches 91.8 dB(A). Since it is the same train and the number of passengers on the train does not change significantly, it indicates that the track status in the D–E interval is abnormal.
In addition, the sound pressure level of the middle carriage is slightly higher than that of the head and rear carriages, mainly because the metro train is composed of six motor cars and two trailers, the head and rear carriages are trailers, and the middle six carriages are motor cars. Therefore, the noise source of the middle carriage is more than that in the head and rear carriages, resulting in a slightly larger noise value in the middle carriage. In order to analyze the noise test results more effectively, the subsequent noise test and data analysis in this paper all focus on the middle carriage.
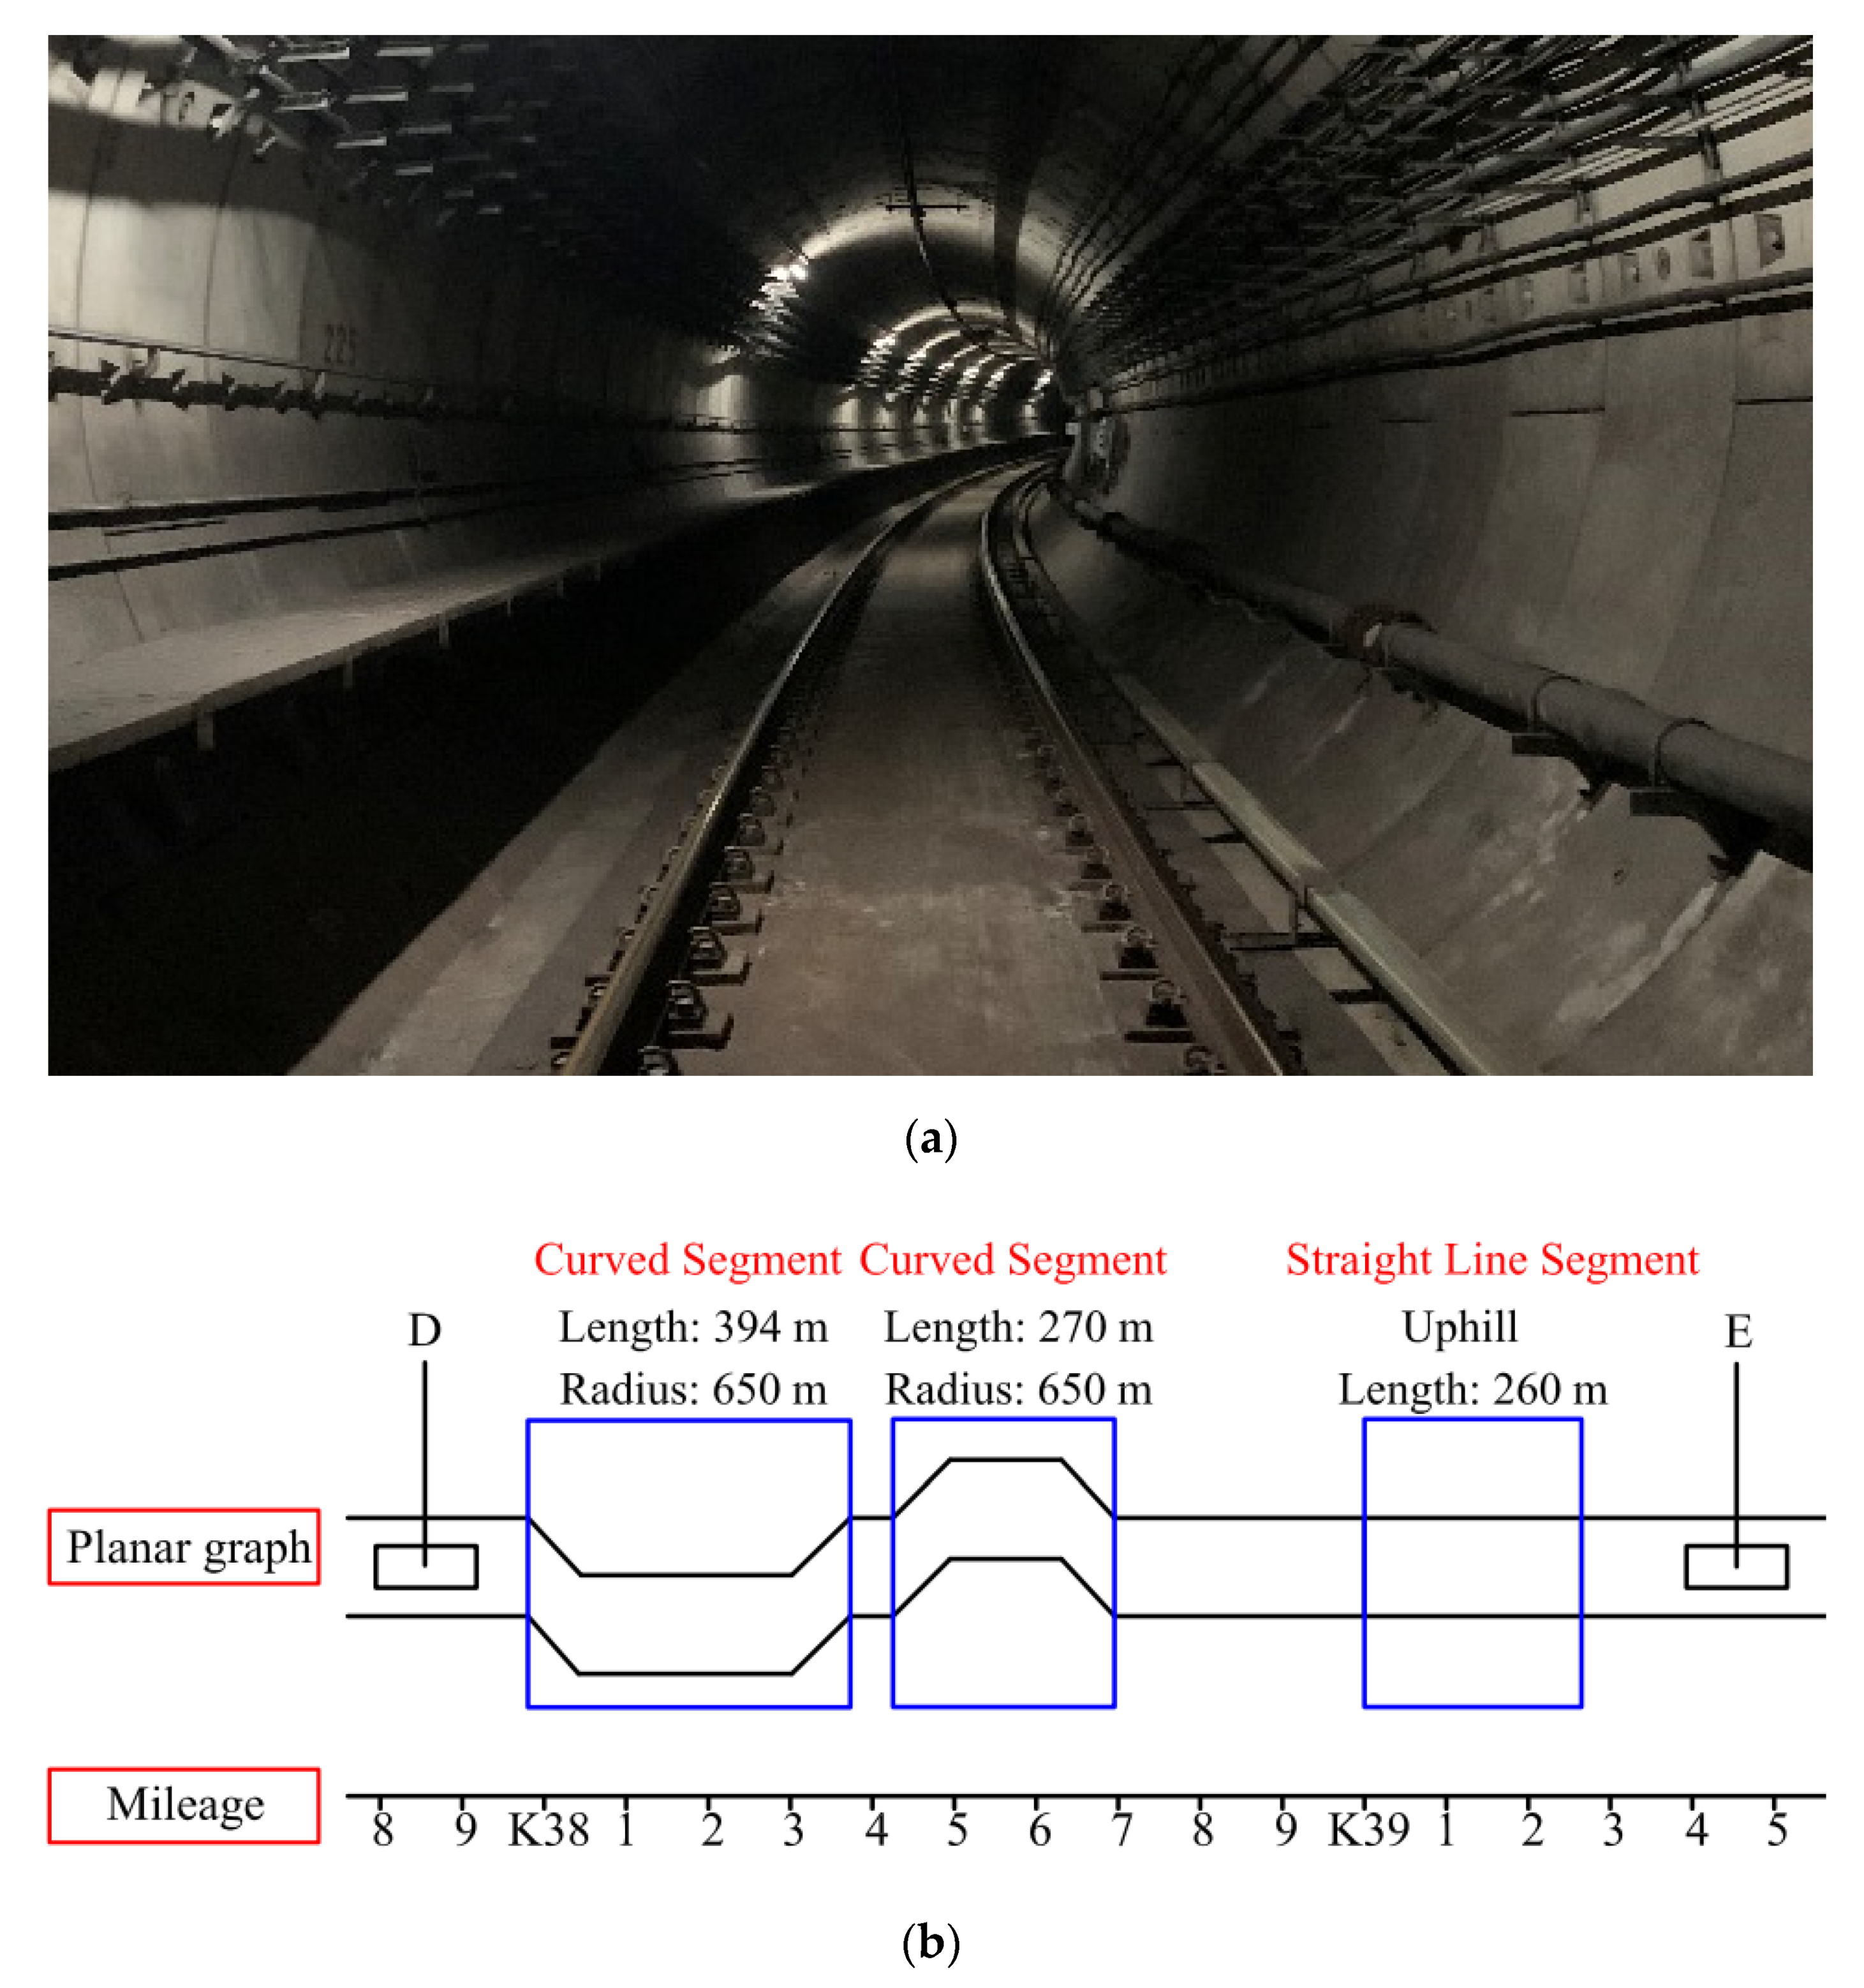
According to the noise test results, the noise in the vehicle between D–E section is relatively large. In order to discover the reason for the excessive noise in this section, the situation of the section line was investigated. The section adopts the structure of the monolithic track bed with the DTVI2 fastener and has a total length of 1600 m. There are two curved segments and one uphill segment. The tunnel adopts the form of circular section. The inner diameter of the tunnel is 5.4 m and the outer diameter is 6 m. The specific conditions of the section are shown in Figure 7.
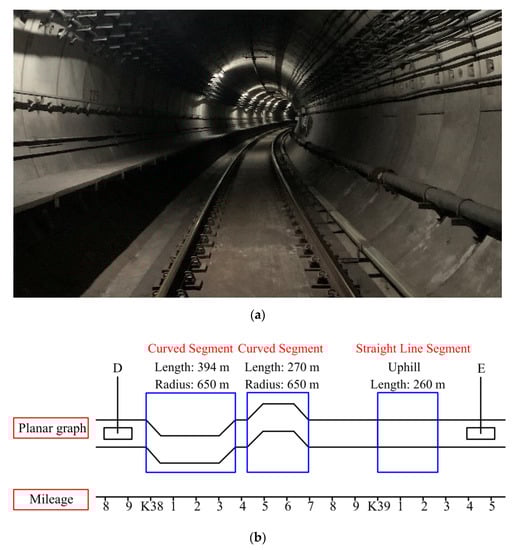
Figure 7.
Line situation of D–E section. (a) Tunnel section form, (b) Line planar graph.
The time-varying sound pressure level of the test results in this interval is analyzed, as shown in Figure 8. The interior noise increases gradually in 0~15 s, and the train is speeding up at this time. The interior noise does not continue to increase and the train runs smoothly in 15~20 s. According to the field investigation, when the train is running on the curve, the interior noise increases significantly and fluctuates greatly in 20~55 s, with the maximum increase in higher than 25 dB(A). The interior noise also increases significantly in 60~70 s. This is because, when the train is traveling uphill in a straight line, the wheel–rail contact relationship changes and wheel–rail creep force increases. Hence, the serious overrun of interior noise in the D–E area is mainly due to the abnormal increase in interior noise in 20~55 s.
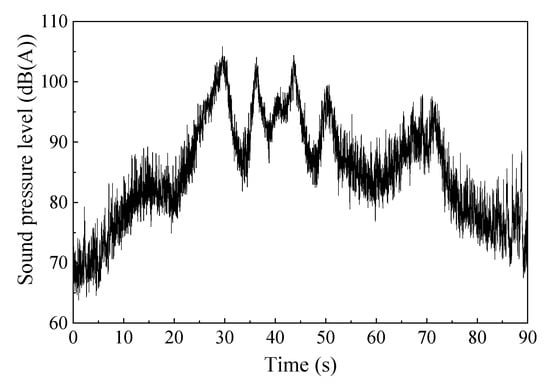
Figure 8.
Time-varying sound pressure level of interior noise in D–E section.
4. Analysis of the Influence of Rail Corrugation on Interior Noise
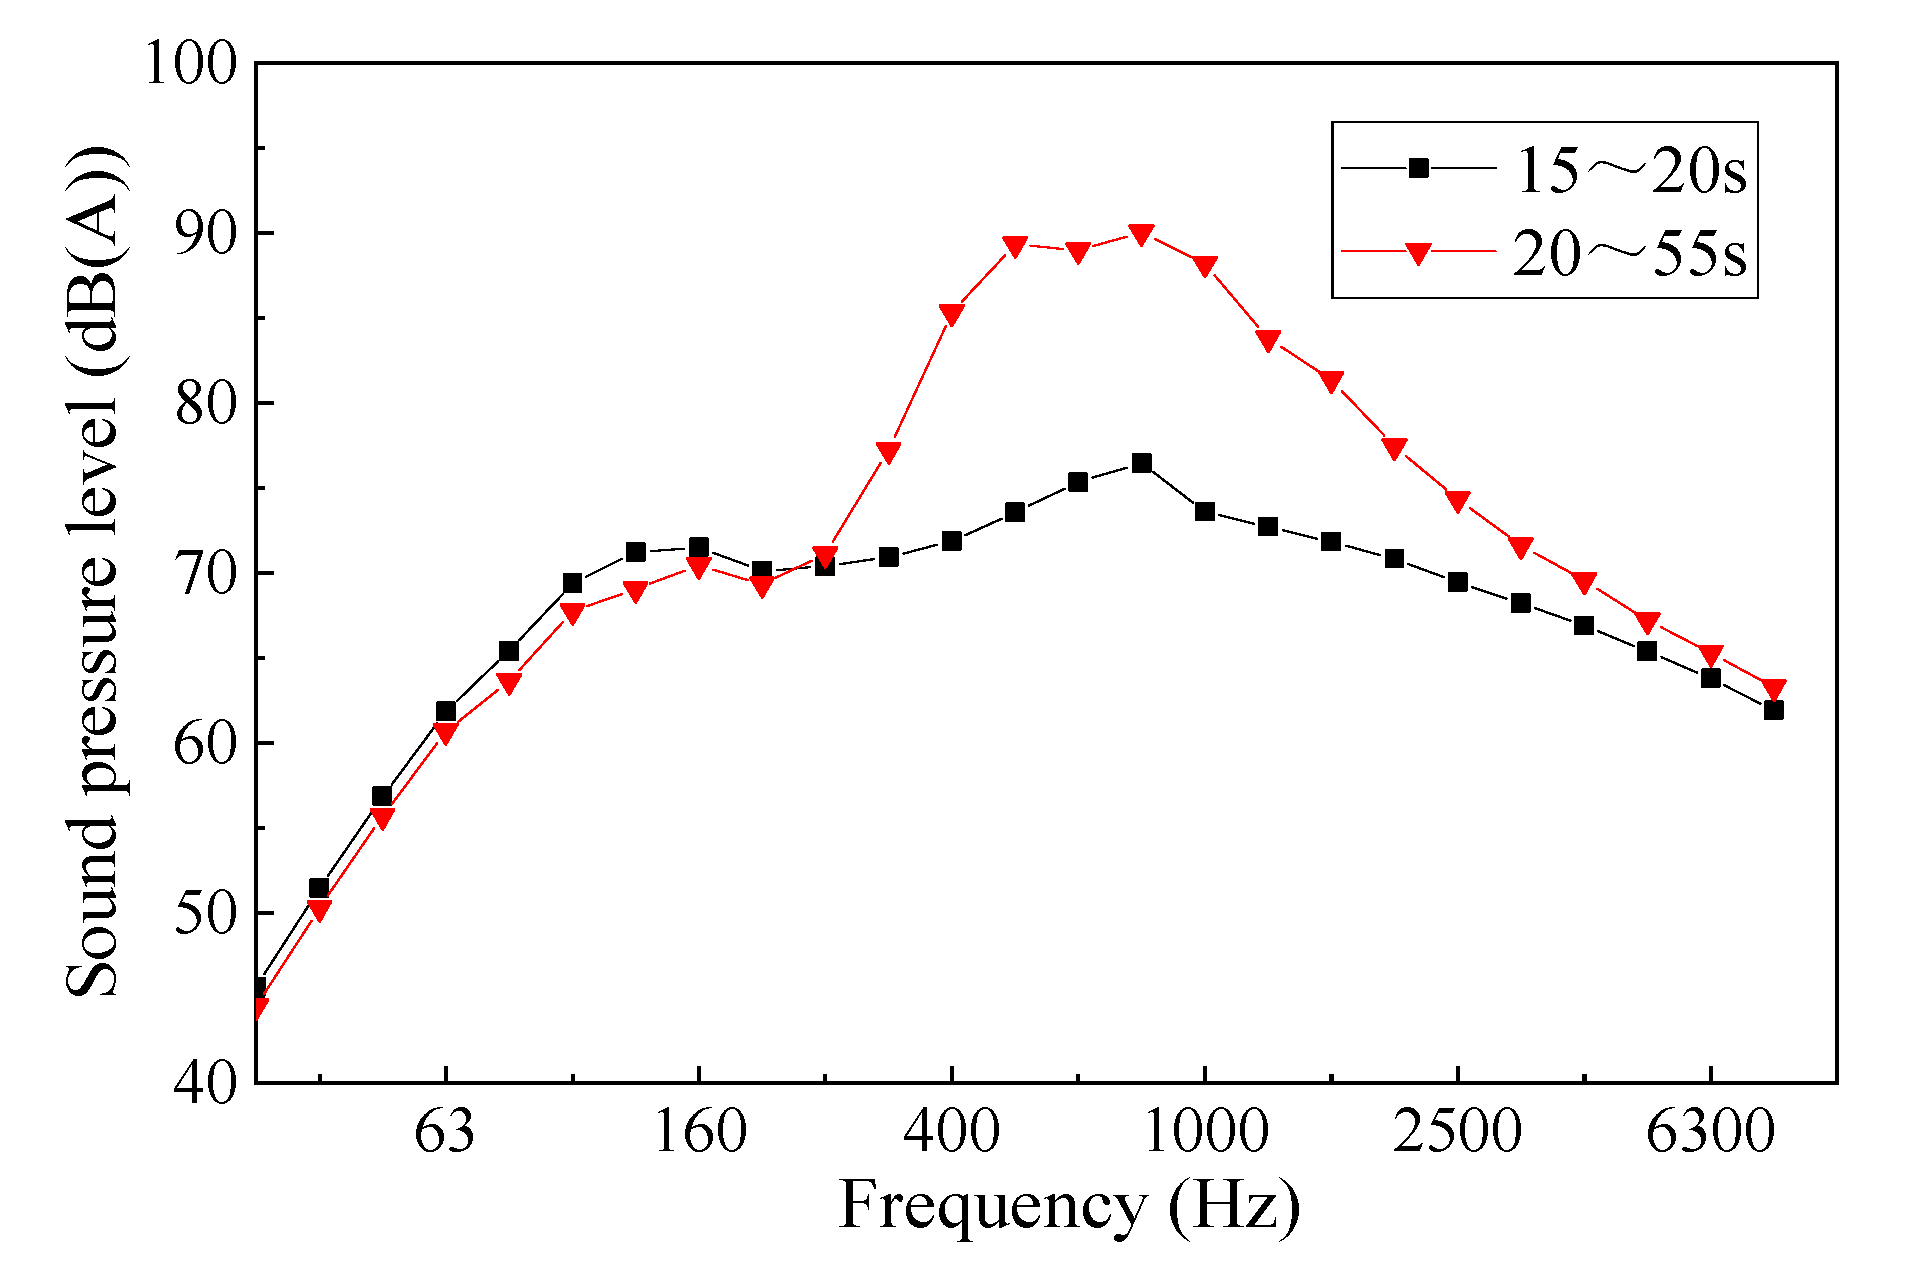
In order to explore the causes of the abnormal increase in interior noise in 20~55 s, the frequency domain analysis of interior noise in D–E area is carried out. It can be seen from Figure 8 that the train is running at a constant speed in 15~20 s, and the interior noise does not increase significantly. As can be seen from Figure 9, the sound pressure level in 15~20 s is lower, and there is no obvious peak frequency, indicating that the wheel–rail contact is effective in this period, while the sound pressure level of 20~55 s is higher in the frequency of 400~1000 Hz. According to the principle of noise superposition, if two sound sources with a sound pressure level difference of more than 10 dB(A) are superimposed, the total sound pressure level is approximately equal to that of the larger sound source. Therefore, the noise of 400~1000 Hz is the main reason for the abnormal interior noise. According to the existing research, the noise in this frequency mainly comes from the wheel–rail noise.
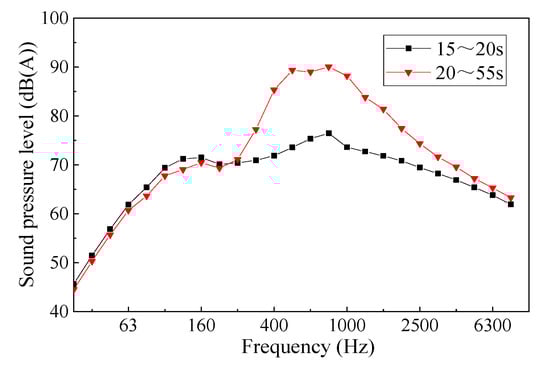
Figure 9.
Frequency domain diagram of interior noise in D–E section.
Therefore, in order to explore the reasons for the abnormal increase in the noise during testing time, and to study whether rail corrugation is the main reason for the abnormal noise in the train, the rail corrugation in the section that the train passes through was tested.
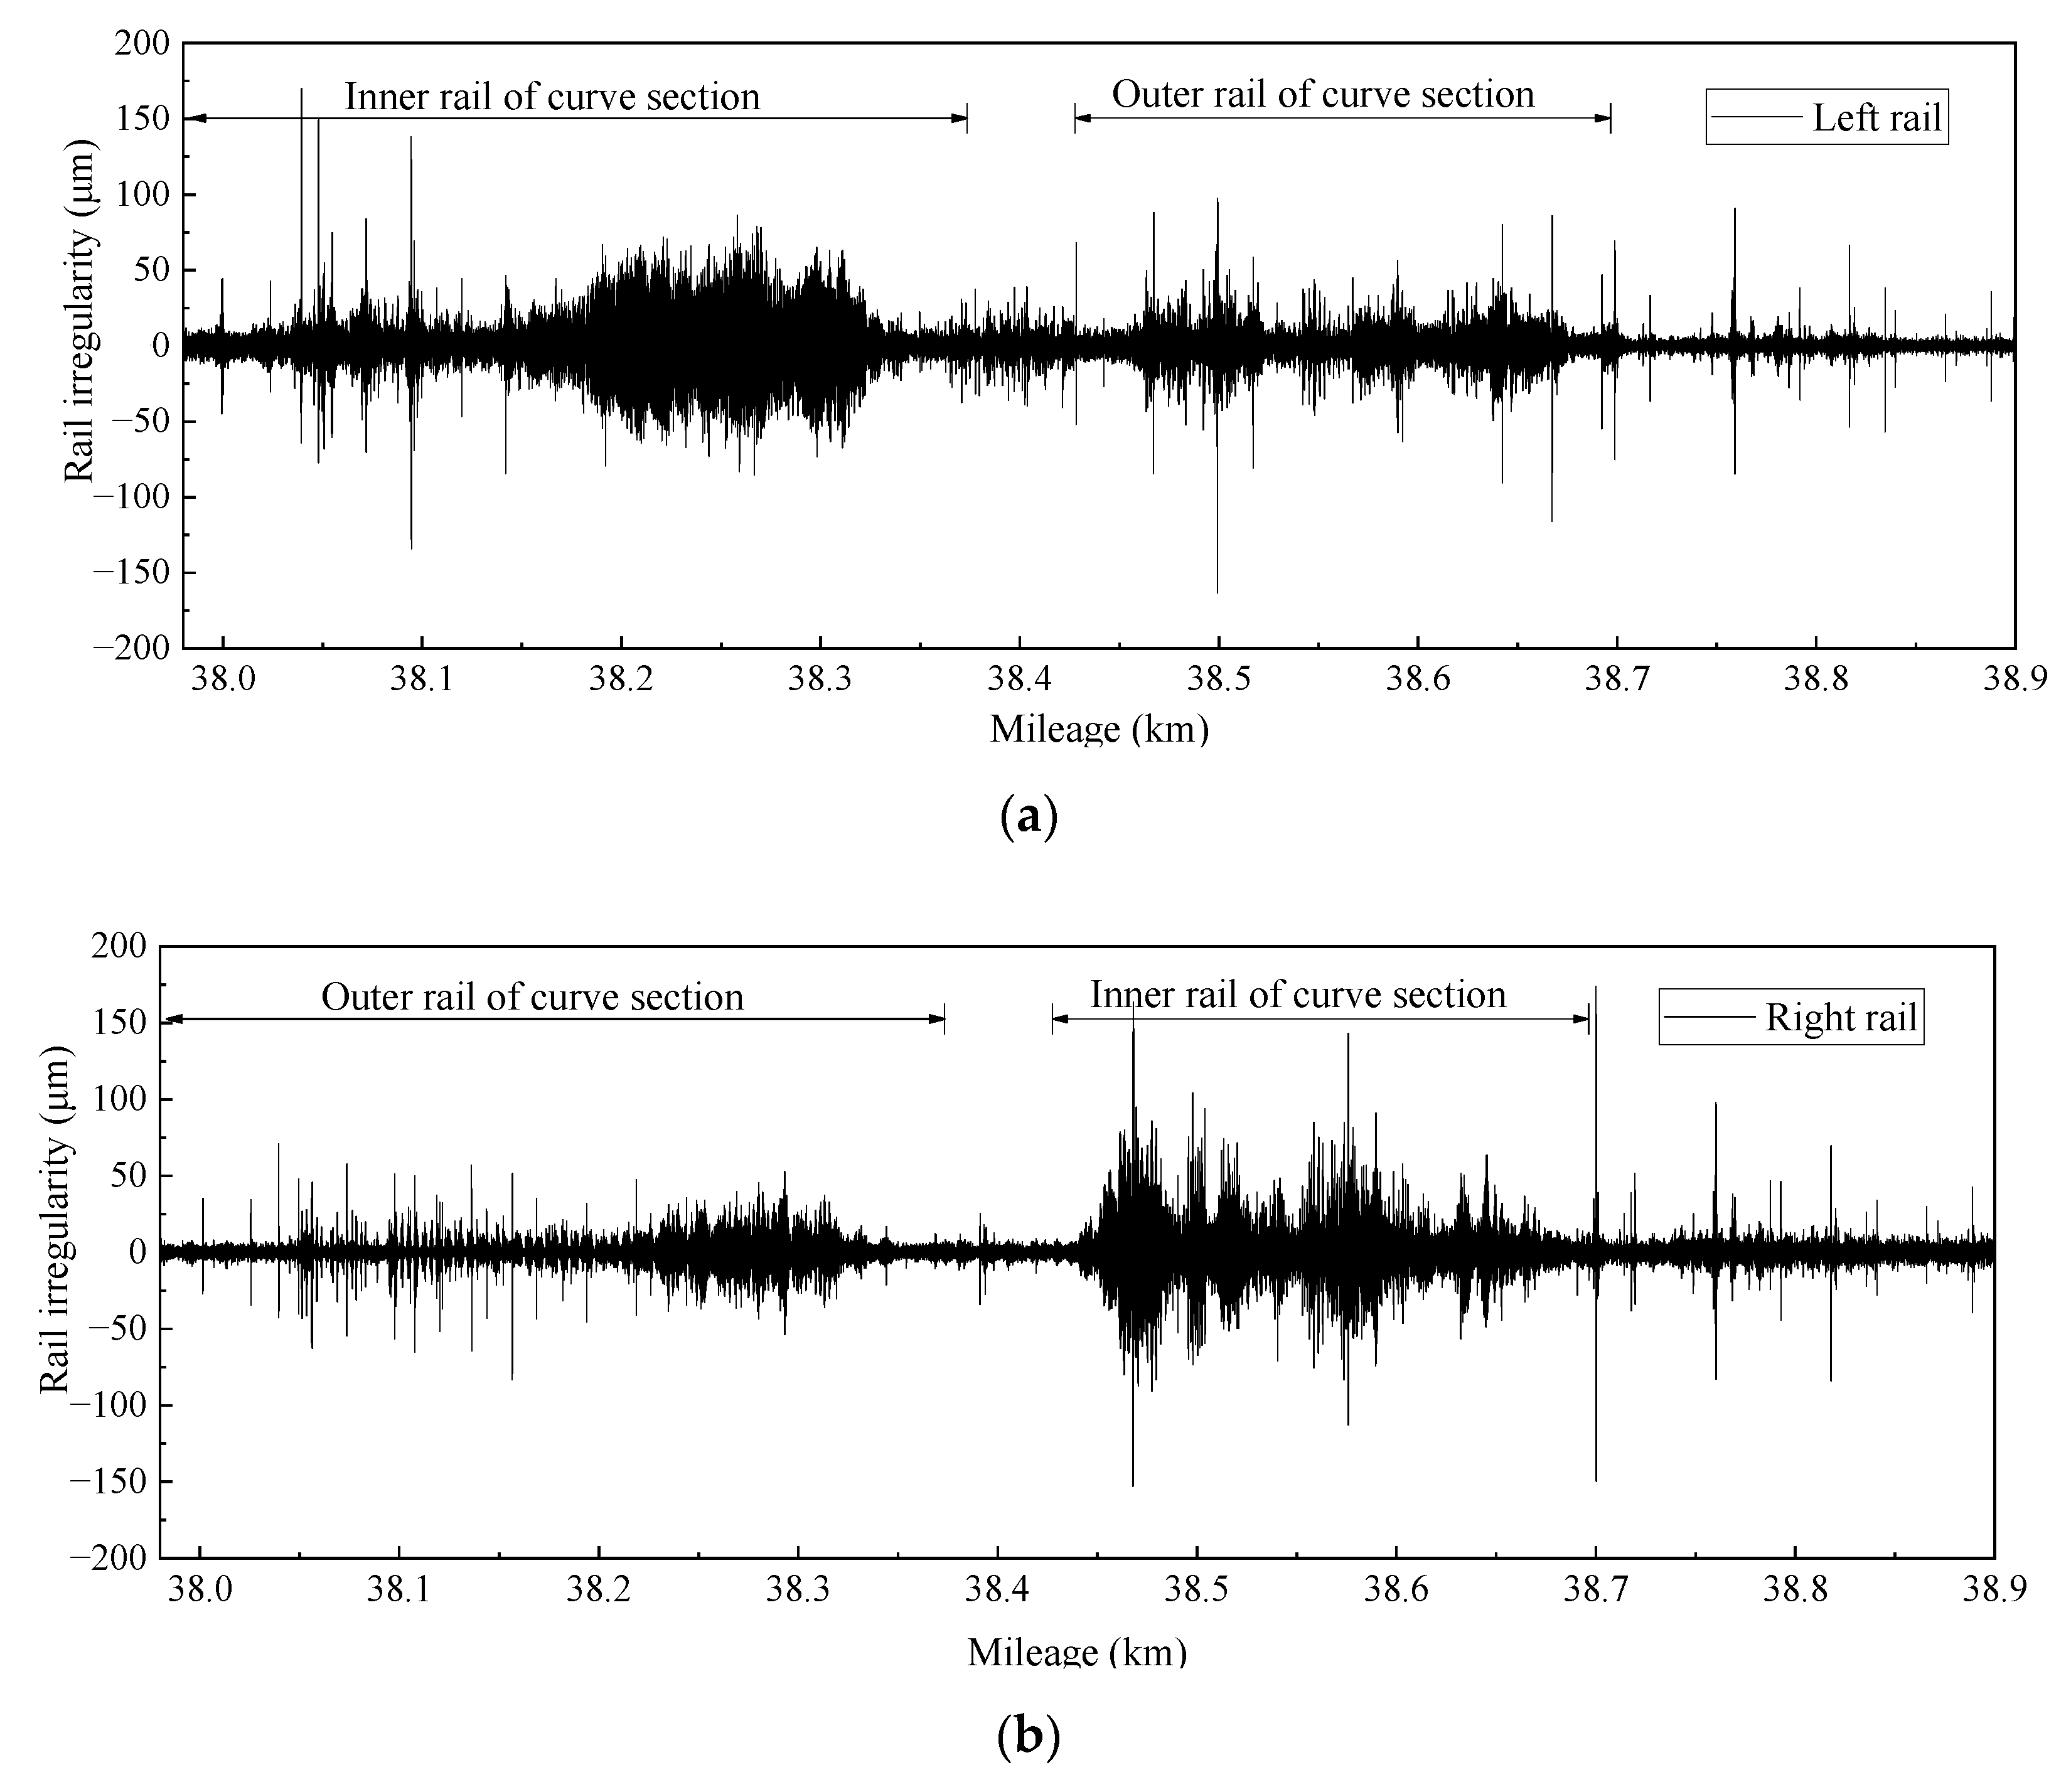
As can be seen from Figure 10, the rail corrugation of the curve section in this section is very serious, and the corrugation of the inner rail is more serious than that of the outer rail.

Figure 10.
Rail corrugation condition in D–E section: (a) Left rail, (b) Right rail.
According to the results of the noise analysis (Figure 8), when the train operates on the curve for 20~55 s, the noise inside the train increases abnormally, which corresponds to the test results for corrugation.
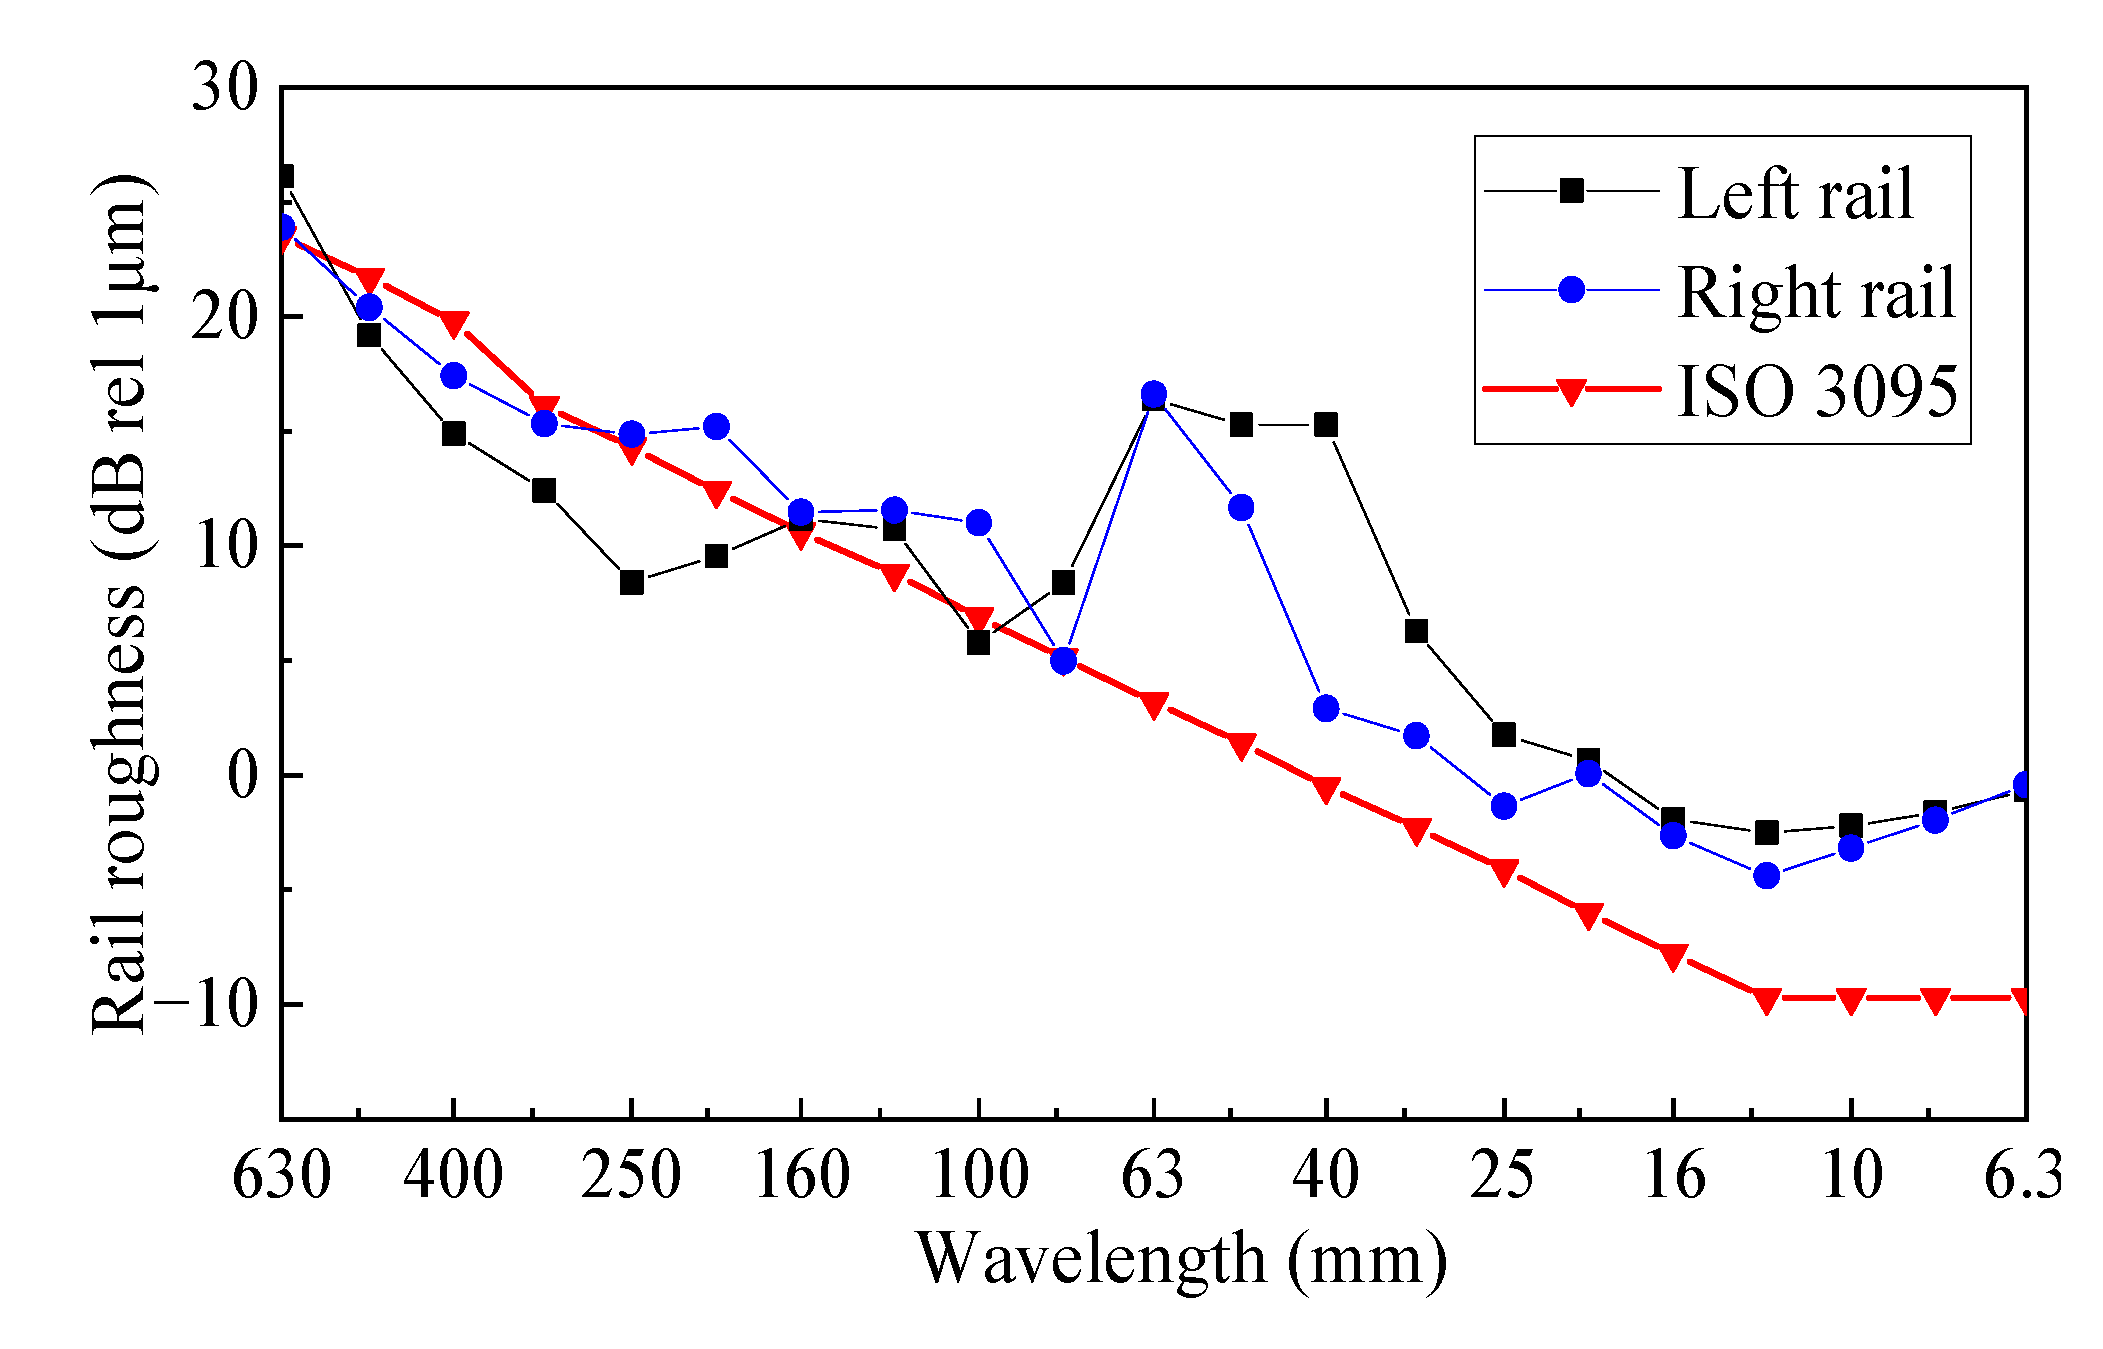
To obtain the rail roughness, the rail irregularity results obtained in Figure 10 are analyzed by a wavelength spectrum and calculated according to Formula (2). The calculation formula of rail roughness is as follows:
where is the rail roughness, dB; is the amplitude of rail surface irregularity, μm; r0 is the reference value of rail surface irregularity, μm.
As shown in Figure 11, the rail roughness of 31.5~63 mm wavelength exceeds the limit specified in the standard. Therefore, there is a clear rail corrugation of 31.5~63 mm in this section.
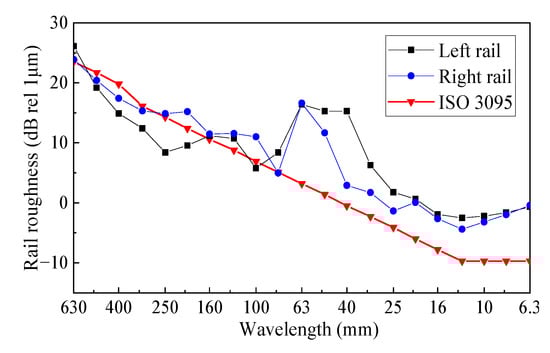
Figure 11.
One-third octave diagram of rail irregularity in D–E section.
The calculation formula of wheel–rail vibration frequency caused by rail corrugation is as follows:
where is the passing frequency of rail corrugation, Hz; is the train speed, km/h; and is the main wavelength of rail corrugation, mm.
According to Formula (3), combined with the train speed of 85 km/h, the frequency of the train passing through 31.5~63 mm rail corrugation is between 375 Hz and 750 Hz, which is essentially consistent with the main frequency of noise inside the train.
To further investigate the influence of rail corrugation on interior noise, the corrugation of two curves in the test section is analyzed. According to EN 13231-3:2006 [31], the peak-to-peak average value of rail irregularity in the section is calculated (see Figure 12).
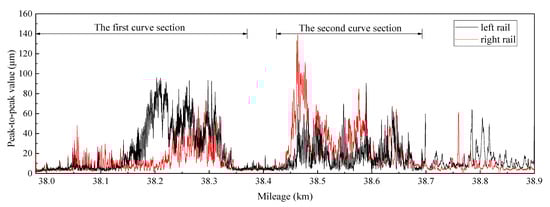
Figure 12.
Peak-to-peak value of rail irregularity.
The peak-to-peak average value of rail irregularity in the first curve is 24.4 μm for the left rail (inner rail) and 12.5 μm for the right rail (outer rail). The peak-to-peak average value of rail irregularity in the second curve is 16.6 μm for the left rail (outer rail) and 29.8 μm for the right rail (inner rail). The rail irregularity of the inner rail is more serious than that of the outer rail. Therefore, for this metro line, attention should be paid to the rail corrugation development in the inner rail of the curve segment in the future.
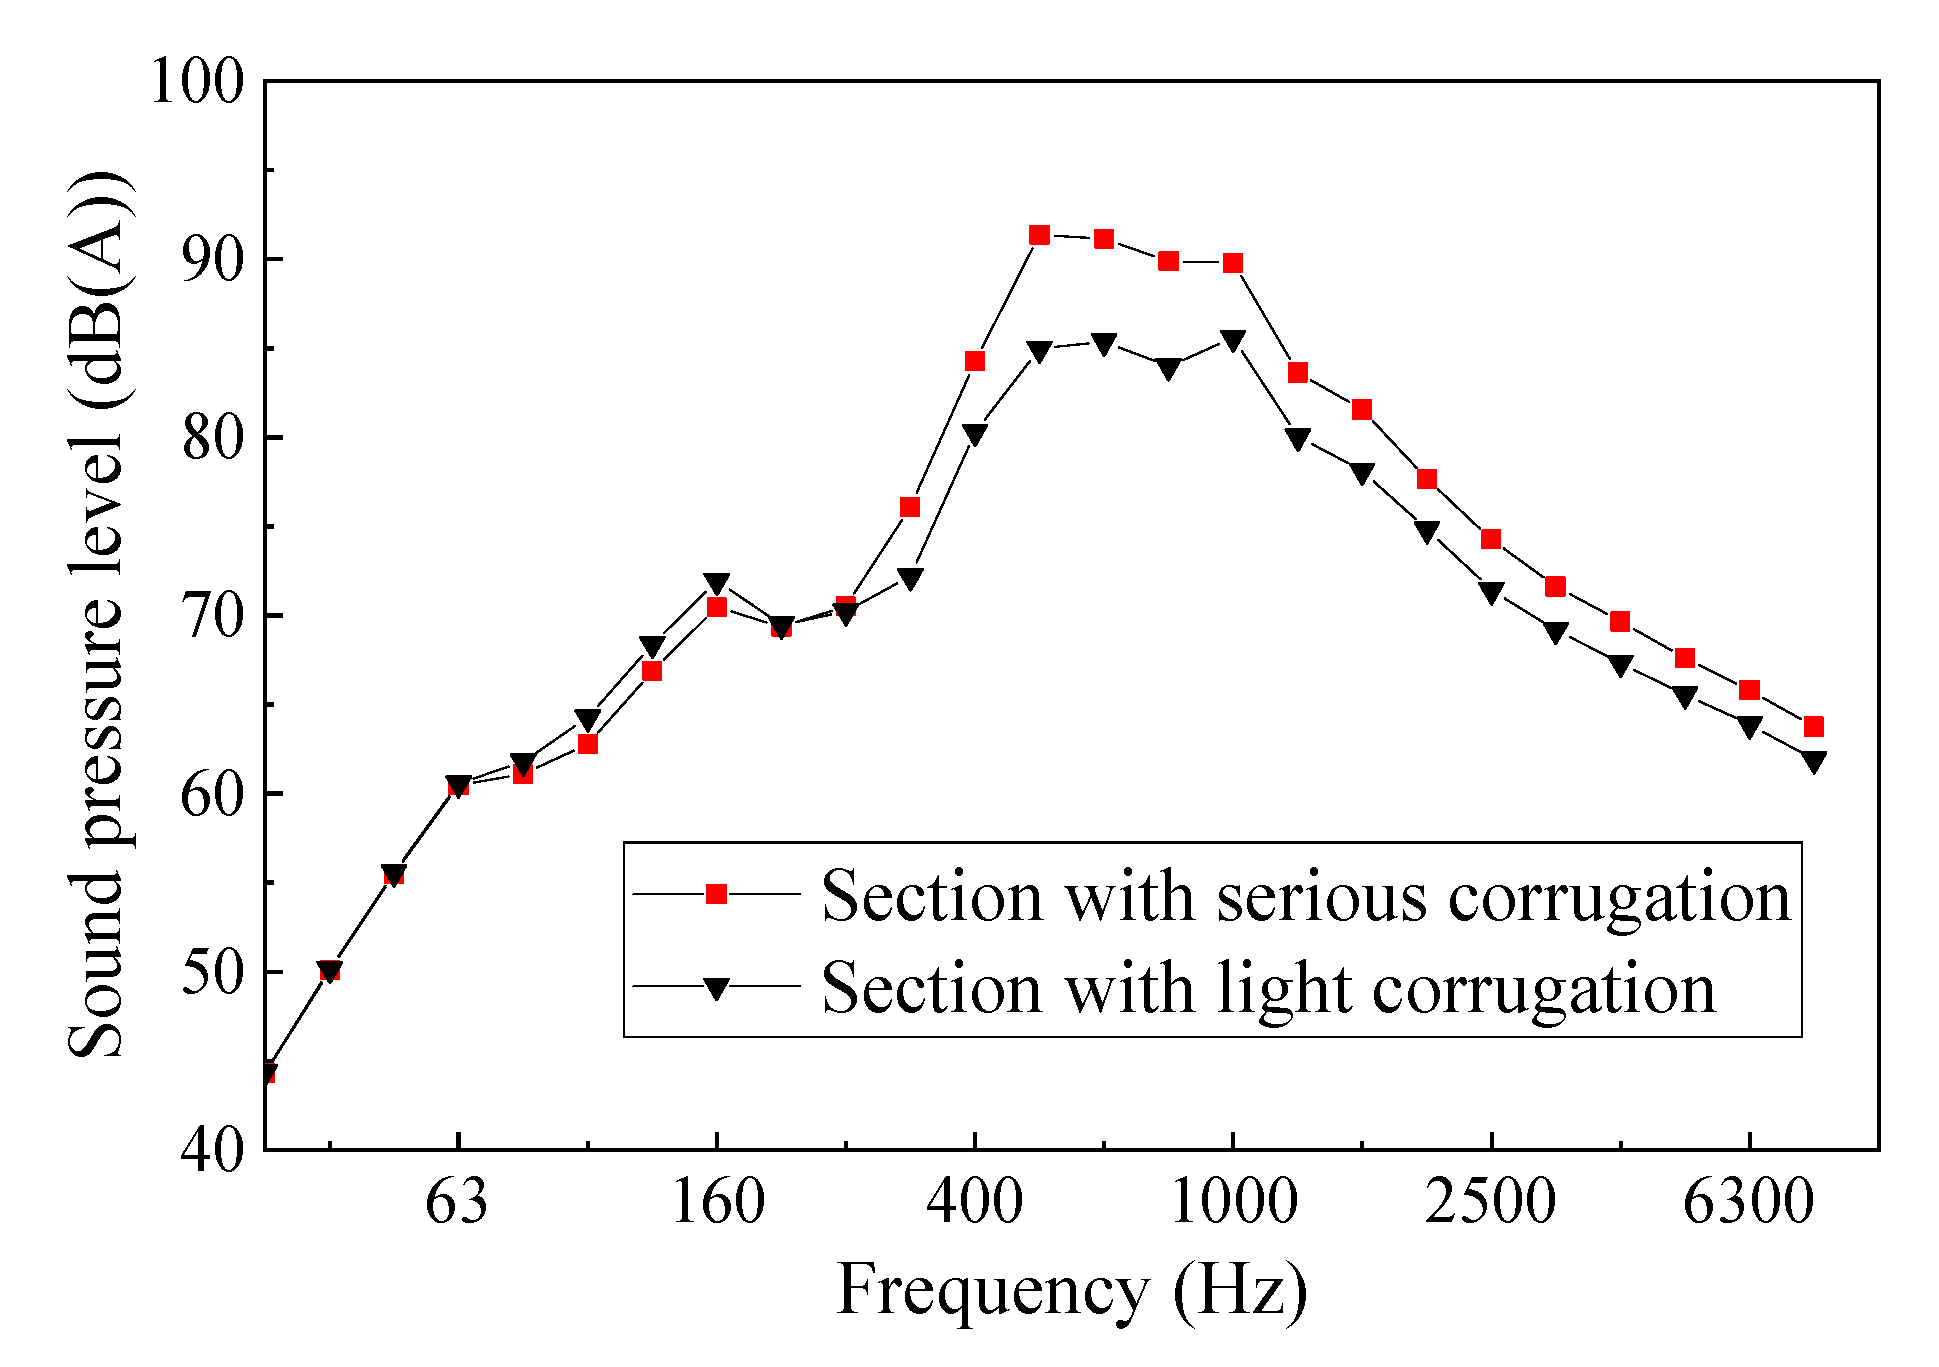
The interior noise of the two curve segments is analyzed in the frequency domain. The rail corrugation in one section is serious and the rail corrugation in the other section is light. As shown in Figure 13, the equivalent A-level of the train interior noise is 97.4 dB(A) when the train passes the section with serious corrugation, and it is 92.1 dB(A) when the train passes the section with light corrugation. There is a clear difference between these results in the frequency range from 400~800 Hz, which is essentially consistent with the wheel vibration frequency corresponding to the main wavelength of 31.5~63 mm.

Figure 13.
Influence of different degrees of rail corrugation on interior noise.
Since the same train passes through these two segments successively, the wheel, track type and the number of passengers on the train are the same, and the noise in the serious rail corrugation segment is much greater than that of the light rail corrugation segment. It is further confirmed that rail corrugation is the main reason for the abnormal noise in the vehicle.
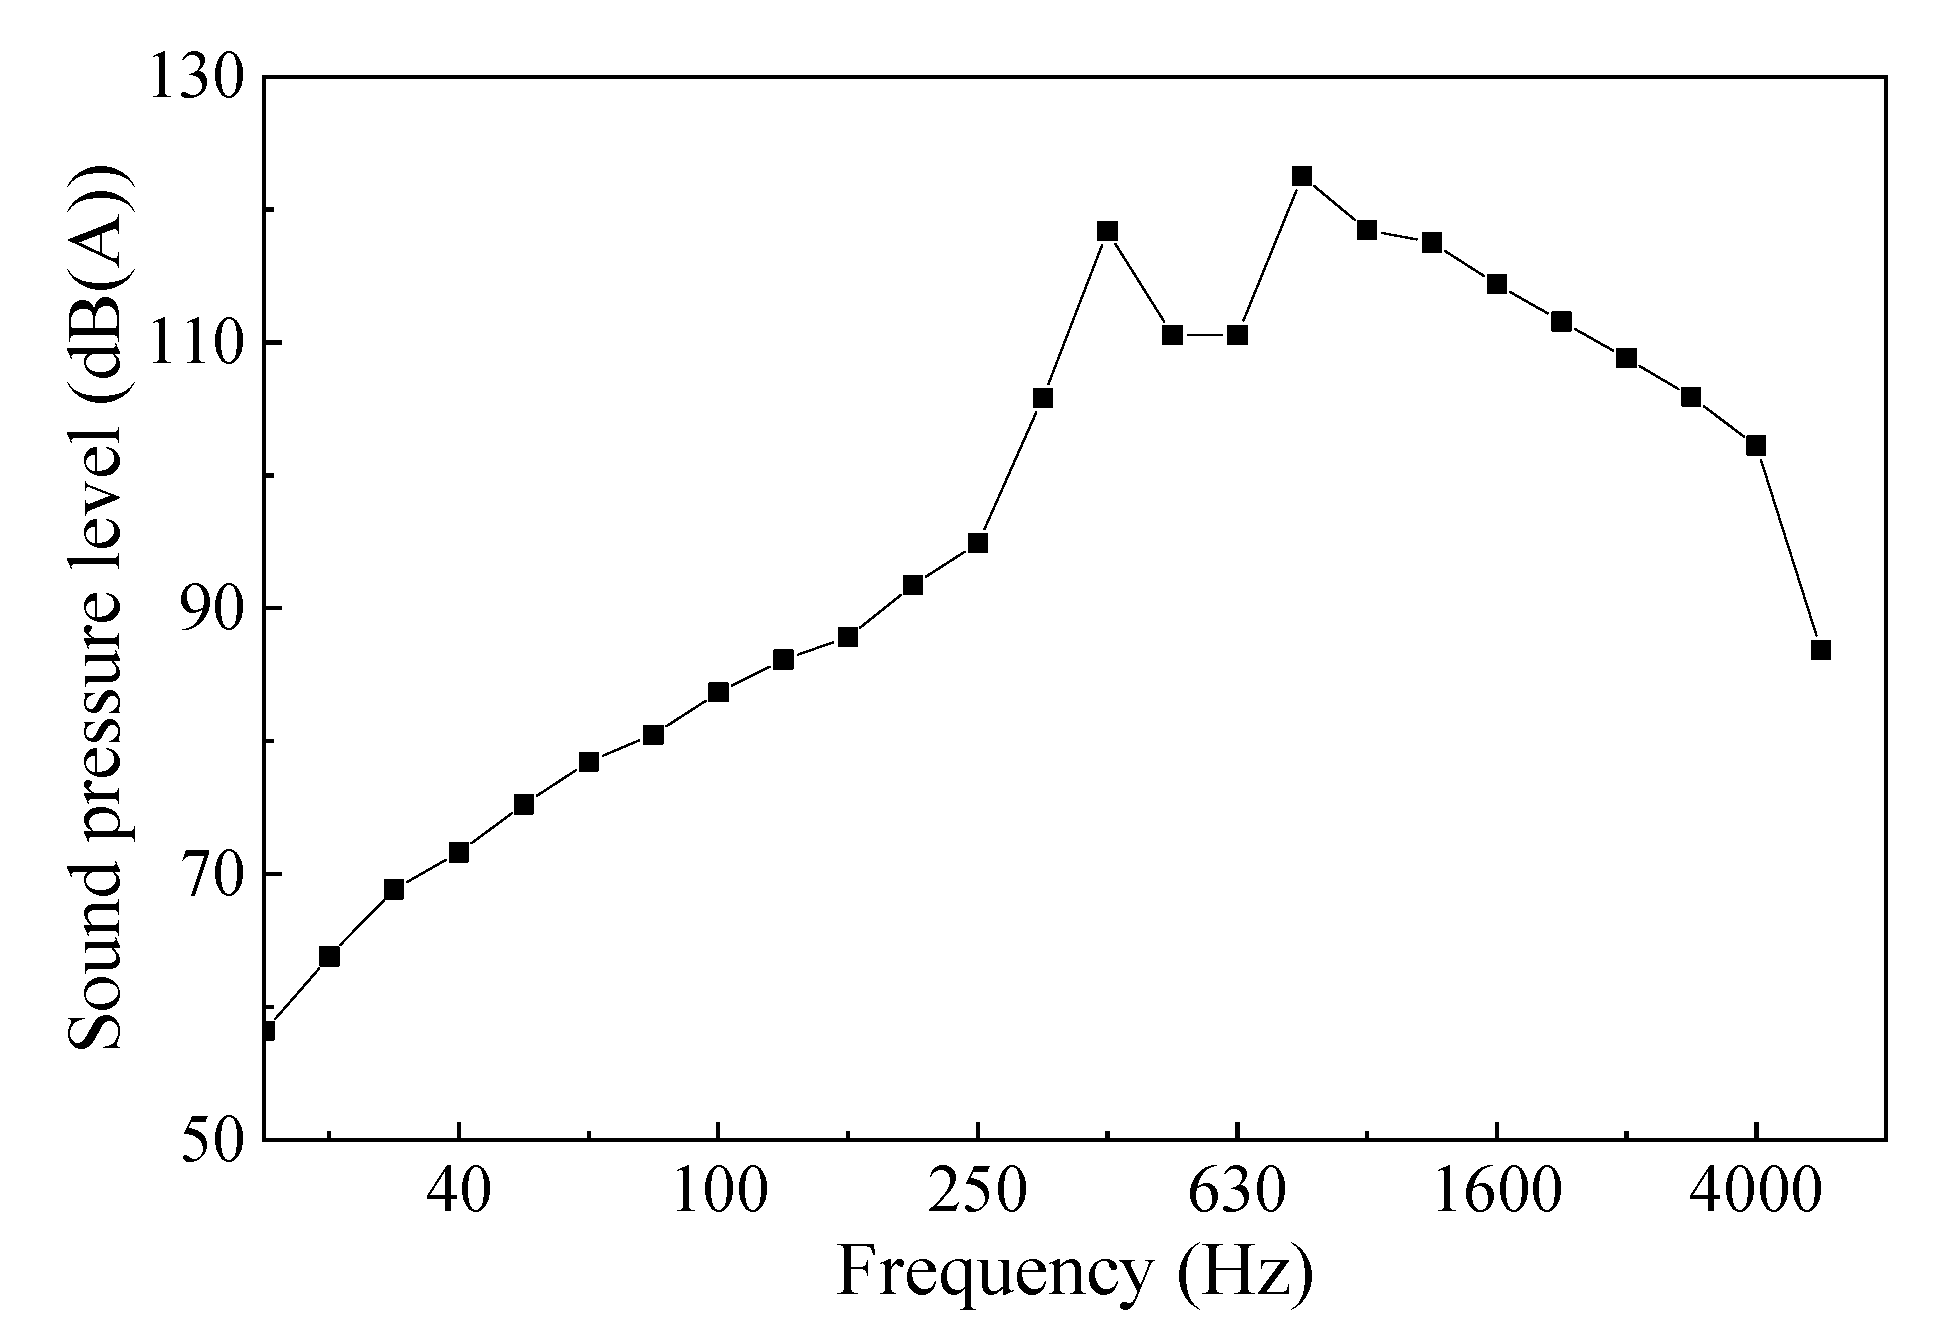
In order to further explore the influence of rail corrugation, a sound pressure sensor was placed near the track in the area of serious corrugation, and the wheel–rail noise during train operation was measured. As shown in Figure 14, the frequency analysis of wheel rail noise during the train passing could be carried out. The equivalent value of wheel rail noise can be calculated.
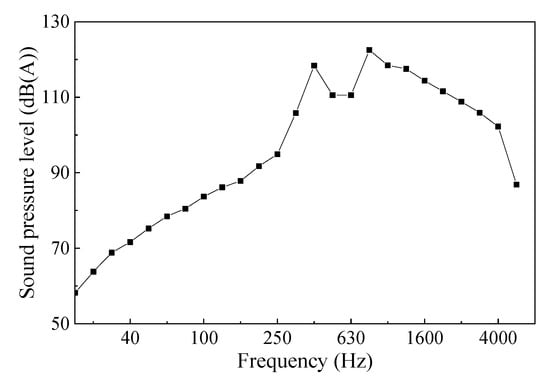
Figure 14.
Wheel–rail noise test results.
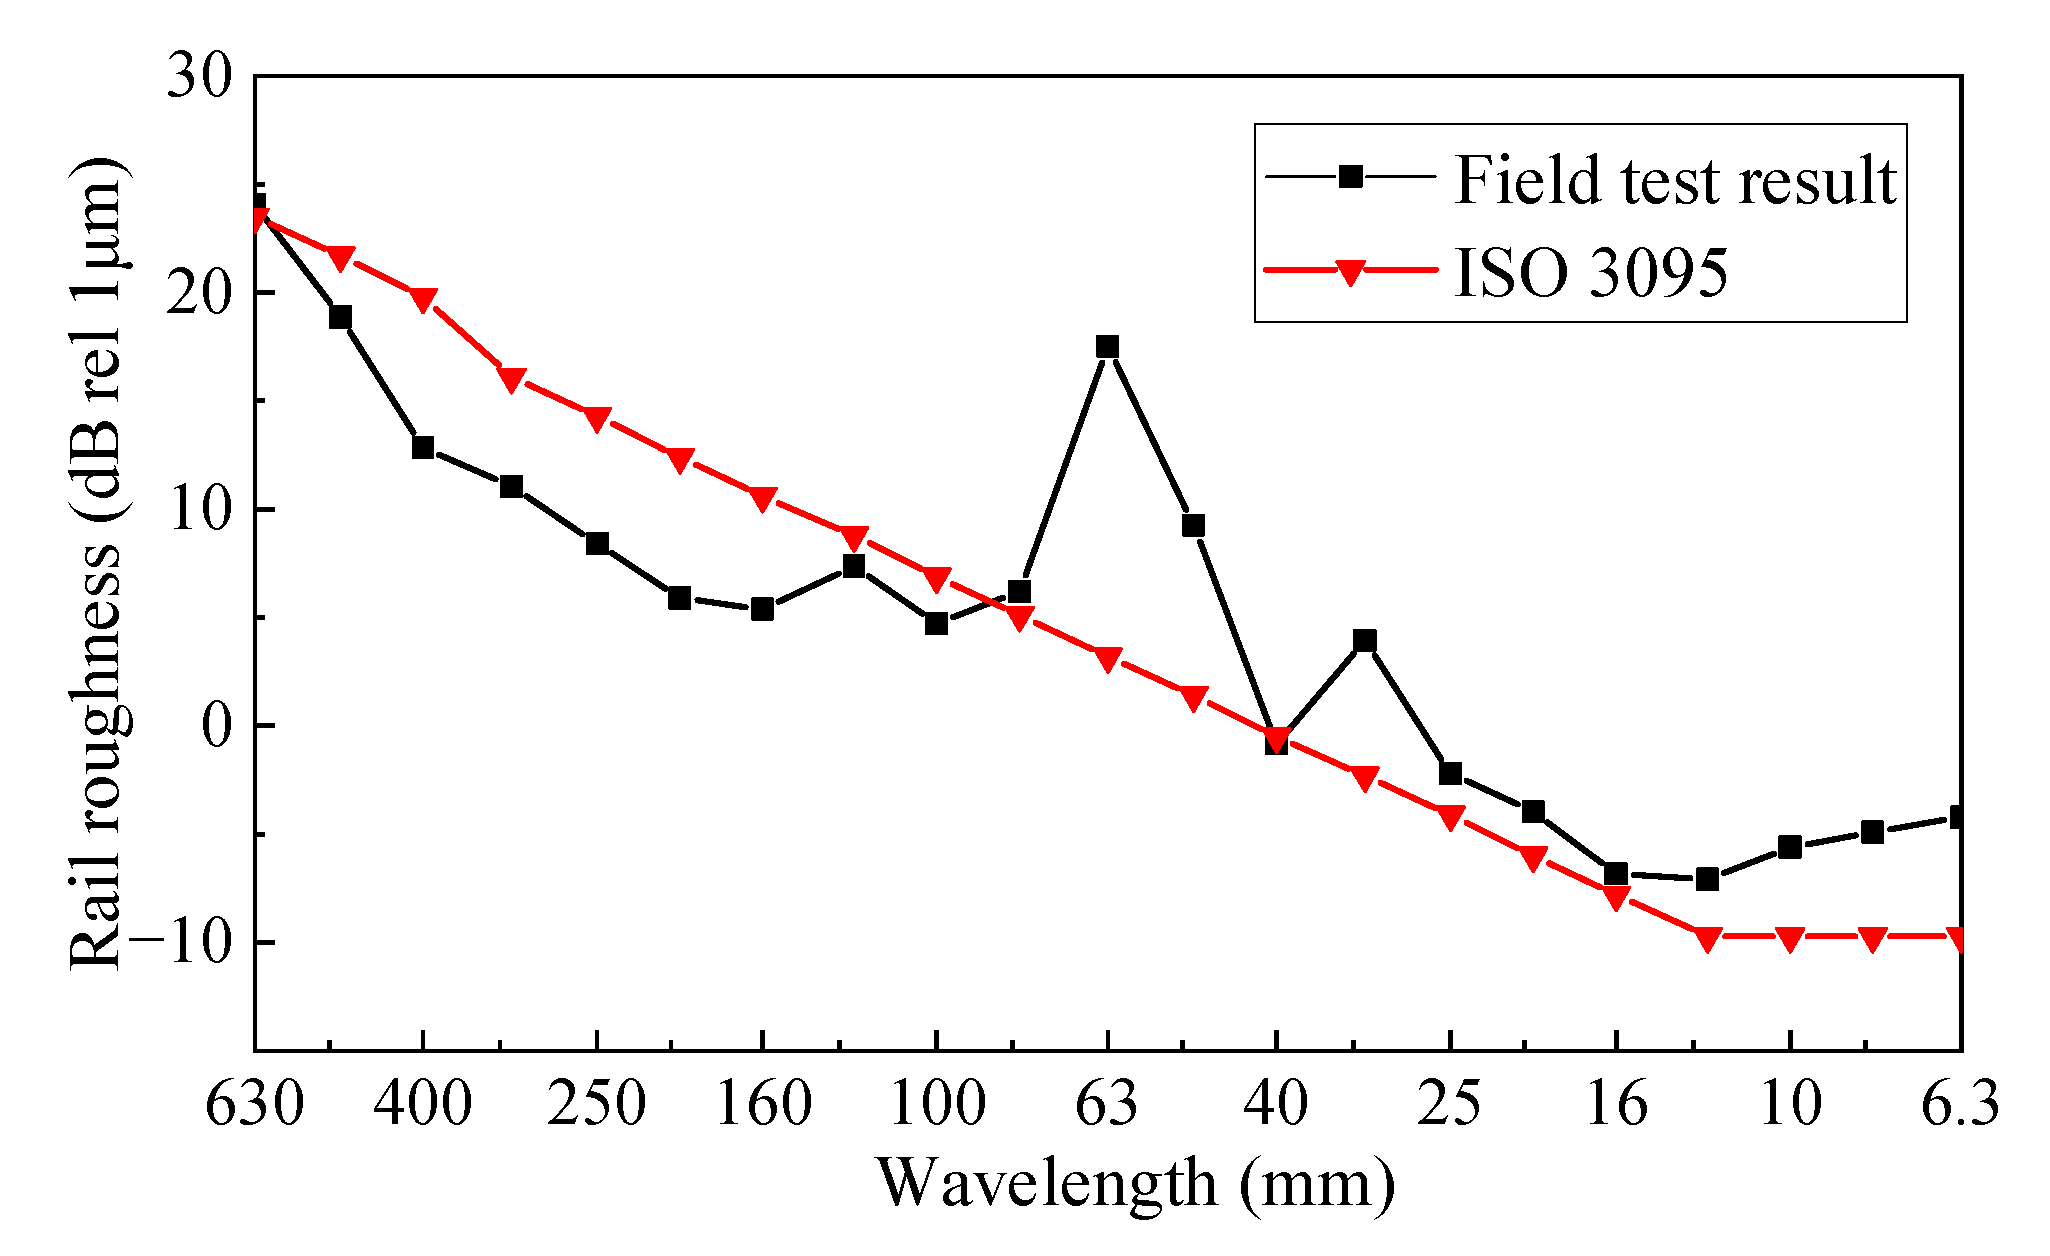
The frequency domain diagram indicates that the sound pressure level of wheel rail noise is higher in the frequency band of 400~1600 Hz, and there are peaks at 400 Hz and 800 Hz. It can be seen from Figure 15 that the characteristic wavelengths of rail corrugation in this curve segment are 31.5 mm and 63 mm, and the roughness level of the short wavelength part exceeds the limit value of ISO 3095 [32]. The speed of the train is 85 km/h. According to the conversion relationship between rail corrugation and the corresponding frequency, when the train passes through the corrugation with the wavelength of 31.5 mm and 63 mm, the wheel–rail vibration with the frequency of 750 Hz and 375 Hz is produced, which is essentially consistent with the peak frequency of the wheel–rail noise obtained from the test. Therefore, rail corrugation can cause the wheel–rail vibration noise to intensify, resulting in a significant increase in the noise transmitted to the interior of the train.
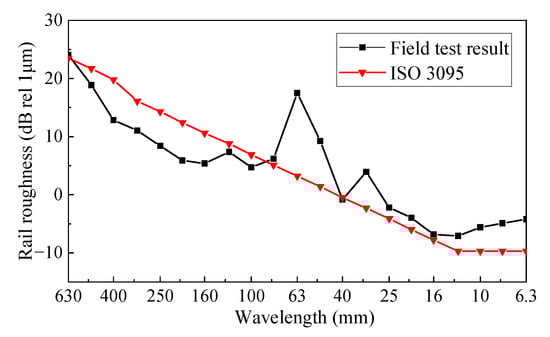
Figure 15.
One-third octave diagram of rail irregularity in test section.
5. Analysis of Interior Noise after Rail Corrugation Treatment
According to the above analysis, it is found that the 30~63 mm short wavelength corrugation is the main factor that causes the abnormal interior noise in this section; therefore, slowing down or restraining the development of short-wavelength rail corrugation is the most effective way to control the interior noise.
At present, the treatment measures for rail corrugation include rail grinding, rail head hardening, the use of a friction regulator, adjustment of track stiffness, installation of rail damper, etc. [33,34,35,36,37,38]. In this work, measures such as adjusting the track stiffness and rail grinding were taken, respectively, and the results of interior noise after treatments were analyzed, so as to obtain two kinds of treatment effect, and provide ideas for the treatment of rail corrugation in the future.
5.1. Analysis of Interior Noise after Track Stiffness Adjustment and Rail Grinding
The D–E section with serious interior noise was selected as the regulation section. After measurement, the lateral stiffness of the section was 9.8~11.3 kN/mm, less than the stiffness of other lines with no rail corrugation. Its capacity to maintain the gauge was poor; therefore, the lateral vibration of the rail could not be restrained effectively. It is evident from the literature [39,40] that the low lateral stiffness of the track is the direct cause of abnormal rail corrugation in the curve section. Therefore, the following measures were adopted to reconstruct the from K38 + 424 to K38 + 692 section with serious corrugation.
In the first treatment, the fasteners were replaced. The DTVI2 fasteners were replaced with Spring clip-Ⅱ fasteners, which could enhance the gauge keeping capacity. After the treatment, the vertical static stiffness of the track had little change, while the lateral static stiffness improved significantly, and increased to 13.1~14.2 kN/mm. The second treatment was to grind the rail after the first treatment.
The line condition before and after treatments is shown in Figure 16.
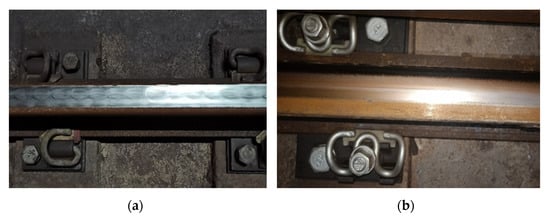
Figure 16.
Metro line condition before and after the treatments. (a) Before the treatments, (b) After the treatments.
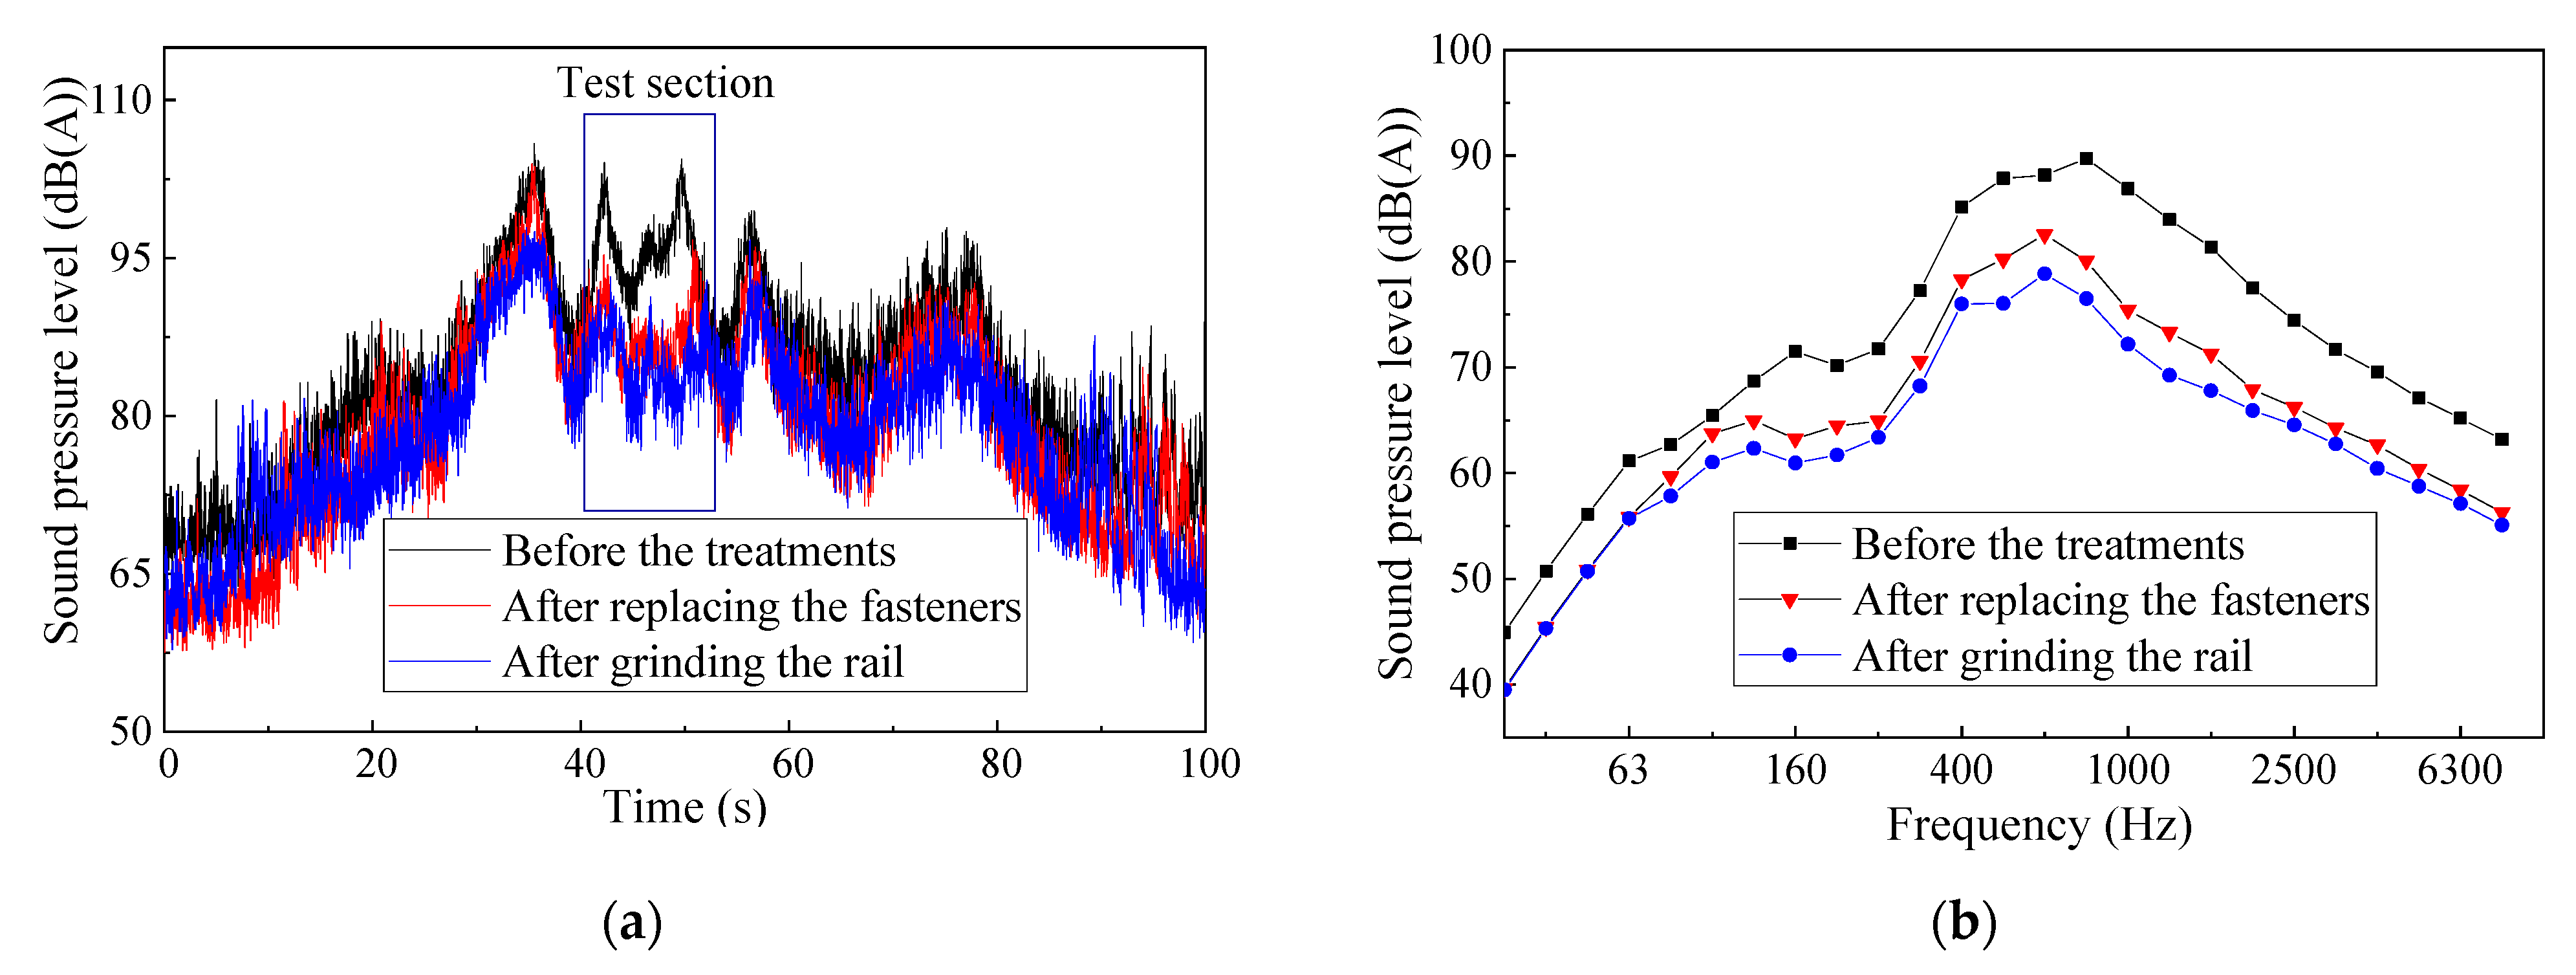
One month after each treatment, the noise inside the train was tested again to study the change in the A-weighted sound pressure level. The results from the analysis of two noise test results following the treatment are shown in Figure 17. It is shown in Figure 17a that the time-variation trend of interior noise is essentially the same before and after the treatments, but the value of interior noise is evidently reduced. Before the treatments, the maximum interior noise of the test section reaches 104.4 dB(A), and after two treatments, the maximum value of the noise in the vehicle is 96.5 dB(A), which is 7.9 dB(A) lower than that before the treatments.
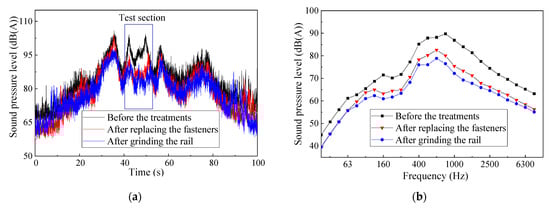
Figure 17.
Comparison of interior noise before and after the treatments of rail corrugation. (a) Time-varying sound pressure level, (b) Frequency domain.
As shown in Figure 17b, after replacing the fasteners, the wheel–rail relationship improves. The interior noise is 95.6 dB(A) before the treatments, while it is 87.9 dB(A) after replacing the fasteners. The interior noise is reduced by 7.7 dB(A), and the interior noise at all frequencies is reduced, with a decrease of 5~10 dB(A). The interior noise is reduced to 84.2 dB(A) after rail grinding and is reduced largely in the 400~1600 Hz frequency range, which is the main frequency of interior noise.
Since only the most serious rail corrugation segment of the D–E section is selected for transformation, and the transformation section is short, the interior noise of the whole section remains large. Due to the hysteresis of the interior noise, the noise cannot be quickly attenuated. Therefore, the interior noise in the test section still exceeds the limit.
Even so, after the treatments of rail corrugation, the interior noise of the test section is reduced from 95.6 dB(A) to 84.2 dB(A), and the reduction range is up to 11.4 dB(A). The effect of the treatments is clear.
5.2. Effect Evaluation of the Treatment Measures
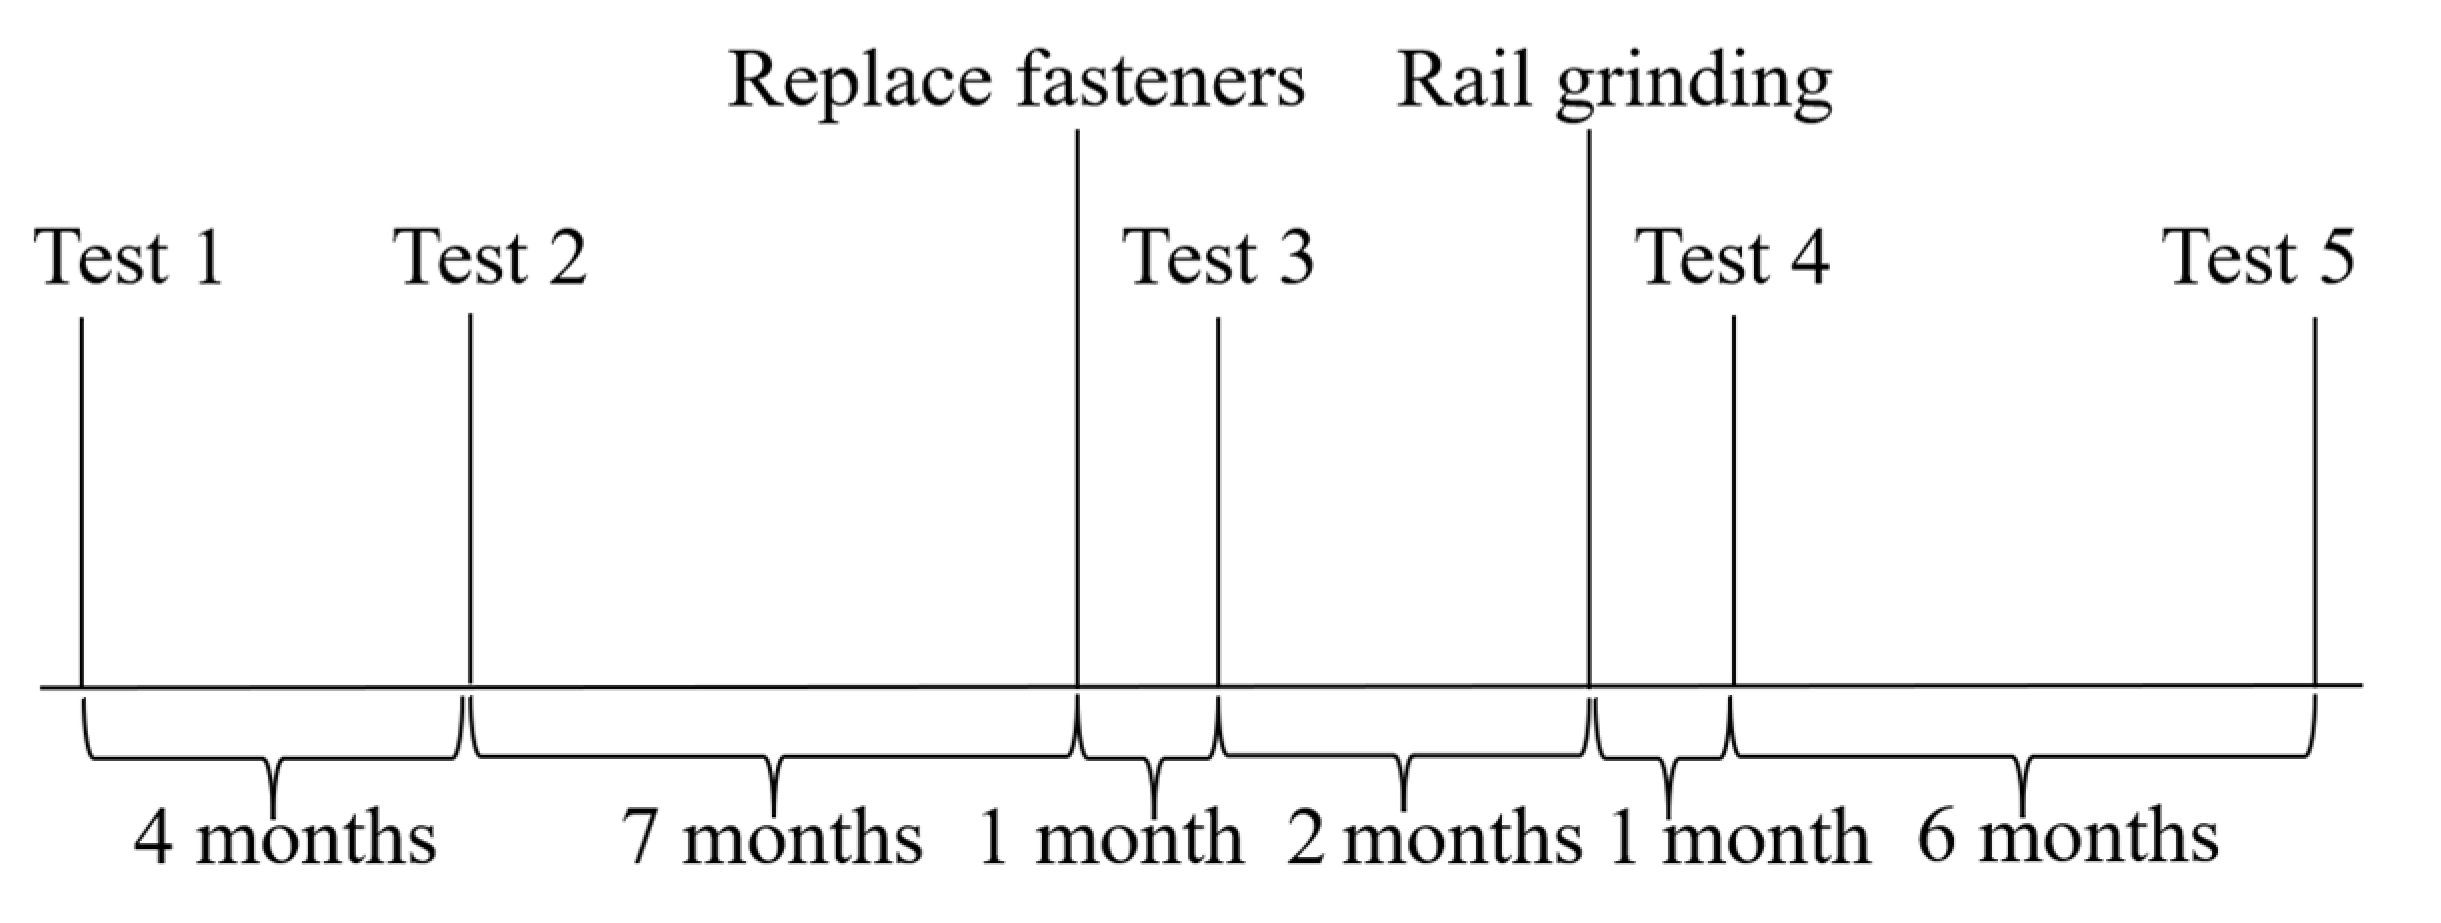
In order to compare the development of rail corrugation before and after treatments, the interior noise was tested five times. Test 1 and test 2 were conducted before the treatments. It is shown in Figure 18 that the interval between test 1 and test 2 was 4 months. Before the treatments of the test section, the track lateral stiffness of the test section was small and the rail was polished periodically. The rail grinding cycle is about 6 months.
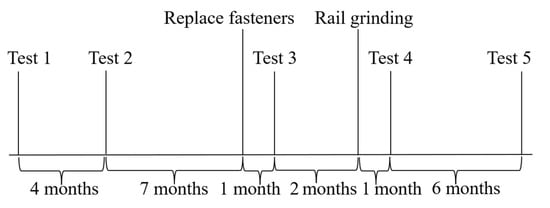
Figure 18.
Schematic diagram of test and treatment time.
As can be shown in Figure 19, the interior noise of the section increases from 91.2 dB(A) to 95.6 dB(A) after four months of operation, and the noise value seriously exceeds the limit. The sound pressure value clearly increases at the frequency of 800 Hz. Combined with the conversion relationship between the corrugation and the corresponding frequency, this indicates that the rail corrugation with the wavelength of about 30 mm develops further.
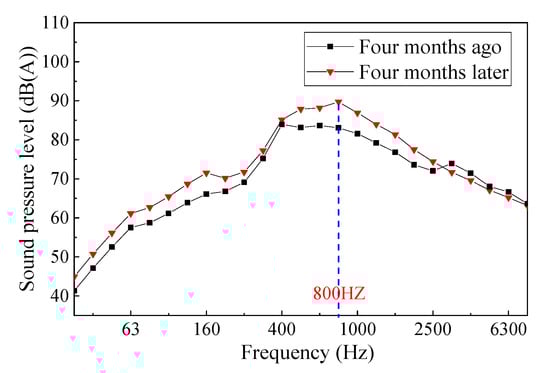
Figure 19.
Changes of interior noise before the treatments.
Therefore, only rail grinding cannot effectively restrain the development of rail corrugation. After rail grinding for a period of time, the interior noise increases significantly.
In order to further determine the effect of the measures, six months after the implementation of the measures, this work carries out the tracking test on the test section. The results of rail irregularity are shown in Figure 20.
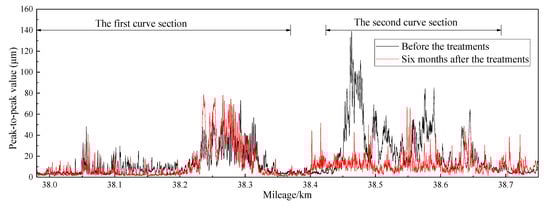
Figure 20.
Changes in rail irregularity value.
The rail irregularity of the first curve section is almost unchanged. After the second curve section is renovated, the rail corrugation is improved. The peak-to-peak average value of rail irregularity is 12.1 μm after six months, while it is 29.8 μm before the treatments. Therefore, after six months of treatment, rail corrugation does not develop greatly, and the treatment measures are more effective than rail grinding alone.
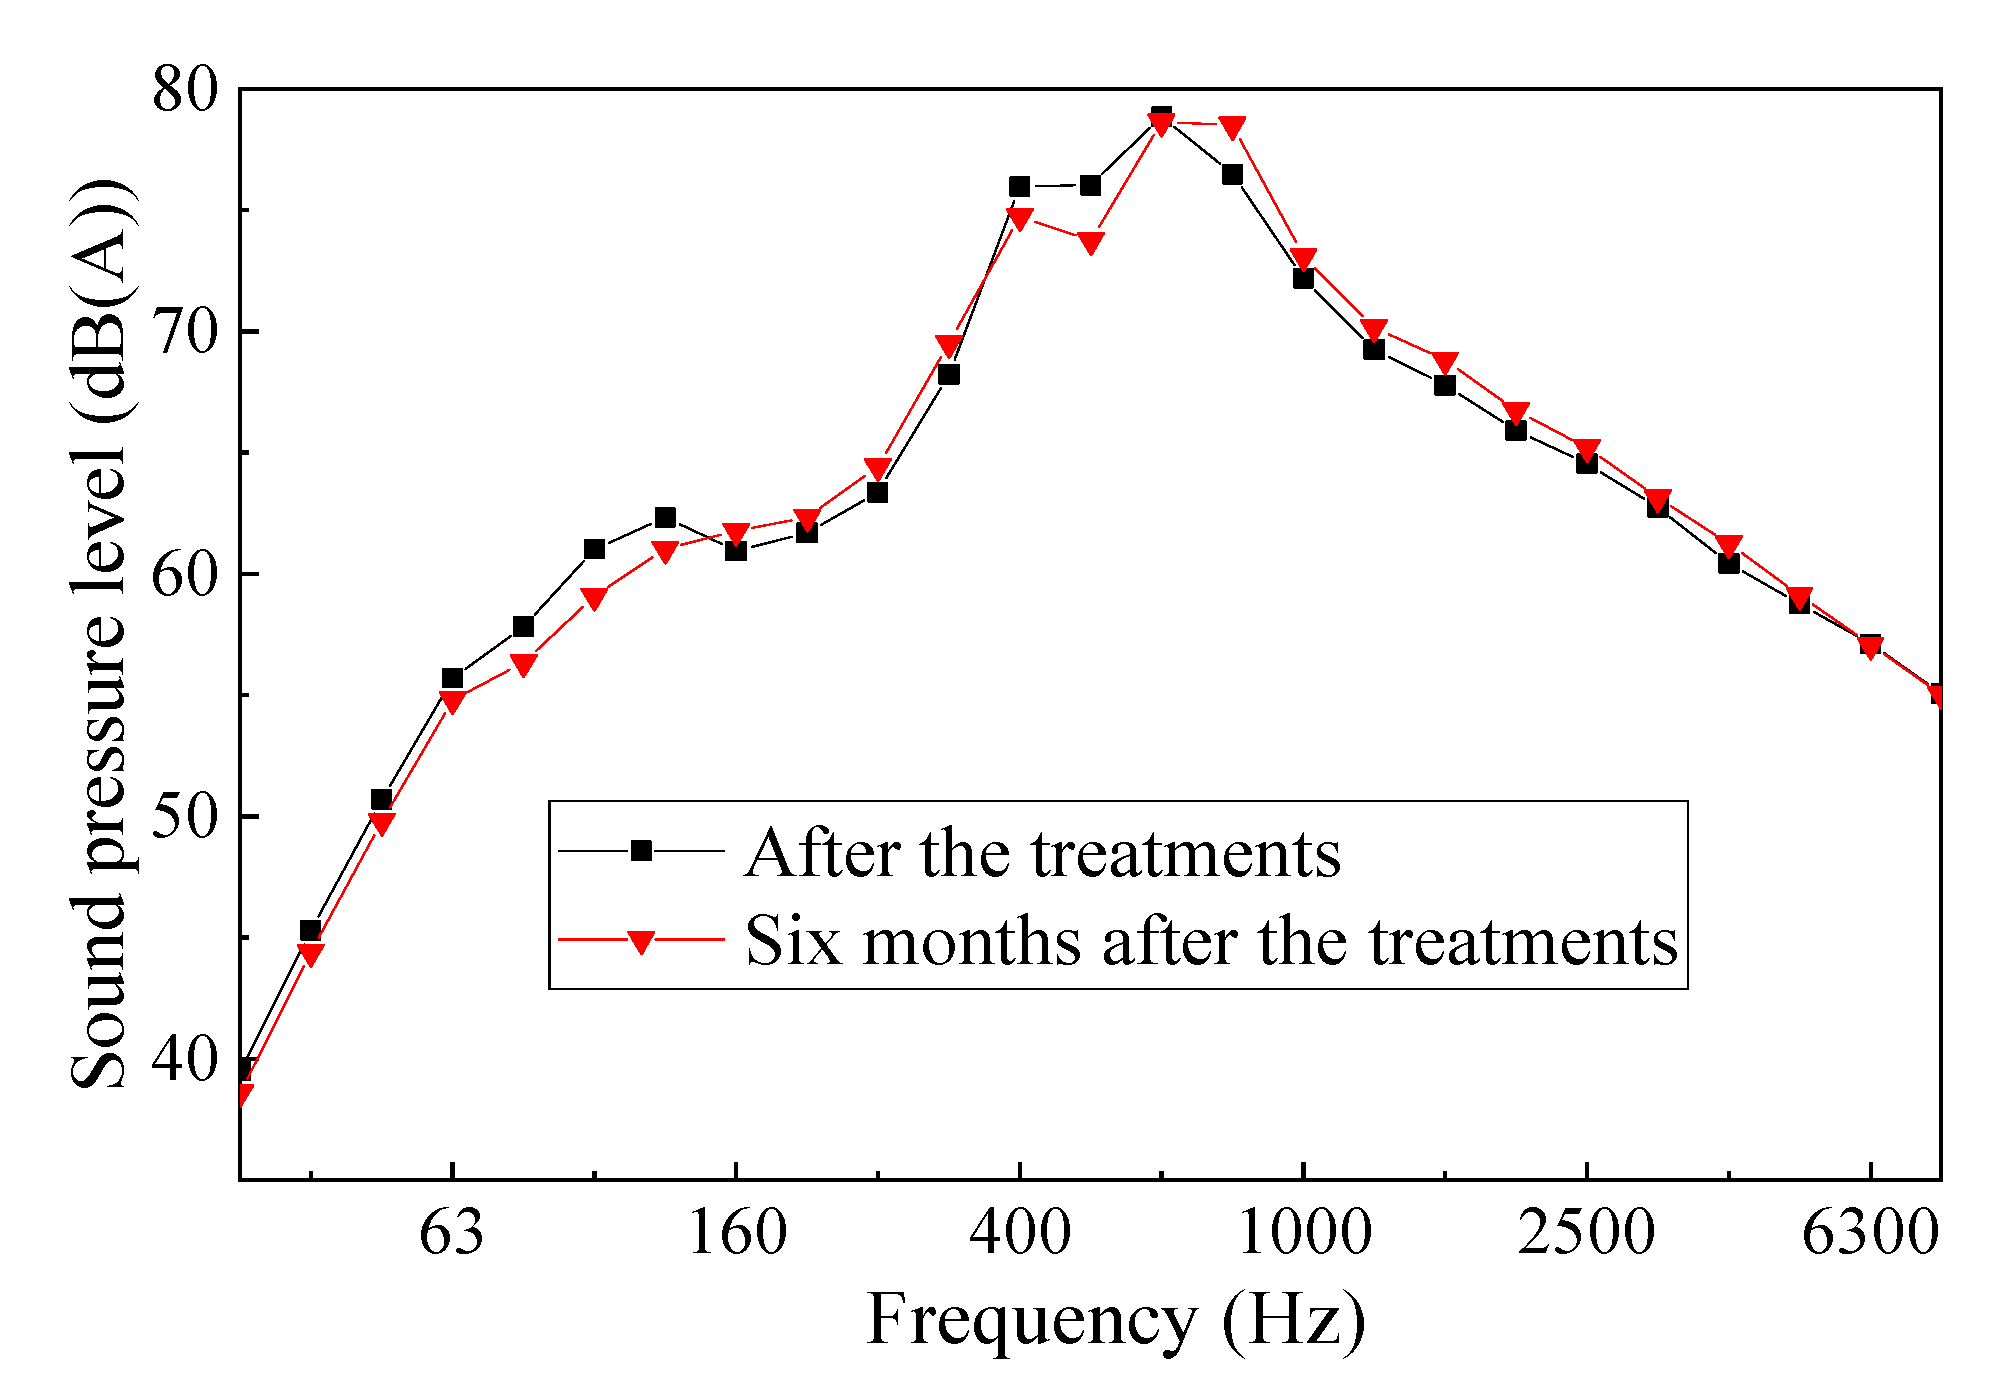
The comparison results of interior noise after 6 months of implementation of the measures are shown in Figure 21. After the treatments of rail corrugation, the interior noise is 84.2 dB(A). The interior noise is 84.4 dB(A) after six months of operation, which is essentially consistent with the test results before six months, and the sound pressure level at each frequency is almost unchanged. Before the treatments, the interior noise increased by 4.4 dB(A) after four months of operation, and the sound pressure at the main frequency of 800 Hz increased significantly. The results of five tests are shown in Table 3. The rail corrugation tests were carried out in Test 2 and Test 5. The results indicate that the treatment measures can effectively reduce the interior noise, and the interior noise does not increase again for a long time.
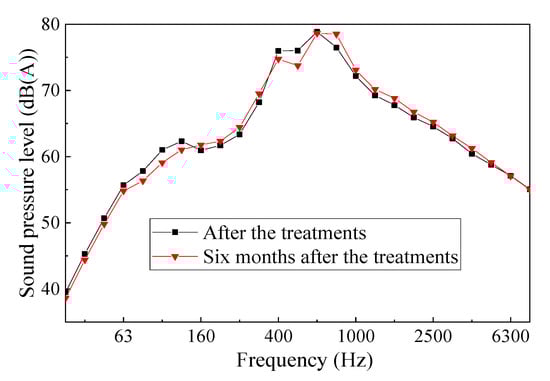
Figure 21.
Changes of interior noise after the treatments.
Table 3.
The results of five tests.
6. Conclusions
In this work, the rail corrugation, vehicle interior noise and wheel–rail noise were tested in some sections of a metro line, and the relevant test sections were selected for transformation to explore the impact of rail corrugation on vehicle interior noise. The results show that:
- (1)
- The rail corrugation of the metro system can cause abnormal noise inside the train, and the interior noise exceeds the limit in many areas. When the train passes through the rail corrugation section, the A-weighted sound pressure level of the train interior noise increases significantly, and the maximum increase can be higher than 25 dB(A).
- (2)
- There is an obvious rail corrugation problem from 31.5~63 mm in the test section. When the train passes through the corrugation, the wheel–rail vibration frequency is in good agreement with the main frequency of noise inside the train and the wheel–rail noise frequency.
- (3)
- After increasing the lateral stiffness of the track, the interior noise is reduced from 95.6 dB(A) to 87.9 dB(A), with a decrease of 7.7 dB(A). After rail grinding, the interior noise is reduced to 84.2 dB(A), and the sound pressure level of 400~1600 Hz (the main frequency of interior noise) is greatly reduced.
- (4)
- After six months of the treatments, the interior noise remains relatively unchanged. Compared with simple rail grinding, the proposed treatment measures are effective.
Author Contributions
Conceptualization, H.P. and X.C.; methodology, H.P.; formal analysis, Y.Y.; investigation, Y.Y. and T.S.; resources, X.C.; data curation, Y.Y. and T.S.; writing—original draft preparation, H.P. and Y.Y.; writing—review and editing, Y.Y., X.C. and Y.Z.; supervision, H.P. and X.C.; project administration, H.P. and X.C.; funding acquisition, H.P. All authors have read and agreed to the published version of the manuscript.
Funding
This research was funded by National Natural Science Foundation of China, grant number 51778050 and Beijing Municipal Science & Technology Commission, grant number Z191100002519010.
Institutional Review Board Statement
Not applicable.
Informed Consent Statement
Not applicable.
Data Availability Statement
Data are contained within the article.
Conflicts of Interest
The authors declare no conflict of interest.
References
- Li, W.; Wang, H.Y.; Wen, Z.F.; Du, X.; Wu, L.; Li, X.; Jin, X.S. An investigation into the mechanism of metro rail corrugation using experimental and theoretical methods. Proc. Inst. Mech. Eng. Part F J. Rail Rapid Transit 2016, 230, 1025–1039. [Google Scholar] [CrossRef]
- Oostermeijer, K.H. Review on short pitch rail corrugation studies. Wear 2008, 265, 1231–1237. [Google Scholar] [CrossRef]
- Grassie, S.L. Rail corrugation: Characteristics, causes, and treatments. Proc. Inst. Mech. Eng. Part F J. Rail Rapid Transit 2009, 223, 581–596. [Google Scholar] [CrossRef]
- Johansson, A.; Nielsen, J.C.O. Rail corrugation growth—Influence of powered wheelsets with wheel tread irregularities. Wear 2007, 262, 1296–1307. [Google Scholar] [CrossRef]
- Li, W.; Zeng, Q.J.; Zhu, S.Y.; Fan, J.F.; Jin, X.S. Effect of metro rail corrugation on dynamic behaviors of vehicle and track. J. Traffic Transp. Eng. 2015, 15, 34–42. [Google Scholar]
- Berardi, U.; Iannace, G.; Giordano, G. Acoustic Characteristics of Four Subway Stations in Naples, Italy. In Proceedings of the INTER-NOISE 2015—44th International Congress and Exposition on Noise Control Engineering 2015, San Francisco, CA, USA, 9–12 August 2015; Available online: https://www.researchgate.net/publication/282186553 (accessed on 11 August 2015).
- Xin, T.; Wang, S.; Gao, L.; Huo, H.L.; Ding, Y.; Wang, P.S.; Chen, P.; Liu, P.H. Field measurement of rail corrugation influence on environmental noise and vibration: A case study in China. Measurement 2020, 164, 108084. [Google Scholar] [CrossRef]
- Yan, L.; Chen, Z.; Zou, Y.F.; He, X.H.; Cai, C.Z.; Yu, K.H.; Zhu, X.J. Field Study of the Interior Noise and Vibration of a Metro Vehicle Running on a Viaduct: A Case Study in Guangzhou. Int. J. Environ. Res. Public Health 2020, 17, 2807. [Google Scholar] [CrossRef] [PubMed] [Green Version]
- Li, L.; Thompson, D.; Xie, Y.S.; Zhu, Q.; Luo, Y.Y.; Lei, Z.Y. Influence of rail fastener stiffness on railway vehicle interior noise. Appl. Acoust. 2019, 145, 69–81. [Google Scholar] [CrossRef] [Green Version]
- Han, J.; Wang, R.Q.; Wang, D.; Guan, Q.H.; Zhang, Y.M.; Xiao, X.B.; Jin, X.S. Effect of Wheel Load on Wheel Vibration and Sound Radiation. Chin. J. Mech. Eng. 2015, 28, 46–54. [Google Scholar] [CrossRef]
- Han, J.; Xiao, X.B.; Jin, X.S.; Wang, C.; Fang, J.Y.; Zhang, Y.M. Sound radiation characteristics of wheel used in urban rail traffic. J. Mech. Eng. 2012, 48, 116–121. [Google Scholar] [CrossRef]
- Thompson, D.J. Wheel-rail noise generation, Part II: Wheel Vibration. J. Sound Vib. 1993, 161, 387–482. [Google Scholar] [CrossRef]
- Kalker, J.J.; Périard, F. Wheel-rail noise: Impact, random, corrugation and tonal noise. Wear 1996, 191, 184–187. [Google Scholar] [CrossRef]
- Talotte, C.; Gautier, P.E.; Thompson, D.J.; Hanson, C. Identification, modeling and reduction potential of railway noise sources: A critical survey. J. Sound Vib. 2003, 267, 447–468. [Google Scholar] [CrossRef]
- Grassie, S.L. Rail corrugation: Advances in measurement, understanding and treatment. Wear 2005, 258, 1224–1234. [Google Scholar] [CrossRef]
- Grassie, S.L.; Kalousek, J. Rail corrugation: Characteristics, causes, and treatments. Proc. Inst. Mech. Eng. Part F J. Rail Rapid Transit 1993, 207, 57–68. [Google Scholar] [CrossRef]
- Grassie, S.L. Short wavelength rail corrugation: Field trials and measuring technology. Wear 1996, 191, 149–160. [Google Scholar] [CrossRef]
- Thompson, D.J. On the Relationship Between Wheel and Rail Surface Roughness and Rolling Noise. J. Sound Vib. 1996, 193, 149–160. [Google Scholar] [CrossRef]
- Feng, C.C.; Liu, X.L.; Li, W. Influence of short pitch rail corrugation on interior noise of metro vehicles. Noise Vib. Control 2018, 38, 113–117. [Google Scholar] [CrossRef]
- Han, J.; Xiao, X.B.; Wu, Y.; Wen, Z.F.; Zhao, G.T. Effect of rail corrugation on metro interior noise and its control. Appl. Acoust. 2018, 130, 63–70. [Google Scholar] [CrossRef]
- Chen, J.H.; Ke, W.H.; Wei, X.; Chen, R. Experimental Study on Noise Characteristics of Metro Cars. Railw. Stand. Des. 2018, 62, 52–57. [Google Scholar] [CrossRef]
- Zhao, C.; Wang, P.; Yi, Q. Internal noise reduction in railway vehicles by means of rail grinding and rail dampers. Noise Control Eng. J. 2017, 65, 1–13. [Google Scholar] [CrossRef]
- Guo, J.Q.; Zhu, L.W.; Liu, X.L.; Han, J.; Xiao, X.B. Experimental and Simulation Study on the Relationship between Interior Noise of Metro Cab and Rail Corrugation. J. Mech. Eng. 2019, 55, 141–147. [Google Scholar] [CrossRef]
- Yao, H.M.; Shen, G.; Cui, W. Grinding Method for Rail Corrugation in Curved Track. J. Tongji Univ. (Nat. Sci.) 2019, 47, 1162–1167. [Google Scholar] [CrossRef]
- Kraśkiewicz, C.; Chmielewska, B.; Zbiciak, A.; Al Sabouni-Zawadzka, A. Study on Possible Application of Rubber Granulate from the Recycled Tires as an Elastic Cover of Prototype Rail Dampers, with a Focus on Their Operational Durability. Materials 2021, 14, 5711. [Google Scholar] [CrossRef] [PubMed]
- Toward, M.G.R.; Squicciarini, G.; Thompson, D.J.; Gai, Y. Estimating the performance of rail dampers using laboratory methods and software predictions. Noise and vibration mitigation for rail transportation systems. In Proceedings of the 11th International Workshop on Railway Noise, Uddevalla, Sweden, 9–13 September 2013; pp. 47–54. Available online: https://link.springer.com/chapter/10.1007/978-3-662-44832-8_7 (accessed on 1 September 2013).
- Qian, W.J.; Wu, Y.F.; Chen, G.X.; Ouyang, H. Experimental and numerical studies of the effects of a rail vibration absorber on suppressing short pitch rail corrugation. J. Vibroeng. 2016, 18, 1133–1144. Available online: https://www.jvejournals.com/article/16216 (accessed on 31 March 2016).
- Zoontjens, L.; Welsh, L.; Croft, B. Predicting and managing rolling noise emissions from trains on the Perth metro passenger rail network. In Proceedings of the 2017 Conference of the Australian Acoustical Society, Perth, WA, Australia, 19–22 November 2017; Available online: https://dspace.nal.gov.au/xmlui/handle/123456789/795 (accessed on 20 November 2017).
- CN-GB. GB/T3449-2011 Acoustics—Measurement of Noise inside Railbound Vehicles; CN-GB: Beijing, China, 2011.
- CN-GB. GB/T14892-2006 Noise Limit and Measurement for Train of Urban Rail Transit; CN-GB: Beijing, China, 2006.
- BSI. EN 13231-3:2006, Railway Applications—Track—Acceptance of Works—Part 3: Acceptance of Rail Grinding, Milling and Planning Work in Track; BSI: London, UK, 2006. [Google Scholar]
- ISO. ISO 3095-2013 Acoustics–Railway applications—Measurement of Noise Emitted by Railbound Vehicles; ISO: Geneva, Switzerland, 2013. [Google Scholar]
- Zhang, H.G.; Liu, W.N.; Liu, W.F.; Wu, Z.Z. Study on the cause and treatment of rail corrugation for Beijing metro. Wear 2014, 317, 120–128. [Google Scholar] [CrossRef]
- Zhang, H.G.; Liu, W.N.; Wu, Z.Z.; Wang, W.B. Cause and Treatment for Rail Corrugation Developed on Egg Fastening System Section of Metro Line. China Railw. Sci. 2014, 35, 22–28. [Google Scholar] [CrossRef]
- Egana, J.I.; Vinolas, J.; Seco, M. Investigation of the influence of rail pad stiffness on rail corrugation on a transit system. Wear 2006, 261, 216–224. [Google Scholar] [CrossRef]
- Wu, T.X. Effects on short pitch rail corrugation growth of a rail vibration absorber/damper. Wear 2011, 271, 339–348. [Google Scholar] [CrossRef]
- Eadie, D.T.; Santoro, M. Top-of-rail friction control for curve noise mitigation and corrugation rate reduction. J. Sound Vib. 2006, 293, 747–757. [Google Scholar] [CrossRef]
- Eadie, D.T.; Santoro, M.; Oldknow, K.; Oka, Y. Field studies of the effect of friction modifiers on short pitch corrugation generation in curves. Wear 2008, 265, 1212–1221. [Google Scholar] [CrossRef]
- Yang, G.W.; Peng, H.; Wang, J.N.; Cai, X.P. Remediation method of abnormal rail corrugation of Beijing metro based on engineering analogy. J. Beijing Jiaotong Univ. 2013, 37, 40–45. [Google Scholar] [CrossRef]
- Wang, Z.Q.; Lei, Z.Y. Study on Influence Parameters of Rail Corrugation on Tangential Tracks of Metro. China Mech. Eng. 2021, 32, 420–430. [Google Scholar]


Publisher’s Note: MDPI stays neutral with regard to jurisdictional claims in published maps and institutional affiliations. |
© 2021 by the authors. Licensee MDPI, Basel, Switzerland. This article is an open access article distributed under the terms and conditions of the Creative Commons Attribution (CC BY) license (https://creativecommons.org/licenses/by/4.0/).