Article

Preharvest Foliar Salicylic Acid Sprays Reduce Cracking of Fig Fruit at Harvest

by
Athanasia D. Karantzi
1,
Mina Kafkaletou
1,2,
Giorgios Tsaniklidis
3,
Jinhe Bai
4,
Miltiadis V. Christopoulos
5,
Dimitrios Fanourakis
6 and
Eleni Tsantili
1,*
1
Laboratory of Pomology, Department of Crop Science, Agricultural University of Athens, Iera Odos 75, 118 55 Athens, Greece
2
Department of Olive and Horticultural Crops, Institute of Olive Tree, Subtropical Crops and Viticulture, Hellenic Agricultural Organization-DEMETER, 87 Lakonikis St, 241 00 Kalamata, Greece
3
Institute of Olive Tree, Subtropical Plants and Viticulture, Hellenic Agricultural Organization, ELGO-Dimitra, P.O. Box 2228, 710 03 Heraklio, Greece
4
Citrus and Other Subtropical Products Research, U. S. Horticultural Research Laboratory, 2001 South Rock Road, Fort Pierce, FL 34945, USA
5
Institute of Technology of Agricultural Product, Hellenic Agricultural Organization-DEMETER, S. Venizelou 1 Str., Lycovrissi, 141 23 Attica, Greece
6
Laboratory of Quality and Safety of Agricultural Products, Landscape and Environment, Department of Agriculture, School of Agricultural Sciences, Hellenic Mediterranean University, Estavromenos, 710 04 Heraklion, Greece
*
Author to whom correspondence should be addressed.
Appl. Sci. 2021, 11(23), 11374; https://doi.org/10.3390/app112311374
Submission received: 8 November 2021 / Revised: 24 November 2021 / Accepted: 28 November 2021 / Published: 1 December 2021
(This article belongs to the Special Issue Fruit Crops Physiology and Nutrition)

Abstract

:
Peel cracking and ostiole-end splitting (collectively termed cracking) are common disorders in ripe fig fruit, downgrading fruit quality and thus limiting marketability. This two-year field study addressed the possibility of alleviating cracking at harvest by two foliar salicylic acid (SA) sprays prior to harvest (8 and 5 d). Three SA concentrations (0, 1, and 2 mM) were employed in the first year, and based on the obtained results two (0 and 2 mM) in the second year. A local variety (‘Vasilika’) with excellent organoleptic profile, and high sensitivity to cracking was evaluated. Fruit was harvested at commercial maturity. Fruit marketability was mainly based on the incidence and severity of cracking. Fruit weight, peel color, flesh total soluble solids (TSS), titratable acidity (TA), and pH were estimated for fig quality. The contents of total anthocyanins (TAN), cyanidin-3-rutinoside (c-3-rut; the major anthocyanin in fig), and the expression of four genes coding for regulatory enzymes (phenylalanine ammonia lyase, anthocyanidin synthase, UDP-flavonoid glucosyl transferase 1, and UDP-flavonoid glucosyl transferase 2) of the phenylpropanoid biosynthetic pathway were also determined in the peel. Preharvest SA application (2 mM) increased the percentage of fruit without cracking (sound fruit) by 1.4–2.6-fold, and of marketable fruit (sound and slightly cracked) by 2-fold. SA application (2 mM) was associated with increased flesh TSS and TA, as well as with decreased flesh pH and peel red coloration in stripe. The treatment (2 mM SA) decreased both TAN and c-3-rut contents, which were highly associated (r = 0.978). Responses of transcription level of the four genes to SA application varied, and did not correlate with the other variables in the study. In conclusion, SA appears to be a low-cost and environmentally-safe agent for improving fig fruit quality and marketability, and facilitates harvesting and postharvest management of figs.

1. Introduction

Fresh figs (Ficus carica L.) are very attractive to consumers and have high nutritional value. However, they are among the most perishable fruit and thus the majority of the production is sold in dried form [1]. Cracking incidence is a common, but serous disorder for fig marketability [2,3]. Cracking also limits the storage period and shelf life due to enhanced water loss and increased pathogen infections [4]. Generally, owing to different growth rates of pulp and peel in some fruit, superficial skin fractures commonly appear during maturation and ripening [5,6]. Cracking incidence in figs depends mainly on cultivar [7] and orchard conditions [8]. These fractures (cracks) may be localized on the fruit side and usually in parallel to the axis either between pedicel and ostiole, starting from the ostiole, or both. When these fractures around the ostiole become intense, they penetrate into the flesh (ostiole-end splitting) [2]. These fruit skin disorders could be collectively termed as cracking [3].
The cracking intensity is a primary quality grading standard of fruit. The absence of cracking (sound fruit) corresponds to quality class extra, while fruit with slight side cracks is assigned to class I [9]. In this perspective, strategies that reduce cracking incidence and intensity will considerably improve fruit quality, storage potential, and shelf life. Auxin treatment [10], soil potassium and calcium fertigation [11], preharvest potassium spray [12], postharvest calcium chloride treatment [13], or regulated deficit irrigation (RDI) [2] can reduce peel cracking, although the last technique may reduce the fruit weight and for this reason some farmers are reluctant to use it.
Salicylates, salicylic acid (SA, ortho-hydroxy benzoic acid) and its derivatives, acetyl salicylic acid (ASA) and its methyl ester (MeSA), belong to phenolic compounds. Salicylic acid is synthesized and metabolized in plants and comprises a key molecule that directly or indirectly regulates many aspects of plant growth and development. Lately, these compounds have received much attention since they mediate in signaling responses to abiotic and biotic stresses, inducing immunity both locally and in the whole plant by the systemic acquired resistance (SAR) against biotrophic pathogens [14]. Triggering the antioxidant enzymes activity for reactive oxygen species (ROS) detoxification and maintenance of redox homeostasis by salicylates has been presented in a number of research works for prevention of fungal decay, as in cherries [15] and goji berries [16]. Salicylates also effectively mitigate chilling injury symptoms [17,18], which are not relevant to the species under study. In other crops, exogenous application of salicylates during cultivation has been associated with improved fruit quality. For instance, they alleviated chilling injury symptoms [19] and peel russeting [20] in pomegranate, and prevented wax loss in blueberry [21]. Furthermore, salicylate application increased anthocyanin synthesis and total antioxidant capacity, as in plum [22] and grape [23], although not apparent in tomato under certain conditions [24]. In line with these results, salicylate application stimulated the activity of phenylalanine ammonia lyase (PAL) and other enzymes involved in the phenylpropanoid biosynthetic pathway in blood orange [25], cherry [15], and goji berry [16], but not in pomegranate [26]. PAL sets the interface between primary and secondary metabolism, towards the production of a diverse range of metabolites (including anthocyanins), which are essential in orchestrating stress responses [27]. For instance, their upregulation has been associated with alleviation of oxidative damage [28]. In pomegranate, salicylate application has also been related to adverse effects, including color development delay [19]. Ahmed et al. [29] reduced cracking of pomegranates after spraying with SA solution along with nutrients, but the effect was minimal after only SA treatment.
In this two-year field study, the potential of spraying SA during cultivation to decrease fig fruit cracking incidence and severity was investigated. Additionally, critical external (peel color) and internal (flesh total soluble solids, titratable acidity, and pH) quality features were assessed. Emphasis was also given to anthocyanin synthesis because it develops the red coloration, rendering the fruit attractive to consumers. Additionally, the conflicting results of SA on anthocyanin accumulation in other fruit was a challenge to investigate the anthocyanin changes in figs [19,22,23,24]. Therefore, a more fundamental basis for the potentially positive role of SA was sought by assessing the contents of total anthocyanins (TAN), cyanidin-3-rutinoside (c-3-rut; the major anthocyanin in fig), as well as the expression of four genes coding for regulatory enzymes of the phenylpropanoid biosynthetic pathway. A local variety (‘Vasilika’) with an excellent organoleptic profile, and high sensitivity to cracking was employed.

2. Materials and Methods

2.1. Plant Material

A local variety (‘Vasilika’) was employed. The current study included two experiments performed in sequential years (2017 and 2018). For the first experiment, year 1, the orchard was located in Markopoulo (Attiki, Greece; 37°55′48.8″ N 23°58′34.2″ E), and for the second, experiment B, in Molaoi (Lakonia, Greece; 36°50′23.0″ N 22°50′51.0″ E).
SA (99% purity; Alfa-Aesar, Karlsruhe, Germany) solutions in different concentrations were used for spraying. Spraying took place on 1 and 4 August, in the first and second experiment year, respectively, and harvest on 9 August in both years. Three SA concentrations (0, 1, and 2 mM) were employed for year 1. Based on the obtained results in year 1, two SA concentrations (0 and 2 mM) were employed for year 2. All spraying solutions included (0.03%) surfactant (Saldo Plus, SEGE ltd, Athens, Greece; active ingredient: 15% (w/v) isodecyl alcohol ethoxylate). In both experiments, three trees were randomly selected to represent three replicates. Prior to treatments, 45 fruit of similar size, color, and firmness were labelled per tree. Practically, the maturity indices for harvesting include the slight finger pressure as firmness, and the peel color development [1]. Labelled fruit were basically harvested according to firmness since the color had not developed to the same extent in all fruit.
Following harvest, fruit cracking incidence and severity were evaluated in situ. Fruit were then transferred to the laboratory by using refrigerated transport (7 °C). Measurements were conducted on fresh fruit. For chemical analysis samples, flesh tissues were snap-frozen in liquid nitrogen, and transferred to a freezer (−80 °C) for storage.

2.2. Fruit Cracking Incidence and Severity (Years 1 and 2)

Per treatment, 45 fruit were assessed. For year 1, fruit cracking incidence and severity was scored based on the following scale developed by the authors with the following symbols: (C0), lack of side cracking/ostiole-end splitting (sound); (C1), slight side cracking or ostiole-end splitting (i.e., slightly cracked); and (C2), medium or severe side cracking or ostiole-end splitting (i.e., highly cracked). For year 2, this was based on the following scale: (C0), same as in year 1; and (C3), slight, medium, or severe side cracking or ostiole-end splitting (cracked). Therefore, C3 includes both C1 and C2.

2.3. Color Measurement (Years 1 and 2)

Peel color was determined by using a chromameter (CR-300; Minolta, Ahrensburg, Germany). Evaluations included two opposite points close to the pedicel, and another two close to the ostiole. The former points are expected to acquire low color intensity, and the latter high. Results are expressed as lightness (L*), hue angle (h°), and chroma (C*). The day following harvest, measurements were conducted on fresh fruit. For each treatment, three replicates were evaluated. Each replicate consisted of 15 fruit (5 fruit per tree × 3 trees).

2.4. Fruit Weight, Total Soluble Solids, pH, and Titratable Acidity (Years 1 and 2)

The weight of fruit was recorded by a digital balance (±0.001 g; Mettler ME303TE, Giessen, Germany) and the dry weight mass by drying 5 g of peel at 70 °C for 3 d and then at 105 °C for 3 h.
TSS, pH, and TA were measured in juice. For juice, all figs per replicate were homogenized in a laboratory blender. A portion of the homogenate was centrifuged at 4000× g for 6 min. TSS were determined using a digital refractometer (HI 96801, Hanna Instruments Inc., Woonsocket, RI, USA) calibrated with deionized water and was expressed as °Brix. pH was measured in juice diluted with deionized water (1:10 ), v/v and TA by titration with 0.1 mol L−1 NaOH to pH 8.2 and expressed as citrate % (w/w).
Three replicates were evaluated in each treatment. Thirty fruit were included in each replicate for fresh weight and 15 for the remaining measurements.

2.5. Total Anthocyanins and Cyanidin-3-Rutinoside Contents (Year 1)

The extraction followed the method of Durst and Wrolstad [30] after slight modifications, as described by Karantzi et al. [31]. One gram of frozen peel tissue was added to 3 mL of cold 4% (v/v) phosphoric acid solution in an Ultra-Turrax. The mixture was blended (9500× g for 1 min), followed by orbital shaking for 15 min and then centrifuged (4000× g for 7 min). The extraction process was repeated twice. The combined supernatants were brought to 12 mL with deionized distilled water, divided into several aliquots, and stored at −80 °C until analysis.
The determination of total anthocyanins (TAN) content was conducted using a modified pH differential method, as previously described [32,33]. Absorbance readings at 510 and 700 nm in buffers at pH 1.0 and 4.5 were carried out using a spectrophotometer (Heλios Gamma 7 Delta, Spectronic Unicam, UK). The results were expressed as mg of c-3-rut equivalents taking into account the E molar absorbance of c-3-rut (32,800) [34] and the following equation [32]:
A = (A510 − A700)pH1.0 − (A510 − A700)pH4.5
TAN concentrations are expressed as μg g1 dry weight (dw) of c-3-rut.
The same extract was used for the determination of the c-3-rut after filtering it through a 0.45 μm Chromafil AO-45/25 polyamide filter (Macherey-Nagel) and using an HPLC system, with a diode array detector (SPD-M20A; Shimadzu Corp., Kyoto, Japan) monitored at 530 nm, as described by Karantzi et al. [31]. A sample of 50 μL was injected into an HPLC system, consisting of a Nexera X2 pump (LC-30 AD; Shimadzu Corp., Kyoto, Japan), an autosampler system (SIL-30AC; Shimadzu Corp., Kyoto, Japan), a diode array detector (SPD-M20A; Shimadzu Corp., Kyoto, Japan), and a Macherey-Nagel HPLC column C18 (250 × 4.6; 5 μm, Nucleodur PolarTec at 30 °C). The separation was achieved at 30 °C with a flow rate of 1 mL min1. The mobile phase consisted of 100% acetonitrile (solvent A) and a solution of 10% acetic acid, 5% acetonitrile, and 1% phosphoric acid (solvent B). Samples were eluted as described in Karantzi et al. [31] and c-3-rut was quantified compared to a multipoint calibration curve obtained from c-3-rut authentic standard (Extrasynthese, Genay, France) and expressed in μg g1 dw. For each treatment, three replicates were evaluated. Each replicate consisted of 15 fruit (5 fruit per tree × 3 trees). The above-mentioned measurements were conducted on liquid-nitrogen-frozen material.

2.6. qPCR Expression Analysis (Year 1)

Total RNAs were extracted using a previously described method [35]. A “lysis buffer” (8 M GuHCl, 25 mM EDTA, 1% sarcosyl, 2% Triton X-100, 25 mM sodium citrate, 0.2 M sodium acetate, pH adjusted to 5.2 with acetic acid), incubated at 65 °C for 10 min, was centrifuged (16,000× g for 5 min) and the lysate was treated with 625 μL of absolute ethanol and filtered through a silica column (FT-2.0 Filter-Tube Spin-Column System, G. Kisker GbR, Steinfurt, Germany) by centrifugation (1500× g for 10 min). Afterwards, the column was washed with 700 μL “wash buffer 1” (4 M GuHCl, 25 mM Tris–HCl, pH 6.6 and 60% ethanol), and then twice (700 and 400 μL, respectively) with “wash buffer 2” (2 mM Tris–HCl, pH 7.0, 20 mM NaCl, and 80% ethanol) and the aliquot was centrifuged (8000× g for 1 min). The total RNA was obtained using an elution buffer (10 mM Tris–HCl, pH 8.0). Treatment with DNAase I (ThermoFisher, Waltham, MA, USA) and reverse transcription with the Superscript II cDNA synthesis kit (ThermoFisher, Waltham, MA, USA) following the manufacturer’s instructions. The absence of genomic DNA was verified with qPCR prior to the cDNA synthesis using primers for Actin (Table 1). The resulting first-strand cDNA was normalized again using primers for Actin. The qPCR experiments were performed with the use of the PowerUp SYBR Green Master Mix (ThermoFisher, Waltham, MA, USA) with a QuantStudio 3 Real-Time PCR System (ThermoFisher, Waltham, MA, USA). The relative quantification of gene expression was performed as described in Tsaniklidis et al. [34]. For all samples, qPCR reactions were performed in triplicate. For each treatment, three replicates were evaluated. Each replicate consisted of 15 fruit (5 fruit per tree × 3 trees). The above-mentioned measurements were conducted on liquid-nitrogen-frozen material.

2.7. Statistical Analysis

The cracking incidence was judged by χ2 tests. In each cracking category, the significance of the effects of SA concentration on each variable, including cracking incidence, was examined by one-way ANOVA. For each variable, in order to compare all data (all treatment concentrations in all categories), one-way ANOVA was also performed. When denoted, the effectiveness of a particular concentration on a variable in the three categories was also performed by one-way ANOVA, including only the respective data (partial analysis). In all cases, mean comparisons were performed by Tukey-HSD multiple range test (α = 0.05). All determinations were performed on three replicates. In year 1, TAN content, c-3-rut content, and PAL and UFGT1 gene expression were transformed to sqrt prior to analysis. Data presented are transformed back. The significant differences were estimated at p < 0.05. To obtain relationships of the variables determined and to examine main variation in the data of year 1, principal component analysis (PCA) and pairwise correlations were also performed. The analyses were made using JMP7.0.1 (SAS Institute, Cary, NC, USA).

3. Results

3.1. SA Application Decreased Fruit Cracking Incidence and Severity

In year 1, controls (0 mM) consisted of 15% sound fruit (C0), 21% slightly cracked (C1), and 65% highly cracked (C2) (Figure 1a). SA application increased the percentage of fruit in categories C0 and C1 (Figure 1a). This effect was more prominent at higher concentration (2 mM). In year 2, controls (0 mM) comprised of 65% sound fruit (C0) and 35% slightly or highly cracked (C3; Figure 1b). Similar to year 1, SA application (2 mM) increased the percentage of fruit in category C0 in year 2.
In each experiment, the χ2 tests showed highly significant effects (p < 0.001). Consequently, to further examine the effect of concentration in each category, data were separately analyzed for each experiment by one-way ANOVA. The analyses showed significant effect of SA concentration in all categories in both experiments. The concentration effect in C1 was significant at psa < 0.01, while in all the remaining categories was at psa < 0.001 (Table 2).
In years 1 and 2, the higher concentration (2 mM) increased the frequency of sound fruit (C0) by 2.6- and 1.4-fold, respectively, in comparison to the respective control. In year 1, treatment with 2 mM SA decreased the highly-cracked fruit by 2.3-fold and increased the percentage of marketable fruit (C0 + C1) by 2-fold, as compared to controls. Although both SA concentrations (year 1) prevented cracking, the higher one was more effective, resulting in higher C0 and lower C2 percentages.

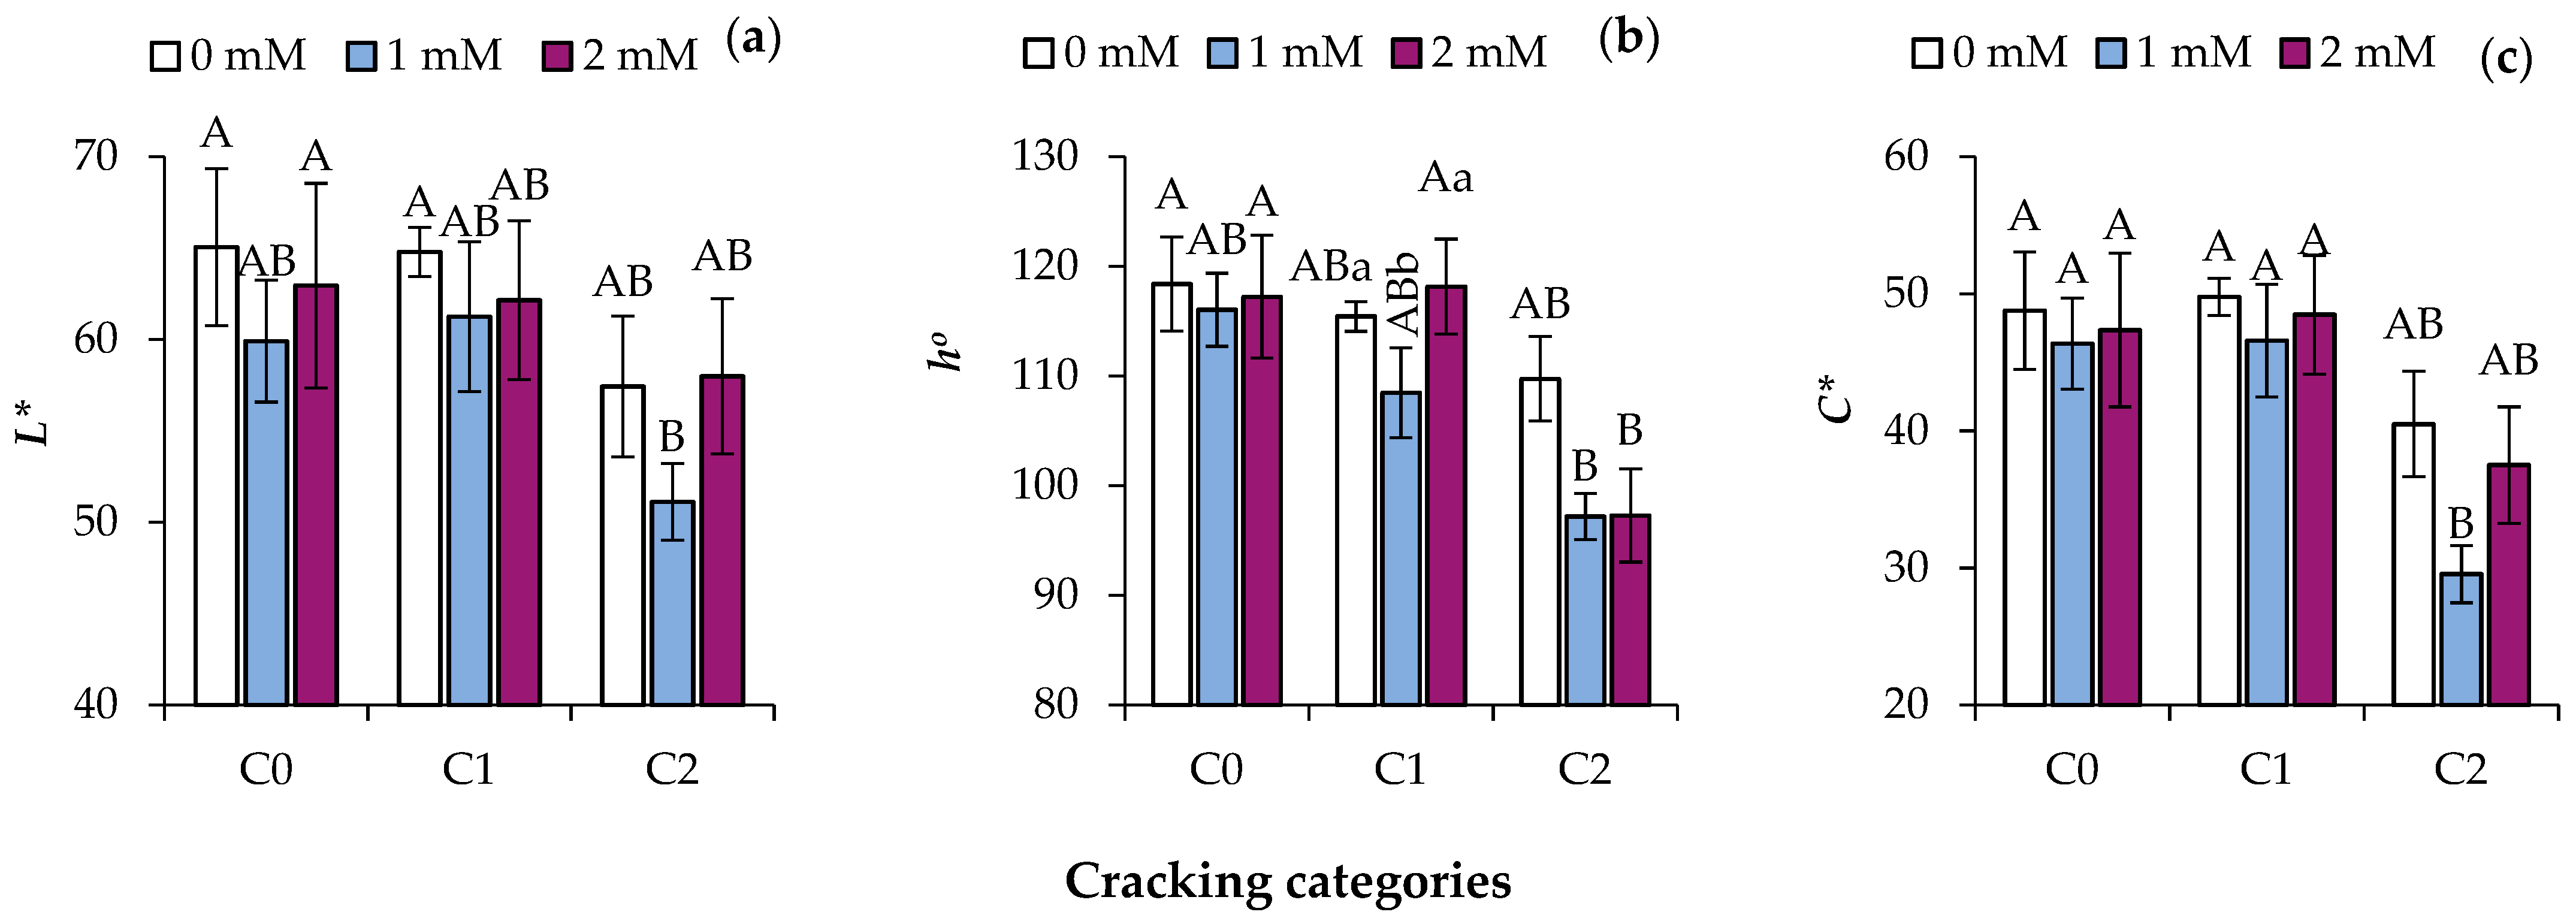
3.2. SA Application Limits Color Development

In year 1, L* color parameter ranged between 65 (C0 of controls) and 51 (C2 of fruit treated by 1 mM SA) (Figure 2a). The parameter hue angle varied from 118 (C0 of controls) to 92 (C2 of SA-treated fruit), while C* from 50 (C1 of controls) to 30 (C2 of fruit treated by 1 mM SA) (Figure 2b,c). The effect of SA concentration was significant for hue angle only in the C1 category (psa < 0.001), and not for L* and C* parameters in all categories (psa > 0.05; Table 2). Particularly, SA application (1 mM) resulted in the lowest hue angle value in C1 (Figure 2b).
Overall data analysis showed significant effects for L*, hue angle, and C* at pall < 0.01 (Table 2). Indeed, a trend of reduction of the three color parameters was evident in all fruit within the C2 class (highly cracked). SA concentration at 1 mM in C2 exhibited the lowest values of L* (p < 0.05) and C* (p < 0.01) in comparison to C0 and C1 of fruit treated by 1 mM SA, as confirmed by partial analyses.
In year 2, values of L*, , and C* in C0 of controls were 55, 99, and 31, respectively, while in C0 of fruit treated by 2 mM SA were 56, 110, and 40, respectively. The SA concentration effect in year 2 was significant for (psa < 0.05), C* (psa < 0.05), but not for L* (psa > 0.05) (Table 3).

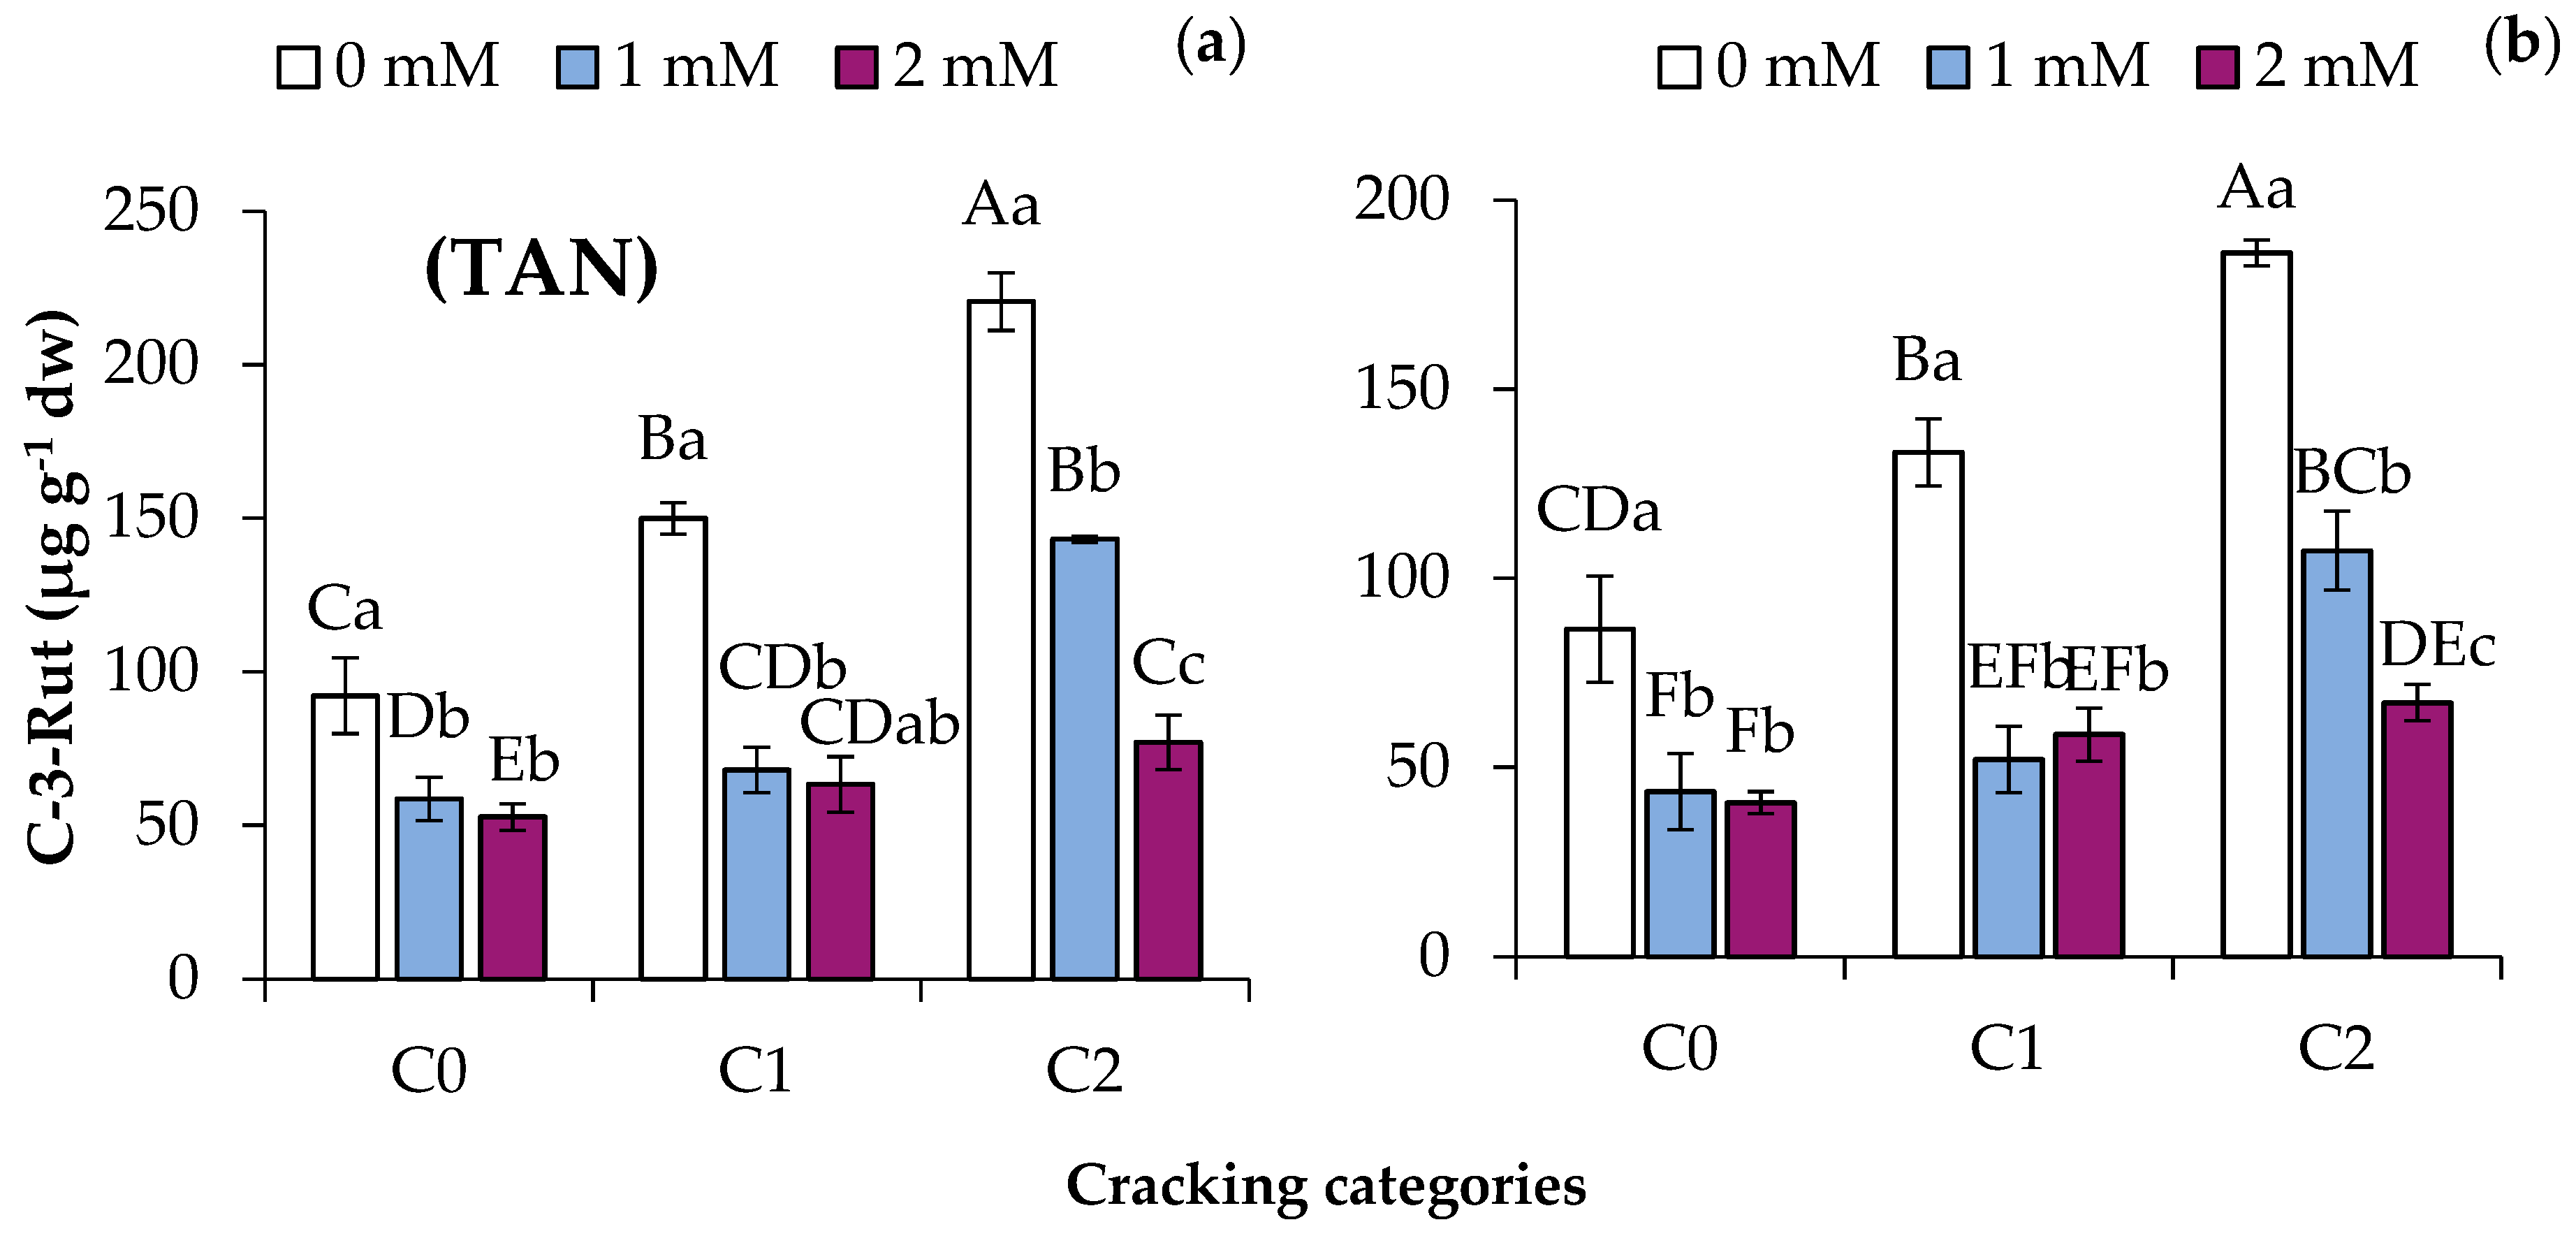
3.3. SA Application Decreases Total Anthocyanins and Cyanidin-3-Rutinoside Contents

In year 1, TAN (expressed as c-3-rut) ranged from 53 (C0 of fruit treated with SA at 2 mM) to 221 μg g−1 dw (controls in C2) (Figure 3a). In the C2 class, TAN was reduced by increasing SA concentration. In C0 and C1 classes, both SA concentrations (1 and 2 mM) reduced TAN, reaching similar levels in comparison to controls. The concentration effect in each category was significant (psa < 0.001) (Table 2).
Overall data analysis showed that the highest TAN in C2 controls was followed by C1 and C2 of fruit treated with SA (1 mM), and this effect was significant (pall < 0.001). Indeed, a considerable increase in TAN was observed in controls by advanced cracking, whereas increasing the SA concentration in C2 progressively reduced TAN.
In year 2, TAN was 215 μg g−1 dw and 45 μg g−1 dw in controls and SA treated-fruit, respectively (Table 3). The SA concentration effect was significant at psa < 0.05 (Table 3), confirming the negative effect of SA application on TAN content.
The c-3-rut (the major anthocyanin in fig) content was also individually determined, and exhibited a pattern very similar to that of TAN (Figure 3b). The lowest c-3-rut value of 41 μg g−1 dw was observed in fruit treated with SA (2 mM) in C0 and the highest value of 186 μg g−1 dw in controls in C2. The effect of SA concentration on c-3-rut content was significant in each category, C0, C1, and C2, at psa < 0.001, psa < 0.001, and psa < 0.01, respectively. Controls had the highest c-3-rut content in each category. In addition, c-3-rut content was advanced by cracking. Indeed, all data analyzed together confirmed that controls in C2 obtained the highest value followed by controls in C1 and fruit treated with SA (1 mM) in C2. These differences were significant (pall < 0.001; Table 2).

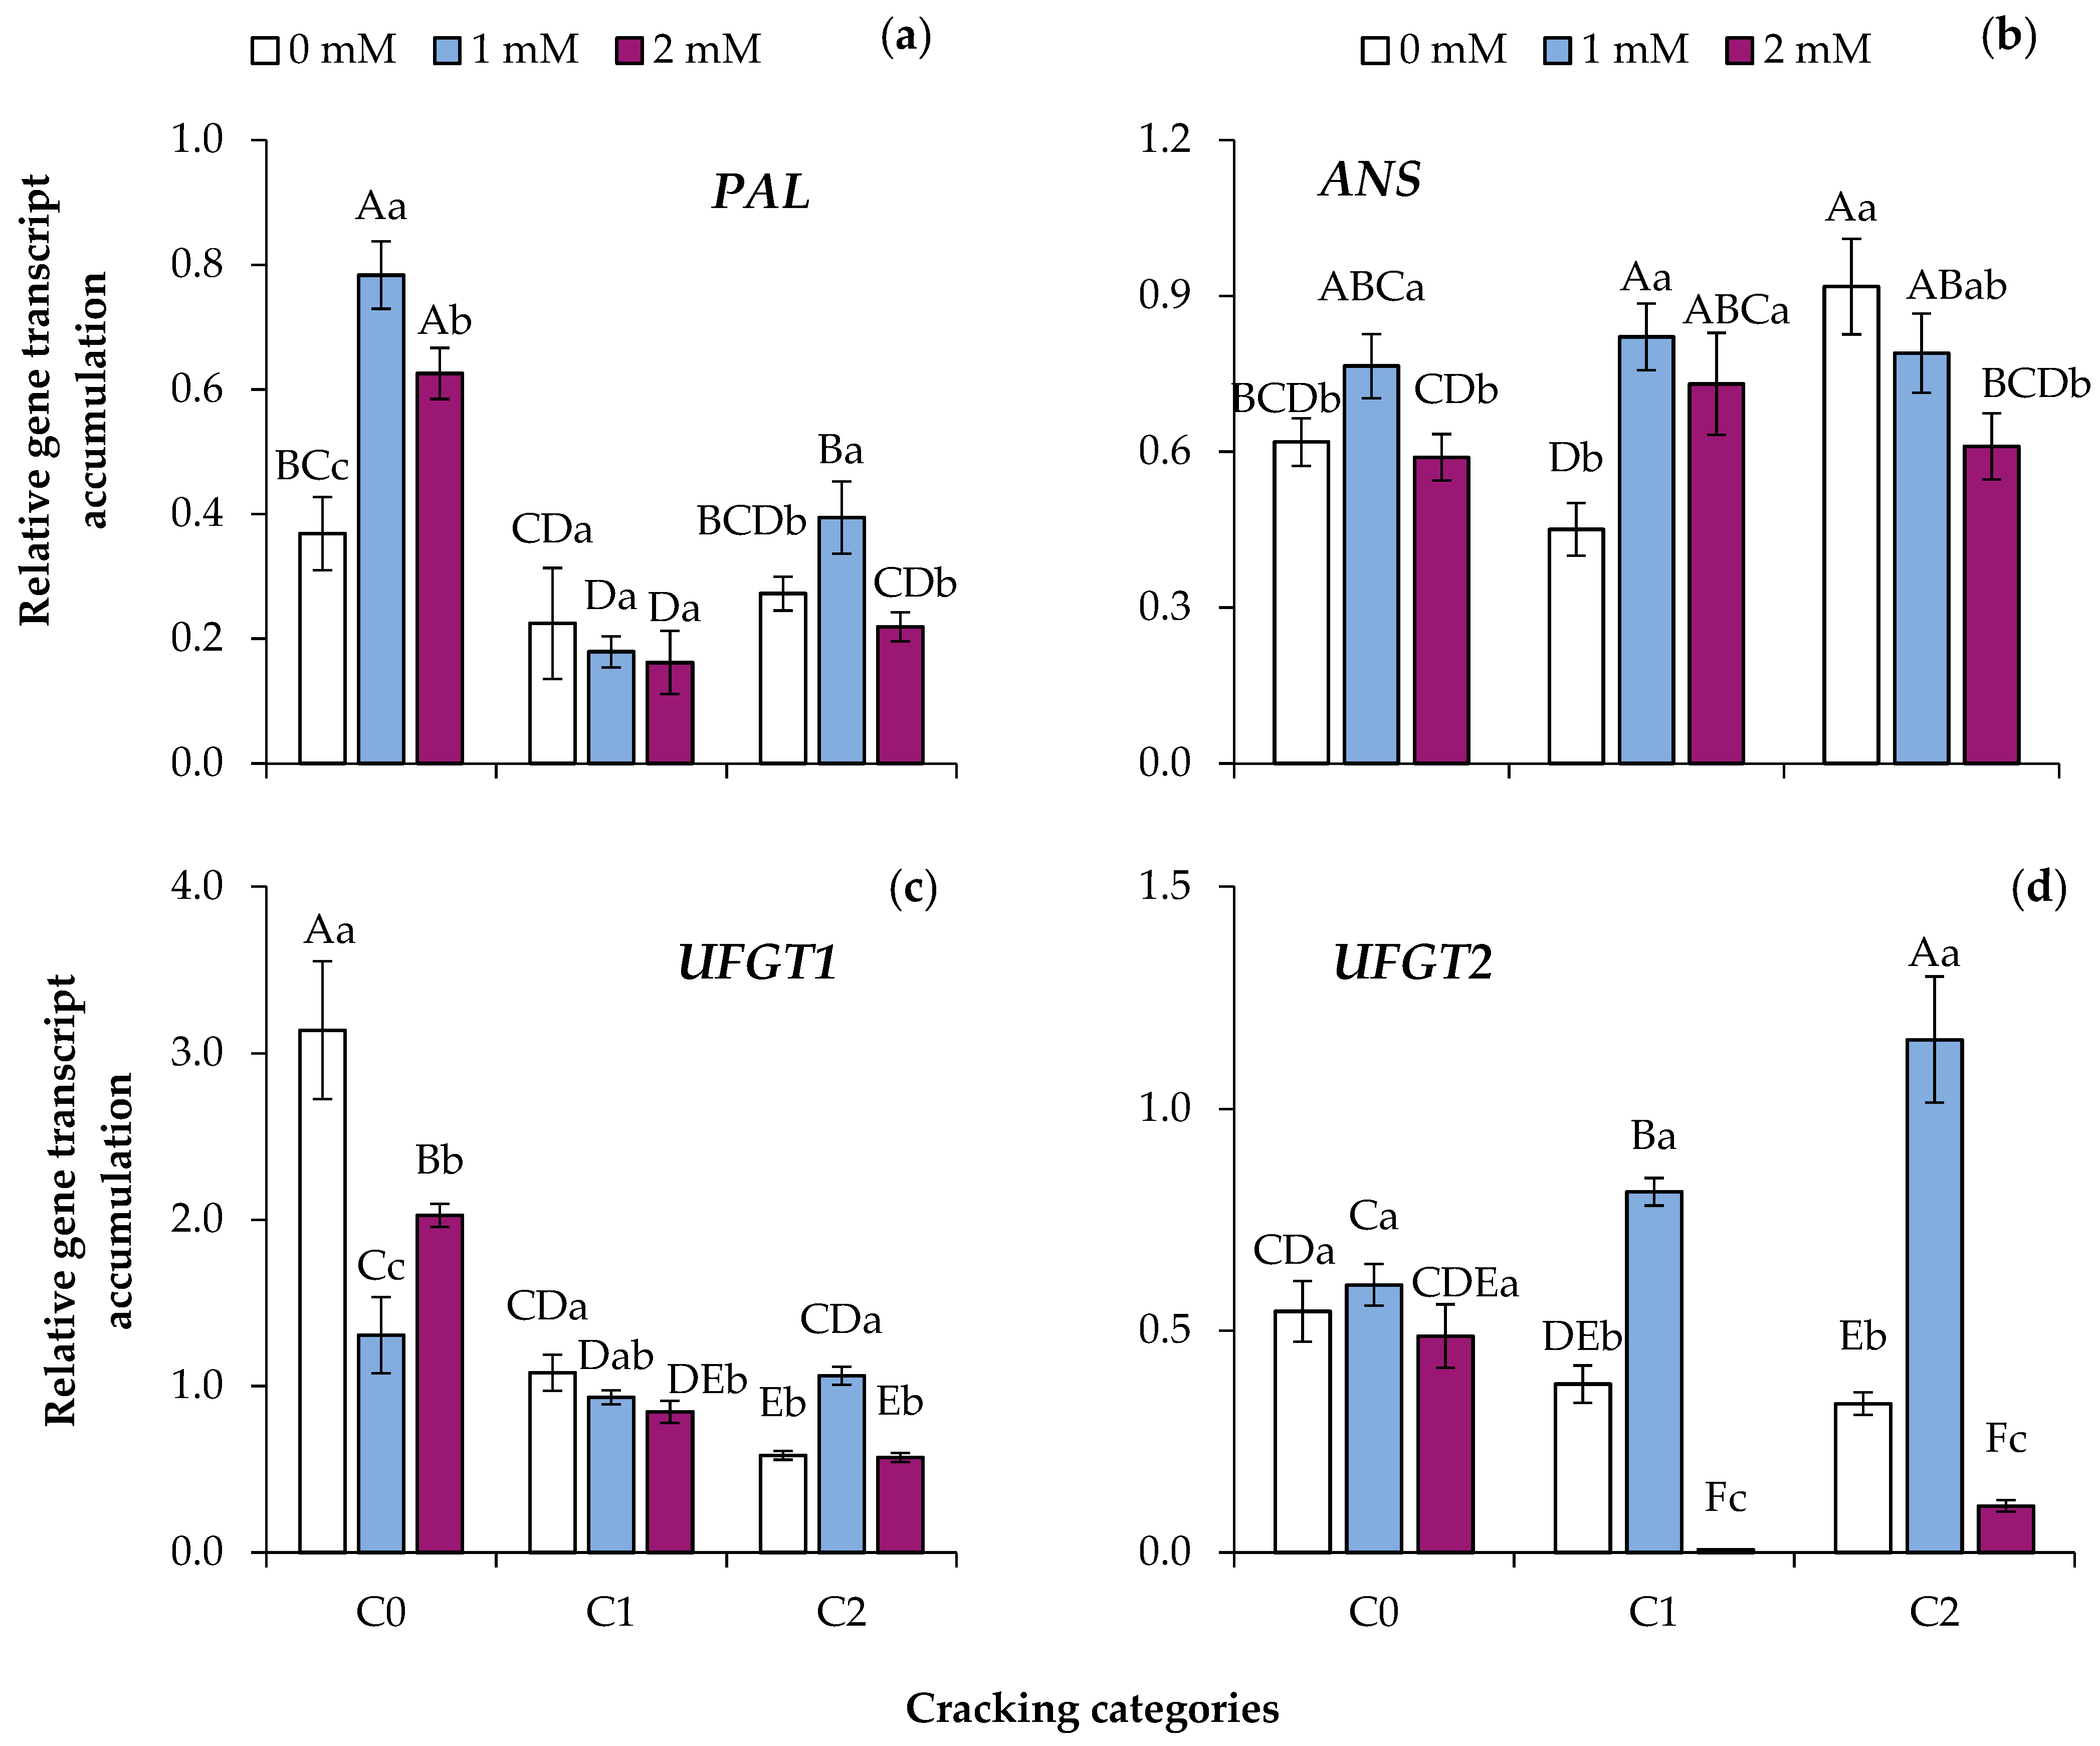
3.4. Expression Analysis of Genes Coding for Regulatory Enzymes of the Phenylpropanoid Biosynthetic Pathway

In C0, SA application (1 and 2 mM) promoted the PAL transcription levels, and this effect was more prominent at 1 mM (Figure 4a). In C1, SA application did not affect PAL transcription. In C2, SA application (1 mM) increased the PAL transcription levels. The concentration effect was significant (psa < 0.001) in the C0 and C2 categories and not significant in C1 (Table 2).
Comparing all data, SA-treated fruit in C0 exhibited the highest transcript levels followed by controls in C0 and SA-treated fruit (1 mM) in C2 (pall < 0.001; Table 2). Partial analyses of SA-treated fruit (2 mM) in all categories, exhibited a significant decreasing effect (p < 0.001) for PAL transcript levels.
In C0, SA application (1 mM) showed the highest ANS transcript levels (psa < 0.05). In C1, SA application (1 and 2 mM) increased transcript levels as compared to the control. In C2, SA application (2 mM) decreased transcript level as compared to the control. The concentration effect was significant in each category, C0, C1, and C2, at psa < 0.05, psa < 0.01, and psa < 0.01, respectively (Figure 4b; Table 2).
Comparison of all data (Figure 4b) showed significant differences (pall < 0.001), but changes in the levels showed no consistent trend, apart from SA application (1 mM) maintaining similarly high values in all categories.
Controls in C0 exhibited the highest transcription levels of UFGT1 (Figure 4c), followed by SA-treated fruit (2 mM) in C0. In C1, the levels of SA-treated fruit (2 mM) were slightly lower than controls (psa < 0.05), whereas in C2 the SA-treated fruit (1 mM) were higher than controls and SA-treated fruit (2 mM) psa < 0.001) (Table 2).
Comparison of all data showed a superiority of controls followed by SA-treated fruit (2 mM) in C0 (pall < 0.001). Partial analyses of controls, and SA-treated fruit (1 and 2 mM), showed that UFGT1 exhibited significantly decreasing values in cracked fruit in all categories, C0, C1, and C2, at p < 0.001, p < 0.05, and p < 0.001, respectively.
By contrast, the highest transcript levels for UFGT2 were observed in C2 treated by 1 mM SA (Figure 4d). In C0, all fruit had similar levels and the SA effect was not significant (psa > 0.05; Table 2). In C1 and C2, controls had lower levels than SA-treated fruit (1 mM), while the levels of SA-treated fruit (2 mM) were largely diminished. The effect of concentration was highly significant in C1 and C2 (psa < 0.001) (Table 2). Comparison of all data indicated that levels in SA-treated fruit (1 mM) increased by cracking, in contrast to controls and SA-treated fruit (2 mM) where cracking decreased the respective levels (pall < 0.001). Partial analyses for each concentration confirmed that in controls and SA-treated fruit (2 mM), the levels of UFGT2 were significantly reduced by cracking and in contrast to SA-treated fruit (1 mM), where these were increased. Differences among categories were significant at psa < 0.001 for SA-treated fruit (1 and 2 mM), and psa < 0.01 for controls.

3.5. Total Soluble Solids (TSS), pH and Titratable Acidity (TA)

In year 1, values of TSS varied from 14.9 to 16.7, TA from 1.02 to 1.39, and pH from 4.06 to 4.48 (Table 4). Particularly, TSS were higher in fruit treated with SA (2 mM) than controls in all categories (C0, C1, and C2), and similar to fruit treated with SA (1 mM) in C0 (Table 4).
The SA concentration effect on TSS was significant for C0, C1, and C2 at psa < 0.01, psa < 0.001, and psa < 0.001, respectively (Table 2). For each SA concentration, TSS was increased by cracking (psa < 0.001), as confirmed by three partial analyses. Similar to TSS, highly significant effects of SA concentration on TA were evident (psa < 0.001) in all three categories (Table 2). Values of pH changed in a rather opposite direction as compared to TSS and TA. The effect of SA concentration was significant for pH in C0, C1, and C2 at psa < 0.05, psa < 0.001, and psa < 0.01, respectively. Partial analyses showed that for each SA concentration, the progressive cracking resulted in significant pH differences (p < 0.01, p < 0.05, and p < 0.01, for controls, 1mM SA-treated and 2 mM SA-treated fruit, respectively) (Table 4).
In year 2, fruit weight, L*, ho, C*, TSS, and TAN in controls of C0 were 62.7 g, 54.6, 99.4, 31.29, 17.4 °Brix, and 215 μg g−1 dw, respectively, against 65.1 g, 55.5, 109.5, 39.5, 19 °Brix, and 45.3 μg g−1 dw in 2 mM-treated fruit of C0, respectively (Table 4). The concentration effect was significant for all variables at psa < 0.05, apart from the fruit weight and L* (psa > 0.05) (Table 4).

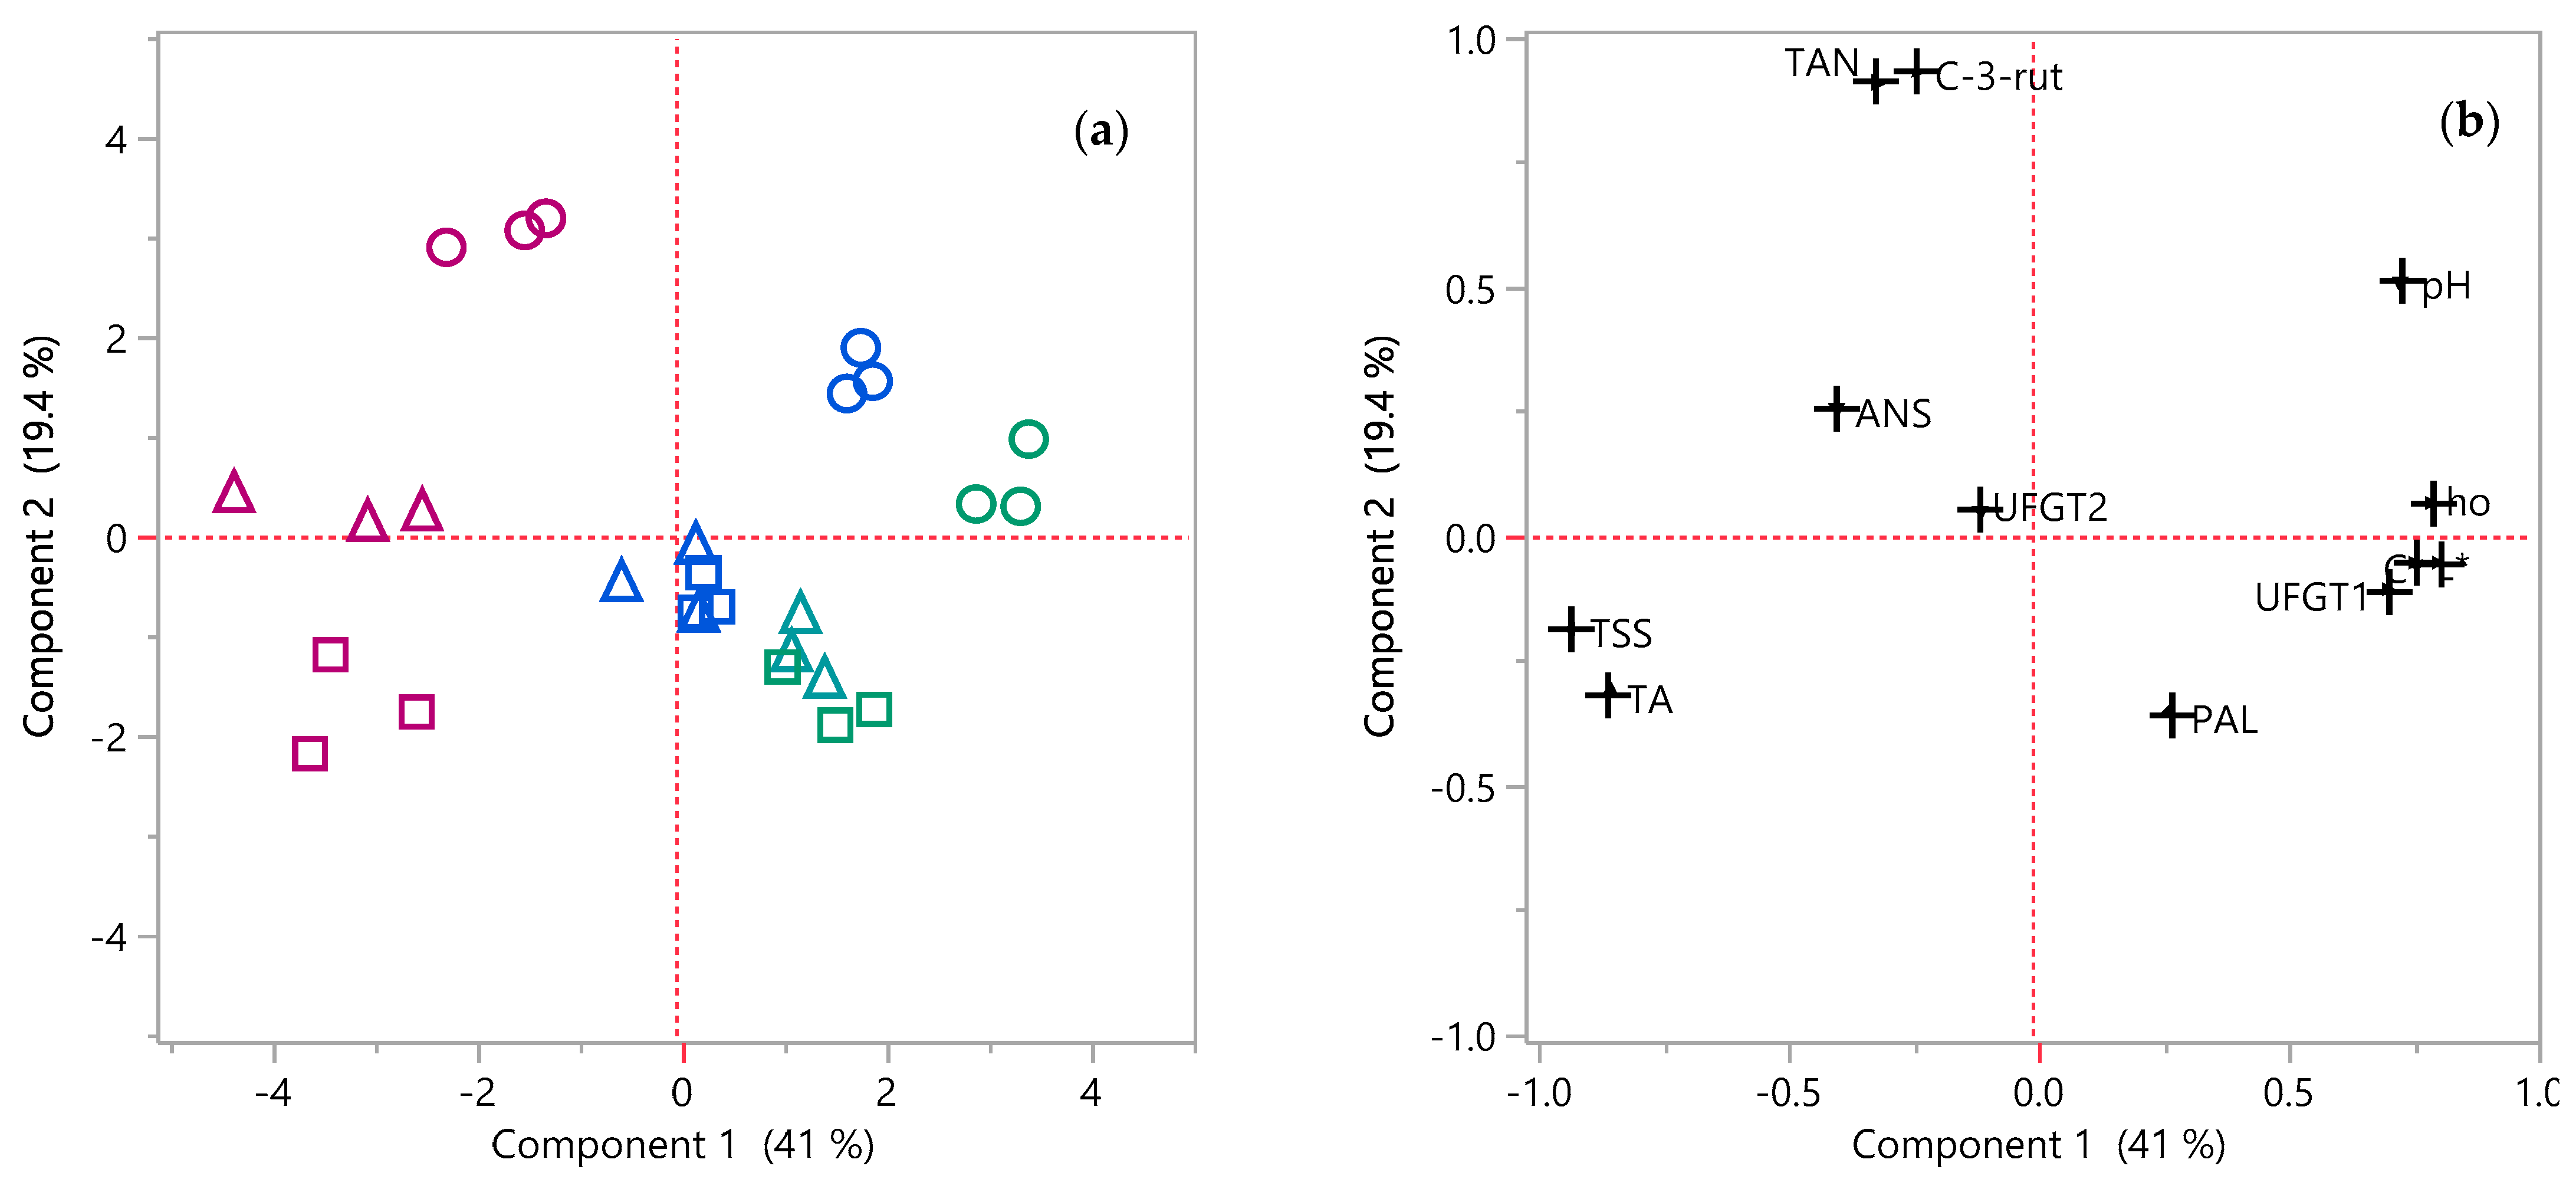
3.6. Principal Components Analysis (PCA) and Pairwise Correlations

The PCA exhibited two interpretable components that together explain 60.3% (eigenvalue 7.2) of the variation in L*, ho (hue angle), C*, TAN, C-3-rut, PAL, ANS, UFGT1, and UFGT2 in fig peel and TSS, TA, and pH in fig flesh (Figure 5a,b). In the score plot, a good replication of each cracking category and for every SA concentration is apparent. Category C2 is separate from the rest groups and positioned on the two left quarters, in contrast to C0 and C1 positioned on the two right quarters (Figure 5b).
Furthermore, C0 controls are positioned in the upper left quarter, while all SA-treated fruit in C0 are presented in the upper right quarter of the score plot. However, the 2 mM SA-treated fruit in C2 are found in the lower left quarter and the 1 mM SA-treated fruit in C2 in the lower right quarter, with C1 being placed between C0 and C2 (Figure 5b).
In the load plot, close positive relationships are indicated between TAN and c-3-rut (positioned very close to each other on the left upper end), between TSS and TA (in the lower left quarter towards the left axis of the load plot), and between L* and C* (near the right axis of the load plot) (Figure 5a). Indeed, TAN was related to c-3-rut with a highly significant, positive relationship (r = 0.978). Highly significant, positive relationships were also observed in the relations of TSS to TA (r = 0.947) and L* to C* (r = 0.911), whereas TA was related to pH with a negative one (r = −0.807) (Table S1). Besides, PAL is positioned opposite to ANS (Figure 5a,b) and not related to UFGT1 and UFGT2 (Table S1).

4. Discussion

4.1. SA Application Decreased Fruit Cracking Incidence and Severity

Cracking downgrades quality, and limits both storage potential and shelf life [2]. This study for the first time shows that preharvest SA foliar spray decreases both cracking incidence and severity in fig fruit, and this effect exhibits a concentration dependency at least up to 2 mM (Figure 1). SA application considerably increased the percentages of sound (absence of cracking) and of marketable (sound and slightly cracked) fruit. This result was consistent in two experimental years, and by using different orchards, which were situated in distant locations, and receiving dissimilar practices further confirmed the SA results.
In other fruit species, SA have earlier been associated primarily with alleviation of peel damage though no effect on cracking incidence has been reported apart from the minimal effect on pomegranates found in one case in a study [29]. Recently, preharvest salicylate application prevented russeting (i.e., microscopic cracks in the cuticle and a corky-like peel area beneath them), but did not reduce cracking in pomegranates [20]. In loquat, preharvest salicylate application did not affect cracking incidence or purple spot disorder [38]. Generally, the effectiveness of salicylate treatment depends on the species in combination with the number of applications [20], the fruit developmental stage at which applications are carried out [24,39], the formulation and type of SA derivatives [40], and the concentration [23].

4.2. Color Development in Peel and Transcription of Related Enzymes

Peel color in the C0 category (sound fruit) remained nearly green, and was not affected by SA application. Color in the C1 category (slightly-cracked fruit) remained rather stable and close to the one in C0, apart from a limited coloration following 1 mM SA application. Peel color changes were mostly evident in the C2 category (highly-cracked fruit). This implies that peel red color development mostly occurred in cracked fruit. This does not necessarily suggest that all cracked fruit are riper than sound fruit, since other factors, such as adequate sunlight reception, promote coloration [41]. Cracking stress could possibly induce anthocyanin synthesis as well.
Preharvest salicylate application enhanced color development in cherry [39] and grape [23,42], whereas it delayed it in another sweet cherry study [40]. However, the direction of the effect may be altered by adjusting the applied concentration and developmental stage. For instance, coloring was drastically prevented with 0.5 mM MeSA in tomato [24] and 5 mM or 10 mM SA in grapes [23], whereas it was promoted at lower concentration than the ones used in both last cases.
SA application (1 mM) resulted in slightly enhanced peel coloration as compared to the remaining treatments. However, cracking was alleviated more by the higher SA concentration (2 mM), and this is far more important for fruit marketability, as compared to coloration.
The obtained results confirmed that the major peel anthocyanin was c-3-rut in the variety under study [31]. Similar findings have been obtained by examining other varieties [43,44]. Indeed, here, TAN and c-3-rut contents were significantly positively related (r = 0.978) (Table S1).
Transcript accumulation of PAL, ANS, UFGT1, and UFGT2, corresponding to anthocyanin synthesis, did not seem to follow TAN or c-3-rut content changes (Figure 5; Table S1).
In this study, PAL gene transcripts were the highest in green peel sound fruit after SA treatment, indicating its possible role for crack prevention. It is well known that PAL enzyme is the first step of phenylpropanoid biosynthetic pathway [45]. It is required for the biosynthesis of anthocyanins, but also of a diverse range of phenolic compounds, upregulating antioxidant defense [27,46]. A similar defense stimulation due to salicylate application was reported earlier in red cherry [39], plum [22], and goji berry [16]. PAL transcription and activity was also elicited by low temperature stress [47], exerting the above-mentioned positive effects on non-colored fruit tissue [46]. Therefore, salicylate application effectively mimics the stress-induced increase in PAL transcript levels.
ANS converts the leucoanthocyanidins to colored anthocyanidins [35]. In this study, ANS transcript levels were similar among treatments. By contrast, earlier work indicated that FcANS1 gene expression and anthocyanin content were similarly upregulated during fig development and maturation [48].
The non-stable anthocyanidins are further glycosylated by uridine diphosphate (UDP)-glucose: flavonoid 3-O-glycosyl-transferase (UFGT), resulting in the stable anthocyanins [35]. This study revealed that the highest UFGT1 gene transcription was apparent in sound controls. A decrease in UFGT1 transcript accumulation in slightly- and highly- cracked fruit in comparison to the sound ones, as well as in SA-treated sound fruit was noted. On the contrary, UFGT2 gene transcription decreased cracking in controls and in 2 mM SA-treated fruit but increased considerably by cracking in 1 mM SA-treated fruit. Therefore, in this work, there was no relation of transcript levels of genes coding for PAL, ANS, UFGT1, and UFGT2 either among them or to any other variable under study (Table S1). Partially or completely different patterns of expression in genes coding for enzymes responsible for anthocyanin synthesis have also been previously observed in cherry [49] and pear [50].
It is worth noting that fig ripening physiology is unique in several aspects. Fast ripening of the fig fruit on the tree [1], harvesting at climacteric or post-climacteric stage, which occurs inevitably at commercial ripe stage, and the non-climacteric peel behavior along with the climacteric inflorescence or pulp are specific features of the fig fruit [51]. Furthermore, in figs, the ethylene produced by the climacteric tissues of inflorescence synchronizes the fruit ripening, and abscisic acid (ABA) induces anthocyanin biosynthesis [52] and advances the ripening of all tissue types, with ripening of receptacles being mainly regulated by ABA [52,53]. However, salicylates are antagonists of both ethylene [24,54,55] and ABA [56,57] and this dual antagonism may prevent peel ripening, including the color development in the non-climacteric fig peel. Moreover, the slower ripening of peel in SA-treated figs provides the opportunity for a harvest delay, reducing the need for frequent harvesting and possibly resulting in further enrichment of fruit in nutrients.

4.3. Ripening Indices Other than Color

In year 2, SA treatment did not affect fruit weight. Instead, salicylate application increased fruit weight in plum [22] and pomegranate [20]. However, the present results are limited to estimate this effect. Fig fruit on the same shoot ripen in succession with a great time difference between fruit at the basal node and those at the upper end [1]. Consequently, the possible SA effect on fruit weight and crop load required different experimental plans than the presented one.
Here, SA application increased TSS, enhancing nutritional value and fruit quality. The increased TSS in treated fruit could be attributed to higher rates of photosynthesis and sugar translocation to fruit [58]. Notably, it also increased TA and decreased pH. These effects on pulp acidity are not expected to adversely affect fruit quality. At first, their magnitude was relatively low. Secondly, the ratio of TSS/TA is generally more important for consumer preference as compared to their separate values [59].

5. Conclusions

Peel cracking and ostiole-end splitting (collectively termed cracking) downgrade fig fruit quality and thus limit its marketability. In this study, the possibility of mitigating cracking at harvest by preharvest foliar salicylic acid (SA) sprays was addressed. SA application (2 mM) increased the percentage of fruit not showing cracking (sound) by 1.4–2.6-fold, and of marketable fruit (sound and slightly cracked) by 2-fold. SA application (2 mM) was associated with increased flesh TSS and TA, as well as with decreased flesh pH and peel stripe red coloration. SA application (2 mM) also decreased TAN and c-3-rut contents. However, the cracking prevention achieved by SA application is much more important for the marketability of fruit. Moreover, the red stripe coloration develops completely at tree ripe and overripe stage, whereas it is limited at the commercial stage [31] when figs have to be harvested [1]. The prevention of cracking facilitates harvesting and postharvest management of figs. Furthermore, it provides the opportunity for a harvest delay, reducing the need for frequent harvesting.
Conclusively, SA appears to be a low-cost and eco-friendly means of enhancing fig fruit quality, and thus marketability. However, more studies are needed to evaluate the flesh quality and storability of the treated fruit.

Supplementary Materials

The following are available online at https://www.mdpi.com/article/10.3390/app112311374/s1, Table S1: Pairwise correlations among TSS, pH, TA, TAN, C-3-rut, PAL, ANS, UFGT1, UFGT2, L*, C*, and in all cracking categories (C0, C1 and C2) in ‘Vasilika’ figs treated with 0, 1, and 2 mM SA at preharvest stage, in year 1.

Author Contributions

Conceptualization, E.T.; methodology, M.K., G.T. and E.T.; software, A.D.K., M.K., D.F. and J.B.; validation, A.D.K., M.K. and J.B.; formal analysis, A.D.K., M.K., M.V.C. and J.B.; investigation, A.D.K., M.K. and G.T.; resources, M.V.C., M.K. and E.T.; data curation, A.D.K., M.K., M.V.C., D.F. and E.T.; writing—original draft preparation, A.D.K. and E.T.; writing—review and editing, D.F., M.K., A.D.K., J.B. and E.T.; data interpretation and valuable insights, J.B. and E.T.; supervision, E.T. All authors have read and agreed to the published version of the manuscript.

Funding

This research received no external funding.

Institutional Review Board Statement

Not applicable.

Informed Consent Statement

Not applicable.

Data Availability Statement

Data are available on request.

Acknowledgments

The authors thank A. Katsileros for statistical advice. Thanks are also due to S. Papassotiriou and T. Damianakos for the access to their field properties in the counties of Attiki and Lakonia, respectively, and free supply of fig fruits. All individuals included in this section have consented to the acknowledgement.

Conflicts of Interest

The authors declare no conflict of interest.

References

  1. Flaishman, M.A.; Rodov, V.; Stover, E. The fig: Botany, horticulture, and breeding. Hortic. Rev. 2008, 34, 113–196. [Google Scholar] [CrossRef]
  2. Kong, M.; Lampinen, B.; Shackel, K.; Crisosto, C.H. Fruit skin side cracking and ostiole-end splitting shorten postharvest life in fresh figs (Ficus carica L.), but are reduced by deficit irrigation. Postharvest Biol. Technol. 2013, 85, 154–161. [Google Scholar] [CrossRef]
  3. Colelli, C.; Amodio, M.L. Subtropical fruits: Fig. In Controlled and Modified Atmospheres for Fresh and Fresh-Cut Produce; Gil, M., Beaudry, R., Eds.; Academic Press: Cambridge, MA, USA, 2020; pp. 427–434. [Google Scholar] [CrossRef]
  4. Byeon, S.E.; Lee, J. Fruit maturity differentially affects fruit quality and responses of targeted metabolites in cold-stored figs (Ficus carica L.). J. Sci. Food Agric. 2021, 101, 673–683. [Google Scholar] [CrossRef] [PubMed]
  5. Khadivi-Khub, A. Physiological and genetic factors influencing fruit cracking. Acta Physiol. Plant 2015, 37, 1718. [Google Scholar] [CrossRef]
  6. Kaur, R.; Kaur, N.; Singh, H. Pericarp and pedicel anatomy in relation to fruit cracking in lemon (Citrus limon L Burm.). Sci. Hortic. 2019, 246, 462–468. [Google Scholar] [CrossRef]
  7. Chessa, I. Fig. In Postharvest Physiology and Storage of Tropical and Subtropical Fruits; Mitra, S., Ed.; CAB International: Wallingford, UK, 1997; pp. 245–268. [Google Scholar]
  8. Crisosto, C.H.; Ferguson, L.; Bremer, V. Fig. In Postharvest Biology and Technology of Tropical and Subtropical Fruits: Fundamental Issues; Yahia, E.M., Ed.; Woodhead Publishing: Sawston, UK, 2011; pp. 134–158. [Google Scholar] [CrossRef]
  9. OECD. Fresh Figs. In International Standards for Fruit and Vegetables; OECD Publishing: Paris, France, 2015. [Google Scholar] [CrossRef]
  10. Crane, J.C.; Blondeau, R. The use of growth-regulating chemicals to induce parthenocarpic fruit in the Calimyrna fig. Plant Physiol. 1949, 24, 44. [Google Scholar] [CrossRef] [PubMed]
  11. Holstein, H.; Crisosto, G.; Crisosto, C. Fertigation with potassium increases size and yield in fresh figs growing in California. Acta Hortic. 2017, 1173, 177–181. [Google Scholar] [CrossRef]
  12. Gaaliche, B.; Ladhari, A.; Zarrelli, A.; Mimoun, M.B. Impact of foliar potassium fertilization on biochemical composition and antioxidant activity of fig (Ficus carica L.). Sci. Hortic. 2019, 253, 111–119. [Google Scholar] [CrossRef]
  13. Irfan, P.K.; Vanjakshi, V.; Prakash, M.K.; Ravi, R.; Kudachikar, V.B. Calcium chloride extends the keeping quality of fig fruit (Ficus carica L.) during storage and shelf-life. Postharvest Biol. Technol. 2013, 82, 70–75. [Google Scholar] [CrossRef]
  14. Dempsey, D.M.A.; Klessig, D.F. How does the multifaceted plant hormone salicylic acid combat disease in plants and are similar mechanisms utilized in humans? BMC Biol. 2017, 15, 1–11. [Google Scholar] [CrossRef] [Green Version]
  15. Yao, H.; Tian, S. Effects of pre-and post-harvest application of salicylic acid or methyl jasmonate on inducing disease resistance of sweet cherry fruit in storage. Postharvest Biol. Technol. 2005, 35, 253–262. [Google Scholar] [CrossRef]
  16. Zhang, H.; Ma, Z.; Wang, J.; Wang, P.; Lu, D.; Deng, S.; Lei, H.; Gao, Y.; Tao, Y. Treatment with exogenous salicylic acid maintains quality, increases bioactive compounds, and enhances the antioxidant capacity of fresh goji (Lycium barbarum L.) fruit during storage. LWT 2021, 140, 110837. [Google Scholar] [CrossRef]
  17. Wang, L.; Chen, S.; Kong, W.; Li, S.; Archbold, D.D. Salicylic acid pretreatment alleviates chilling injury and affects the antioxidant system and heat shock proteins of peaches during cold storage. Postharvest Biol. Technol. 2006, 41, 244–251. [Google Scholar] [CrossRef]
  18. Asghari, M.; Aghdam, M.S. Impact of salicylic acid on post-harvest physiology of horticultural crops. Trends Food Sci. Technol. 2010, 21, 502–509. [Google Scholar] [CrossRef]
  19. Sayyari, M.; Babalar, M.; Kalantari, S.; Martínez-Romero, D.; Guillén, F.; Serrano, M.; Valero, D. Vapour treatments with methyl salicylate or methyl jasmonate alleviated chilling injury and enhanced antioxidant potential during postharvest storage of pomegranates. Food Chem. 2011, 124, 964–970. [Google Scholar] [CrossRef]
  20. Drogoudi, P.; Pantelidis, G.E.; Vekiari, S.A. Physiological disorders and fruit quality attributes in pomegranate: Effects of meteorological parameters, canopy position and acetylsalicylic acid foliar sprays. Front. Plant Sci. 2021, 12, 222. [Google Scholar] [CrossRef] [PubMed]
  21. Jiang, B.; Liu, R.; Fang, X.; Tong, C.; Chen, H.; Gao, H. Effects of salicylic acid treatment on fruit quality and wax composition of blueberry (Vaccinium virgatum Ait). Food Chem. 2022, 368, 130757. [Google Scholar] [CrossRef]
  22. Martínez-Esplá, A.; Serrano, M.; Valero, D.; Martínez-Romero, D.; Castillo, S.; Zapata, P.J. Enhancement of antioxidant systems and storability of two plum cultivars by preharvest treatments with salicylates. Int. J. Mol. Sci. 2017, 18, 1911. [Google Scholar] [CrossRef]
  23. García-Pastor, M.E.; Giménez, M.J.; Zapata, P.J.; Guillén, F.; Valverde, J.M.; Serrano, M.; Valero, D. Preharvest application of methyl salicylate, acetyl salicylic acid and salicylic acid alleviated disease caused by Botrytis cinerea through stimulation of antioxidant system in table grapes. Int. J. Food Microbiol. 2020, 334, 108807. [Google Scholar] [CrossRef]
  24. Ding, C.K.; Wang, C.Y. The dual effects of methyl salicylate on ripening and expression of ethylene biosynthetic genes in tomato fruit. Plant Sci. 2003, 164, 589–596. [Google Scholar] [CrossRef]
  25. Habibi, F.; Ramezanian, A.; Guillén, F.; Castillo, S.; Serrano, M.; Valero, D. Changes in bioactive compounds, antioxidant activity, and nutritional quality of blood orange cultivars at different storage temperatures. Antioxidants 2020, 9, 1016. [Google Scholar] [CrossRef]
  26. Sayyari, M.; Babalar, M.; Kalantari, S.; Serrano, M.; Valero, D. Effect of salicylic acid treatment on reducing chilling injury in stored pomegranates. Postharvest Biol. Technol. 2009, 53, 152–154. [Google Scholar] [CrossRef]
  27. Pappi, P.; Nikoloudakis, N.; Fanourakis, D.; Zambounis, A.; Delis, C. Differential triggering of the phenylpropanoid biosynthetic pathway key genes transcription upon cold stress and viral infection in tomato leaves. Horticulturae 2021, 7, 448. [Google Scholar] [CrossRef]
  28. Ahmadi-Majd, M.; Rezaei Nejad, A.; Mousavi-Fard, S.; Fanourakis, D. Postharvest application of single, multi-walled carbon nanotubes and graphene oxide stimulates rose keeping quality. J. Hortic. Sci. Biotechnol. 2021, in press. [Google Scholar] [CrossRef]
  29. Ahmed, F.F.; Mohamed, M.M.; Abou El-Khashab, A.M.A.; Aeed, S.H.A. Controlling fruit splitting and improving productivity of Manfalouty pomegranate trees by using salicylic acid and some nutrients. World Rural Observ. 2014, 6, 87–93. [Google Scholar]
  30. Durst, R.W.; Wrolstad, R.E. Separation and characterization of anthocyanins by HPLC. Curr. Protoc. Food Anal. Chem. 2001, 1, F1-3. [Google Scholar] [CrossRef]
  31. Karantzi, A.D.; Kafkaletou, M.; Christopoulos, M.V.; Tsantili, E. Peel colour and flesh phenolic compounds at ripening stages in pollinated commercial varieties of fig (Ficus carica L.) fruit grown in Southern Europe. J. Food Meas. Charact. 2021, 15, 2049–2063. [Google Scholar] [CrossRef]
  32. Giusti, M.M.; Wrolstad, R.E. Characterization and measurement of anthocyanins by UV-visible spectroscopy. Curr. Protoc. Food Anal. Chem. 2001, 1, F1-2. [Google Scholar] [CrossRef]
  33. Tsantili, E.; Shin, Y.; Nock, J.F.; Watkins, C.B. Antioxidant concentrations during chilling injury development in peaches. Postharvest Biol. Technol. 2010, 57, 27–34. [Google Scholar] [CrossRef]
  34. Cinquanta, L.; Di Matteo, M.; Esti, M. Physical pre-treatment of plums (Prunus domestica). Part 2. Effect on the quality characteristics of different prune cultivars. Food Chem. 2002, 79, 233–238. [Google Scholar] [CrossRef]
  35. Tsaniklidis, G.; Pappi, P.; Tsafouros, A.; Charova, S.N.; Nikoloudakis, N.; Roussos, P.A.; Paschalidis, K.A.; Delis, C. Polyamine homeostasis in tomato biotic/abiotic stress cross-tolerance. Gene 2020, 727, 144230. [Google Scholar] [CrossRef]
  36. Li, X.; Zhang, L.; Peng, Z.; Zhao, Y.; Wu, K.; Zhou, N.; Yan, Y.; Ramaswamy, H.S.; Sun, J.; Bai, W. The impact of ultrasonic treatment on blueberry wine anthocyanin color and its In-vitro anti-oxidant capacity. Food Chem. 2020, 333, 127455. [Google Scholar] [CrossRef] [PubMed]
  37. Wang, Z.; Cui, Y.; Vainstein, A.; Chen, S.; Ma, H. Regulation of Fig (Ficus carica L.) fruit color: Metabolomic and transcriptomic analyses of the flavonoid biosynthetic pathway. Front. Plant Sci. 2017, 8, 1990. [Google Scholar] [CrossRef] [Green Version]
  38. Hadjipieri, M.; Georgiadou, E.C.; Drogoudi, P.; Fotopoulos, V.; Manganaris, G.A. The efficacy of acetylsalicylic acid, spermidine and calcium preharvest foliar spray applications on yield efficiency, incidence of physiological disorders and shelf-life performance of loquat fruit. Sci. Hortic. 2021, 289, 110439. [Google Scholar] [CrossRef]
  39. Giménez, M.J.; Valverde, J.M.; Valero, D.; Guillén, F.; Martínez-Romero, D.; Serrano, M.; Castillo, S. Quality and antioxidant properties on sweet cherries as affected by preharvest salicylic and acetylsalicylic acids treatments. Food Chem. 2014, 160, 226–232. [Google Scholar] [CrossRef]
  40. Valero, D.; Diaz-Mula, H.M.; Zapata, P.J.; Castillo, S.; Guillen, F.; Martinez-Romero, D.; Serrano, M. Postharvest treatments with salicylic acid, acetylsalicylic acid or oxalic acid delayed ripening and enhanced bioactive compounds and antioxidant capacity in sweet cherry. J. Agric. Food Chem. 2011, 59, 5483–5489. [Google Scholar] [CrossRef]
  41. Rodov, V.; Vinokur, Y.; Horev, B. Brief postharvest exposure to pulsed light stimulates coloration and anthocyanin accumulation in fig fruit (Ficus carica L.). Postharvest Biol. Technol. 2012, 68, 43–46. [Google Scholar] [CrossRef]
  42. Gomes, E.P.; Borges, C.V.; Monteiro, G.C.; Belin, M.A.F.; Minatel, I.O.; Junior, A.P.; Tecchio, M.A.; Lima, G.P.P. Preharvest salicylic acid treatments improve phenolic compounds and biogenic amines in ‘Niagara Rosada’ table grape. Postharvest Biol. Technol. 2021, 176, 111505. [Google Scholar] [CrossRef]
  43. Solomon, A.; Golubowicz, S.; Yablowicz, Z.; Grossman, S.; Bergman, M.; Gottlieb, H.E.; Flaishman, M.A. Antioxidant activities and anthocyanin content of fresh fruits of common fig (Ficus carica L.). J. Agric. Food Chem. 2006, 54, 7717–7723. [Google Scholar] [CrossRef]
  44. Arvaniti, O.S.; Samaras, Y.; Gatidou, G.; Thomaidis, N.S.; Stasinakis, A.S. Review on fresh and dried figs: Chemical analysis and occurrence of phytochemical compounds, antioxidant capacity and health effects. Food Res. Int. 2019, 119, 244–267. [Google Scholar] [CrossRef] [PubMed]
  45. Strack, D. Phenolic metabolism. In Plant Biochemistry; Dey, P.M., Harborne, J.B., Eds.; Academic Press: Cambridge, MA, USA, 1997; pp. 387–434. [Google Scholar] [CrossRef]
  46. Christopoulos, M.V.; Tsantili, E. Participation of phenylalanine ammonia-lyase (PAL) in increased phenolic compounds in fresh cold stressed walnut (Juglans regia L.) kernels. Postharvest Biol. Technol. 2015, 104, 17–25. [Google Scholar] [CrossRef]
  47. Dixon, R.; Paiva, N.L. Stress-induced phenylpropanoid metabolism. Plant Cell 1999, 7, 1085–1097. [Google Scholar] [CrossRef]
  48. Cao, L.; Xu, X.; Chen, S.; Ma, H. Cloning and expression analysis of Ficus carica anthocyanidin synthase 1 gene. Sci. Hortic. 2016, 211, 369–375. [Google Scholar] [CrossRef]
  49. Tsaniklidis, G.; Kafkaletou, M.; Delis, C.; Tsantili, E. The effect of postharvest storage temperature on sweet cherry (Prunus avium L.) phenolic metabolism and colour development. Sci. Hortic. 2017, 225, 751–756. [Google Scholar] [CrossRef]
  50. Li, L.; Ban, Z.J.; Li, X.H.; Wu, M.Y.; Wang, A.L.; Jiang, Y.Q.; Jiang, Y.H. Differential expression of anthocyanin biosynthetic genes and transcription factor PcMYB10 in pears (Pyrus communis L.). PLoS ONE 2012, 7, e46070. [Google Scholar] [CrossRef] [PubMed] [Green Version]
  51. Freiman, Z.E.; Rosianskey, Y.; Dasmohapatra, R.; Kamara, I.; Flaishman, M.A. The ambiguous ripening nature of the fig (Ficus carica L.) fruit: A gene-expression study of potential ripening regulators and ethylene-related genes. J. Exp. Bot. 2015, 66, 3309–3324. [Google Scholar] [CrossRef] [Green Version]
  52. Lama, K.; Harlev, G.; Shafran, H.; Peer, R.; Flaishman, M.A. Anthocyanin accumulation is initiated by abscisic acid to enhance fruit color during fig (Ficus carica L.) ripening. J. Plant Physiol. 2020, 251, 153192. [Google Scholar] [CrossRef]
  53. Lama, K.; Yadav, S.; Rosianski, Y.; Shaya, F.; Lichter, A.; Chai, L.; Flaishman, M.A. The distinct ripening processes in the reproductive and non-reproductive parts of the fig syconium are driven by ABA. J. Exp. Bot. 2019, 70, 115–131. [Google Scholar] [CrossRef]
  54. Leslie, C.A.; Romani, R.J. Salicylic acid: A new inhibitor of ethylene biosynthesis. Plant Cell Rep. 1986, 5, 144–146. [Google Scholar] [CrossRef]
  55. Babalar, M.; Asghari, M.; Talaei, A.; Khosroshahi, A. Effect of pre-and postharvest salicylic acid treatment on ethylene production, fungal decay and overall quality of Selva strawberry fruit. Food Chem. 2007, 105, 449–453. [Google Scholar] [CrossRef]
  56. Kraeva, E.; Andary, C.; Carbonneau, A.; Deloire, A. Salicylic acid treatment of grape berries retards ripening. Vitis 1998, 37, 143–144. [Google Scholar]
  57. Tajima, Y.; Loo, E.P.I.; Saijo, Y. Plant physiological and molecular mechanisms in cross-regulation of biotic-abiotic stress responses. In Priming-Mediated Stress and Cross-Stress Tolerance in Crop Plants; Academic Press: Cambridge, MA, USA, 2020; pp. 21–34. [Google Scholar] [CrossRef]
  58. Rivas-San Vicente, M.; Plasencia, J. Salicylic acid beyond defence: Its role in plant growth and development. J. Exp. Bot. 2011, 62, 3321–3338. [Google Scholar] [CrossRef] [PubMed] [Green Version]
  59. Iglesias, I.; Echeverría, G. Differential effect of cultivar and harvest date on nectarine colour, quality and consumer acceptance. Sci. Hortic. 2009, 120, 41–50. [Google Scholar] [CrossRef]
Figure 1. Frequency of cracking categories (%), in year 1 (a) and year 2 (b), in fig peel after preharvest treatment with different concentrations of salicylic acid (SA). The effect of concentration was highly significant in both experiments, according to the Wilcoxon/Kruskal–Wallis χ2 test (p < 0.001). Values among or between SA concentrations in (a) or (b), respectively, which share a common lowercase letter do not differ significantly. In each category, data analyzed by one-way ANOVA showed the concentration effect: year 1: C0, p < 0.001; C1, p < 0.01; C2, p < 0.001; and year 2: C0, p < 0.001; C3, p < 0.001.
Applsci 11 11374 g001
Figure 2. Changes in color parameters L* (a), (b), and C* (c) in cracking categories of fig peel after preharvest treatment with different concentrations of salicylic acid (SA), in year 1. Categories: C0, sound fruit; C1, slightly cracked; C2, highly cracked. All data presented are means (n = 3); bars are standard deviations. Columns not sharing a common letter are significantly different by Tukey test (α = 0.05). Lowercase letters correspond to one-way ANOVA in each cracking category; capital letters correspond to one-way ANOVA of all data.
Applsci 11 11374 g002
Figure 3. Changes in total anthocyanin content (a) and in cyanidin−3−rutinoside (b) in cracking categories of fig peel after preharvest treatment with different concentrations of salicylic acid (SA), in year 1. Categories: C0, sound fruit; C1, slightly cracked; C2, highly cracked. All data presented are means (n = 3); bars are standard deviations. Columns not sharing a common letter are significantly different by Tukey test (α = 0.05). Lowercase letters correspond to one-way ANOVA in each cracking category; capital letters correspond to one-way ANOVA of all data.
Applsci 11 11374 g003
Figure 4. Changes in expression of genes coding for PAL (a), ANS (b), UFGT1 (c), and UFGT2 (d) in cracking categories of fig peel after preharvest treatment with different concentrations of salicylic acid (SA), in year 1. Categories: C0, sound fruit; C1, slightly cracked; C2, highly cracked. All data presented are means (n = 3); bars are standard deviations. Columns not sharing a common letter are significantly different by Tukey test (α = 0.05). Lowercase letters correspond to one-way ANOVA in each cracking category; capital letters correspond to one-way ANOVA of all data.
Applsci 11 11374 g004
Figure 5. Principal component analysis (PCA) in cracking categories of fig peel after preharvest treatment with different concentrations of salicylic acid (SA), in year 1, according to variables, including L*, ho, C*, total soluble solids (TSS), titratable acidity (TA), pH, total anthocyanin, cyanidin−3−rutinoside (c-3-rut), expression of genes coding for phenyl alanine ammonia lyase (PAL), anthocyanidin synthase (ANS), UDP-flavonoid glucosyl transferase 1 (UFGT1), and UDP-flavonoid glucosyl transferase 2 (UFGT2). Categories: green color, C0 (sound fruit); blue color, C1 (slightly cracked); purple color, C2 (highly cracked). Treatments: circles, controls; triangles, treated with 1 mM SA; squares, treated with 2 mM SA. (a) Score plot; (b) load plot. Daggers indicate the position of each variable in load plot. Numbers in parentheses correspond to the percentage of the total variance explained by each component.
Applsci 11 11374 g005
Table 1. Primer sequences used [36,37].
GeneEncoded EnzymeSequenceSequence 5′-3′
FcPALPhenylalanine ammonia lyaseSense primer:CCCGAGTTTGGATTATGGA
Antisense primer:TTGGCTCACCGTGTTCTT
FcANSAnthocyanidin synthaseSense primer:GAGCAGTGGGATTCAGGC
Antisense primer:TGGTCATCCGAGTTCACG
FcUFGT1GlycosyltransferaseSense primer:CGGAGAACACGGAGAAGAAG
Antisense primer:ATTCCCCTCCAAATTCCAAC
FcUFGT2GlycosyltransferaseSense primer:CAGTGTCGTTTGCTGCAGAT
Antisense primer:AAGGAAGTCAACGGCGAGTA
FcActin Sense primer:GCCATTCAAGCCGTGCTTT
Antisense primer:TGGGAACAGTGTGGCTGACA
Table 2. Probabilities of the effect of preharvest treatment with different concentrations of salicylic acid (SA) on L*, h°, C*, TSS, pH, and TA in fig flesh and TAN, C-3-rut, PAL, ANS, UFGT1, and UFGT2 in fig peel in each cracking category (C0, C1, C2) and of all data differences on the same variables, in year 1.
Probabilities
Concentration
Effect
CategoryVariables
L*C* TSS pH TA TAN C−-3−Rut PALANSUFGT1UFGT2
psaC0NSNSNS** * *** *** ** *** * *** NS
psaC1NS*** NS*** *** *** *** *** NS** * ***
psaC2NSNSNS*** ** *** *** *** ** ** *** ***
pall (all data differences)-** ** ** *** *** *** *** *** *** *** *** ***
Categories: C0, sound fruit; C1, slightly cracked; C2, highly cracked. *, p > 0.05; **, p < 0.01; ***, p < 0.001; NS, non-significant.
Table 3. Changes in fruit weight, L*, , C*, total soluble solids (TSS), and TAN in cracking categories of fig flesh after preharvest treatment with salicylic acid (SA), in year 2. Categories: C0, sound fruit; C3, slightly or highly cracked.
Concentration
(mM)
Weight
(g)
L*C*TSS
(°Brix)
TAN
(μg g−1 dw)
062.72 ± 3.64 a54.66 ± 1.70 a99.39 ± 2.50 b31.29 ± 1.70 b17.4 ± 0.70 b215.3 ± 69.35 a
265.15 ± 4.52 a55.56 ± 2.80 a109.59 ± 3.42 a39.52 ± 3.02 a19.0 ± 0.10 a45.37 ± 9.46 b
ptrNSNS* * * *
All data presented are means ± standard deviation (n = 3). Values with different letters showed statistically significant differences (α = 0.05) according to Tukey-HSD test. *, p < 0.05; NS, non-significant.
Table 4. Changes in total soluble solids (TSS), pH, and titratable acidity (TA) in cracking categories of fig flesh after preharvest treatment with different concentrations of salicylic acid (SA), in year 1. Categories: C0, sound fruit; C1, slightly cracked; C2, highly cracked.
Variables
CategoryTreatmentTSS (°Brix)pHTA
C00 mM14.93 ± 0.15 Eb4.48 ± 0.03 Aa1.02 ± 0.10 Fc
1 mM15.33 ± 0.12 CDa4.31 ± 0.02 Bb1.09 ± 0.20 Deb
2 mM15.47 ± 0.06 Ca4.28 ± 0.10 BCb1.18 ± 0.47 BCa
C10 mM15.12 ± 0.08 DEc4.42 ± 0.04 ABa1.06 ± 0.15 EFc
1 mM15.57 ± 0.15 Cb4.26 ± 0.02 BCb1.14 ± 0.40 CDb
2 mM15.97 ± 0.12 Ba4.32 ± 0.03 Ab1.20 ± 0.26 BCa
C20 mM16.00 ± 0.10 Bb4.36 ± 0.02 ABa1.21 ± 0.57 BCb
1 mM16.23 ± 0.12 Bb4.13 ± 0.12 CDb1.25 ± 0.25 Bb
2 mM16.73 ± 0.15 Aa4.06 ± 0.04 Db1.39 ± 0.44 Aa
All data presented are means (n = 3); bars are standard deviations. Columns not sharing a common letter are significantly different by Tukey test (α = 0.05). Lowercase letters correspond to one-way ANOVA in each cracking category; capital letters correspond to one-way ANOVA of all data.
Publisher’s Note: MDPI stays neutral with regard to jurisdictional claims in published maps and institutional affiliations.

