
Research on Shear Behavior of Sand–Structure Interface Based on Monotonic and Cyclic Tests

Abstract
:1. Introduction
2. Materials and Experimental Process
2.1. Test Soil
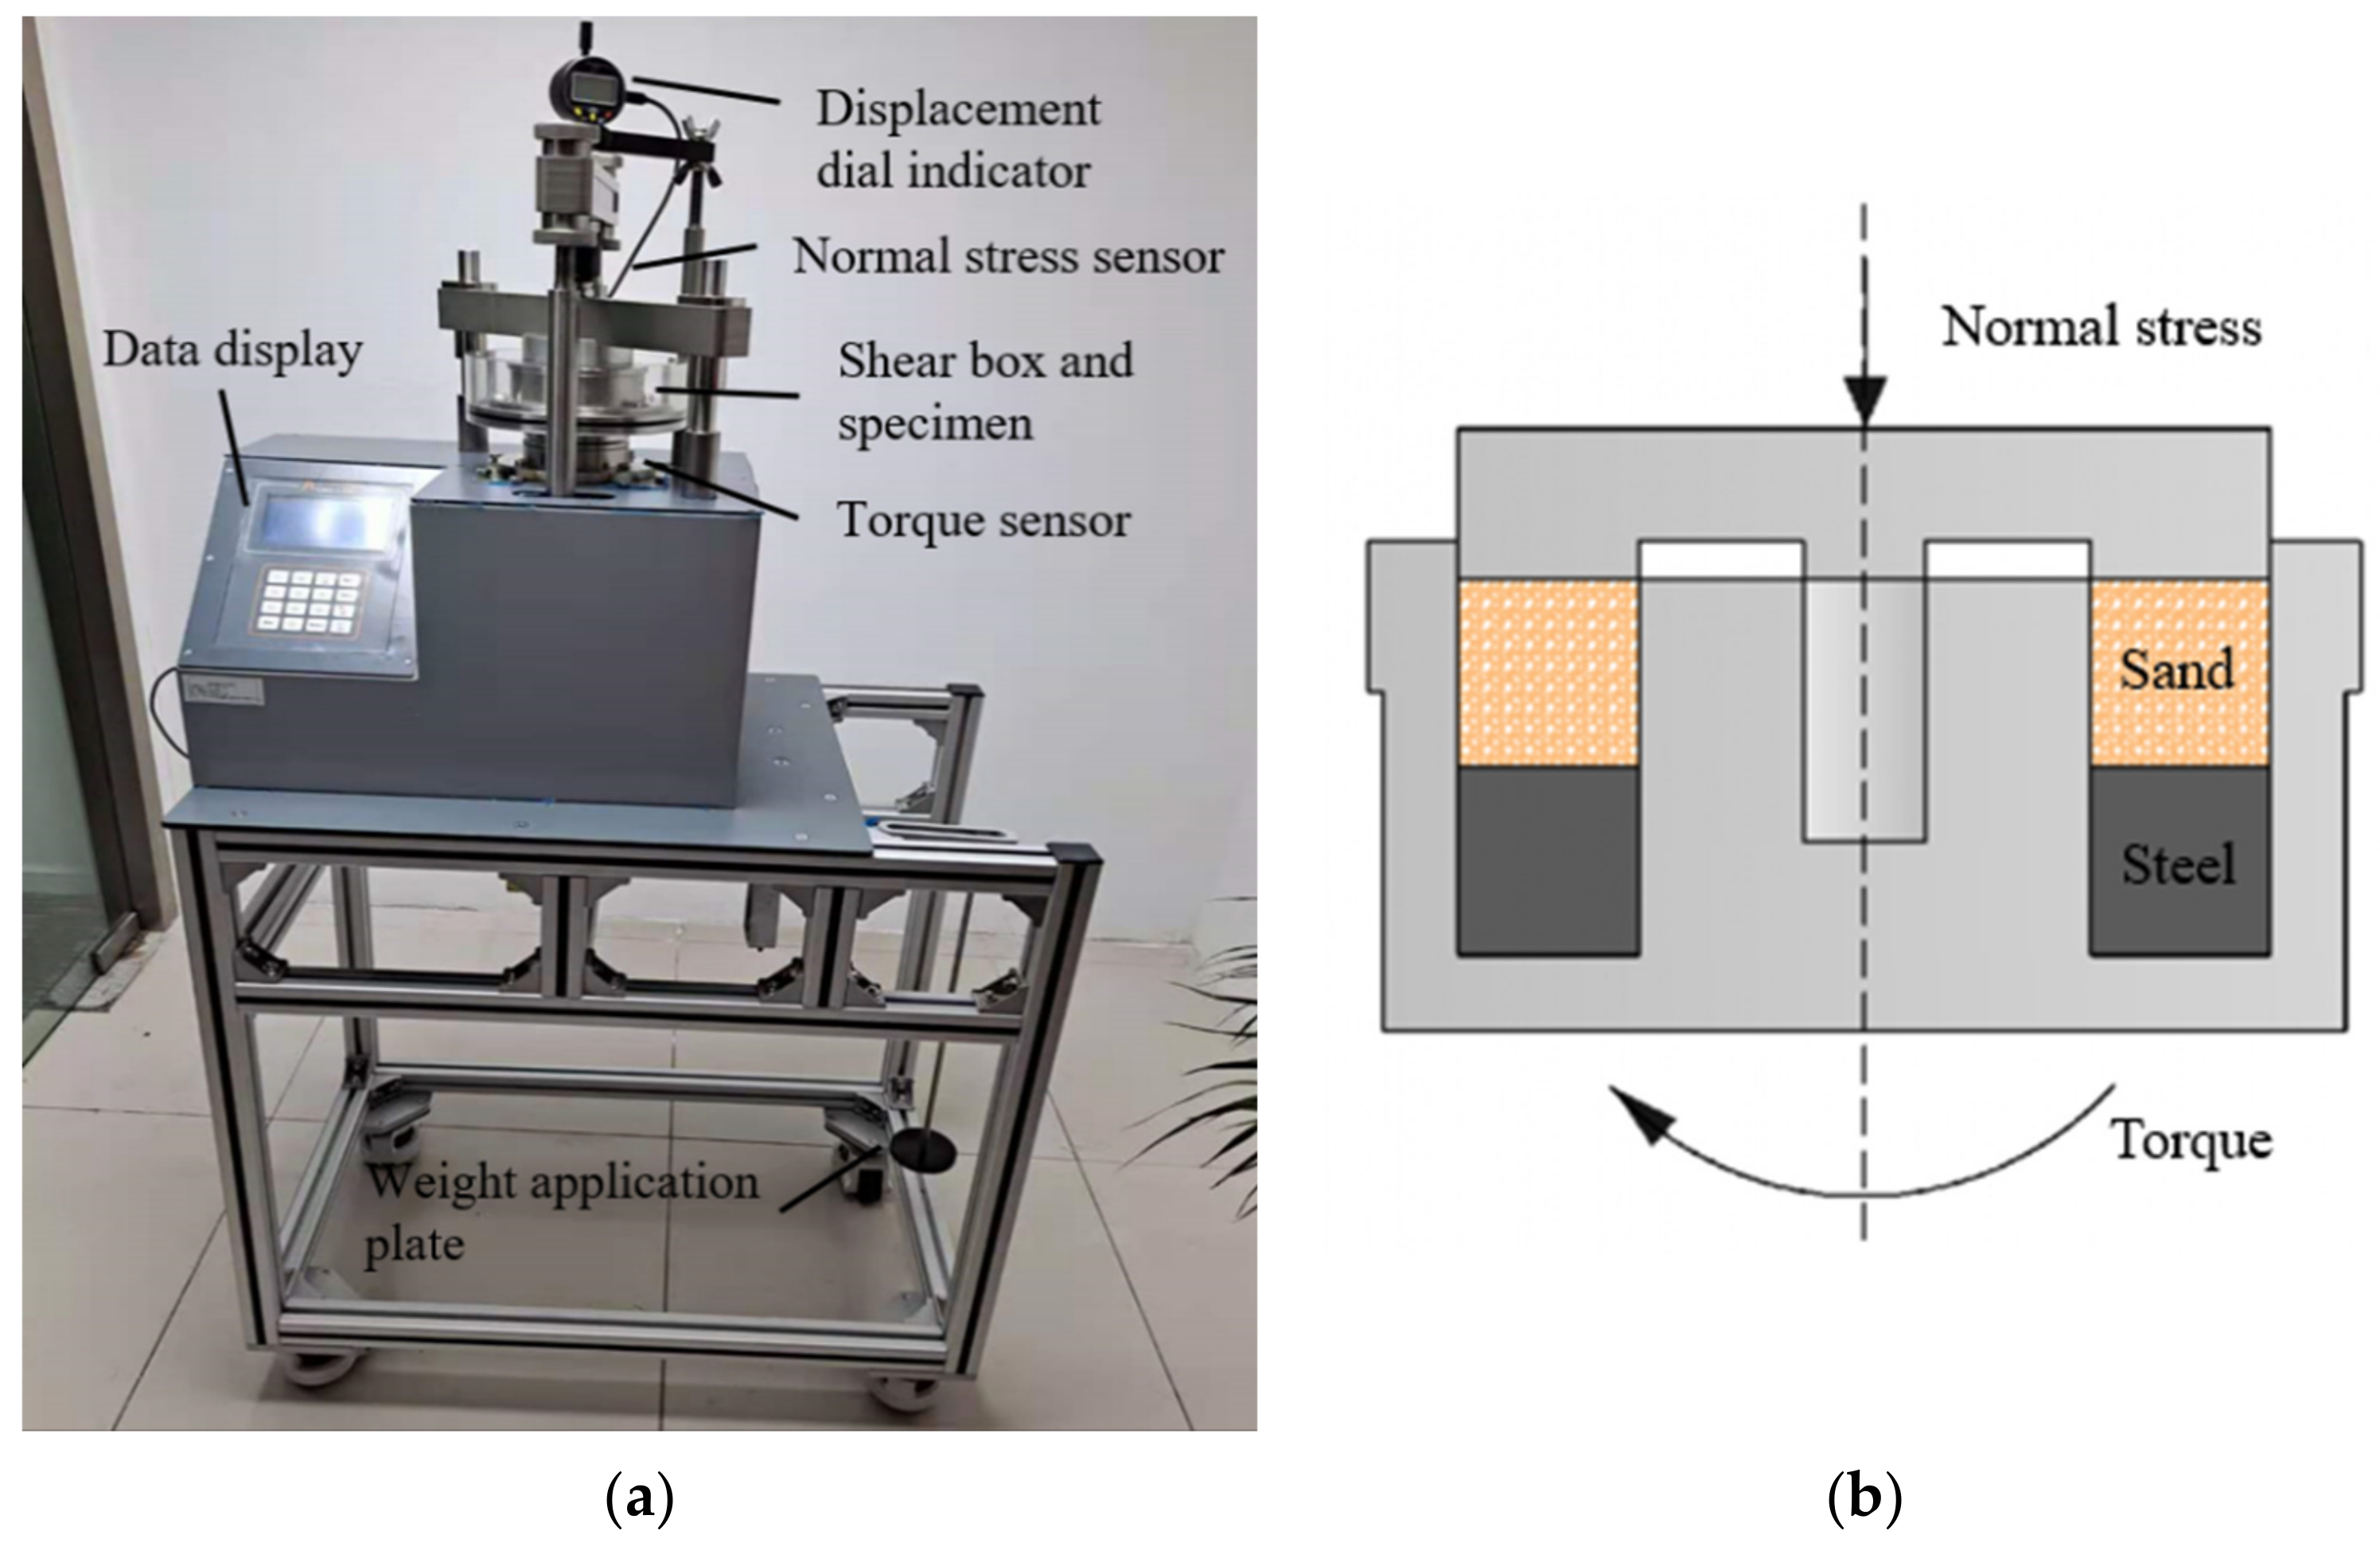
2.2. Test Apparatus
2.3. Roughness of Structure Interface
2.4. Experimental Programs
3. Monotonic Shear Tests
3.1. Test Results
3.1.1. Shear Stress–Shear Displacement Curve
3.1.2. Shear Displacement–Normal Displacement Curve
3.2. Analysis and Discussion
3.2.1. The Influence of Interface Roughness on Shear Strength
3.2.2. Initial Shear Stiffness
4. Cyclic Shear Tests
4.1. Test Results
4.1.1. The Relationship between Shear Displacement and the Shear Stress Ratio
4.1.2. Shear Displacement–Normal Displacement Curve
4.2. Analysis and Discussion
4.2.1. Residual Deformation of Cyclic Shear
4.2.2. Cyclic Loading and Unloading Shear Stiffness
4.2.3. Loading and Unloading Shear Stiffness under Different Stress Level Amplitudes
5. Methodology
6. Conclusions
- In the monotonic shear test, when the interface is relatively smooth, the shear stress–shear displacement curves of loose sand and dense sand both show strain hardening characteristics. When the interface is rough, there will be strain softening for dense sand. The initial shear stiffness of the sand–steel interface increases with the increase in normal stress, interface roughness, or the relative density of sand.
- Both loose sand and dense sand generally show volume shrinkage during the cycle. The initial loading process is similar to the case of static loading. In the later stages of dynamic loading, the shear shrinkage per cycle is relatively small and continues to develop. Additionally, as the normal stress increases, the accumulated normal deformation during dynamic loading decreases.
- When the stress level amplitude reaches 90%, residual deformation will occur during the cyclic shearing process. For loose sand in particular, the maximum deformation exceeds of 12%. However, when the stress level amplitude is less than or equal to 60%, there is almost no residual shear deformation.
- The unloading stiffness of the interface between the sand and the structure is always greater than the initial loading stiffness. Additionally, with the increase in the number of cycles, the loading stiffness continues to increase, and it may eventually approach the unloading stiffness. In addition, the increase in normal stress and interface roughness can improve the loading and unloading stiffness.
Author Contributions
Funding
Institutional Review Board Statement
Informed Consent Statement
Data Availability Statement
Acknowledgments
Conflicts of Interest
References
- Zeghal, M.; Edil, T.B. Soil structure interaction analysis: Modeling the interface. Can. Geotech. J. 2002, 39, 620–628. [Google Scholar] [CrossRef]
- Hu, L.; Pu, J. Testing and Modeling of Soil-Structure Interface. J. Geotech. Geoenviron. Eng. 2004, 130, 851–860. [Google Scholar] [CrossRef]
- Lashkari, A. Modeling of sand–structure interfaces under rotational shear. Mech. Res. Commun. 2010, 37, 32–37. [Google Scholar] [CrossRef]
- Yang, Z.X.; Jardine, R.J.; Zhu, B.T.; Foray, P.; Tsuha, C. Sand grain crushing and interface shearing during displacement pile installation in sand. Géotechnique 2010, 60, 469–482. [Google Scholar] [CrossRef] [Green Version]
- Ho, T.; Jardine, R.J.; Anh-minh, N. Large-displacement interface shear between steel and granular media. Géotechnique 2011, 61, 221–234. [Google Scholar] [CrossRef]
- Peng, H.; Kong, G.; Liu, H.; Abuel-Naga, H.; Hao, Y. Thermo-mechanical behaviour of floating energy pile groups in sand. J. Zhejiang Univ. Sci. A 2018, 19, 638–649. [Google Scholar] [CrossRef]
- Guerdouh, D.; Khalfallah, S. Soil-structure interaction effects on the seismic performance of frame structures. J. Constr. 2019, 18, 349–363. [Google Scholar] [CrossRef]
- Kwon, S.Y.; Yoo, M. Study on the Dynamic Soil-Pile-Structure Interactive Behavior in Liquefiable Sand by 3D Numerical Simulation. Appl. Sci. 2020, 10, 2723. [Google Scholar] [CrossRef] [Green Version]
- Isaev, O.N.; Sharafutdinov, R.F. Soil Shear Strength at the Structure Interface. Soil Mech. Found. Eng. 2020, 57, 139–146. [Google Scholar] [CrossRef]
- Forcellini, D. Soil-structure interaction analyses of shallow-founded structures on a potential-liquefiable soil deposit. Soil Dyn. Earthq. Eng. 2020, 133, 106108. [Google Scholar] [CrossRef]
- Forcellini, D. Numerical simulations of liquefaction on an ordinary building during Italian (20 May 2012) earthquake. Bull. Earthq. Eng. 2019, 17, 4797–4823. [Google Scholar] [CrossRef]
- Lopez-Caballero, F.; Modaressi-Farahmand-Razavi, A. Numerical simulation of mitigation of liquefaction seismic risk by preloading and its effects on the performance of structures. Soil Dyn. Earthq. Eng. 2013, 49, 27–38. [Google Scholar] [CrossRef]
- Borana, L.; Yin, J.-H.; Singh, D.N.; Shukla, S.K.; Tong, F. Direct Shear Testing Study of the Interface Behavior between Steel Plate and Compacted Completely Decomposed Granite under Different Vertical Stresses and Suctions. J. Eng. Mech. 2018, 144, 4017148. [Google Scholar] [CrossRef]
- Martinez, A.; Frost, J.D. The influence of surface roughness form on the strength of sand–structure interfaces. Géotechnique Lett. 2017, 7, 104–111. [Google Scholar] [CrossRef]
- Pra-ai, S.; Boulon, M. Soil–structure cyclic direct shear tests: A new interpretation of the direct shear experiment and its application to a series of cyclic tests. Acta Geotech. 2017, 12, 107–127. [Google Scholar] [CrossRef]
- Gu, X.; Chen, Y.; Huang, M. Critical state shear behavior of the soil-structure interface determined by discrete element modeling. Particuology 2017, 35, 68–77. [Google Scholar] [CrossRef]
- Uesugi, M.; Kishida, H.; Uchikawa, Y. Friction between dry sand and concrete under monotonic and repeated loading. Int. J. Rock Mech. Min. Sci. Geomech. Abstr. 1990, 27, 338. [Google Scholar] [CrossRef] [Green Version]
- Potyondy, J.G. Skin Friction between Various Soils and Construction Materials. Géotechnique 1961, 11, 339–353. [Google Scholar] [CrossRef]
- Hamid, T.B.; Miller, G.A. Shear strength of unsaturated soil interfaces. Can. Geotech. J. 2009, 46, 595–606. [Google Scholar] [CrossRef]
- Desai, C.S.; Drumm, E.C.; Zaman, M.M. Cyclic Testing and Modeling of Interfaces. J. Geotech. Eng. 1985, 111, 793–815. [Google Scholar] [CrossRef]
- Kwak, C.W.; Park, I.J.; Park, J.B. Dynamic shear behavior of concrete-soil interface based on cyclic simple shear test. KSCE J. Civ. Eng. 2014, 18, 787–793. [Google Scholar] [CrossRef]
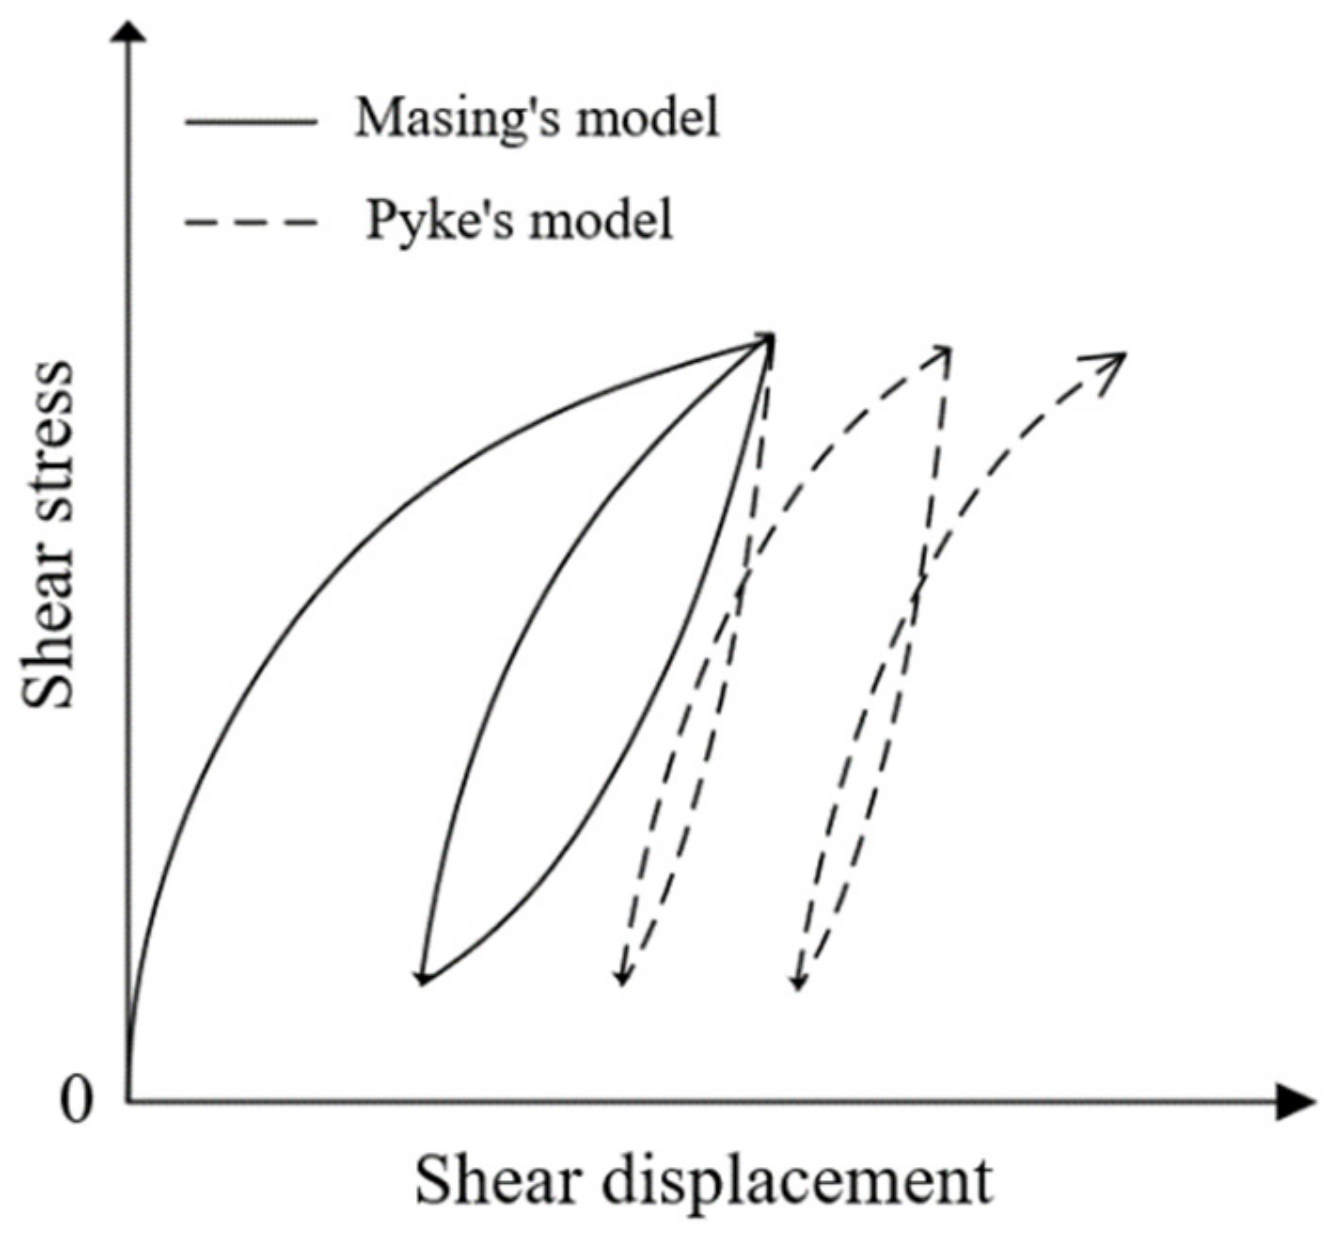
- Masing, G. Eigenspannungen und verfestigung beim messing. In Proceedings of the 2nd International Congress of Applied Mechanics, Zurich, Switzerland, 12–17 September 1926; pp. 332–335. [Google Scholar]
- Pyke, R.M. Nonlinear Soil Models for Irregular Cyclic Loadings. J. Geotech. Eng. Div. 1979, 105, 715–726. [Google Scholar] [CrossRef]
- Chang, K.-H.; Jeon, J.-T.; Lee, C.-H. Effects of residual stresses on the uniaxial ratcheting behavior of a girth-welded stainless steel pipe. Int. J. Steel Struct. 2016, 16, 1381–1396. [Google Scholar] [CrossRef]
- Adamchuk, M.P.; Borodii, M.V.; Selin, O.M.; Stryzhalo, V.O. Development of the Model for Cyclic Plasticity to Describe the Ratcheting Effect Under Non-Proportional Asymmetric Loading. Strength Mater. 2016, 48, 251–258. [Google Scholar] [CrossRef]
- Chen, X.; Chen, X. Study on ratcheting effect of pressurized straight pipe with local wall thinning using finite element analysis. Int. J. Press. Vessel. Pip. 2016, 139–140, 69–76. [Google Scholar] [CrossRef]
- Ferezqi, H.Z.; Shariati, M.; HadidiMoud, S. The Assessment of Elastic Follow-Up Effects on Cyclic Accumulation of Inelastic Strain Under Displacement-Control Loading. Iran J. Sci. Technol. Trans. Mech. Eng. 2018, 42, 127–135. [Google Scholar] [CrossRef]
- Sarkar, P.P.; Chakraborti, P.C. Uniaxial Ratcheting Behavior of a Weather-Resistant Rail Steel: Effect of Mean Stress and Stress Amplitude. J. Mater. Eng. Perform. 2020, 29, 2936–2946. [Google Scholar] [CrossRef]
- Hardin, B.O.; Drnevich, V.P. Shear Modulus and Damping in Soils: Design Equations and Curves. J. Soil Mech. Found. Div. 1972, 98, 667–692. [Google Scholar] [CrossRef]
- Punetha, P.; Mohanty, P.; Samanta, M. Microstructural investigation on mechanical behavior of soil-geosynthetic interface in direct shear test. Geotext. Geomembr. 2017, 45, 197–210. [Google Scholar] [CrossRef]
- Wang, J.; Ying, M.-J.; Liu, F.-Y.; Fu, H.-T.; Ni, J.-F.; Shi, J. Effect of Particle-Size Gradation on Coarse Sand-Geotextile Interface Response in Cyclic and Postcyclic Direct Shear Test. Adv. Civ. Eng. 2020, 2020, 1–11. [Google Scholar] [CrossRef]
- Kou, H.; Diao, W.; Zhang, W.; Zheng, J.; Ni, P.; JANG, B.-A.; Wu, C. Experimental Study of Interface Shearing between Calcareous Sand and Steel Plate Considering Surface Roughness and Particle Size. Appl. Ocean. Res. 2021, 107, 102490. [Google Scholar] [CrossRef]
- Su, L.-J.; Zhou, W.-H.; Chen, W.-B.; Jie, X. Effects of relative roughness and mean particle size on the shear strength of sand-steel interface. Measurement 2018, 122, 339–346. [Google Scholar] [CrossRef]


| Average Grain Diameter[mm] | Specific Gravity[-] | Coefficient of Uniformity[-] | Coefficient of Curvature[-] | Maximum Void Ratio[-] | Minimum Void Ratio[-] |
| 0.34 | 2.65 | 1.54 | 0.95 | 0.85 | 0.52 |
| Types of Interface Shear | Monotonic Shear | Cyclic Shear |
|---|---|---|
| [kPa] | 200, 300, 400 | 200, 300, 400 |
| Interface Strength Type | Peak Friction Angle | Residual Friction Angle | |
|---|---|---|---|
| [°] | [°] | ||
| = 0.3 | 24.70 | 24.50 | |
| = 0.9 | 30.28 | 29.64 | |
| = 0.3 | 30.24 | 30.07 | |
| = 0.9 | 38.76 | 35.43 | |
| = 0.3 | 33.54 | 33.23 | |
| = 0.9 | 39.18 | 33.82 | |
Publisher’s Note: MDPI stays neutral with regard to jurisdictional claims in published maps and institutional affiliations. |
© 2021 by the authors. Licensee MDPI, Basel, Switzerland. This article is an open access article distributed under the terms and conditions of the Creative Commons Attribution (CC BY) license (https://creativecommons.org/licenses/by/4.0/).
Share and Cite
Zhang, P.; Ding, S.; Fei, K. Research on Shear Behavior of Sand–Structure Interface Based on Monotonic and Cyclic Tests. Appl. Sci. 2021, 11, 11837. https://doi.org/10.3390/app112411837
Zhang P, Ding S, Fei K. Research on Shear Behavior of Sand–Structure Interface Based on Monotonic and Cyclic Tests. Applied Sciences. 2021; 11(24):11837. https://doi.org/10.3390/app112411837
Chicago/Turabian StyleZhang, Pei, Shijia Ding, and Kang Fei. 2021. "Research on Shear Behavior of Sand–Structure Interface Based on Monotonic and Cyclic Tests" Applied Sciences 11, no. 24: 11837. https://doi.org/10.3390/app112411837