Article

Effect of Bentonite Content and Hydration Time on Mechanical Properties of Sand–Bentonite Mixture

1
School of Civil Engineering and Architecture, Wuhan University of Technology, Wuhan 430070, China
2
Department of Civil Engineering, Indian Institute of Technology Indore, Simrol, Indore 452020, India
*
Author to whom correspondence should be addressed.
Appl. Sci. 2021, 11(24), 12001; https://doi.org/10.3390/app112412001
Submission received: 18 November 2021 / Revised: 14 December 2021 / Accepted: 15 December 2021 / Published: 16 December 2021
(This article belongs to the Section Civil Engineering)

Abstract

:
The bentonite is commonly used mixed with soils for groundwater retention and waste contaminant facilities. The incorporation of bentonite could significantly reduce hydraulic conductivity. In this study, the effects of bentonite content, hydration time and effective confining pressure on the static properties of a sand–bentonite mixture were studied using experimental and numerical methods. Firstly, a large number of drainage static triaxial tests on the sand–bentonite mixture with various bentonite contents were conducted. The test results show that the increase in bentonite content and hydration time leads to a slight decrease in shear strength and initial tangent modulus of the sand–bentonite mixture. The presence of bentonite reduces the shear shrinkage and dilatancy trend of the mixture. The cohesion of the mixture increases with the increase in bentonite content and hydration time, but the internal friction angle decreases correspondingly. The hydration of bentonite on the surface of sand particles changes the contact form between particles. The bentonite slurry between pores of the sand skeleton also affects the mechanical behavior of the sand–bentonite mixture. Then, a series of 3D discrete element models were established for numerical simulations of drainage static triaxial tests. The numerical model parameters were calibrated by experimental results. The meso-mechanism of bentonite content affecting the mechanical behavior was revealed according to the contact force distribution between particles. The research results are helpful to understand further the mechanism of bentonite on the mechanical properties of the sand–bentonite mixture.

1. Introduction

Bentonite is a kind of soft clay produced by weathering and erosion of volcanic ash with the major mineral composition of montmorillonite [1]. It is a type of clay composed of two tetrahedral and one octahedral flake in a ratio of 2:1. The high plasticity of bentonite makes it an ideal admixture to improve the liquefaction resistance of the sand. Bentonite has distinct natural characteristics due to its special morphology and charge distribution. The bentonite particles are in the shape of thin circular disks with diameters of the order of 0.1 μm. The surface of the thin circular disks is negatively charged, while the edges have positive charges. The total charge of the entire particle is negative [2,3,4,5].
A typical particle has a specific surface area of 600 to 800 and could expand to 1300% of its original volume when exposed to water [6]. The sodium bentonite has a high plasticity index which results in higher swelling and gelation [7]. The swelling characteristic of bentonite would produce great volume inside soil particles. Thus, many microscopic models were proposed to explain the hydration and expansion mechanism of bentonite, such as the Stern–Gouy double-layer model [8,9], which was one of the first models to attempt to explain the interaction between clay and water at the interface layer [10]. Derjaguin, Landau, Verway and Overbeek (DLVO) explained the impact of clayey suspensions on a large scale but did not apply to the range less than 20A [11,12]. Although these theories have been widely used, they cannot well describe the water–soil interface at a smaller scale, nor can they well explain the expansion mechanism [13]. Schmidt (2005) used the molecular dynamics method to analyze the nA-MT intermolecular expansion behavior of bentonite and hydrated bentonite with different interlayer hydration degrees and revealed the evolution law and mechanism of nA-MT expansion characteristics with the deepening of interlayer hydration degree [14].
Many studies have shown that clay has obvious effects on the mechanical behaviors of sand. Previous results indicated that the anti-liquefaction properties of sand could be improved by adding plastic clay particles [15,16,17,18]; for example, Chang et al. (2008) studied the effects of clay content on liquefaction characteristics of clayey sand and grouped the clayey sands as sand-like or clay-like soils depending on the clay content [19]. Ishihara et al. (1989) found that there was no direct relationship between clay content and cyclic shear strength of sand and believed that the increase in plasticity index was the reason for the increase in cyclic strength. They linked the cyclic strength with the plasticity index and believed that the higher the plasticity index, the greater the cyclic shear strength [20]. Vucetic et al. (1991) also concluded a similar conclusion [21]. Seed et al. (1986) reported that the soil would not liquefy when the clay content in the soil was greater than 20% [22]. Koester (1994) pointed out that the plasticity index was not a decisive factor in the cyclic strength of sand mixed with plastic clay [23]. Polito (1999) conducted a series of experiments to explore the effect of changes in clay content from 2% to 37% on the shear strength of Yatesville sand [24]. In fact, the two compositions together affected the behavior of the mixture. Zhang et al. (2019) found that sand could reduce the volumetric shrinkage of the bentonite–sand mixtures when its content was larger than 30% [25].
The discrete element method (DEM) was a common and effective method to study the mesoscopic mechanism of rock and soil materials [26]. Alaei et al. (2012) conducted a discrete model for simulating shear strength and deformation behavior of rockfill material, in which the particle breakage phenomenon was considered [27]. Liu et al. (2021) studied the mechanical behavior of mudstone in the hollow cylinder torsional shear test through the discrete element method. Hollow cylindrical torsional shear tests under three typical stress conditions were simulated [28]. Duan et al. (2017) adopted the 3D discrete element method to simulate true triaxial compression tests and elucidate the failure mechanism of sandstone and the effect of the intermediate principal stress [29]. Xu et al. (2019) established a series of 3D discrete element models studying the effect of gravel content on the simple shear behavior of SGM from a microscopic point of view [30]. The influence of bentonite on the sand was attributed to the combination of physico-mechanical action and chemical action. In the physico-mechanical perspective, the interface contact between sand particles was reorganized by bentonite, which has an influence on the mechanical behavior of sand. Thereby, the newly developed sensors and numerical approaches were used for experimental tests and field conditions [31,32,33].
In this study, a macro and meso study was conducted on the effect of bentonite on mechanical properties of the sand–bentonite mixture by means of experimental tests and numerical methods. Firstly, a series of drainage static triaxial tests on sand specimens with various bentonite contents were conducted to study the effect that bentonite has on the sand–bentonite mixture. Then, a series of 3D DEM models were established to simulate the experimental drainage static triaxial tests. The numerical model parameters were calibrated by experimental results. Finally, the effect of bentonite content and hydration time on the mechanical properties of the sand–bentonite mixture and the meso-mechanism were discussed and revealed. It would be helpful to understand further the mechanism of bentonite on the mechanical properties of the sand–bentonite mixture from the macro and meso aspects, respectively.

2. Materials and Methods

2.1. Materials

The standard silicon sand was used in this study. The standard sand has a uniform particle size grading and was classified as medium-coarse sand. By following the ASTM standards [34,35,36,37], the d10, d30 and d60 of the tested sand were 0.328 mm, 0.468 mm and 0.752 mm, respectively. The Cu and Cc were 2.28 and 0.89, respectively. The minimum and maximum void ratios of the sand were 0.595 and 0.818, respectively. In the following study, the relative void ratio of the sand specimen was controlled with a constant value of 58% and a void ratio of 0.736.
The bentonite used in this study was sodium bentonite and calcium bentonite shown in Figure 1. Sodium bentonite and calcium bentonite have a cation of montmorillonite crystal nucleus of Na+ and Ca2+, respectively. The calcium bentonite has a dense structure and a large hydrophilic surface. It has a fast water absorption rate and less overall water absorption amount. Thus, it can reach the hydration balance of montmorillonite in a short time. On the other hand, sodium bentonite has a finer structure and a smaller crystal surface area resulting in a lower water absorption rate. The required water absorption is greater than that required for calcium bentonite due to the larger silicon oxide mass ratio. Thus, it requires a longer hydration time and hydration equilibrium time compared to calcium bentonite. Eighty-three percent of the bentonite particles were smaller than 0.08 mm, belonging to high plasticity fine particles with a plasticity index of 324 [38].

2.2. Test Program

The effects of bentonite content, hydration time and effective confining pressure on the mechanical properties of the sand–bentonite mixture were investigated by the triaxial test following the ASTM standard [39]. The triaxial test apparatus with strain-controlled is shown in Figure 2. The test system is mainly composed of a pressure chamber, pressure controller and computer. The specimen was installed in the pressure chamber with a membrane, a loading cap, sample base, porous disk and loading piston.
All specimen preparation was performed in a dry mixing operation. The dry mixing method was pre-evenly mix dry sand and dry bentonite. Then, the sand and bentonite mixture was transferred into the double valve mold through the method of air pluviation. Specimens were prepared and controlled at the same skeleton relative density. Bentonite was treated as a non-solid phase, and the only solid phase was sand. For each specimen, the mass and compacted volume of sand were the same, and the mass of bentonite was different according to the various bentonite content.
After the specimen was prepared, the triaxial tests were carried out with four major steps, which were head saturation for bentonite hydration, back pressure saturation, consolidation drainage and shear test. Time and degree of interaction between bentonite with water directly determine the properties of bentonite itself and its effect on sand. The hydration time of bentonite was adopted in this study to approximately quantify the impact of water on bentonite and bentonite–sand mixture, respectively. The concept of hydration time in this study was referred to the research on the hydration of bentonite by Mohtar et al., which was the time that bentonite contact with water before the strength tests [40]. The starting time of hydration of bentonite was the completion time of heading saturation. In the process of head saturation, bentonite completed the initial hydration and expansion between sand particles and showed a certain degree of gelation. The ending time of hydration of bentonite was referred to as the time when consolidation was complete, and shear began. Since the time of the back pressure saturation and consolidation drainage was 24 h in this study, the specimens with a hydration time of 24 h were immediately saturated with back pressure after head saturation. The specimens with hydration times of 40 h and 48 h stayed 16 h and 24 h after the completion of head saturation, respectively, before the back pressure saturation and consolidation drainage. The shear test was strain-controlled with a constant shear strain of 0.001 mm/s. The shear rate of 0.001 mm/s can ensure the drainage of water to avoid pore water accumulation. The pore water pressure was noted to be zero during shearing. The shearing is assumed to be completed when the axial strain of the specimen reaches about 8–10%.
Table 1 lists a total of 15 groups consolidated drained (CD) triaxial tests carried out in this study. The specimens in each group were controlled in the same dimension, which has a diameter of 39.1 mm and a height of 78.2 mm. There were three different types of bentonite contents, which were 0%, 5% and 10%. In the study, the effective confining pressure value varies from 200 kPa, 300 kPa and 400 kPa. In order to evaluate the effect that hydration time of bentonite in the pores of sand particles has on the mechanical properties of sand, this study prepared the sand–bentonite mixture specimens with the hydration time of 24 h, 40 h and 48 h. The relative compactness of all experimental groups was calculated based on the concept of “skeleton porosity ratio”, that is, the bentonite slurry in saturated specimens was regarded as pore fluid rather than skeleton particles. The solid particles here contain only sand particles.

3. Results of Calcium Bentonite–Sand Mixture

3.1. Effect of Calcium Bentonite Content on Shear Strength

Figure 3 shows the deviator stress–axial strain curves of the specimens with different bentonite contents under the same confining pressure and hydration time. The results indicate that the peak shear strength of the mixture specimen decreases with the increase in bentonite content, and the shear strength of the sand–bentonite mixture remains more than 90% of that of pure sand. The hydration and expansion of bentonite in the pores of sand make the direct contact of sand–sand interface change to the contact of sand–bentonite pore grout, which was thought to be the reason for the slight decrease in shear strength with the increase in bentonite content.
Figure 3 also shows that the stress remained stable after reaching the peak value for the mixture specimen. This phenomenon was more obvious for specimens with 10% bentonite than that with 5% one. Figure 3a shows the effect of bentonite content on the stress–strain behaviors under the confining pressure of 200 kPa. It can be observed that the higher the bentonite content, the greater the residual strain. Figure 3b,c shows the effects of bentonite content on the stress–strain behaviors at confining pressures of 300 kPa and 400 kPa. Compared with confining pressures of 200 kPa, the strain-softening phenomenon of the pure sand specimen under confining pressures of 300 kPa and 400 kPa is less obvious, which results in the backward shift of the intersection point of stress–strain curves between pure sand specimens and sand–bentonite specimens. At the constant relative density of the skeleton, the compression of the pore water is limited in the process of saturation and consolidation of the sand–bentonite mixture, and part of the bentonite is gelled. With the increase in confining pressure, the dilatancy behavior of pure sand is inhibited, and the strain-softening trend is correspondingly limited, which leads to the delay at the intersection point of stress–strain curves of specimens with different bentonite contents.

3.2. Effect of Hydration Time

Figure 4 shows the effect of bentonite hydration time (24 h, 40 h and 48 h) on the stress–strain behavior. The hydration time of bentonite referred to the time interval from initial saturation to the end of consolidation before the triaxial tests. The test results indicate that the hydration time has less effect on the maximum shear stress and residual stress. However, the hydration time has a significant effect on the stress–strain behavior at low strain levels. As the deviator stress–strain results for mixture specimens with hydration times of 24 h, 40 h and 48 h are compared under confining pressure of 200 kPa, it can be found that the specimen with hydration time of 24 h has the highest shear stress. The peak stress of the specimens with a hydration time of 40 h was close to that of 48 h. In this study, the hydration stage of bentonite was controlled before back pressure saturation. The initial hydration of bentonite prevents the further hydration of bentonite. This is possibly due to the gelation in the soil matrix during this period, which essentially offsets the partial reduction in the intergranular relationship due to the hydration of bentonite.

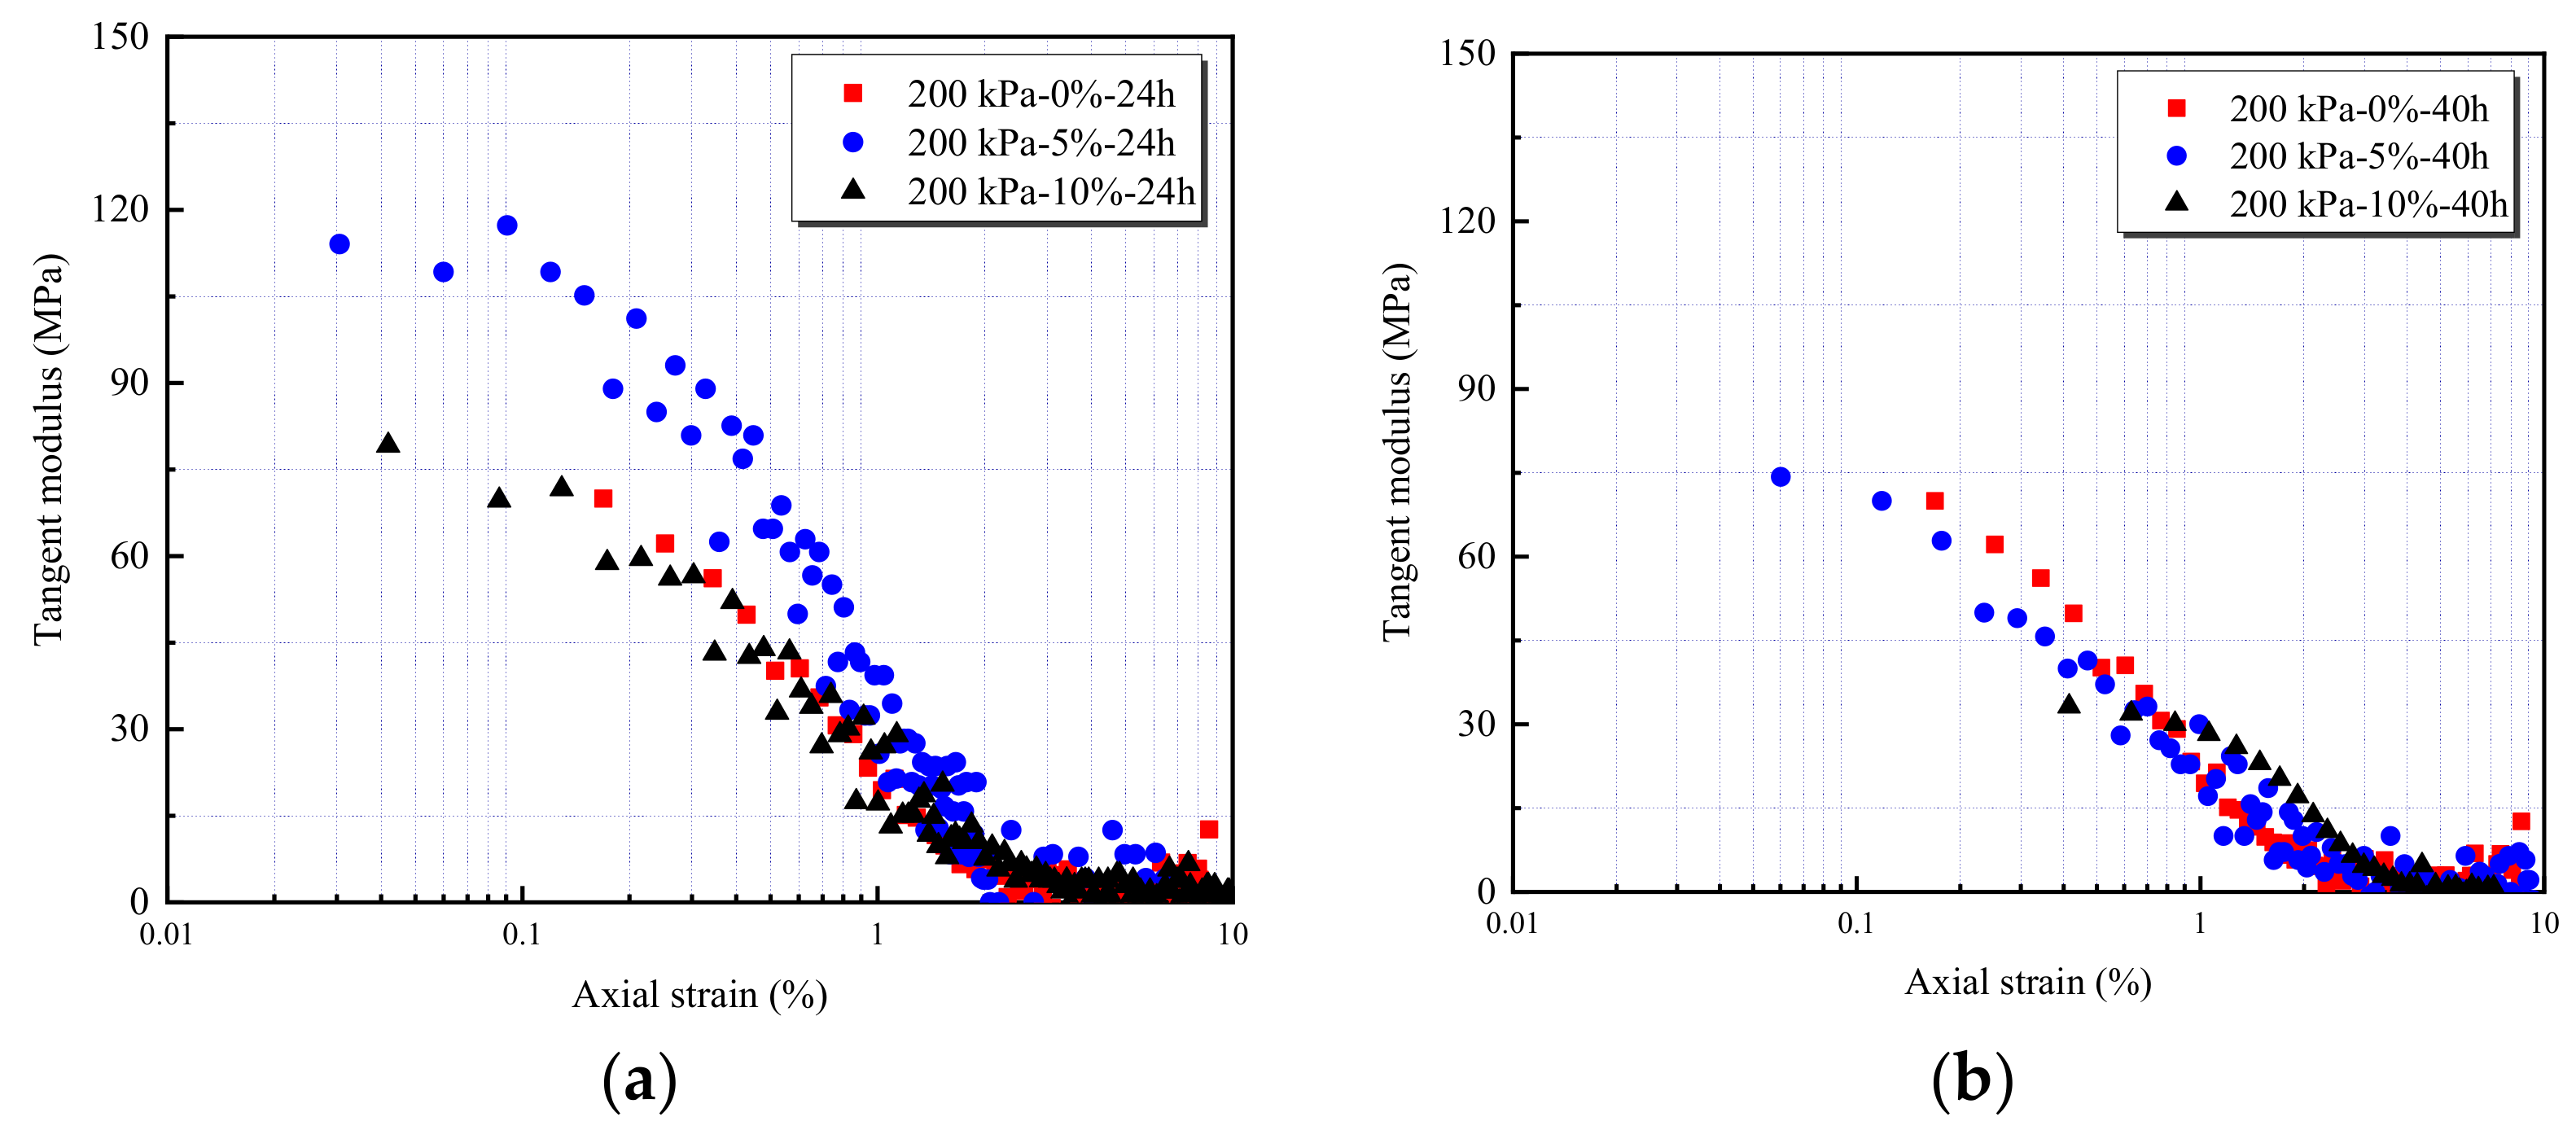
3.3. Effect of Calcium Bentonite Content on the Stiffness

The tangent modulus was obtained by calculating the tangent slope at the different strains on the stress–strain curve, and the variation in tangent modulus with various bentonite contents and hydration times is shown in Figure 5. The presence of bentonite weakens the intergranular bite of the sand, and a bentonite suspension is attached to the surface of the sand, thus reducing the tangent modulus of the specimen. At the initial stage of axial deformation, the mixture specimen does not shrink the water absorption section, and the volume variable is almost unchanged. When the axial strain is around 2%, the pure sand specimen reaches the critical axial strain and changes from shear shrinkage to dilatancy. Meanwhile, the sand–bentonite mixture also reaches the critical axial strain and begins to generate dilatancy and absorb water. With the development of axial strain, the dilatancy of the sand–bentonite specimen is smaller than that of pure sand. The results show that the presence of bentonite weakens the shear shrinkage and dilatancy of sand in the static triaxial test of drainage. The change may be caused by the cementitious effect of bentonite in the interspaces.
Figure 6 shows the nonlinear behavior of the tangent modulus of the sand–bentonite mixture at various bentonite contents and confining pressures. The results indicate that the hydration time has less effect on the tangent modulus at large strain levels. The tangent modulus decreased with the increase in hydration time. The initial tangent modulus of the test curve with a short hydration time (24 h) is relatively higher than that with longer hydration times.

3.4. Comparisons between Sodium Bentonite and Calcium Bentonite

Two types of bentonites (i.e., sodium bentonite and calcium bentonite) were mixed with sand and compared by consolidated drained shear tests. Table 2 lists the maximum deviator stress (i.e., peak stress) at various bentonite contents and confining pressure conditions. It should be noted that the hydration time was kept constant (i.e., 1 h) for this comparison. It can be found that the content of bentonite has a significant effect on the shear strength of the sand–bentonite mixture. Both for sodium bentonite and calcium bentonite, the maximum deviator stress decreased with the increase in bentonite contents. The maximum deviator stress of the calcium bentonite–sand mixture was higher than that of the sodium bentonite–sand mixture.
The hydration rate of calcium bentonite is higher than that of sodium bentonite. In this study, due to the difference in hydration rate, the hydration degree of calcium bentonite is higher than that of sodium bentonite in a short time. This verifies the test results wherein the shear strength of the calcium bentonite mixed specimen was noted to be greater than that of the corresponding sodium bentonite mixed specimen.
Figure 7 shows the working mechanism of sand–bentonite mixture. The hydrated bentonite filled the skeleton between sand particles. The particle contact transformed to sand–mud mode instead of the direct contact of sand–sand, accordingly. The occlusion degree between sand particles decreased due to the lubrication of the bentonite, which leads to a decrease in the shear strength of sand specimens macroscopically. While the experimental test results show that the shear strength of the sand–bentonite mixture remained more than 90% of that of the pure sand specimen, which indicates that the strength loss was not persistent as bentonite increased. It is suggested that the bentonite played the roles of filling and partial reinforcement during the process of expansion and gelation. From this perspective, the impact that bentonite has on the strength of the sand–bentonite mixture was the result of the coupling effect of the hydration, expansion and gelation of bentonite. It is also proof that bentonite is a good choice for sand to improve the water retention and compactness properties under the premise of less loss of mechanical strength.

4. Micro-Mechanical Behavior of Sand–Bentonite Mixture

4.1. DEM Model Set-Up

The discrete element model was established to investigate the micro-mechanism of bentonite on the mechanical behavior of the sand–bentonite mixture. Firstly, the triaxial shear tests under different confining pressures were simulated. Figure 8 shows a three-dimensional DEM model to investigate the fine bentonite particle on the mechanical behavior of the sand–bentonite mixture specimen. The sand particles were modeled with the partial overlapping ellipsoidal particles, which can be observed in Figure 8a. The bentonite particle was modeled as the spherical particles, as shown in Figure 8b. As the calculation rate and the particle distribution of specimens in experimental tests are considered, the simulated size of sand particle was expanded to four times the size, and that of bentonite was 0.4 mm. The DEM model was established by fine particles of bentonite, which uniformly filled the skeleton of sand.
The geometric dimension of the DEM models was the same as the specimens in experimental tests (39.1 mm in diameter and 78.2 in height). The sand–bentonite mixture model with a bentonite content of 10% shown in Figure 8c consisted of 38,912 pebbles and 28,510 balls. Considering that there is no bond strength between sand particles, a linear linkage model was adopted for the contact model of sand particles. However, given a certain bond strength between bentonite particles, a parallel connection model was adopted for the contact model of bentonite particles.
The specific modeling processes are as follows.
Step 1: Generated a cylinder with a diameter of 39.1 mm inside the specified domain. The upper and lower Boolean values of the cylinder were set to false so that the generated parallel walls could be used to apply axial pressure during the simulation of triaxial tests;
Step 2: Imported clump template, generated sand particles of specified shape through clump distribute command and uniformly generate fine spherical bentonite particles;
Step 3: Solved the model until the maximum unbalance force was less than 5 × 10⁻⁵ N, which was regarded as a stable state. Then, the servo-controlled FISH function was imported;
Step 4: Consolidated the model under the running environment of the FISH function. It was considered to be stable when the confining pressure change was less than 0.5%. Then the axial servo was released, and loading was started.

4.2. Simulation Results and Discussion

The mesoscopic parameters of the DEM model were preliminarily set according to the previous research results. The mesoscopic parameters were calibrated by comparing the numerical results with the experiment results. Table 3 shows the calibrated parameters for further analysis. The mesoscopic parameters that were calibrated were the basic parameters for the further simulated experimental test. The simulation results to be compared with the experimental test results were the results of the digital test that were conducted in the DEM simulation. The basic parameters that were calibrated and the compared results were different but related.
Figure 9 shows the results of the simulated triaxial tests under various confining pressures. Figure 9a,c,e shows the simulated maximum deviational stress, and the errors of maximum deviational stress between test and simulation are shown in Table 4. It is noted that the results from numerical simulations are in good agreement with the experimental results. However, the strain corresponding to the maximum deviating stress was different from the experimental results due to the difference in particle size between test and simulation. Figure 9b,d,f shows the volumetric strain in simulation. In the shearing process, dilatancy was followed by shrinkage, and the dilation became more significant with the increase in bentonite content.
Figure 10 shows the nephograms of contact force distribution for the sand–bentonite mixture specimens with various bentonite contents, which were of an X-shaped distribution along the shear surface. The red particles represented the contact force greater than 20% of the maximum contact force, and the blue particles were for that lower than 20% of the maximum contact force. The green particles show the distribution of the fine bentonite particles in the specimen. It can be seen from the nephograms that the contact force distribution trended to be more uniform with the increase in bentonite content, especially under the condition of low confining pressure. The particles changed from red particles to blue particles with the increase in bentonite content; in other words, the probability of smaller contact force increased with the addition of bentonite. The larger contact force (red particles) turned to distribute more uniformly with the addition of bentonite, along with the gradual blurring of the boundary of the X-shaped distribution area.
The particle contact force was further quantified by the probability density function (PDF). Figure 11 was the PDF curves of the normal (fn) contact force distribution. In this study, the normalized normal contact force less than 0.2 was defined as a minimal normal contact force (fn_min). The probability of fn_min under different conditions was calculated and labeled beside the corresponding PDF curves in Figure 11. It can be seen from Figure 11 that fn/<fn> was mainly concentrated in the range of 0–2.0. In the analysis of the influence of confining pressure and bentonite content, it was found that the distribution of normal contact force changed obviously with the increase in bentonite content. The specific influences of bentonite content are as follows. The normalized normal contact force was bounded by about 0.36. The probability of normal contact force increased with bentonite content when fn/<fn> was lower than 0.36, and the probability decreased when fn/<fn> was higher than 0.36. Combined with the nephograms of contact force distribution in Figure 10, it could be inferred that the addition of bentonite changed the force transfer structure of sand particles. The contact force distributed more evenly as bentonite was involved in force transfer because the added bentonite helped to share a part of the load. The main force chain tended to homogenize, and the value shifted to the direction of fn_min.
The experimental results showed that bentonite content and hydration time jointly affect the mechanical properties of sand–bentonite mixture. However, the impact analysis based on DEM only considered physical and mechanical mechanisms without the chemical ones (i.e., hydration time). In future studies, further breakthroughs are needed for the DEM simulation by considering the influence of hydration time. Considering that the contact form between sand particles is associated with the hydration of bentonite, future attempts can be made to simulate the hydration effect by modeling the particle contact form.

5. Conclusions

In this study, the effect of bentonite content and hydration time on the mechanical properties of sand–bentonite mixture was investigated through experimental tests and numerical analysis. The influence of calcium bentonite and sodium bentonite on the stress–strain behavior of the sand–bentonite mixture was analyzed and compared. The mesoscopic mechanism of bentonite influenced on the macroscopic mechanical behavior of the sand–bentonite mixture was revealed. Major conclusions can be summarized as follows:
(1)
Under the same bentonite and the same confining pressure, the shear strength of the sand–bentonite mixture specimens was decreased gradually with the increasing of bentonite contents;
(2)
By comparing the shear strength of mixture specimens mixed with calcium bentonite and sodium bentonite, it can be found that the peak shear stress of calcium bentonite was higher than that of sodium bentonite mixed sand under the same hydration time and bentonite content;
(3)
The 3D discrete element method results show that the force transfer structure changed with the increase in bentonite contents. The distribution of normal contact force changed obviously with the increase in bentonite content. The contact force distributed more evenly as bentonite was involved in force transfer.

Author Contributions

Conceptualization, Y.Q. and D.X.; methodology, Y.Q.; software, Y.Q.; validation, Y.Q., D.X. and B.L.; formal analysis, Y.Q.; investigation, Y.Q.; resources, Y.Q.; data curation, Y.Q.; writing—original draft preparation, Y.Q.; writing—review and editing, Y.Q., D.X. and B.L.; supervision, D.X.; project administration, Y.Q. and D.X.; funding acquisition, Y.Q. and D.X. All authors have read and agreed to the published version of the manuscript.

Funding

This research was funded by the National Natural Science Foundation of China (project Nos. 41972271, 42177127), the fellow-ship of China Postdoctoral Science Foundation (project No. 2021M692494), Sanya Science and Education Innovation Park of Wuhan University of Technology (project No. 2020KF0007), Hubei Provincial Natural Science Foundation of China (No.2020CFB524) and Hubei Key Laboratory of Roadway Bridge and Structure Engineering (Wuhan University of Technology) (Project No.DQJJ201907).

Institutional Review Board Statement

Not applicable.

Informed Consent Statement

Not applicable.

Data Availability Statement

Not applicable.

Acknowledgments

This research was funded by the National Natural Science Foundation of China (project Nos. 41972271, 42177127), the fellowship of China Postdoctoral Science Foundation (project No. 2021M692494) and Sanya Science and Education Innovation Park of Wuhan University of Technology (project No. 2020KF0007).

Conflicts of Interest

The authors declare no conflict of interest.

References

  1. Sample-Lord, K.M.; Ahmed, M.; Malusis, M.A. Diffusion through soil-bentonite backfill from a constructed vertical cutoff wall. Soils Found. 2021, 61, 429–443. [Google Scholar] [CrossRef]
  2. Vipulanandan, C.; Mohammed, A. Effect of drilling mud bentonite contents on the fluid loss and filter cake formation on a field clay soil formation compared to the API fluid loss method and characterized using Vipulanandan models. J. Pet. Sci. Eng. 2020, 189, 107029. [Google Scholar] [CrossRef]
  3. Zainab, B.; Wireko, C.; Li, D.; Tian, K.; Abichou, T. Hydraulic conductivity of bentonite-polymer geosynthetic clay liners to coal combustion product leachates. Geotext. Geomembr. 2021, 49, 1129–1138. [Google Scholar] [CrossRef]
  4. Yoon, S.; Kim, M.S.; Kim, G.Y.; Lee, S.R. Contemplation of relative hydraulic conductivity for compacted bentonite in a high-level radioactive waste repository. Ann. Nucl. Energy 2021, 161, 108439. [Google Scholar] [CrossRef]
  5. Su, W.; Wang, Q.; Ye, W.M.; Deng, Y.F.; Chen, Y.G. Swelling pressure of compacted MX80 bentonite/sand mixture prepared by different methods. Soils Found. 2021, 4, 1142–1150. [Google Scholar] [CrossRef]
  6. Komine, H.; Ogata, N. Experimental study on swelling characteristics of compacted bentonite. Can. Geotech. J. 1994, 31, 478–490. [Google Scholar] [CrossRef]
  7. Ray, S.; Mishra, A.K.; Kalamdhad, A.S. Hydraulic performance, consolidation characteristics and shear strength analysis of bentonites in the presence of fly-ash, sewage sludge and paper-mill leachates for landfill application. J. Environ. Manag. 2022, 302 Pt A, 113977. [Google Scholar] [CrossRef]
  8. Shang, J.Q.; Lo, K.Y.; Quigley, R.M. Quantitative determination of potential distribution in Stern-Gouy double-layer model. Can. Geotech. J. 1994, 31, 624–636. [Google Scholar] [CrossRef]
  9. Oldham, K. A Gouy-Chapman-Stern model of the double layer at a (metal)/(ionic liquid) interface. J. Electroanal. Chem. 2007, 613, 131–138. [Google Scholar] [CrossRef]
  10. Jo, H.Y.; Katsumi, T.; Benson, C.H.; Edil, T.B. Hydraulic conductivity and swelling of nonprehydrated GCLs permeated with single-species salt solutions. J. Geotech. Geoenviron. Eng. 2001, 127, 557–567. [Google Scholar] [CrossRef]
  11. Verwey, E.J.W. Theory of the stability of lyophobic colloids. Philips Res. Rep. 1945, 1, 33–49. [Google Scholar]
  12. Lyklema, J. Principles of the stability of lyophobic colloidal dispersions in non-aqueous media. Adv. Colloid Interface Sci. 1968, 2, 67–114. [Google Scholar] [CrossRef]
  13. Pradhan, S.; Katti, K.; Katti, D. Evolution of molecular interactions in the interlayer of Na-montmorillonite swelling clay with increasing hydration. Intent. J. Geomech. 2015, 15, 04014073. [Google Scholar] [CrossRef]
  14. Komine, S.R.; Katti, D.; Ghosh, P.; Katti, K. Evolution of mechanical response of sodium montmorillonite interlayer with increasing hydration by molecular dynamics. Langmuir 2005, 21, 8069–8076. [Google Scholar]
  15. Park, S.-S.; Kim, Y.-S. Liquefaction Resistance of Sands Containing Plastic Fines with Different Plasticity. J. Geotech. Geoenviron. Eng. 2013, 139, 825–830. [Google Scholar] [CrossRef]
  16. Abedi, M.; Yasrobi, S. Effects of plastic fines on the instability of sand. Soil Dyn. Earthq. Eng. 2010, 30, 61–67. [Google Scholar] [CrossRef]
  17. Carmine, P.P.; James, R.M., II. Effects of Nonplastic Fines on the Liquefaction Resistance of Sands. J. Geotech. Geoenviron. Eng. 2001, 127, 408–415. [Google Scholar]
  18. Heng, C.Y.; He, M.C.; Qiu, Y.H. Experimental study of liquefaction-resistant characteristics of clayey sand. J. Eng. Geol. 2001, 9, 339–344. [Google Scholar]
  19. Chang, W.J.; Hong, M.L. Effects of clay content on liquefaction characteristics of gap-graded clayey sands. Soils Found. 2008, 48, 101–114. [Google Scholar] [CrossRef] [Green Version]
  20. Ishihara, K.; Koseki, J. Cyclic shear strength offines-containing sands. In Earthquake Geotechnical Engineering, Discussion Session on Influence of Local Conditions on Seismic Response, Proceedings of the 12th International Conference on Soil Mechanics and Foundation Engineering, Rio de Janeiro; A.A. Balkema: Amsterdam, The Netherlands, 1989; pp. 101–106. [Google Scholar]
  21. Vucetic, M.; Dobry, R. Effect of Soil Plasticity on Cyclic Response. J. Geotech. Eng. 1991, 117, 89–107. [Google Scholar] [CrossRef]
  22. Seed, H.B.; Wong, R.T.; Idriss, I.M.; Tokimatsu, K. Moduli and damping factors for dynamic analyses of cohesionless soils. J. Eng. Geol. 1986, 112, 1016–1032. [Google Scholar] [CrossRef]
  23. Koester, J.P. The influence of fines type and content on cyclic strength. Ground Fail. Seism. Cond. 1994, 44, 17–33. [Google Scholar]
  24. Polito, C.P. The effects of non-plastic and plastic fines on the liquefaction of sandy soils. Ph.D. Dissertation, Virginia Polytechnic Institute and State University, Blacksburg, VA, USA, 1999. [Google Scholar]
  25. Zhang, H.Y.; Tan, Y.; Zhu, F.; He, D.J.; Zhu, J.H. Shrinkage property of bentonite-sand mixtures as influenced by sand content and water salinity. Constr. Build. Mater. 2019, 224, 78–88. [Google Scholar] [CrossRef]
  26. Xu, D.S.; Tang, Z.Y.; Zhang, L. Interpretation of coarse effect in simple shear behavior of binary sand-gravel mixture by DEM with authentic particle shape. Constr. Build. Mater. 2019, 195, 292–304. [Google Scholar] [CrossRef]
  27. Alaei, E.; Mahboubi, A. A discrete model for simulating shear strength and deformation behaviour of rockfill material, considering the particle breakage phenomenon. Granul. Matter 2012, 14, 707–717. [Google Scholar] [CrossRef]
  28. Liu, Y.M.; Mao, H.J.; Xu, C.M.; Zhang, Y. DEM investigation on the mechanical behavior of mudstone in the hollow cylinder torsional shear test. Comput. Geotech. 2021, 137, 104236. [Google Scholar] [CrossRef]
  29. Duan, K.; Kwok, C.Y.; Ma, X. DEM simulations of sandstone under true triaxial compressive tests. Acta Geotech. 2017, 12, 495–510. [Google Scholar] [CrossRef]
  30. Xu, D.S.; Tang, J.Y.; Zou, Y.; Rui, R.; Liu, H.B. Macro and micro investigation of gravel content on simple shear behavior of sand-gravel mixture. Constr. Build. Mater. 2019, 221, 730–744. [Google Scholar] [CrossRef]
  31. Shen, J.H.; Xu, D.S.; Liu, Z.W.; Wei, H. Effect of particle characteristics stress on the mechanical properties of cement mortar with coral sand. Constr. Build. Mater. 2020, 260, 119836. [Google Scholar] [CrossRef]
  32. Xu, D.S.; Zhao, Y.M.; Liu, H.B.; Zhu, H.H. Deformation Monitoring of Metro Tunnel with a New Ultrasonic-Based System. Sensors 2017, 17, 1758. [Google Scholar] [CrossRef] [Green Version]
  33. Wei, H.-Z.; Xu, D.-S.; Meng, Q.-S. A Newly Designed Fiber-Optic Based Earth Pressure Transducer with Adjustable Measurement Range. Sensors 2018, 18, 932. [Google Scholar] [CrossRef] [PubMed] [Green Version]
  34. ASTM. D6913.3409. Standard Test Methods for Particle-Size Distribution (Gradation) of Soils Using Sieves Analysis; ASTM: West Conshohocken, PA, USA, 2004. [Google Scholar]
  35. ASTM. D7382.20201. Standard Test Methods for Determination of Maximum Dry Unit Weight and Water Content Range for Effective Compaction of Granular Soils Using a Vibrating Hammer; ASTM: West Conshohocken, PA, USA, 2008. [Google Scholar]
  36. ASTM. D4254.33925. Standard Test Methods for Minimum Index Density and Unit Weight of Soils and Calculation of Relative Density; ASTM: West Conshohocken, PA, USA, 2016. [Google Scholar]
  37. ASTM. D854.30698. Standard Test Methods for Specific Gravity of Soil Solids by Water Pycnometer; ASTM: West Conshohocken, PA, USA, 2016. [Google Scholar]
  38. ADTM. D4318.8194. Standard Test Methods for Liquid Limit, Plastic Limit and Plasticity Index of Soils; ASTM: West Conshohocken, PA, USA, 2017. [Google Scholar]
  39. ASTM. D7181.21521. Test Method for Consolidated Drained Triaxial Compression Test for Soils; ASTM: West Conshohocken, PA, USA, 2020. [Google Scholar]
  40. Mohtar, C. Pure Fluid Engineering: An Autoadaptive Design for Liquefaction Mitigation. Ph.D. Dissertation, Purdue University, West Lafaytte, IN, USA, 2008. [Google Scholar]
Figure 1. Two types of bentonite used in this study: (a) sodium bentonite; (b) calcium bentonite.
Applsci 11 12001 g001
Figure 2. The triaxial test apparatus employed in the study.
Applsci 11 12001 g002
Figure 3. Effects of bentonite content on deviator stress–strain relationship for sand–bentonite mixture with hydration time of 48 h under various confining pressures: (a) 200 kPa; (b) 300 kPa; (c) 400 kPa.
Applsci 11 12001 g003
Figure 4. Deviator stress–strain behavior of sand–bentonite mixture with various hydration times: (a) bentonite content 5%; (b) bentonite content 10%.
Applsci 11 12001 g004
Figure 5. The tangent modulus of sand–bentonite mixture with various bentonite contents under different hydration time: (a) hydration time 24 h; (b) hydration time 40 h; (c) hydration time 48 h.
Applsci 11 12001 g005aApplsci 11 12001 g005b
Figure 6. The nonlinear behavior of tangent modulus of sand–bentonite mixture at various bentonite contents and stress states: (a) confining stress 300 kPa, hydration time: 48 h; (b) confining stress 400 kPa, hydration time: 48 h.
Applsci 11 12001 g006
Figure 7. Working mechanism of sand–bentonite mixture.
Applsci 11 12001 g007
Figure 8. DEM models for the Triaxial shear specimens: (a) sand; (b) bentonite; (c) sand–bentonite mixture.
Applsci 11 12001 g008
Figure 9. Simulated results of the triaxial tests for sand–bentonite mixture specimens under various confining pressures: (a) stress–strain results under 200 kPa; (b) dilation behavior under 200 kPa; (c) stress–strain results under 300 kPa; (d) dilation behavior under 300 kPa; (e) stress–strain results under 400 kPa; (f) dilation behavior under 400 kPa.
Applsci 11 12001 g009aApplsci 11 12001 g009b
Figure 10. X-shaped distribution of contact force at xoy plane for sand–bentonite mixture specimens with various confining pressures and bentonite contents: (a) 200 kPa, 0%; (b) 200 kPa, 5%; (c) 200 kPa, 10%; (d) 300 kPa, 0%; (e) 300 kPa, 5%; (f) 300 kPa, 10%; (g) 400 kPa, 0%; (h) 400 kPa, 5%; (i) 400 kPa, 10%.
Applsci 11 12001 g010
Figure 11. PDF curves of normalized normal contact force (fn/<fn>) for models with various bentonite contents at different confining pressures: (a) 200 kPa; (b) 300 kPa; (c) 400 kPa.
Applsci 11 12001 g011aApplsci 11 12001 g011b
Table 1. Test scheme of consolidated drained (CD) triaxial tests.
No.Bentonite Content/%Confining Pressure/kPaHydration Time/h
10200/
20300/
30400/
4520048
5530048
6540048
7520024
8530024
9540024
10520040
111020048
121030048
131040048
141020024
151020040
Table 2. Test results of sodium bentonite–sand mixture and calcium bentonite–sand mixture.
Maximum Deviator Stress (kPa)Bentonite Content
Sodium Bentonite (Na+)Calcium Bentonite (Ca2+)
5%10%15%5%10%15%
Confining pressure
(kPa)
200591.68581.55542.94690.16669.48656.54
300936.20925.97865.151027.26989.32901.13
4001217.751130.821107.211229.861196.671116.39
Table 3. Mesoscopic parameters of DEM models.
ParametersSandBentoniteLoading SurfaceCylinder Wall
Normal stiffness (N∙m)1 × 1081 × 1071 × 1081 × 106
Tangential stiffness (N∙m)1 × 1081 × 1071 × 1081 × 106
Density (kg/m3)26002000--
Coefficient of friction0.5-0.70.2
Damping (N/ (m/s))0.70.7--
Equivalent elastic modulus (Pa)6 × 1093 × 109--
Normal bond strength (Pa)-1 × 10⁴--
Tangential bond strength (Pa)-1 × 10⁴--
Table 4. Errors of maximum deviational stress between test and simulation.
Bentonite Content
(%)
Confining Pressure
(kPa)
Maximum Deviational Stress
(kPa)
Error
Experimental ResultsSimulated Results
0200719.15751.870.044
300687.92674.620.0198
400704.58701.250.0047
52001102.61084.20.0169
3001009.3937.50.0766
4001020.21043.70.0220
102001403.31339.00.0478
3001316.71072.30.226
4001329.21315.90.0106
Publisher’s Note: MDPI stays neutral with regard to jurisdictional claims in published maps and institutional affiliations.

