
Health Hazards Assessment and Geochemistry of ElSibai-Abu ElTiyur Granites, Central Eastern Desert, Egypt


Abstract
:1. Introduction
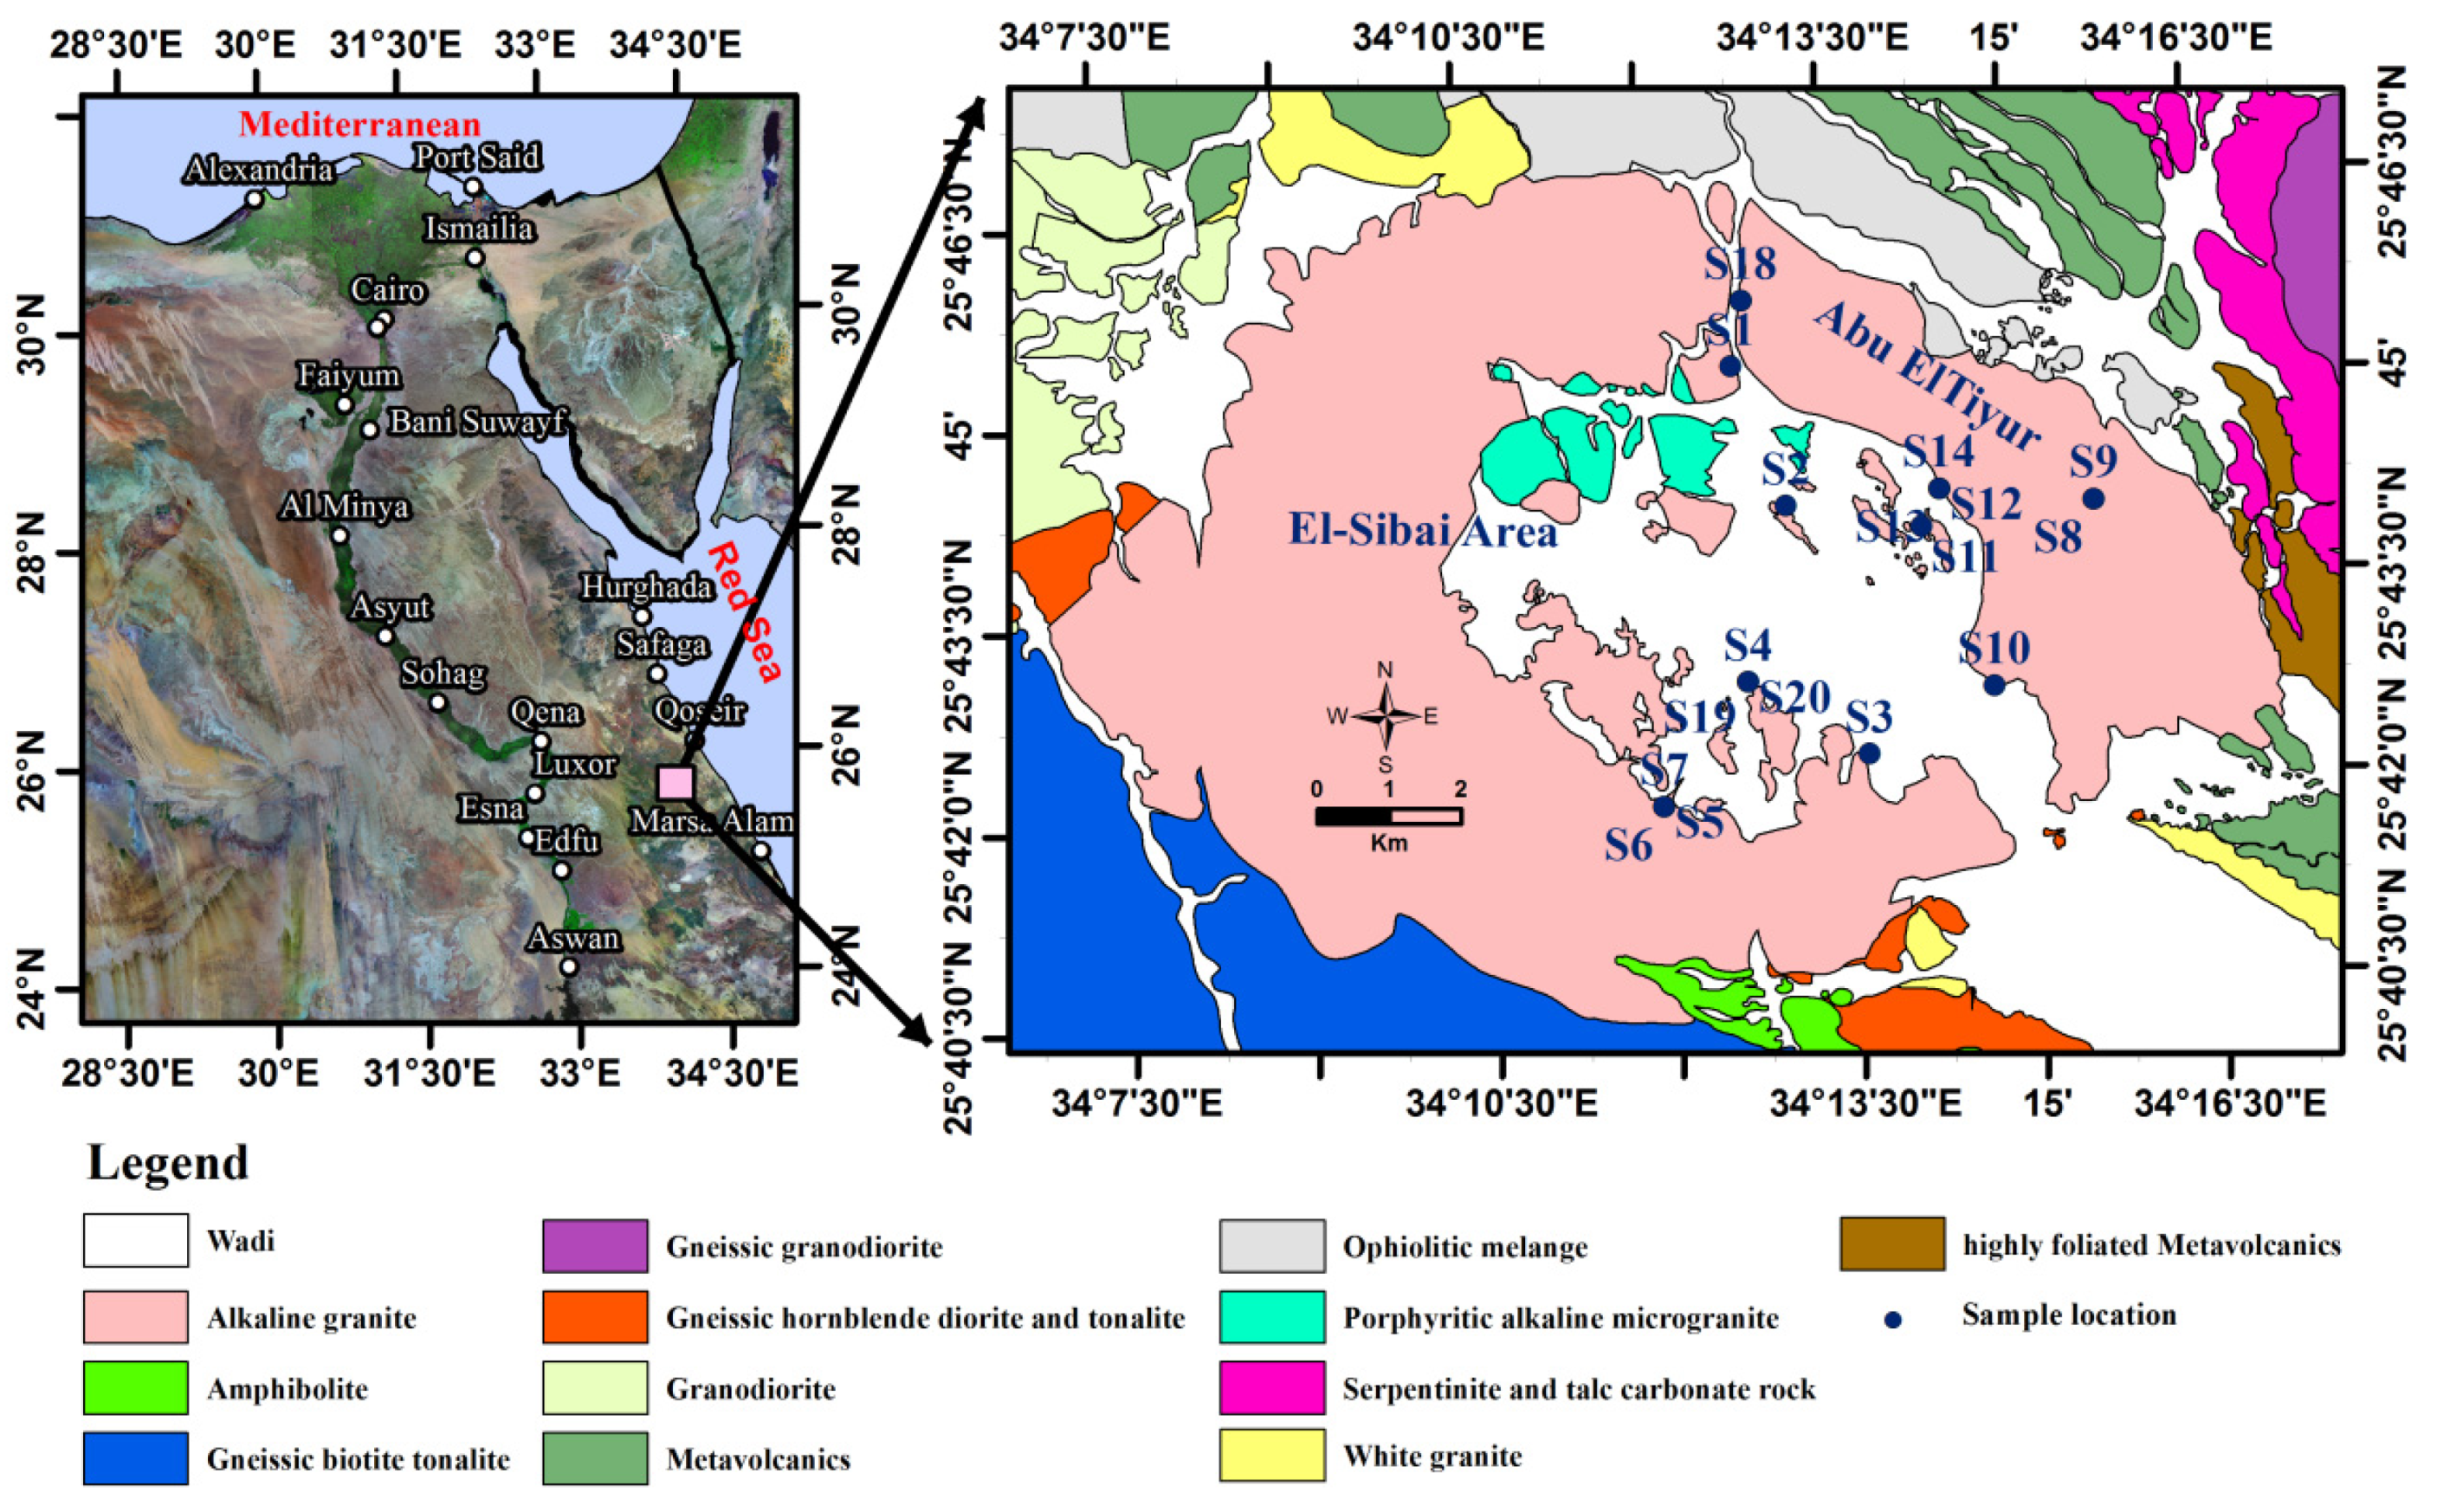
2. Study Area
3. Materials and Methods
3.1. Samples Collection
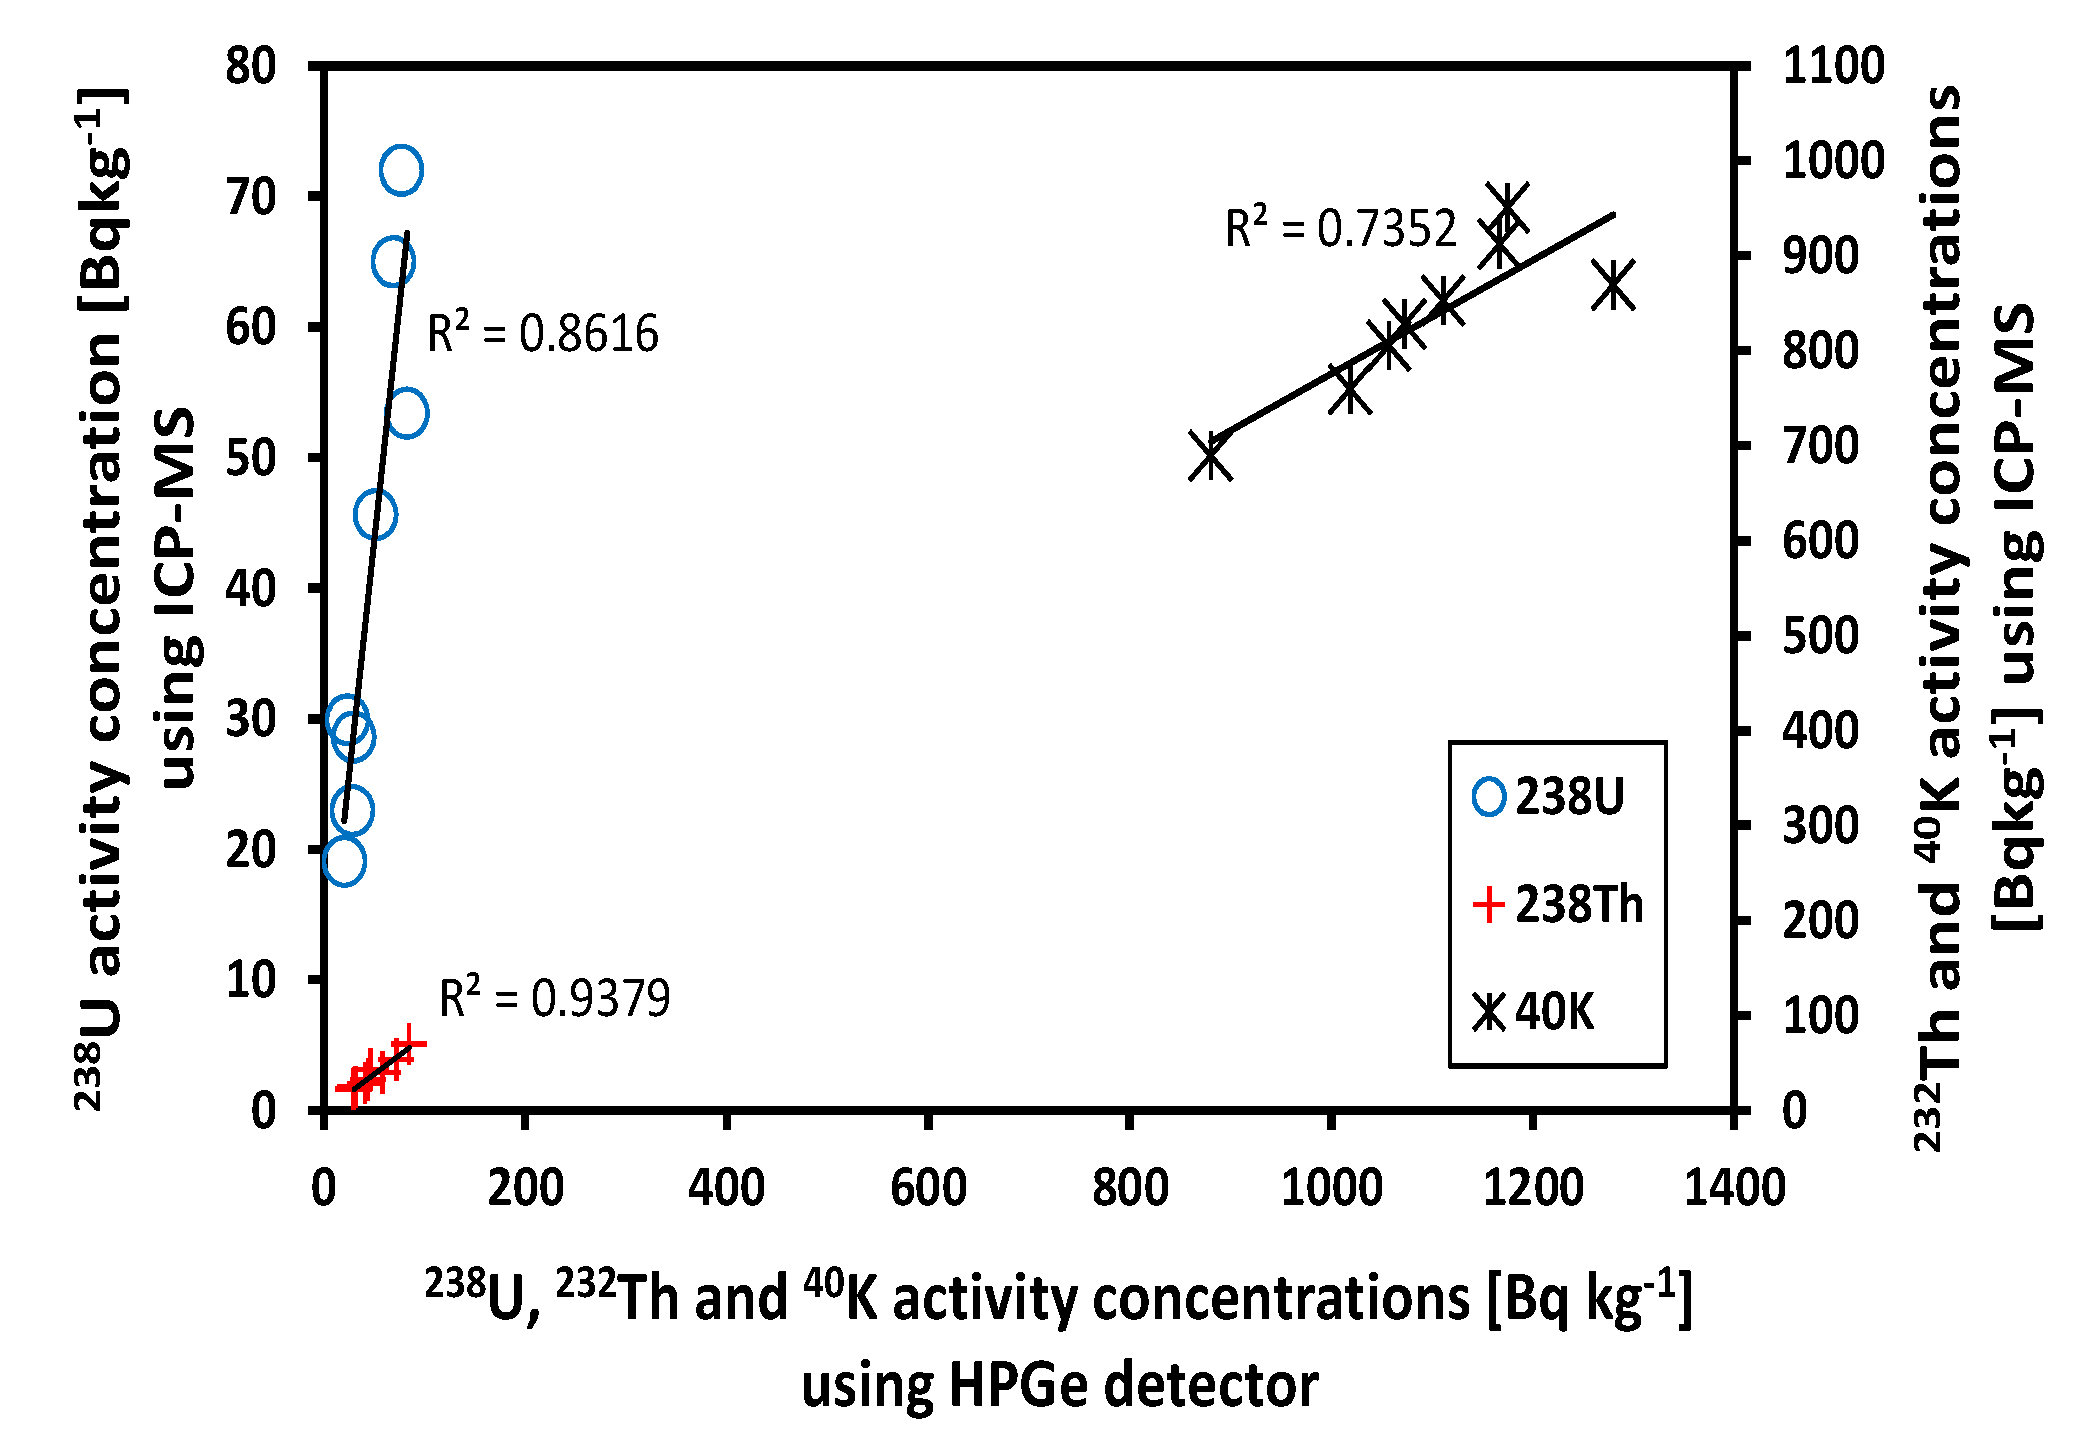
3.2. Gamma Spectrometric Analysis
3.3. Geochemical Analysis
4. Results and Discussion
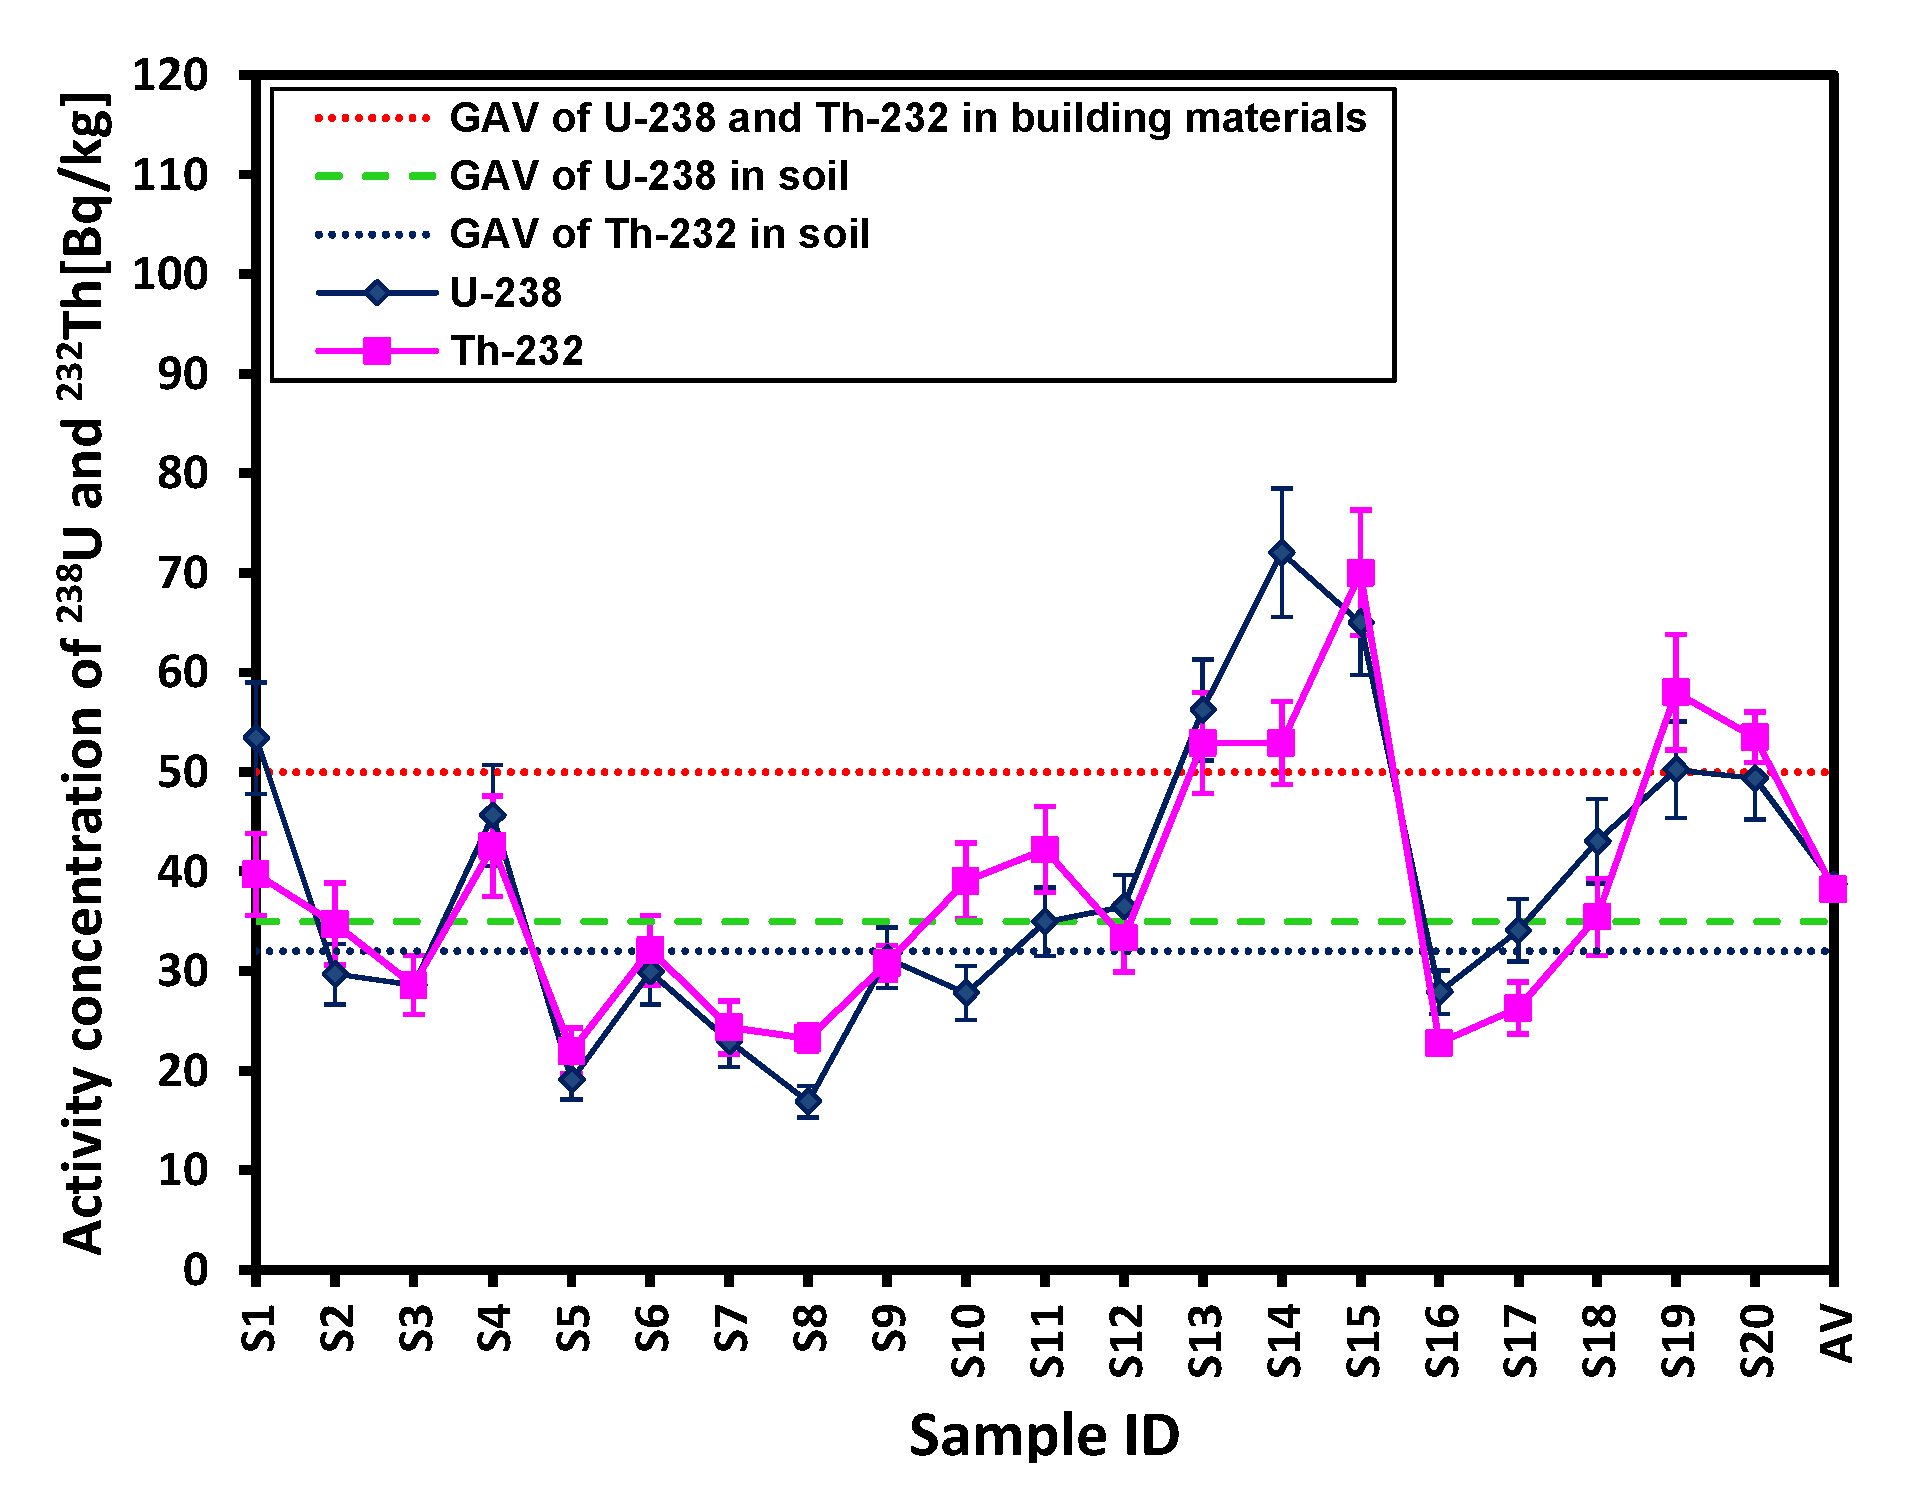
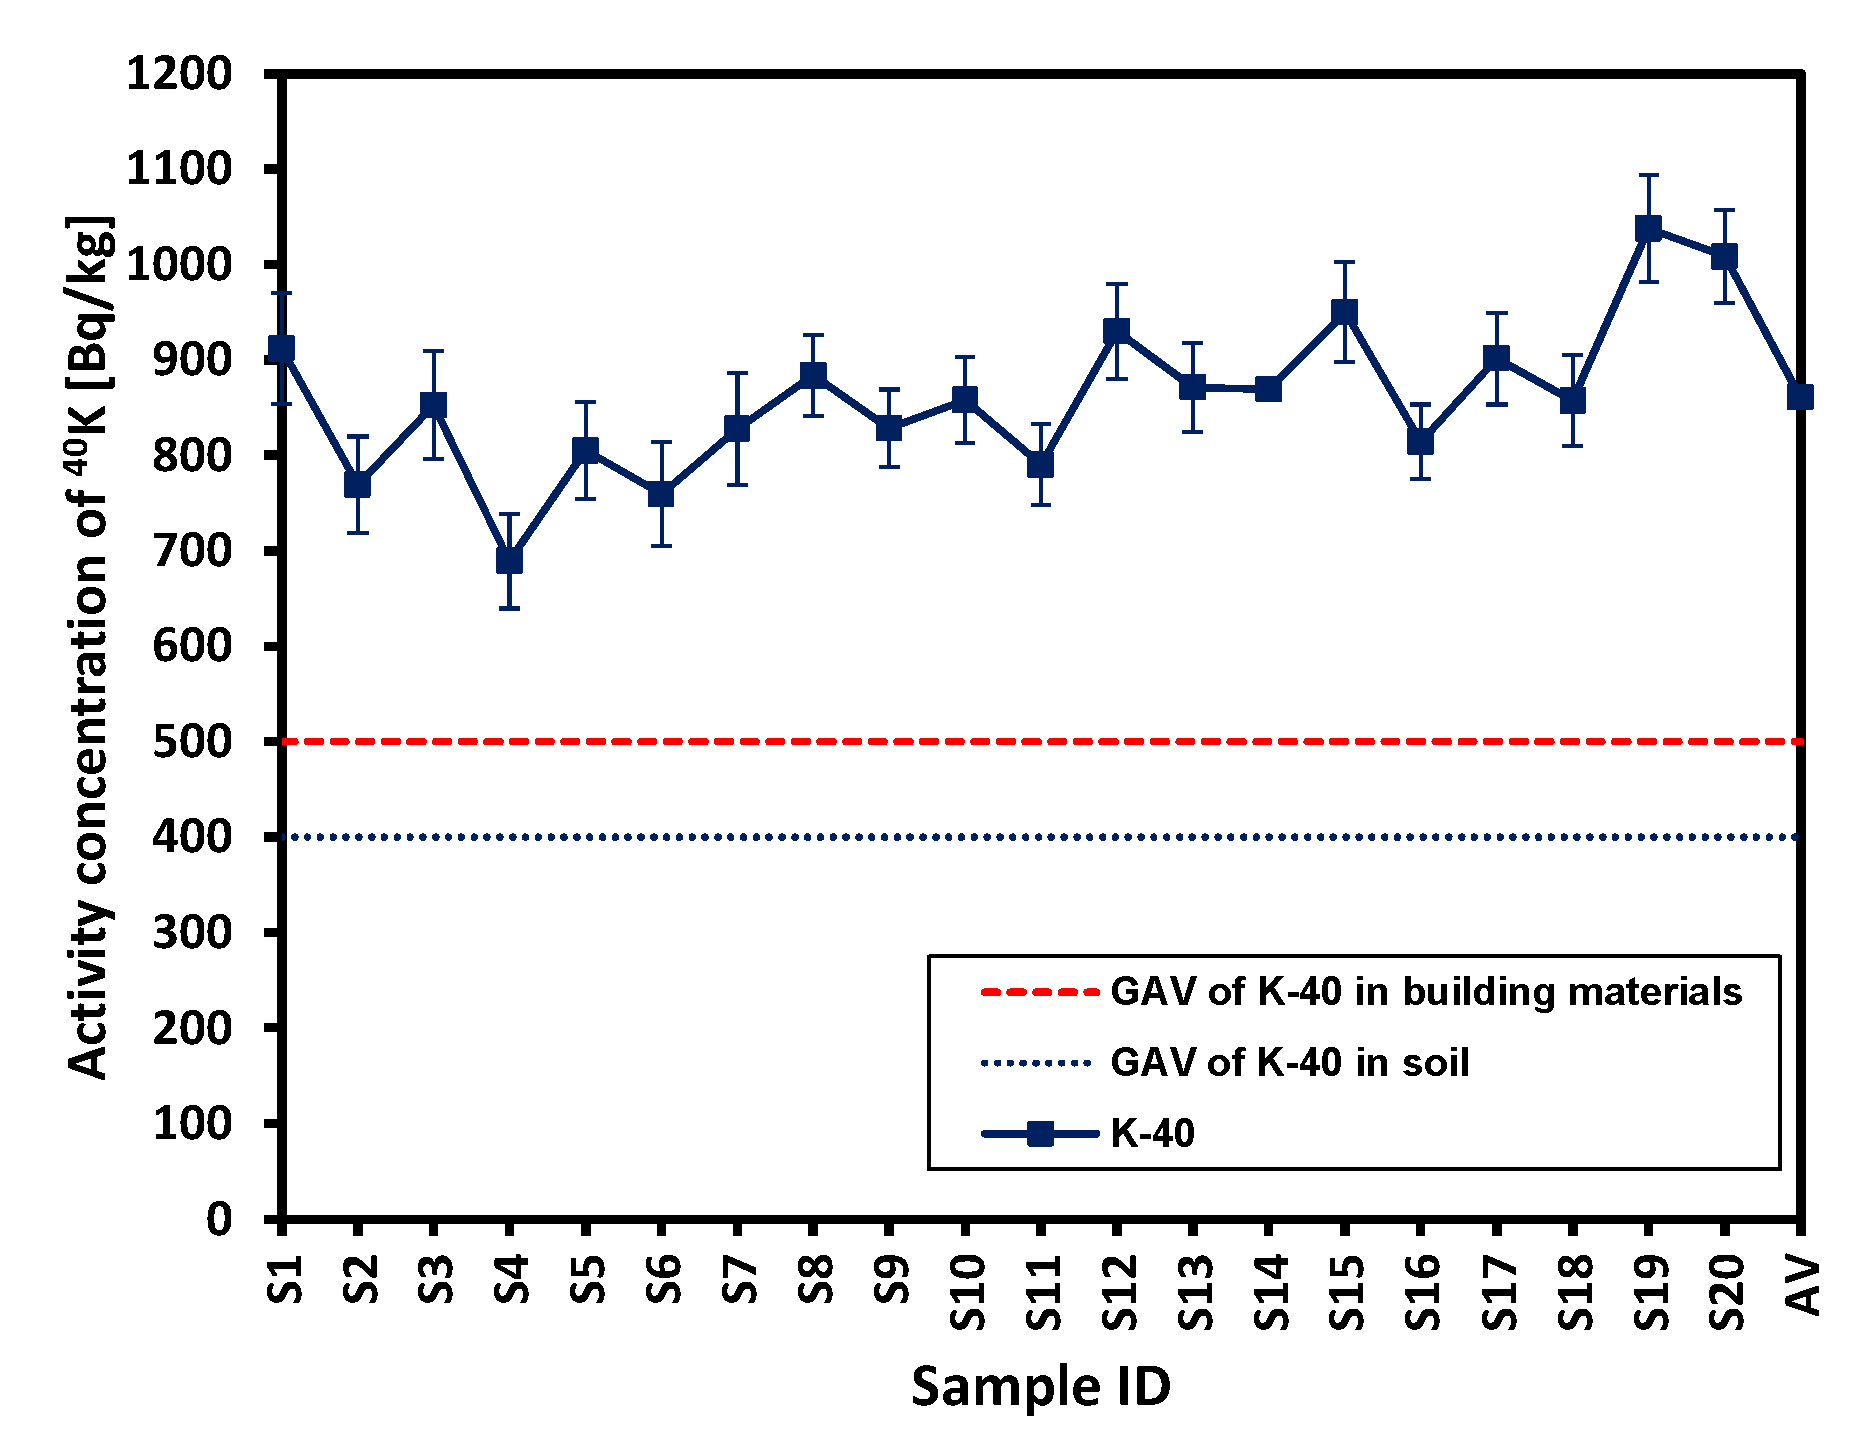
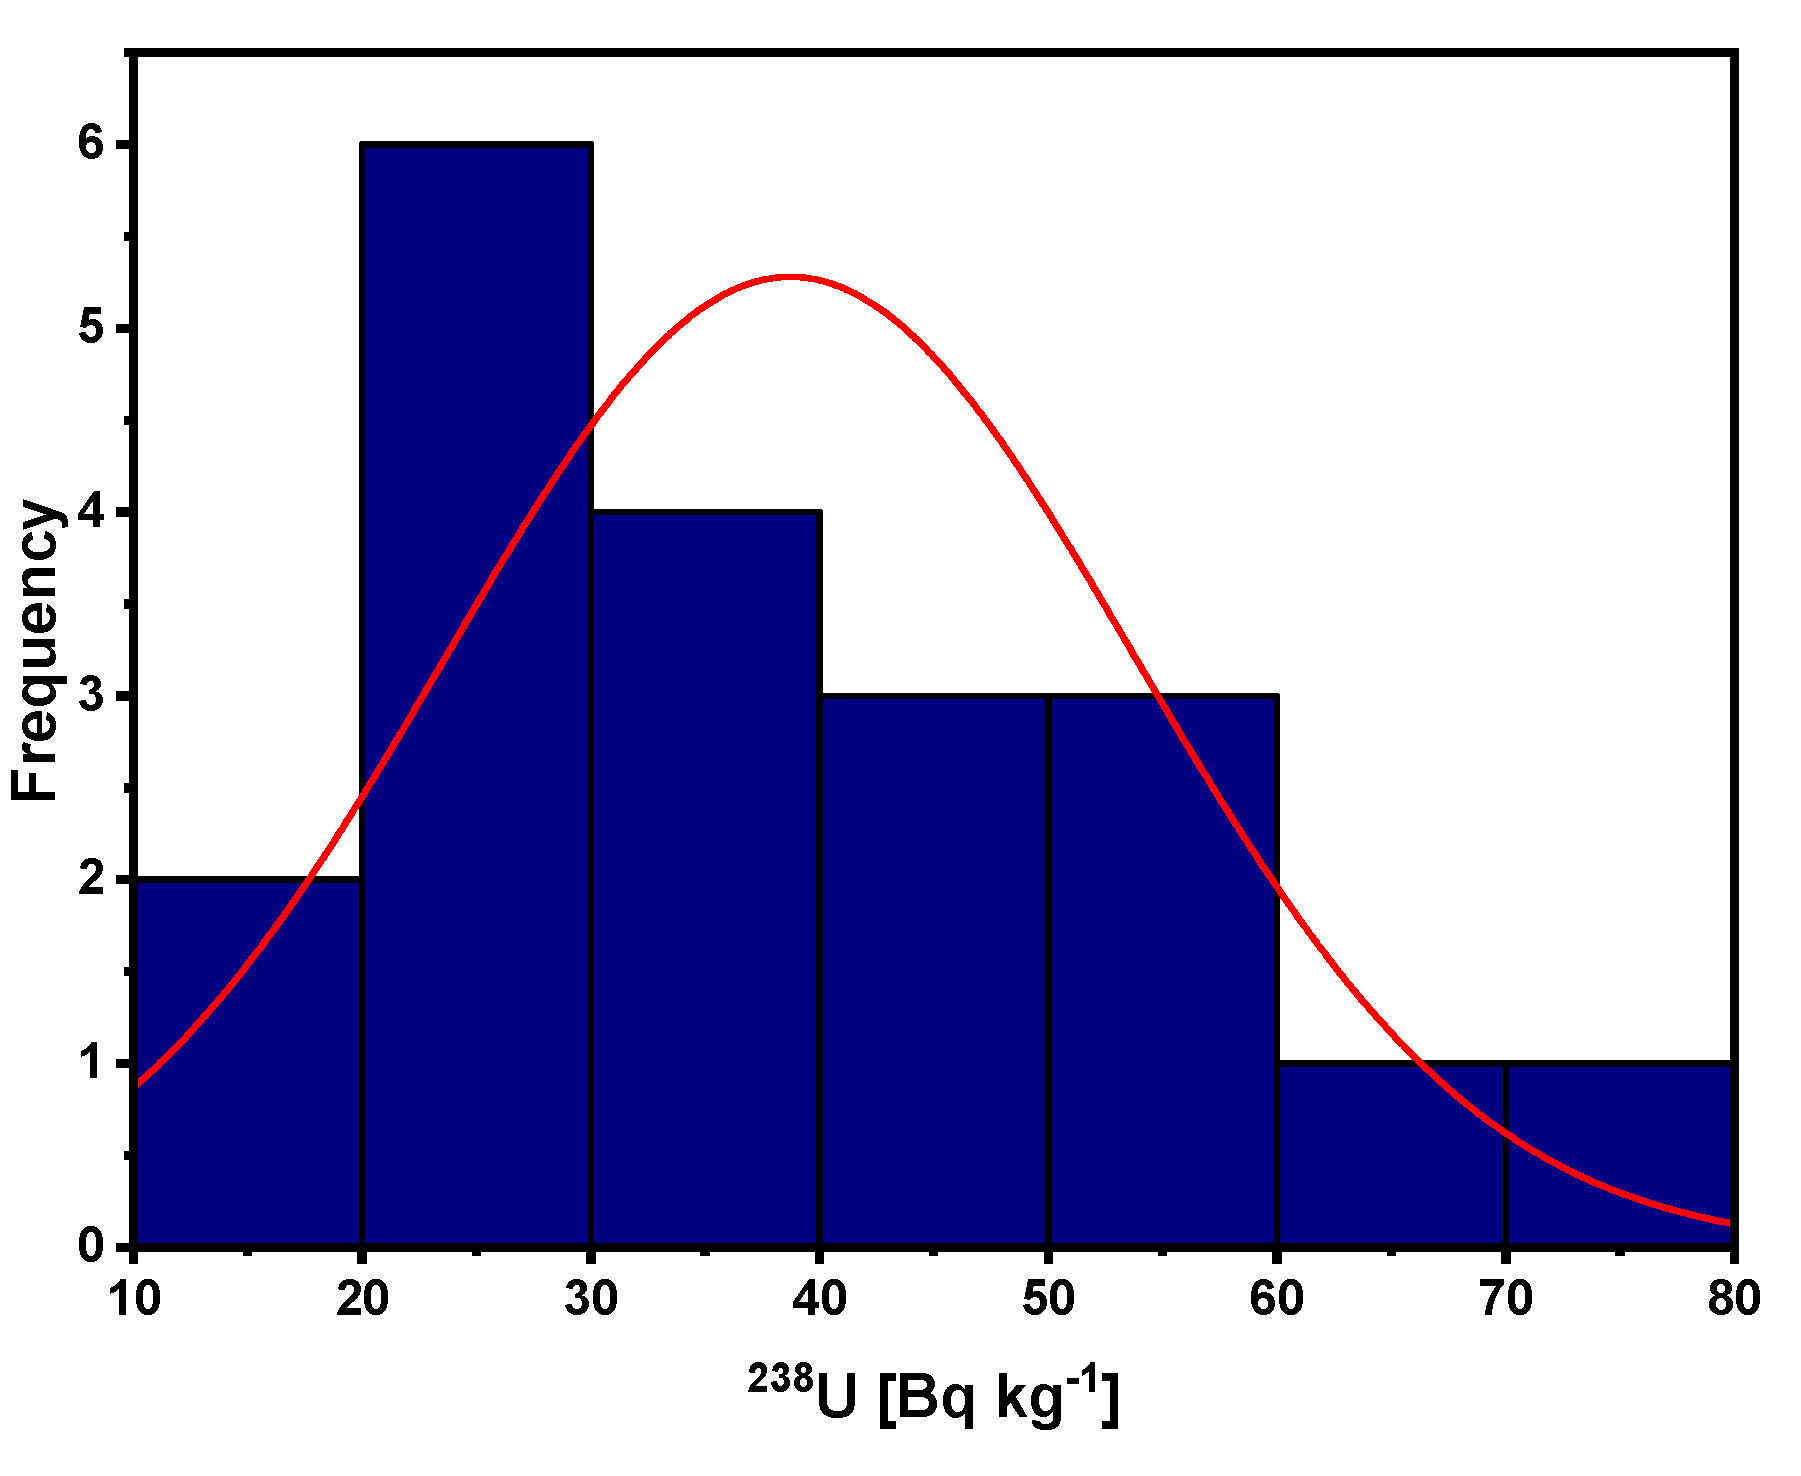
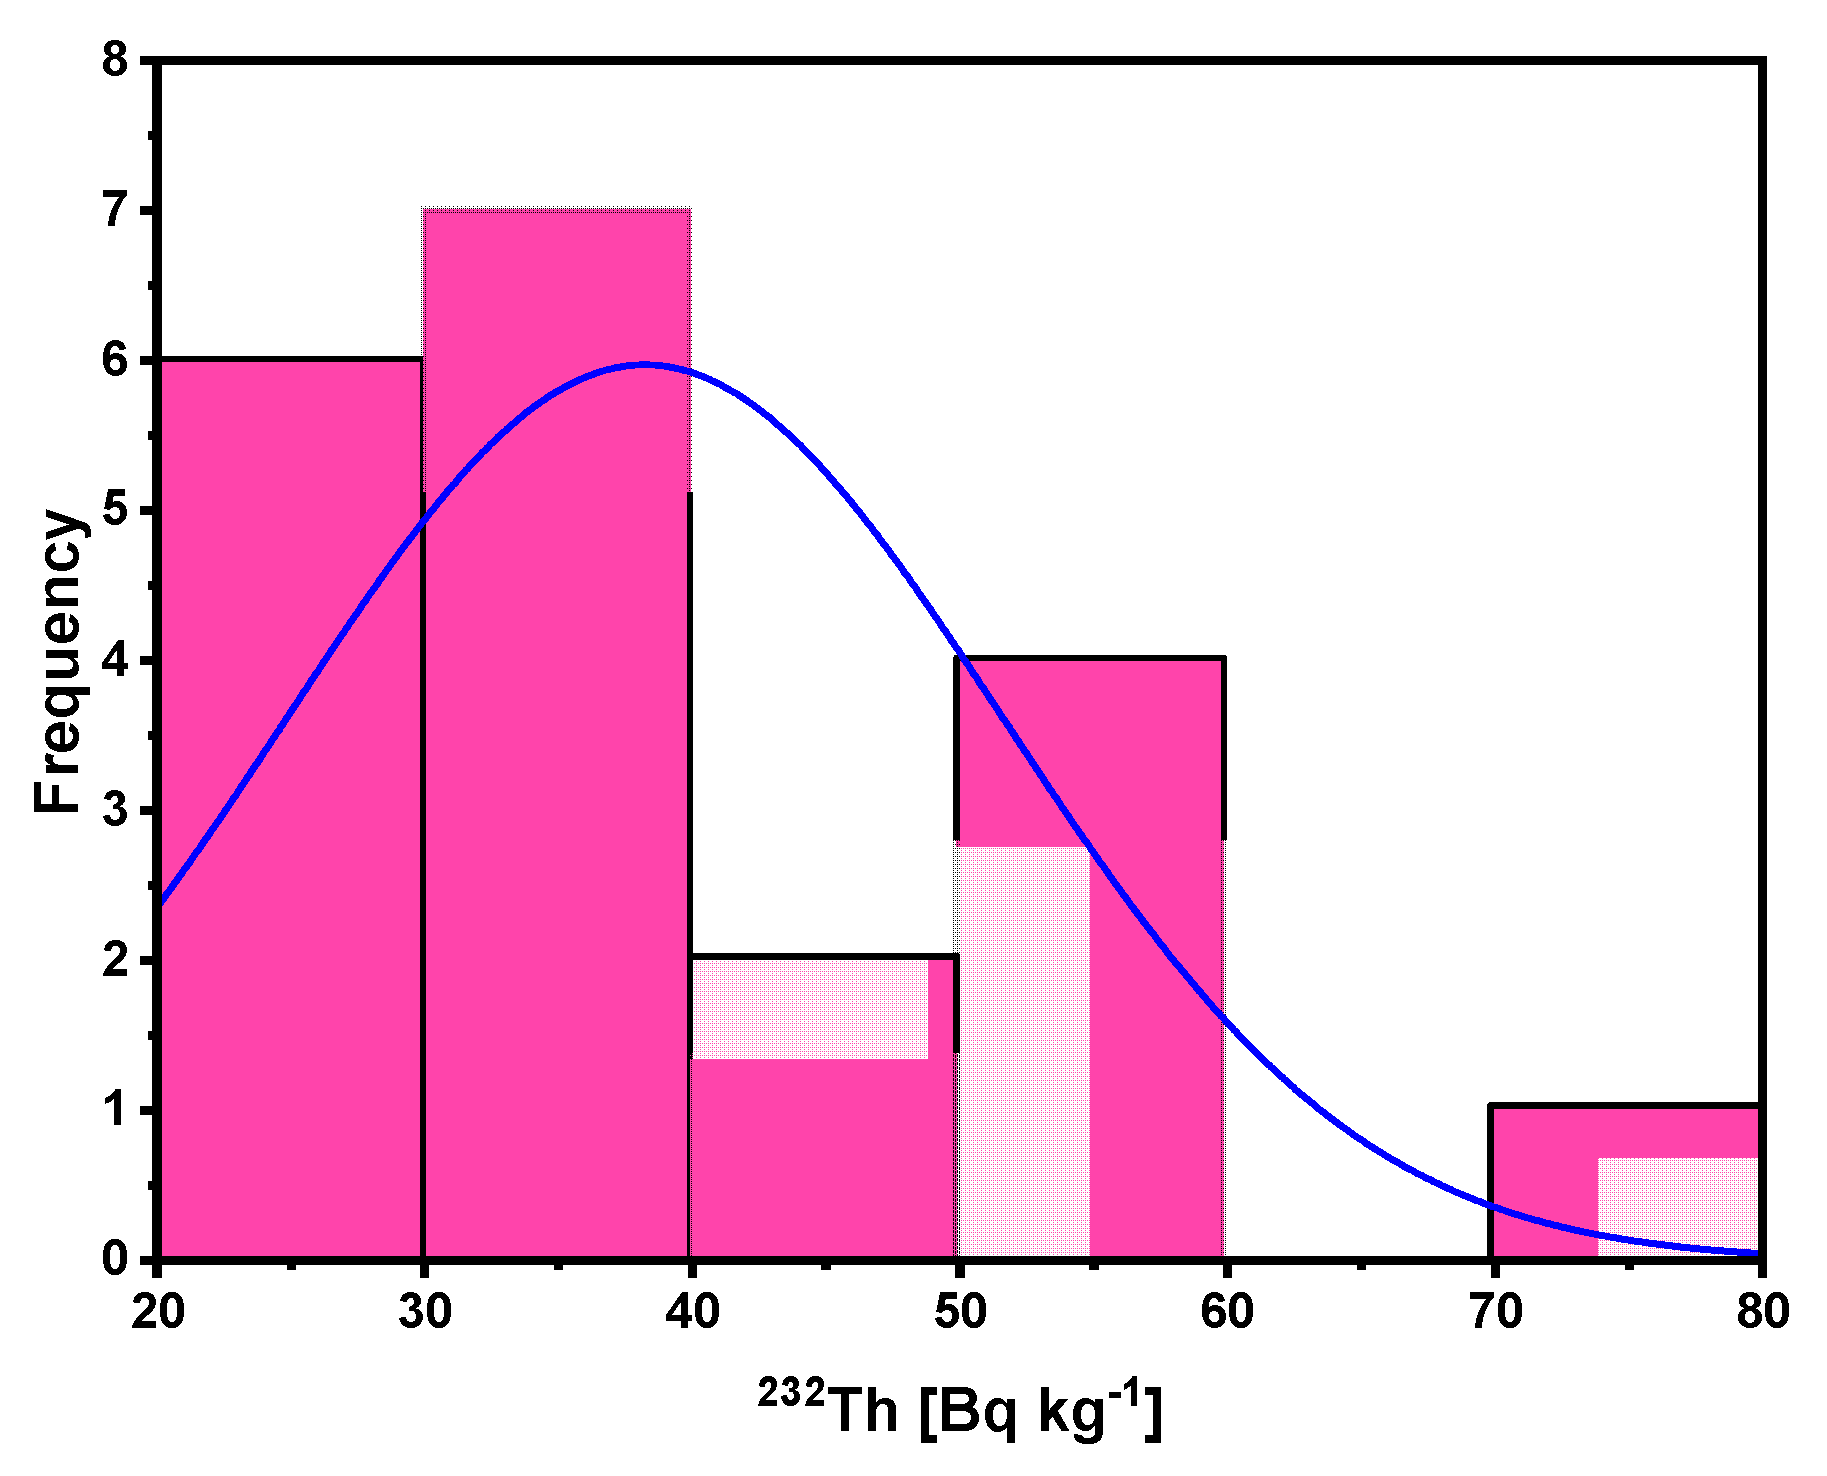
4.1. Activity Concentrations of the Radioisotopes

| Sample ID | Activity Concentration [Bq/kg] | ||
|---|---|---|---|
| U-238 | Th-232 | K-40 | |
| S1 | 53.40 ± 5.60 | 39.73 ± 4.10 | 911.76 ± 58.10 |
| S2 | 29.70 ± 3.05 | 34.75 ± 4.11 | 769.02 ± 50.65 |
| S3 | 28.59 ± 2.97 | 28.60 ± 2.97 | 852.35 ± 56.54 |
| S4 | 45.65 ± 5.04 | 42.55 ± 5.02 | 689.23 ± 49.77 |
| S5 | 19.07 ± 2.00 | 21.97 ± 2.31 | 805.07 ± 51.04 |
| S6 | 29.89 ± 3.25 | 32.13 ± 3.50 | 759.38 ± 54.16 |
| S7 | 22.94 ± 2.56 | 24.33 ± 2.66 | 827.67 ± 58.52 |
| S8 | 16.89 ± 1.58 | 23.24 ± 1.32 | 883.75 ± 42.42 |
| S9 | 31.31 ± 3.06 | 30.84 ± 1.73 | 828.44 ± 40.37 |
| S10 | 27.80 ± 2.74 | 39.06 ± 3.83 | 857.86 ± 45.29 |
| S11 | 34.96 ± 3.43 | 42.20 ± 4.29 | 790.19 ± 42.63 |
| S12 | 36.48 ± 3.15 | 33.32 ± 3.44 | 930.04 ± 50.00 |
| S13 | 56.23 ± 5.05 | 52.91 ± 5.08 | 871.26 ± 46.46 |
| S14 | 72.00 ± 6.48 | 52.91 ± 4.17 | 868.98 ± 10.71 |
| S15 | 65.00 ± 5.22 | 70.00 ± 6.33 | 950.00 ± 52.30 |
| S16 | 27.88 ± 2.19 | 22.78 ± 1.15 | 814.38 ± 39.00 |
| S17 | 34.09 ± 3.12 | 26.29 ± 2.59 | 901.43 ± 47.87 |
| S18 | 43.04 ± 4.27 | 35.44 ± 3.85 | 857.46 ± 47.57 |
| S19 | 50.23 ± 4.84 | 57.99 ± 5.79 | 1037.73 ± 55.91 |
| S20 | 49.36 ± 4.14 | 53.47 ± 2.55 | 1008.23 ± 48.79 |
| Min. | 16.89 ± 1.58 | 21.97 ± 2.31 | 689.23 ± 49.77 |
| Max. | 72 ± 6.48 | 70 ± 6.33 | 1037.73 ± 55.91 |
| AV ± SE | 38.72 ± 3.38 | 38.23 ± 2.99 | 860.71 ± 18.59 |
| GAV in regular soil [21] | 35 | 30 | 400 |
| GAV in building materials [22] | 50 | 50 | 500 |
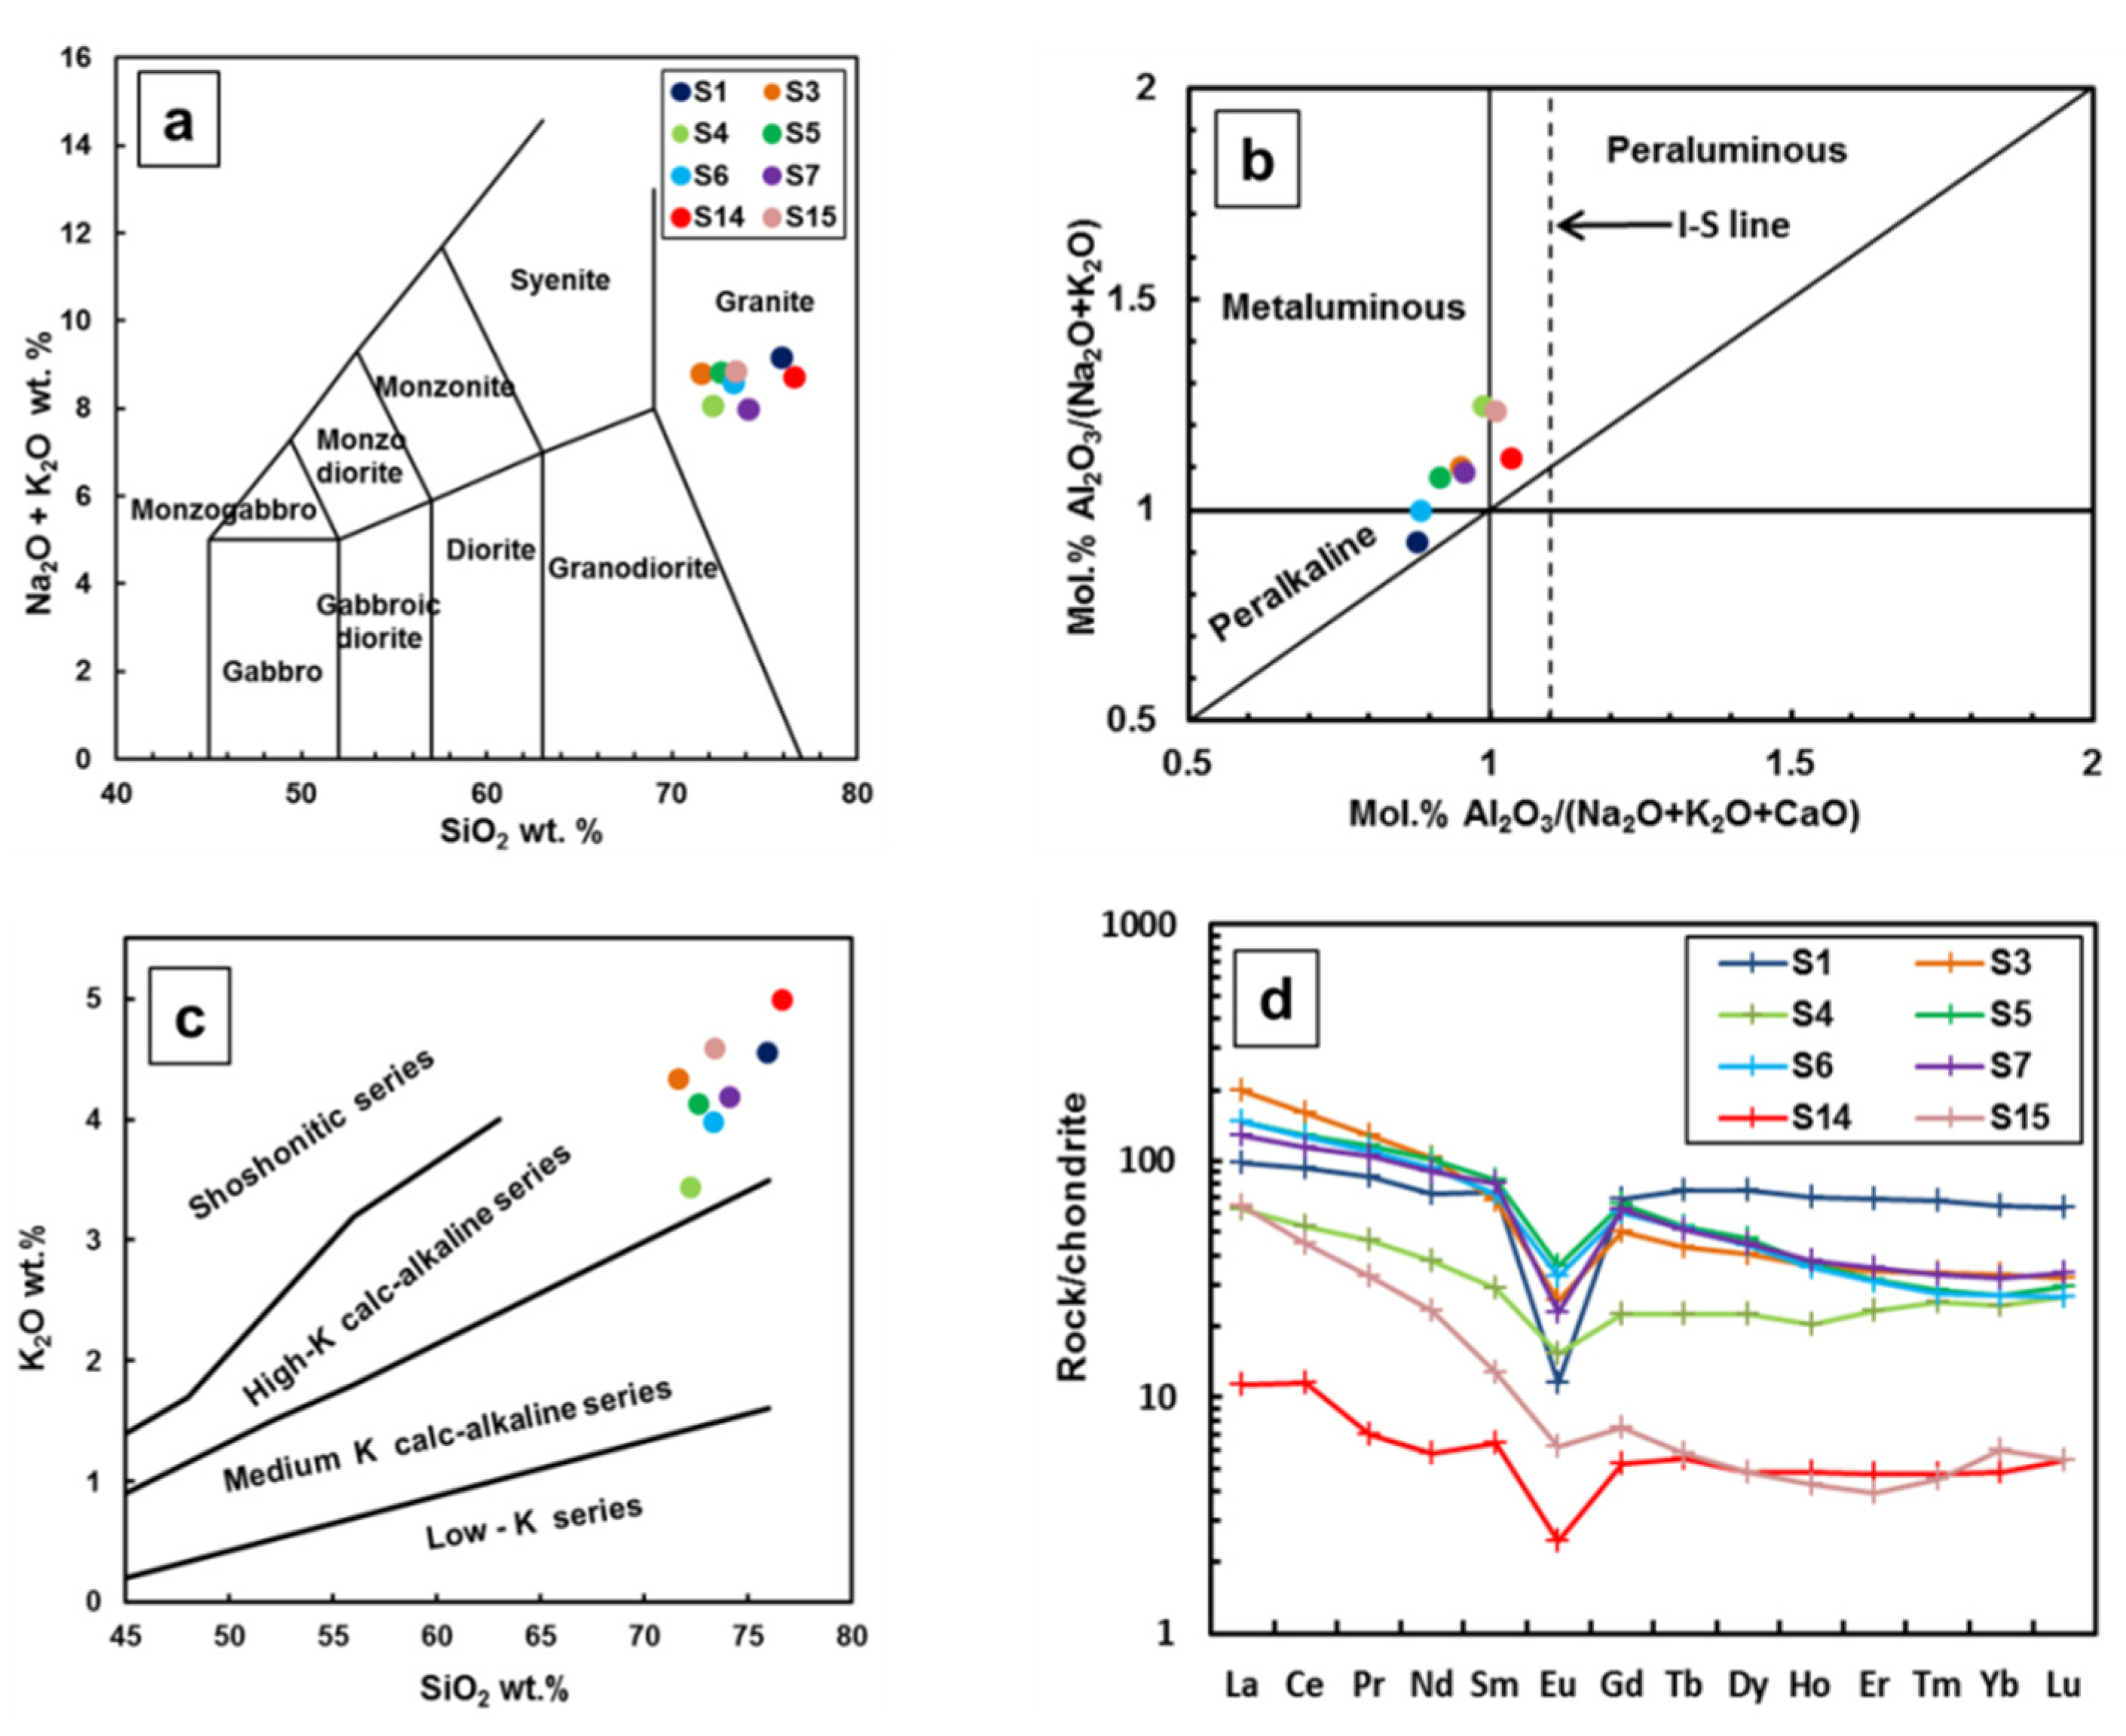
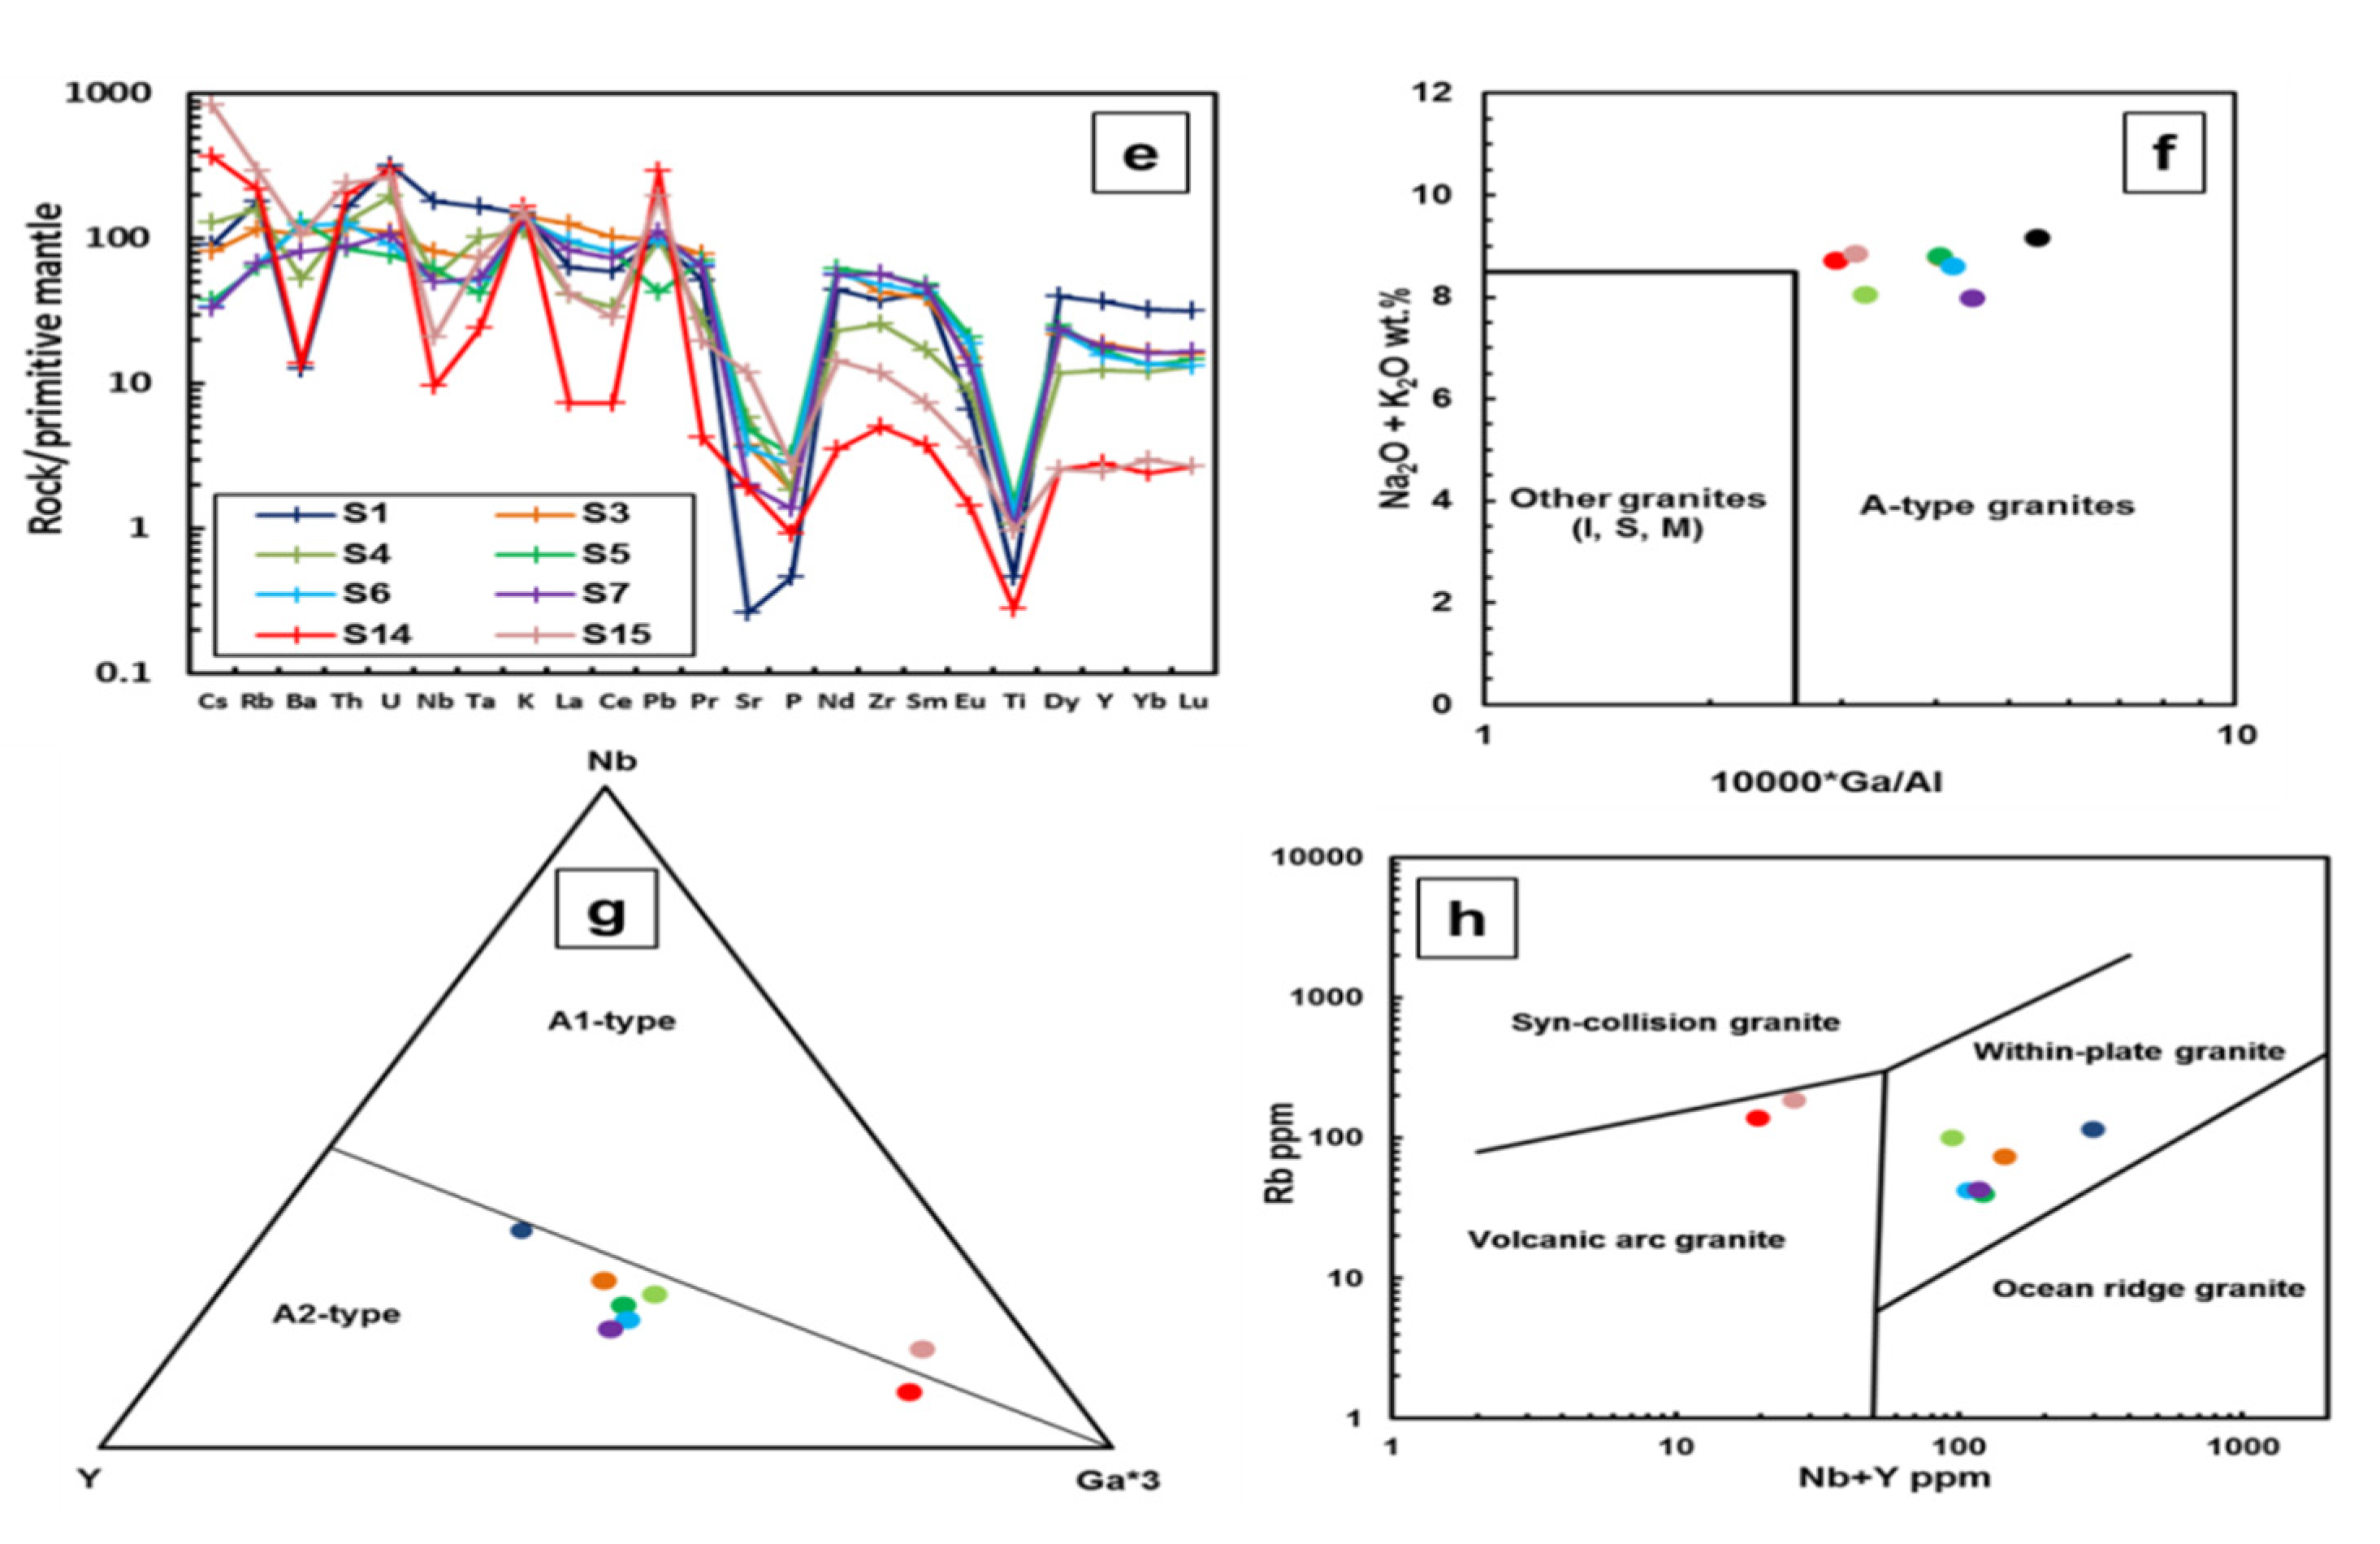
4.2. Geochemical Characterization
4.3. Potential Health Hazards Assessment
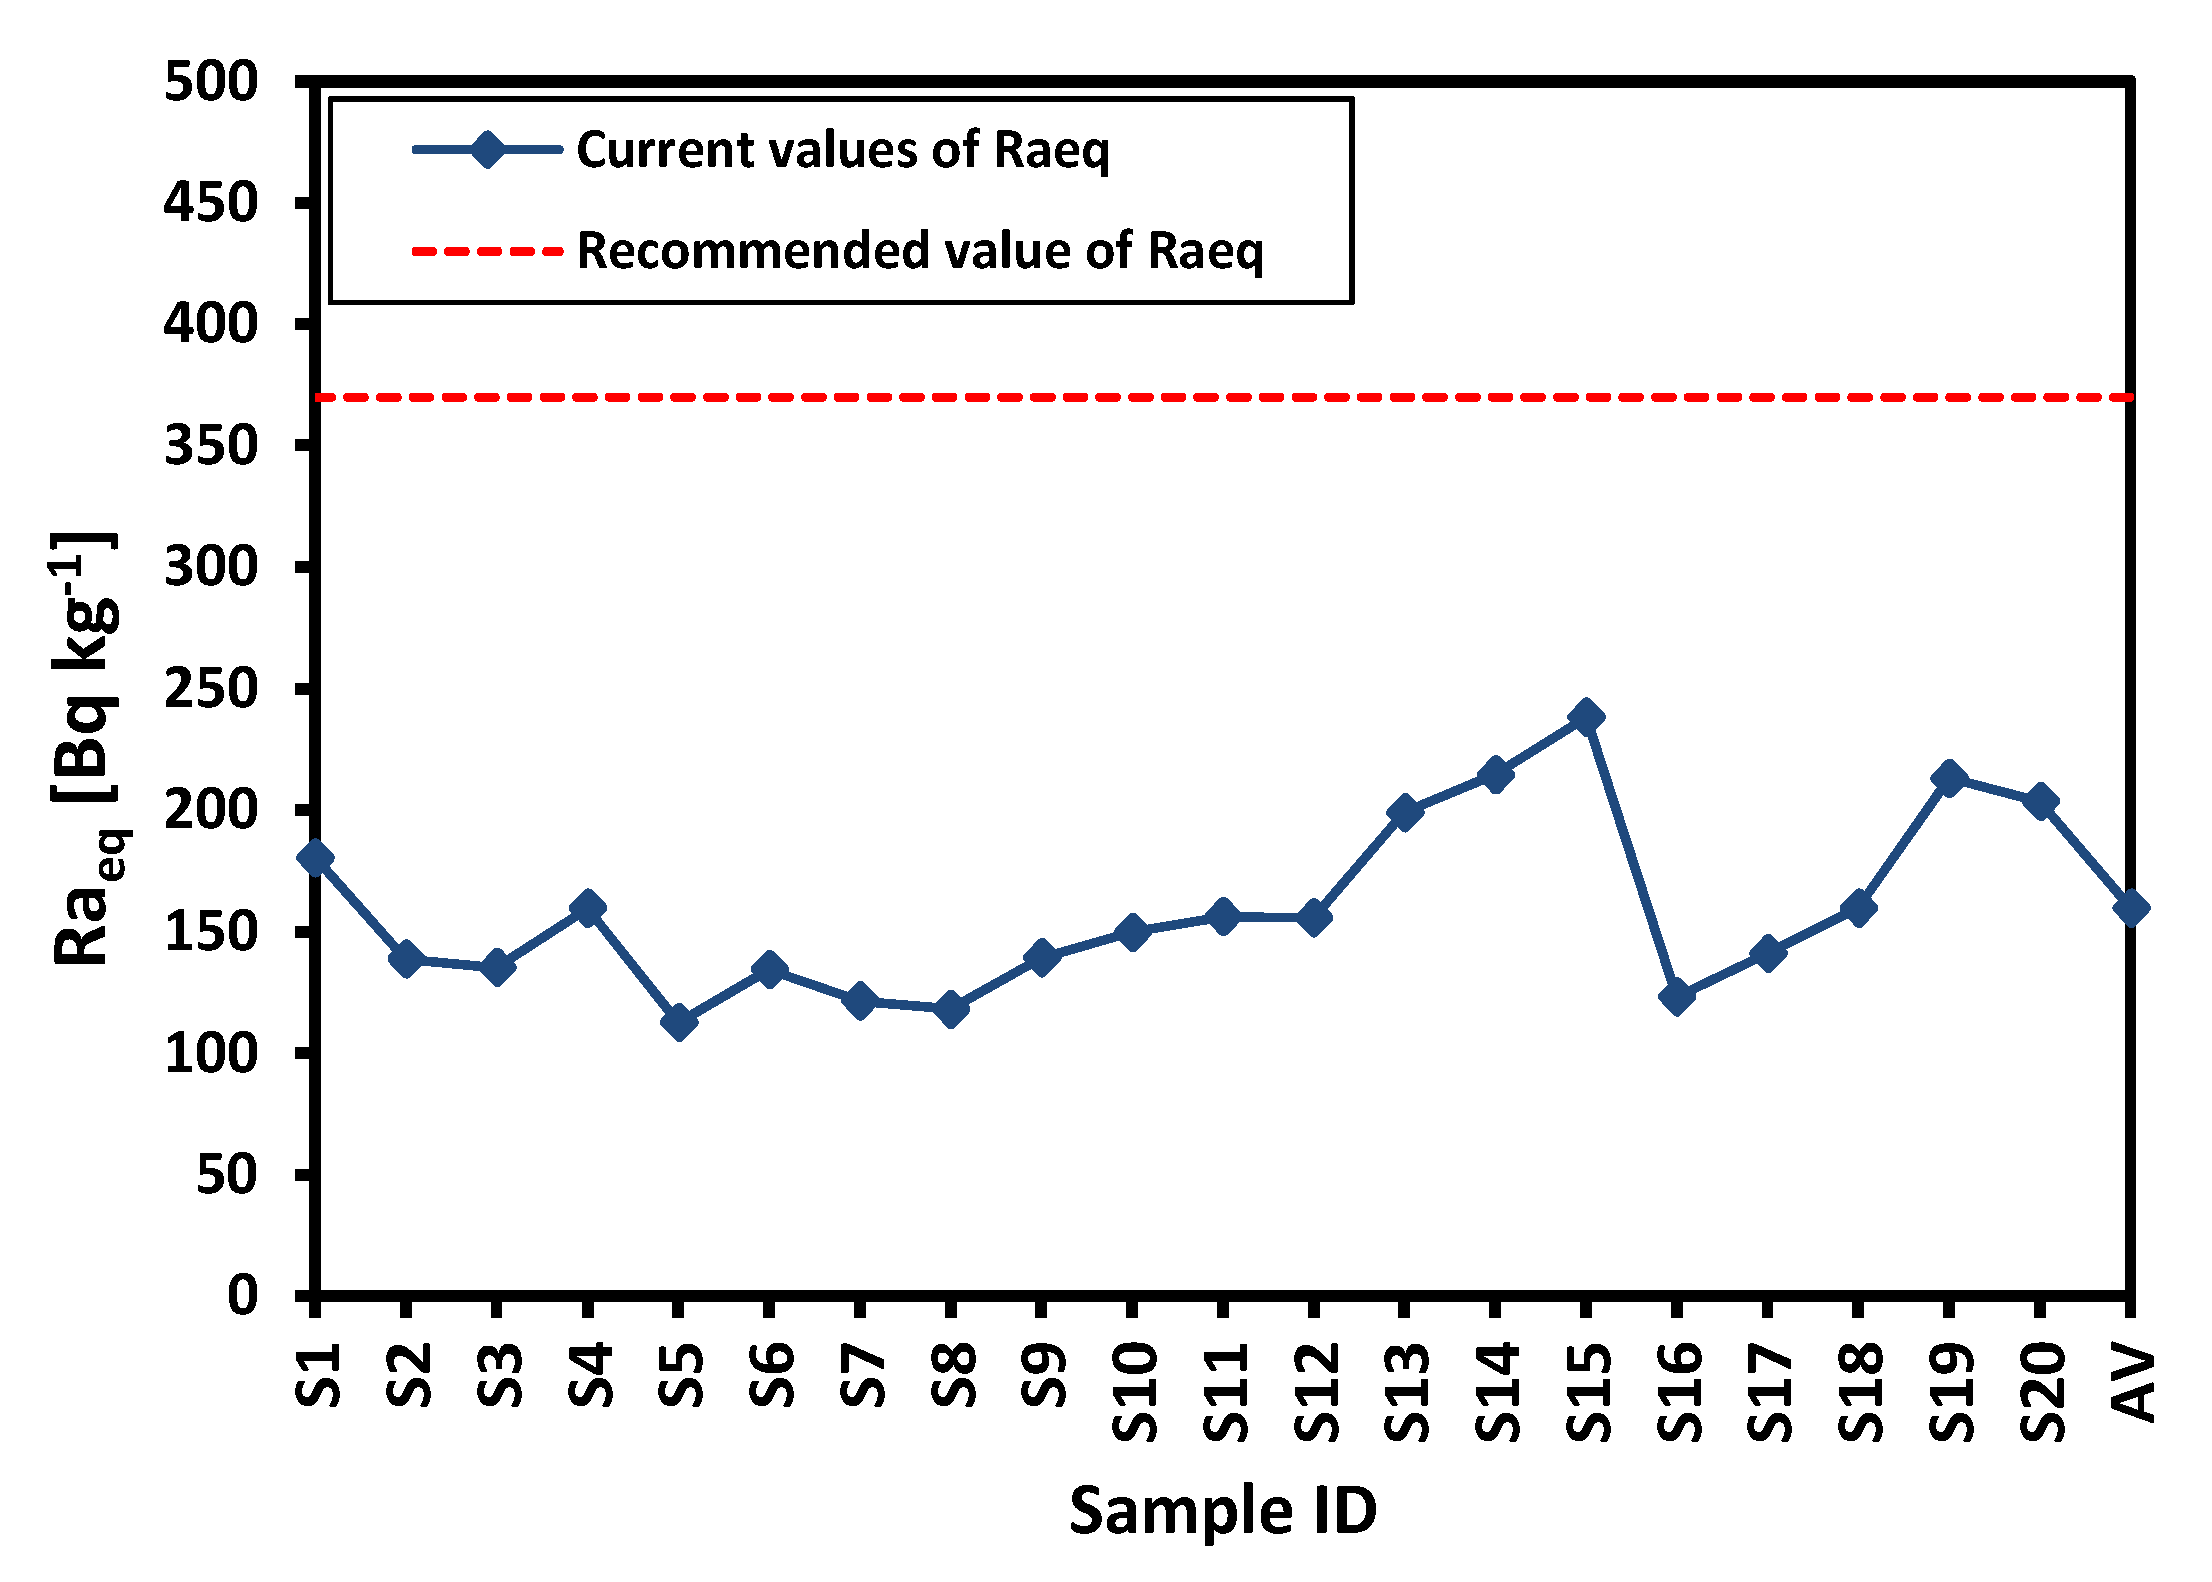
4.3.1. Radium Equivalent Activity Raeq
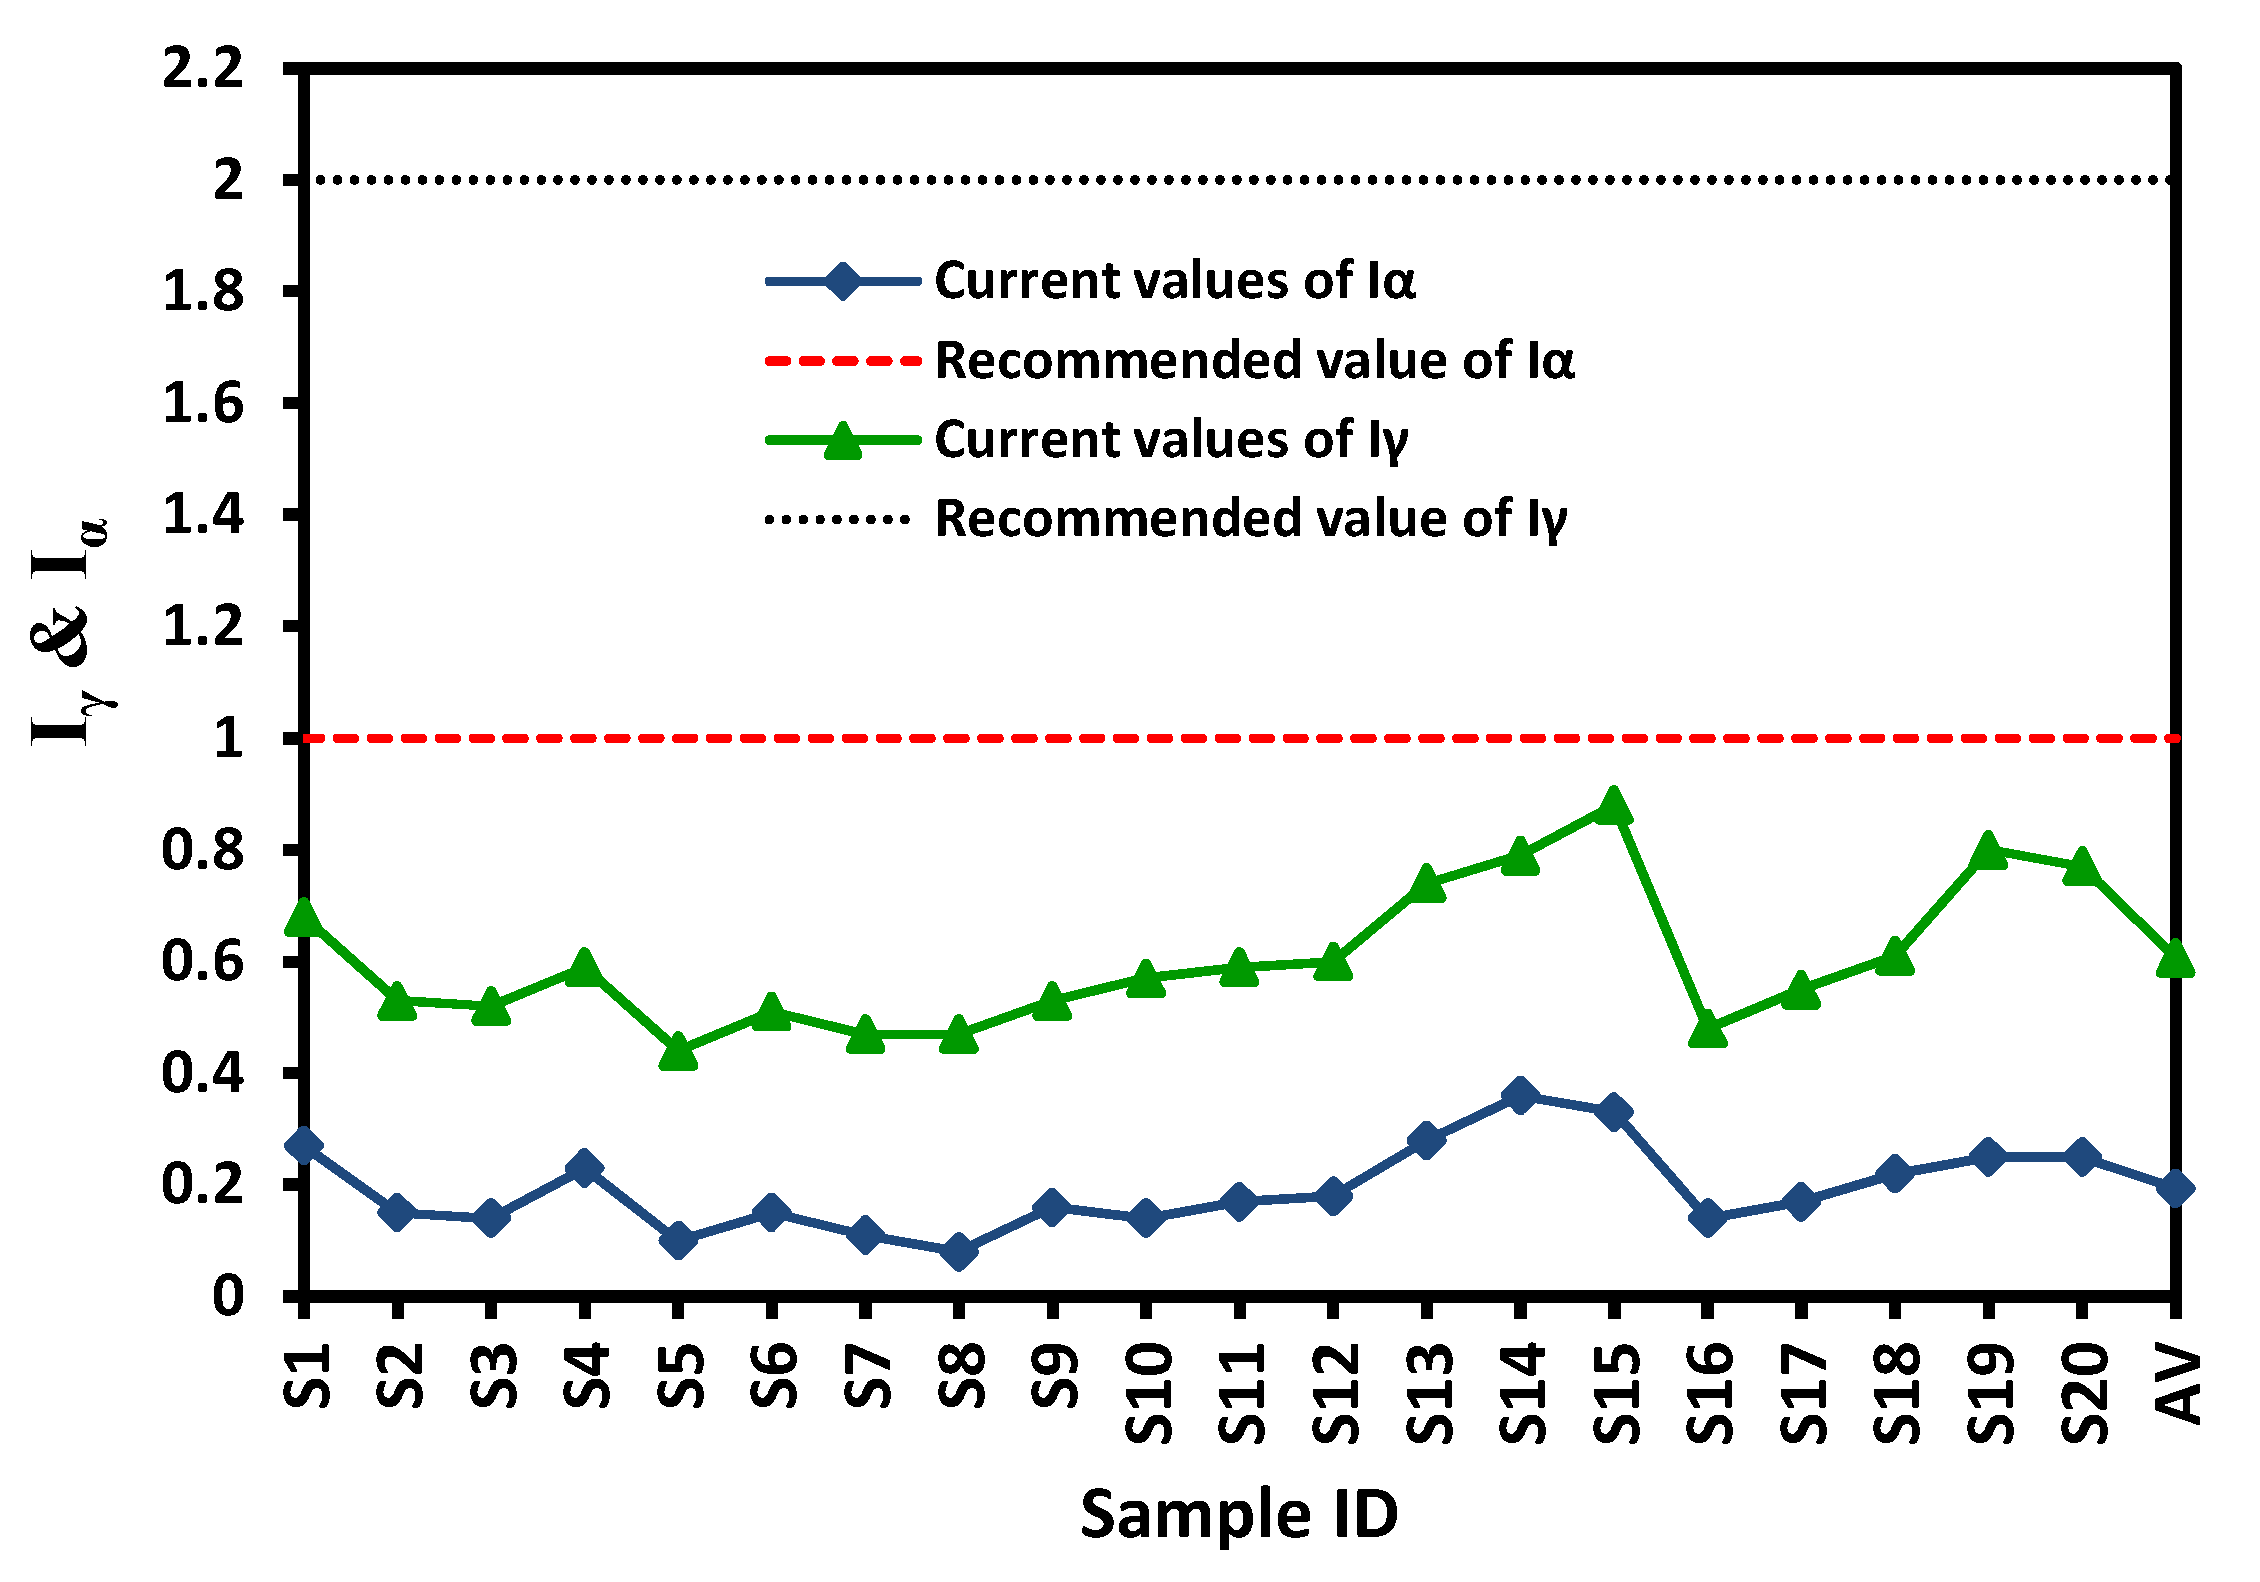
4.3.2. Gamma and Alpha Indices (Iγ and Iα)
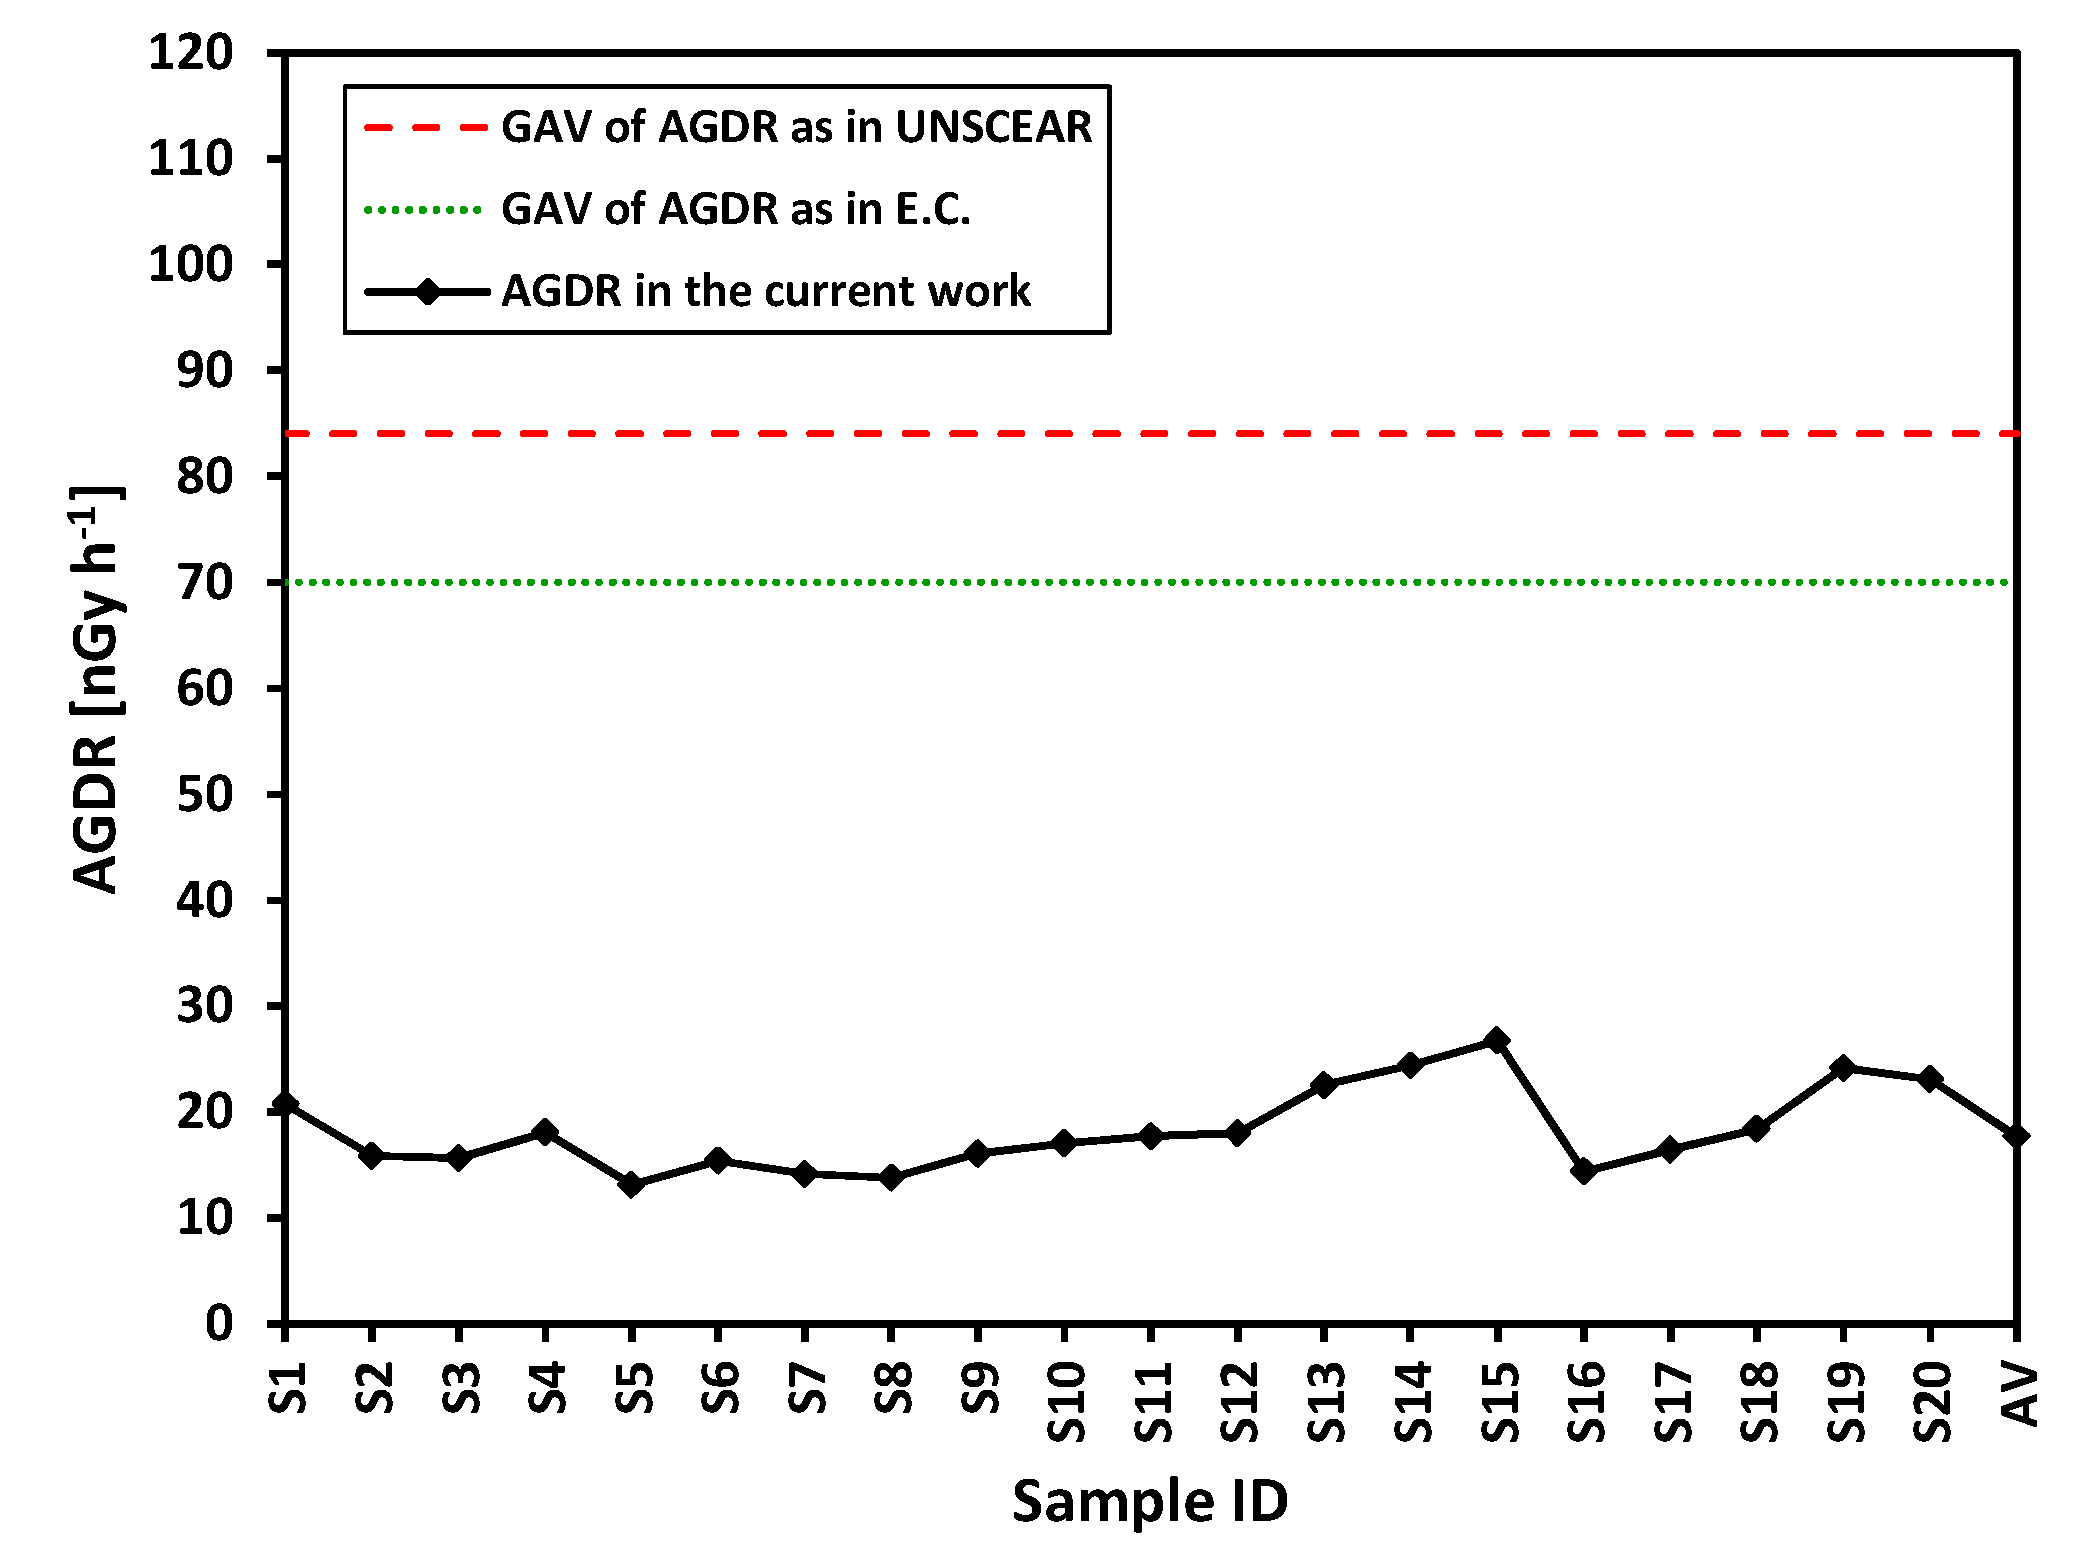
4.3.3. Absorbed Gamma Dose Rate (AGDR)
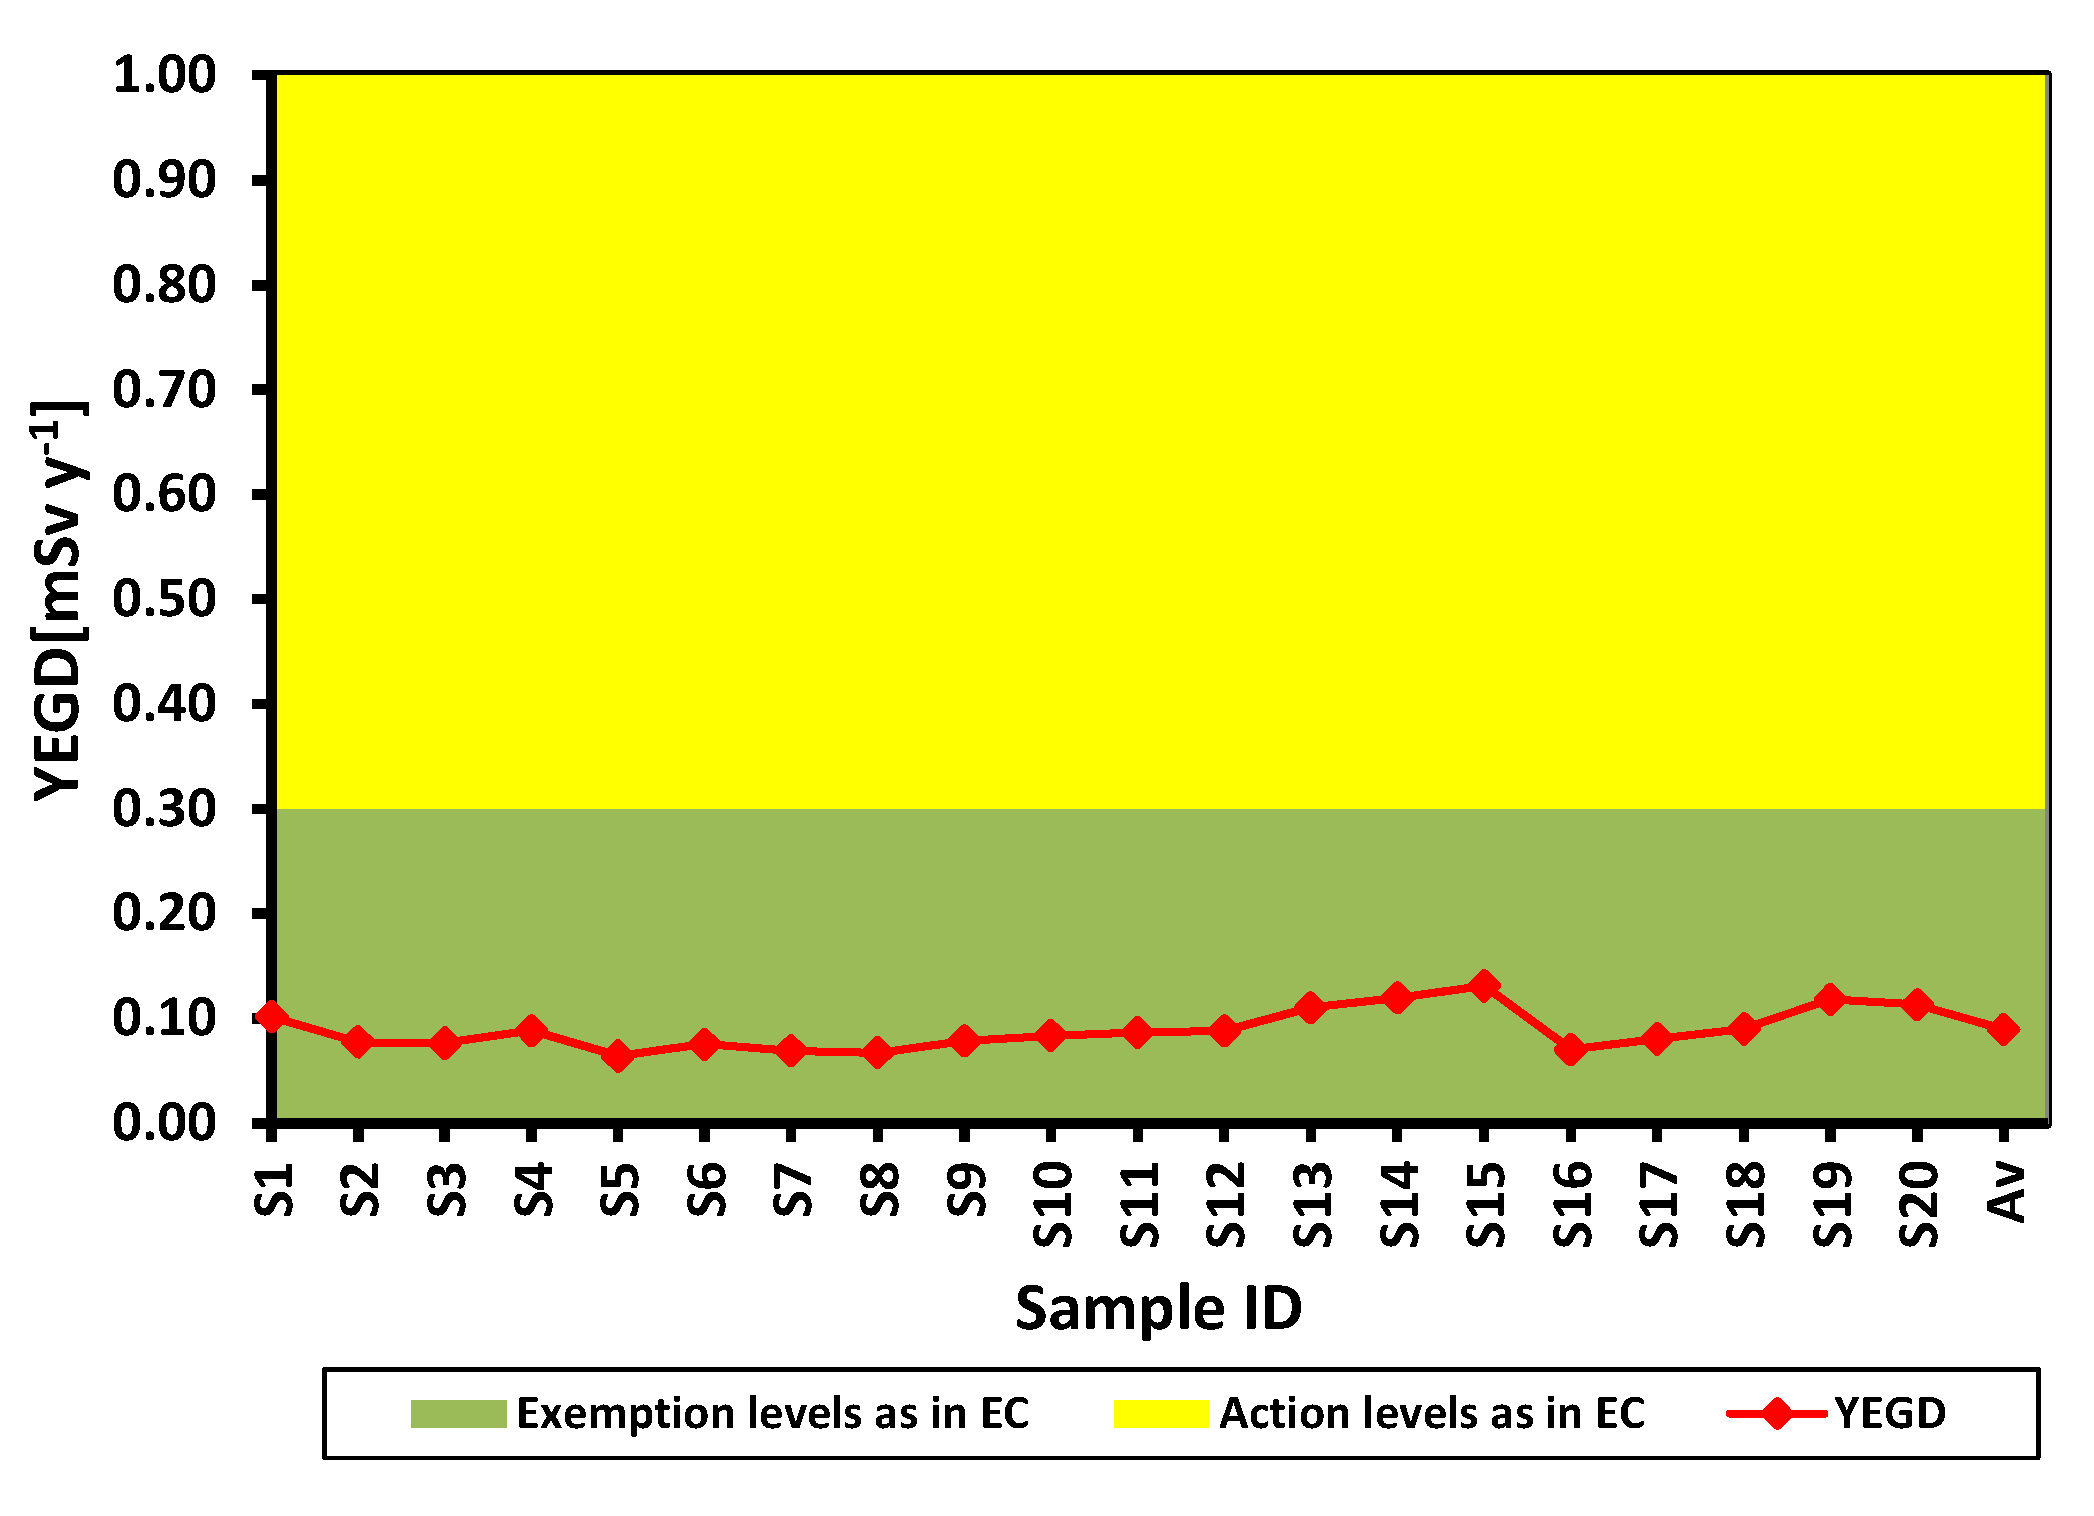
4.3.4. Yearly Effective Gamma Dose (YEGD)
4.3.5. Excess Lifetime Cancer Risk (ELCR)
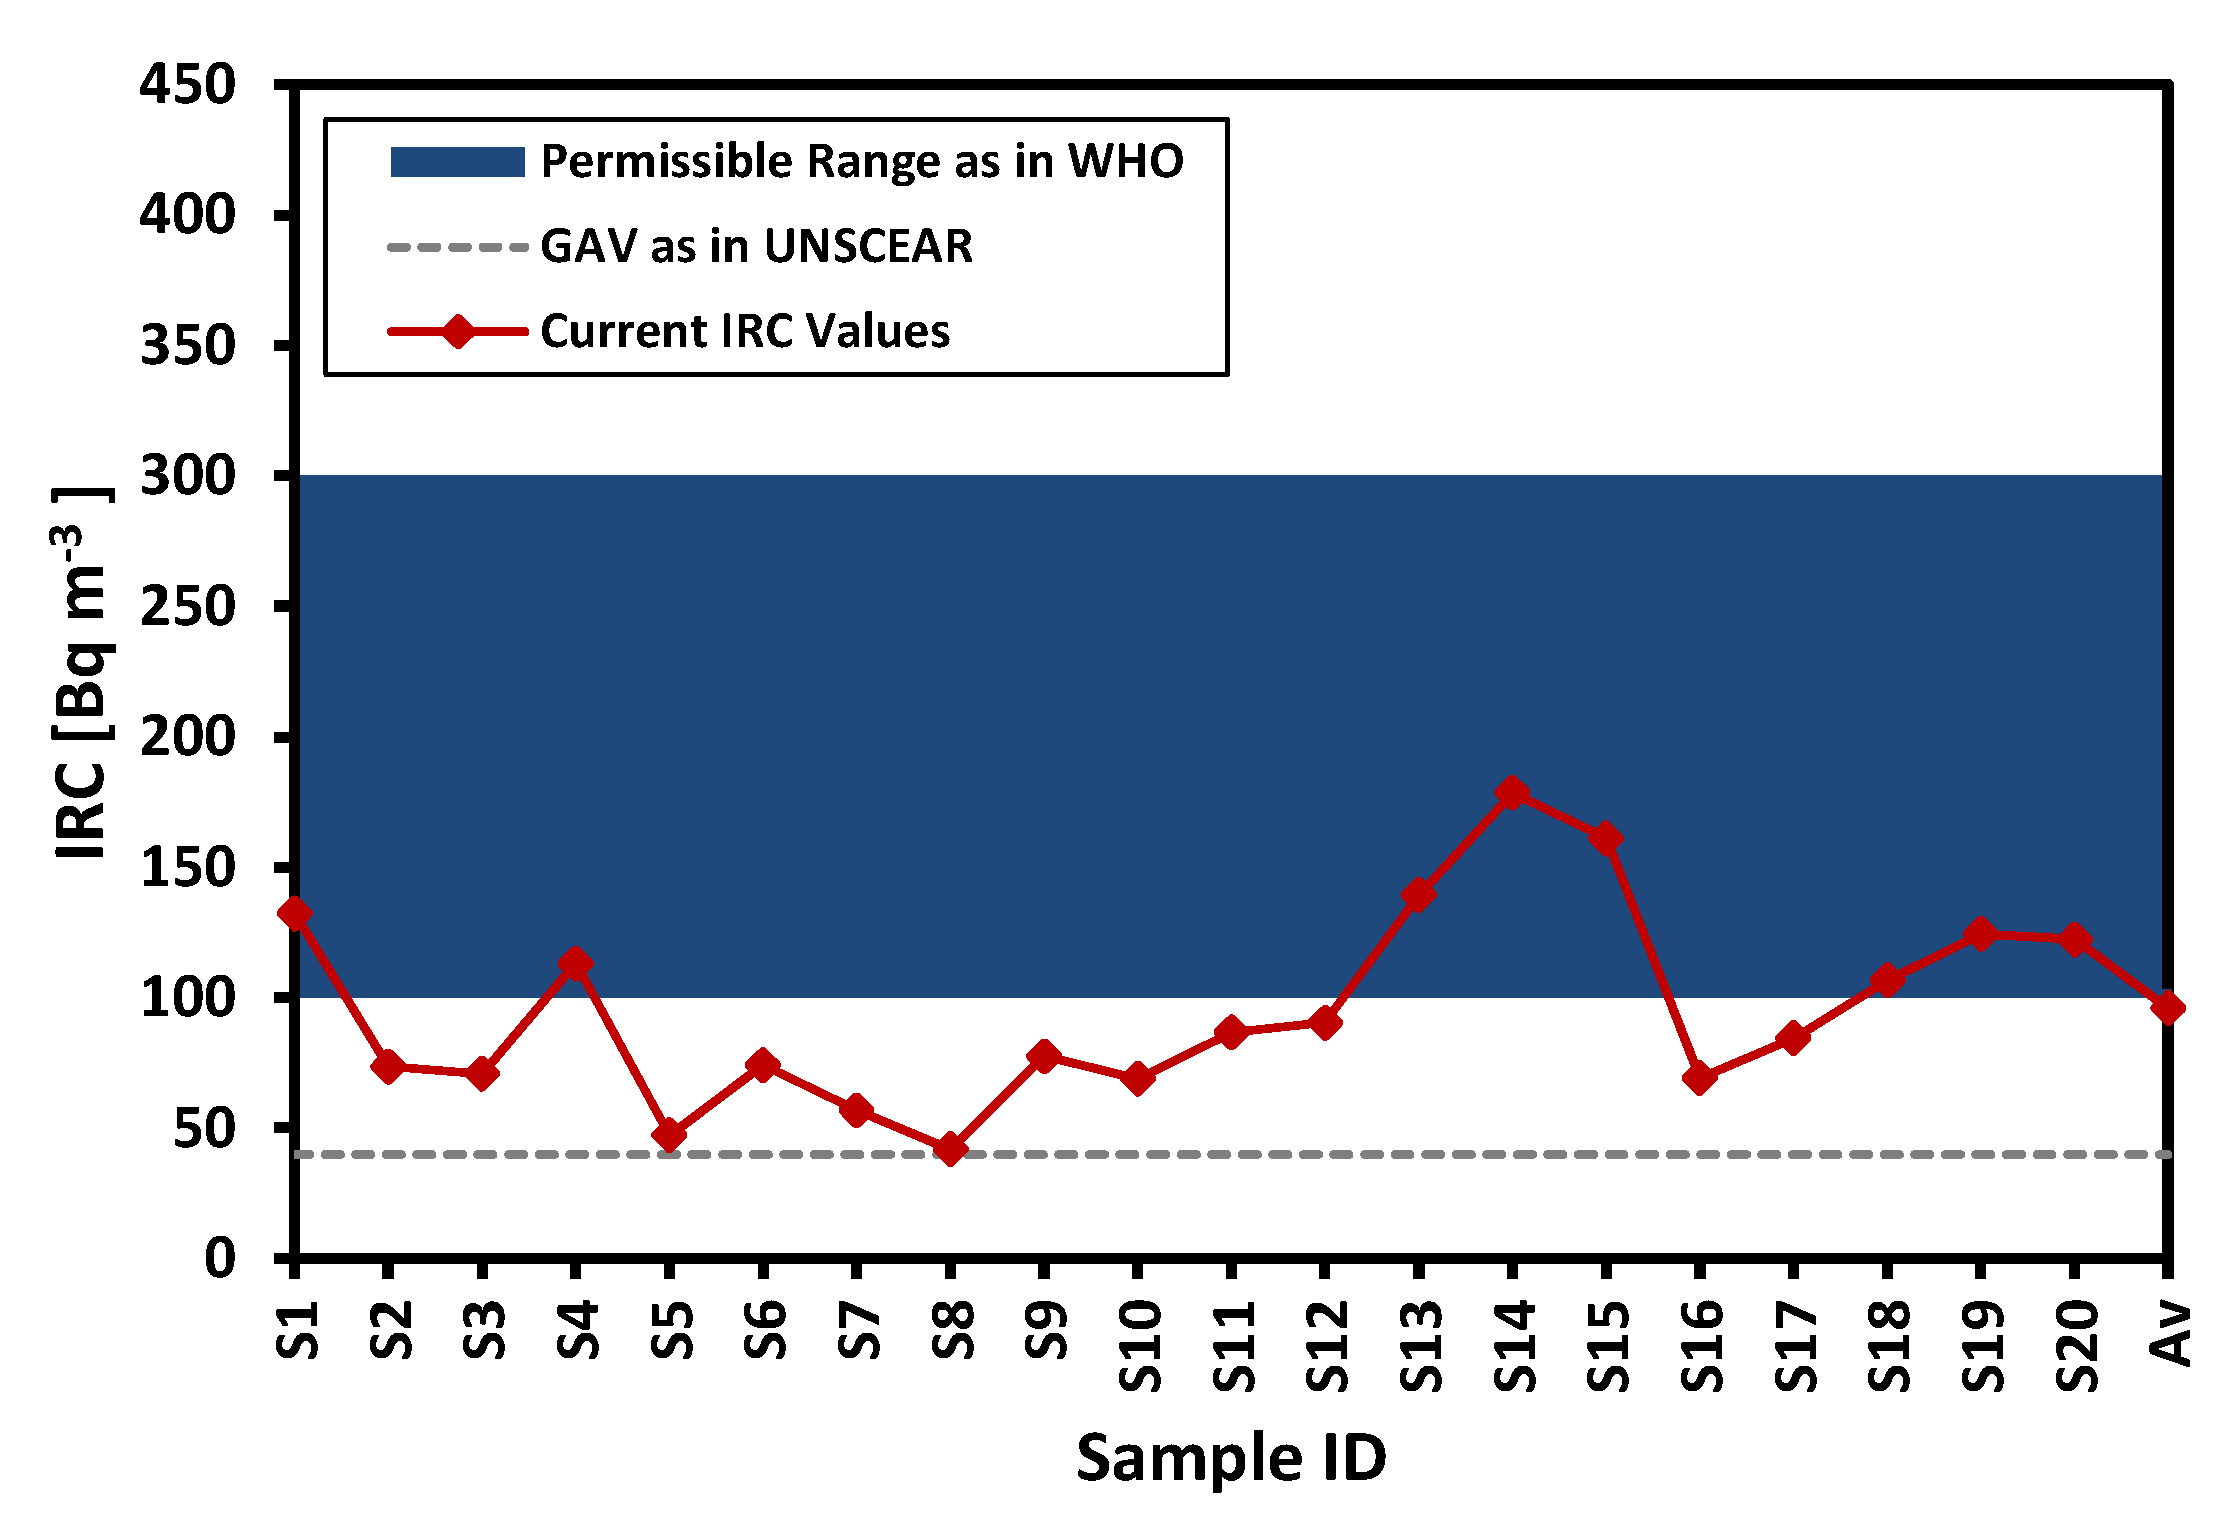
4.3.6. Indoor Radon Exhalation and Concentration
4.3.7. Indoor Yearly Effective Dose Owing to Radon Exposure (IYEDRn)
5. Data Statistical Analysis
6. Conclusions
Supplementary Materials
Author Contributions
Funding
Institutional Review Board Statement
Informed Consent Statement
Data Availability Statement
Acknowledgments
Conflicts of Interest
References
- Kalintsev, A.; Migdisov, A.; Alcorn, C.; Baker, J.; Brugger, J.; Mayanovic, R.A.; Akram, N.; Guo, X.; Xu, H.; Boukhalfa, H.; et al. Uranium carbonate complexes demonstrate drastic decrease in stability at elevated temperatures. Commun. Chem. 2021, 4, 120. [Google Scholar] [CrossRef]
- Pękala, A. Thorium and Uranium in the Rock Raw Materials Used for the Production of Building Materials. In IOP Conference Series: Materials Science and Engineering; IOP Publishing: Bristol, UK, 2017; Volume 245, p. 022033. [Google Scholar] [CrossRef]
- Amini Birami, F.; Moore, F.; Faghihi, R.; Keshavarzi, B. Distribution of natural radionuclides and assessment of the associated radiological hazards in the rock and soil samples from a high-level natural radiation area, Northern Iran. J. Radioanal. Nucl. Chem. 2019, 322, 2091–2103. [Google Scholar] [CrossRef]
- Rudnick, R.L.; Gao, S. Composition of the continental crust. Treatise Geochem. 2003, 3, 659. [Google Scholar]
- Walley El-Dine, N. Study of natural radioactivity and the state of radioactive disequilibrium in U-series for rock samples, North Eastern Desert, Egypt. Appl. Radiat. Isot. 2008, 66, 80–85. [Google Scholar] [CrossRef]
- El-Shershaby, A. Study of radioactivity levels in granite of Gable Gattar II in the north eastern desert of Egypt. Appl. Radiat. Isot. 2002, 57, 131–135. [Google Scholar] [CrossRef]
- El-Gamal, H.; Sidique, E.; El-Azab Farid, M. Considerable radioactivity levels in the granitic rocks of the central areas of the Eastern Desert, Egypt. Environ. Sci. Pollut. Res. 2018, 25, 29541–29555. [Google Scholar] [CrossRef]
- El-Gamal, H.; Sidique, E.; El-Haddad, M. Spatial Distributions and Risk Assessment of the Natural Radionuclides in the Granitic Rocks from the Eastern Desert, Egypt. Minerals 2019, 9, 386. [Google Scholar] [CrossRef] [Green Version]
- El-Gamal, H.; Sidique, E.; El-Haddad, M.; Farid, M.E.-A. Assessment of the natural radioactivity and radiological hazards in granites of Mueilha area (South Eastern Desert, Egypt). Environ. Earth Sci. 2018, 77, 691. [Google Scholar] [CrossRef]
- El-Arabi, A.M. 226Ra, 232Th and 40K concentrations in igneous rocks from eastern desert, Egypt and its radiological implications. Radiat. Meas. 2007, 42, 94–100. [Google Scholar] [CrossRef]
- El-Taher, A. Gamma spectroscopic analysis and associated radiation hazards of building materials used in Egypt. Radiat. Prot. Dosim. 2009, 138, 166–173. [Google Scholar] [CrossRef] [PubMed]
- Darwish, D.A.E.; Abul-Nasr, K.T.M.; El-Khayatt, A.M. The assessment of natural radioactivity and its associated radiological hazards and dose parameters in granite samples from South Sinai, Egypt. J. Radiat. Res. Appl. Sci. 2015, 8, 17–25. [Google Scholar] [CrossRef] [Green Version]
- Uosif, M.A.M.; Abdel-Salam, L.M. An assessment of the external radiological impact in granites and pegmatite in central Eastern Desert in Egypt with elevated natural radioactivity. Radiat. Prot. Dosim. 2010, 147, 467–473. [Google Scholar] [CrossRef] [PubMed]
- Issa, S.A.M.; Uosif, M.A.M.; Abd El-Salam, L.M. Natural radionuclide concentrations in granite rocks in Aswan and Central-Southern Eastern Desert, Egypt and their radiological implications. Radiat. Prot. Dosim. 2011, 150, 488–495. [Google Scholar] [CrossRef]
- Tawfic, A.F.; Zakaly, H.M.H.; Awad, H.A.; Tantawy, H.R.; Abbasi, A.; Abed, N.S.; Mostafa, M. Natural radioactivity levels and radiological implications in the high natural radiation area of Wadi El Reddah, Egypt. J. Radioanal. Nucl. Chem. 2021, 327, 643–652. [Google Scholar] [CrossRef]
- Abdel-Rahman, A.-F.M.; El-Kibbi, M.M. Anorogenic magmatism: Chemical evolution of the Mount El-Sibai A-type complex (Egypt), and implications for the origin of within-plate felsic magmas. Geol. Mag. 2001, 138, 67–85. [Google Scholar] [CrossRef]
- Fowler, A.-R.; Khamees, H.; Dowidar, H. El Sibai gneissic complex, Central Eastern Desert, Egypt: Folded nappes and syn-kinematic gneissic granitoid sheets—Not a core complex. J. Afr. Earth Sci. 2007, 49, 119–135. [Google Scholar] [CrossRef]
- Akaad, K.; El Ela, A.A. Geology of the Basement Rocks in the Eastern Half of the Belt between Latitudes 25° 30′ and 26° 30′N Central Eastern Desert, Egypt: Covering Parts of Sheets NG 36 K2, K3, L1 and NG 36 G5, G6, H4; Geological Survey of Egypt: Cairo, Egypt, 2002. [Google Scholar]
- Khan, A.R.; Rafique, M.; Jabbar, A.; Rahman, S.U.; Shahzad, M.I.; Khan, M.E.; Yasin, M. Radionuclide concentrations in sand samples from riverbanks of Muzaffarabad, Azad Kashmir. Nucl. Sci. Tech. 2018, 29, 93. [Google Scholar] [CrossRef]
- European Commission, E.C. Radiation Protection 112: Radiological Protection Principles Concerning the Natural Radioactivity of Building Materials; Office for Official Publications of the European Communities: Luxembourg, 1999; Available online: https://ec.europa.eu/energy/sites/default/files/documents/112.pdf (accessed on 14 December 2021).
- UNSCEAR. Sources and Effects of Ionizing Radiation: UNSCEAR 2000 Report to the General Assembly, with Scientific Annexes; United Nations: New York, NY, USA, 2000; Volume 1. [Google Scholar]
- UNSCEAR. Sources and Effects of Ionizing Radiation: UNSCEAR 1993 Report to the General Assembly, with Scientific Annexes; United Nations: NewYork, NY, USA, 1993. [Google Scholar]
- Amin, R.M. Gamma radiation measurements of naturally occurring radioactive samples from commercial Egyptian granites. Environ. Earth Sci. 2012, 67, 771–775. [Google Scholar] [CrossRef]
- Fadol, N.; Idriss, H.; Salih, I.; Ragab, N.A.; Osman, S.; Sam, A.K. Radiological hazard indices of granitic rocks used for the construction of buildings from Nuba mountains Sudan. Radiat. Prot. Dosim. 2018, 179, 364–369. [Google Scholar] [CrossRef] [PubMed]
- Thabayneh, K.M. Measurement of Natural Radioactivity and Radon Exhalation Rate in Granite Samples Used in Palestinian Buildings. Arab. J. Sci. Eng. 2013, 38, 201–207. [Google Scholar] [CrossRef]
- Al-Zahrani, J.H. Estimation of natural radioactivity in local and imported polished granite used as building materials in Saudi Arabia. J. Radiat. Res. Appl. Sci. 2017, 10, 241–245. [Google Scholar] [CrossRef] [Green Version]
- Sharaf, J.M.; Hamideen, M.S. Measurement of natural radioactivity in Jordanian building materials and their contribution to the public indoor gamma dose rate. Appl. Radiat. Isot. 2013, 80, 61–66. [Google Scholar] [CrossRef]
- Kuzmanović, P.; Todorović, N.; Nikolov, J.; Hansman, J.; Vraničar, A.; Knežević, J.; Miljević, B. Assessment of radiation risk and radon exhalation rate for granite used in the construction industry. J. Radioanal. Nucl. Chem. 2019, 321, 565–577. [Google Scholar] [CrossRef]
- Pavlidou, S.; Koroneos, A.; Papastefanou, C.; Christofides, G.; Stoulos, S.; Vavelides, M. Natural radioactivity of granites used as building materials. J. Environ. Radioact. 2006, 89, 48–60. [Google Scholar] [CrossRef]
- Sonkawade, R.G.; Kant, K.; Muralithar, S.; Kumar, R.; Ramola, R.C. Natural radioactivity in common building construction and radiation shielding materials. Atmos. Environ. 2008, 42, 2254–2259. [Google Scholar] [CrossRef]
- Aykamış, A.Ş.; Turhan, Ş.; Aysun Ugur, F.; Baykan, U.N.; Kılıç, A.M. Natural radioactivity, radon exhalation rates and indoor radon concentration of some granite samples used as construction material in Turkey. Radiat. Prot. Dosim. 2013, 157, 105–111. [Google Scholar] [CrossRef]
- Guillén, J.; Tejado, J.J.; Baeza, A.; Corbacho, J.A.; Muñoz, J.G. Assessment of radiological hazard of commercial granites from Extremadura (Spain). J. Environ. Radioact. 2014, 132, 81–88. [Google Scholar] [CrossRef] [PubMed]
- Marocchi, M.; Righi, S.; Bargossi, G.M.; Gasparotto, G. Natural radionuclides content and radiological hazard of commercial ornamental stones: An integrated radiometric and mineralogical-petrographic study. Radiat. Meas. 2011, 46, 538–545. [Google Scholar] [CrossRef]
- Tzortzis, M.; Tsertos, H.; Christofides, S.; Christodoulides, G. Gamma radiation measurements and dose rates in commercially-used natural tiling rocks (granites). J. Environ. Radioact. 2003, 70, 223–235. [Google Scholar] [CrossRef] [Green Version]
- Anjos, R.M.; Veiga, R.; Soares, T.; Santos, A.M.A.; Aguiar, J.G.; Frascá, M.H.B.O.; Brage, J.A.P.; Uzêda, D.; Mangia, L.; Facure, A.; et al. Natural radionuclide distribution in Brazilian commercial granites. Radiat. Meas. 2005, 39, 245–253. [Google Scholar] [CrossRef]
- Kitto, M.E.; Haines, D.K.; Menia, T.A. Assessment of gamma-ray emissions from natural and manmade decorative stones. J. Radioanal. Nucl. Chem. 2009, 282, 409. [Google Scholar] [CrossRef]
- Joshua, E.O.; Ademola, J.A.; Akpanowo, M.A.; Oyebanjo, O.A.; Olorode, D.O. Natural radionuclides and hazards of rock samples collected from Southeastern Nigeria. Radiat. Meas. 2009, 44, 401–404. [Google Scholar] [CrossRef]
- Asghar, M.; Tufail, M.; Sabiha, J.; Abid, A.; Waqas, M. Radiological implications of granite of northern Pakistan. J. Radiol. Prot. 2008, 28, 387–399. [Google Scholar] [CrossRef]
- Middlemost, E.A.K. Naming materials in the magma/igneous rock system. Earth-Sci. Rev. 1994, 37, 215–224. [Google Scholar] [CrossRef]
- Frost, B.R.; Barnes, C.G.; Collins, W.J.; Arculus, R.J.; Ellis, D.J.; Frost, C.D. A Geochemical Classification for Granitic Rocks. J. Petrol. 2001, 42, 2033–2048. [Google Scholar] [CrossRef]
- Maniar, P.D.; Piccoli, P.M. Tectonic discrimination of granitoids. Geol. Soc. Am. Bull. 1989, 101, 635–643. [Google Scholar] [CrossRef]
- Rickwood, P.C. Boundary lines within petrologic diagrams which use oxides of major and minor elements. Lithos 1989, 22, 247–263. [Google Scholar] [CrossRef]
- Sun, S.s.; McDonough, W.F. Chemical and isotopic systematics of oceanic basalts: Implications for mantle composition and processes. Geol. Soc. Lond. Spec. Publ. 1989, 42, 313. [Google Scholar] [CrossRef]
- Whalen, J.B.; Currie, K.L.; Chappell, B.W. A-type granites: Geochemical characteristics, discrimination and petrogenesis. Contrib. Mineral. Petrol. 1987, 95, 407–419. [Google Scholar] [CrossRef]
- Eby, G.N. Chemical subdivision of the A-type granitoids:Petrogenetic and tectonic implications. Geology 1992, 20, 641–644. [Google Scholar] [CrossRef]
- Pearce, J.A.; Harris, N.B.; Tindle, A.G. Trace element discrimination diagrams for the tectonic interpretation of granitic rocks. J. Petrol. 1984, 25, 956–983. [Google Scholar] [CrossRef] [Green Version]
- Hans Wedepohl, K. The composition of the continental crust. Geochim. Cosmochim. Acta 1995, 59, 1217–1232. [Google Scholar] [CrossRef]
- Štemprok, M. Tin-fluorine relationships in ore-bearing assemblages. In Metallization Associated with Acid Magmatism; John Wiley & Sons: Chichester, UK; New York, NY, USA, 1982; pp. 321–337. [Google Scholar]
- Grove, T.L.; Till, C.B.; Krawczynski, M.J. The Role of H2O in Subduction Zone Magmatism. Annu. Rev. Earth Planet. Sci. 2012, 40, 413–439. [Google Scholar] [CrossRef] [Green Version]
- Charoy, B.; Raimbault, L. Zr-, Th-, and REE-Rich Biotite Differentiates in the A-type Granite Pluton of Suzhou (Eastern China): The Key Role of Fluorine. J. Petrol. 1994, 35, 919–962. [Google Scholar] [CrossRef]
- Wedepohl, K.H. Handbook of Geochemistry; Springer: Berlin/Heidelberg, Germnay, 1969. [Google Scholar]
- Levinson, A.A. Introduction to Exploration Geochemistry; Applied Publishing: North York, ON, Canada, 1980. [Google Scholar]
- Hasterok, D.; Gard, M.; Webb, J. On the radiogenic heat production of metamorphic, igneous, and sedimentary rocks. Geosci. Front. 2018, 9, 1777–1794. [Google Scholar] [CrossRef]
- Frisch, W.; Abdel-Rahman, A.M. Petrogenesis of the Wadi Dib alkaline ring complex, Eastern Desert of Egypt. Mineral. Petrol. 1999, 65, 249–275. [Google Scholar] [CrossRef]
- Eby, G. A-type granites: Magma sources and their contribution to the growth of the continental crust. In Proceedings of the Seventh Hutton Symposium on Granites and Related Rocks, Avila, Spain, 4–9 July 2011; pp. 50–51. [Google Scholar]
- Bibby, H.M.; Caldwell, T.G.; Davey, F.J.; Webb, T.H. Geophysical evidence on the structure of the Taupo Volcanic Zone and its hydrothermal circulation. J. Volcanol. Geotherm. Res. 1995, 68, 29–58. [Google Scholar] [CrossRef]
- Evans, J.D. Straightforward Statistics for the Behavioral Sciences; Brooks/Cole Publishing Company: Pacific Grove, CA, USA, 1996. [Google Scholar]
- NEA-OECD. Exposure to Radiation from Natural Radioactivity in Building Materials, Report by NEA Group of Experts of the Nuclear Energy Agency; OECD: Paris, France, 1979. [Google Scholar]
- European Commission, E.C. Commission Recommendation of 21 February 1990 on the Protection of the Public against Indoor Exposure to Radon. 1990. Available online: https://op.europa.eu/en/publication-detail/-/publication/260b2024-21d9-4de5-ae3f-d7867a15d221/language-en (accessed on 14 December 2021).
- WHO; Zeeb, H. WHO Handbook on Indoor Radon: A Public Health Perspective; World Health Organization: Geneva, Switzerland, 2009. [Google Scholar]
- ICRP. ICRP Publication 65: Protection Against Radon-222 at Home and at Work; SAGE Publications: London, UK, 1994. [Google Scholar]
- Beretka, J.; Matthew, P.J. Natural radioactivity of Australian building materials, industrial wastes and by-products. Health Phys 1985, 48, 87–95. [Google Scholar] [CrossRef]
- Papadopoulos, A.; Christofides, G.; Koroneos, A.; Papadopoulou, L.; Papastefanou, C.; Stoulos, S. Natural radioactivity and radiation index of the major plutonic bodies in Greece. J. Environ. Radioact. 2013, 124, 227–238. [Google Scholar] [CrossRef] [PubMed]
- Anjos, R.M.; Juri Ayub, J.; Cid, A.S.; Cardoso, R.; Lacerda, T. External gamma-ray dose rate and radon concentration in indoor environments covered with Brazilian granites. J. Environ. Radioact. 2011, 102, 1055–1061. [Google Scholar] [CrossRef]
- Knežević, J.; Kuzmanović, P.; Mrdja, D.; Todorović, N.; Bikit, I.; Hansman, J. Estimation of absorbed gamma dose rate from granite by Monte Carlo simulation approach. J. Radiol. Prot. 2020, 40, 596–611. [Google Scholar] [CrossRef] [PubMed]
- Abdullahi, S.; Ismail, A.F.; Samat, S. Determination of indoor doses and excess lifetime cancer risks caused by building materials containing natural radionuclides in Malaysia. Nucl. Eng. Technol. 2019, 51, 325–336. [Google Scholar] [CrossRef]
- ICRP. ICRP Publication 60: 1990 Recommendations of the International Commission on Radiological Protection; SAGE Publications: London, UK, 1990. [Google Scholar]
- Mohammed, R.S.; Ahmed, R.S. Estimation of excess lifetime cancer risk and radiation hazard indices in southern Iraq. Environ. Earth Sci. 2017, 76, 303. [Google Scholar] [CrossRef]
- Qureshi, A.A.; Tariq, S.; Din, K.U.; Manzoor, S.; Calligaris, C.; Waheed, A. Evaluation of excessive lifetime cancer risk due to natural radioactivity in the rivers sediments of Northern Pakistan. J. Radiat. Res. Appl. Sci. 2014, 7, 438–447. [Google Scholar] [CrossRef] [Green Version]
- Council, N.R.; Sciences, C.L.; Research, B.R.E.; Radon, C.H.R.E. Health Effects of Exposure to Radon: BEIR VI; National Academies Press: Washington, DC, USA, 1999. [Google Scholar]
- Leal, A.L.C.; Lauria, D. Assessement of doses to members of the public arising from the use of ornamental rocks in residences. J. Radiol. Prot. 2016, 36, 680–694. [Google Scholar] [CrossRef]
- Chen, J.; Rahman, N.M.; Atiya, I.A. Radon exhalation from building materials for decorative use. J. Environ. Radioact. 2010, 101, 317–322. [Google Scholar] [CrossRef]
- UNSCEAR. UNSCEAR 2008 Report: Sources and Effects of Ionizing Radiation; The United Nations Scientific Committee on the Effects of Atomic Radiation: New York, NY, USA, 2010. [Google Scholar]
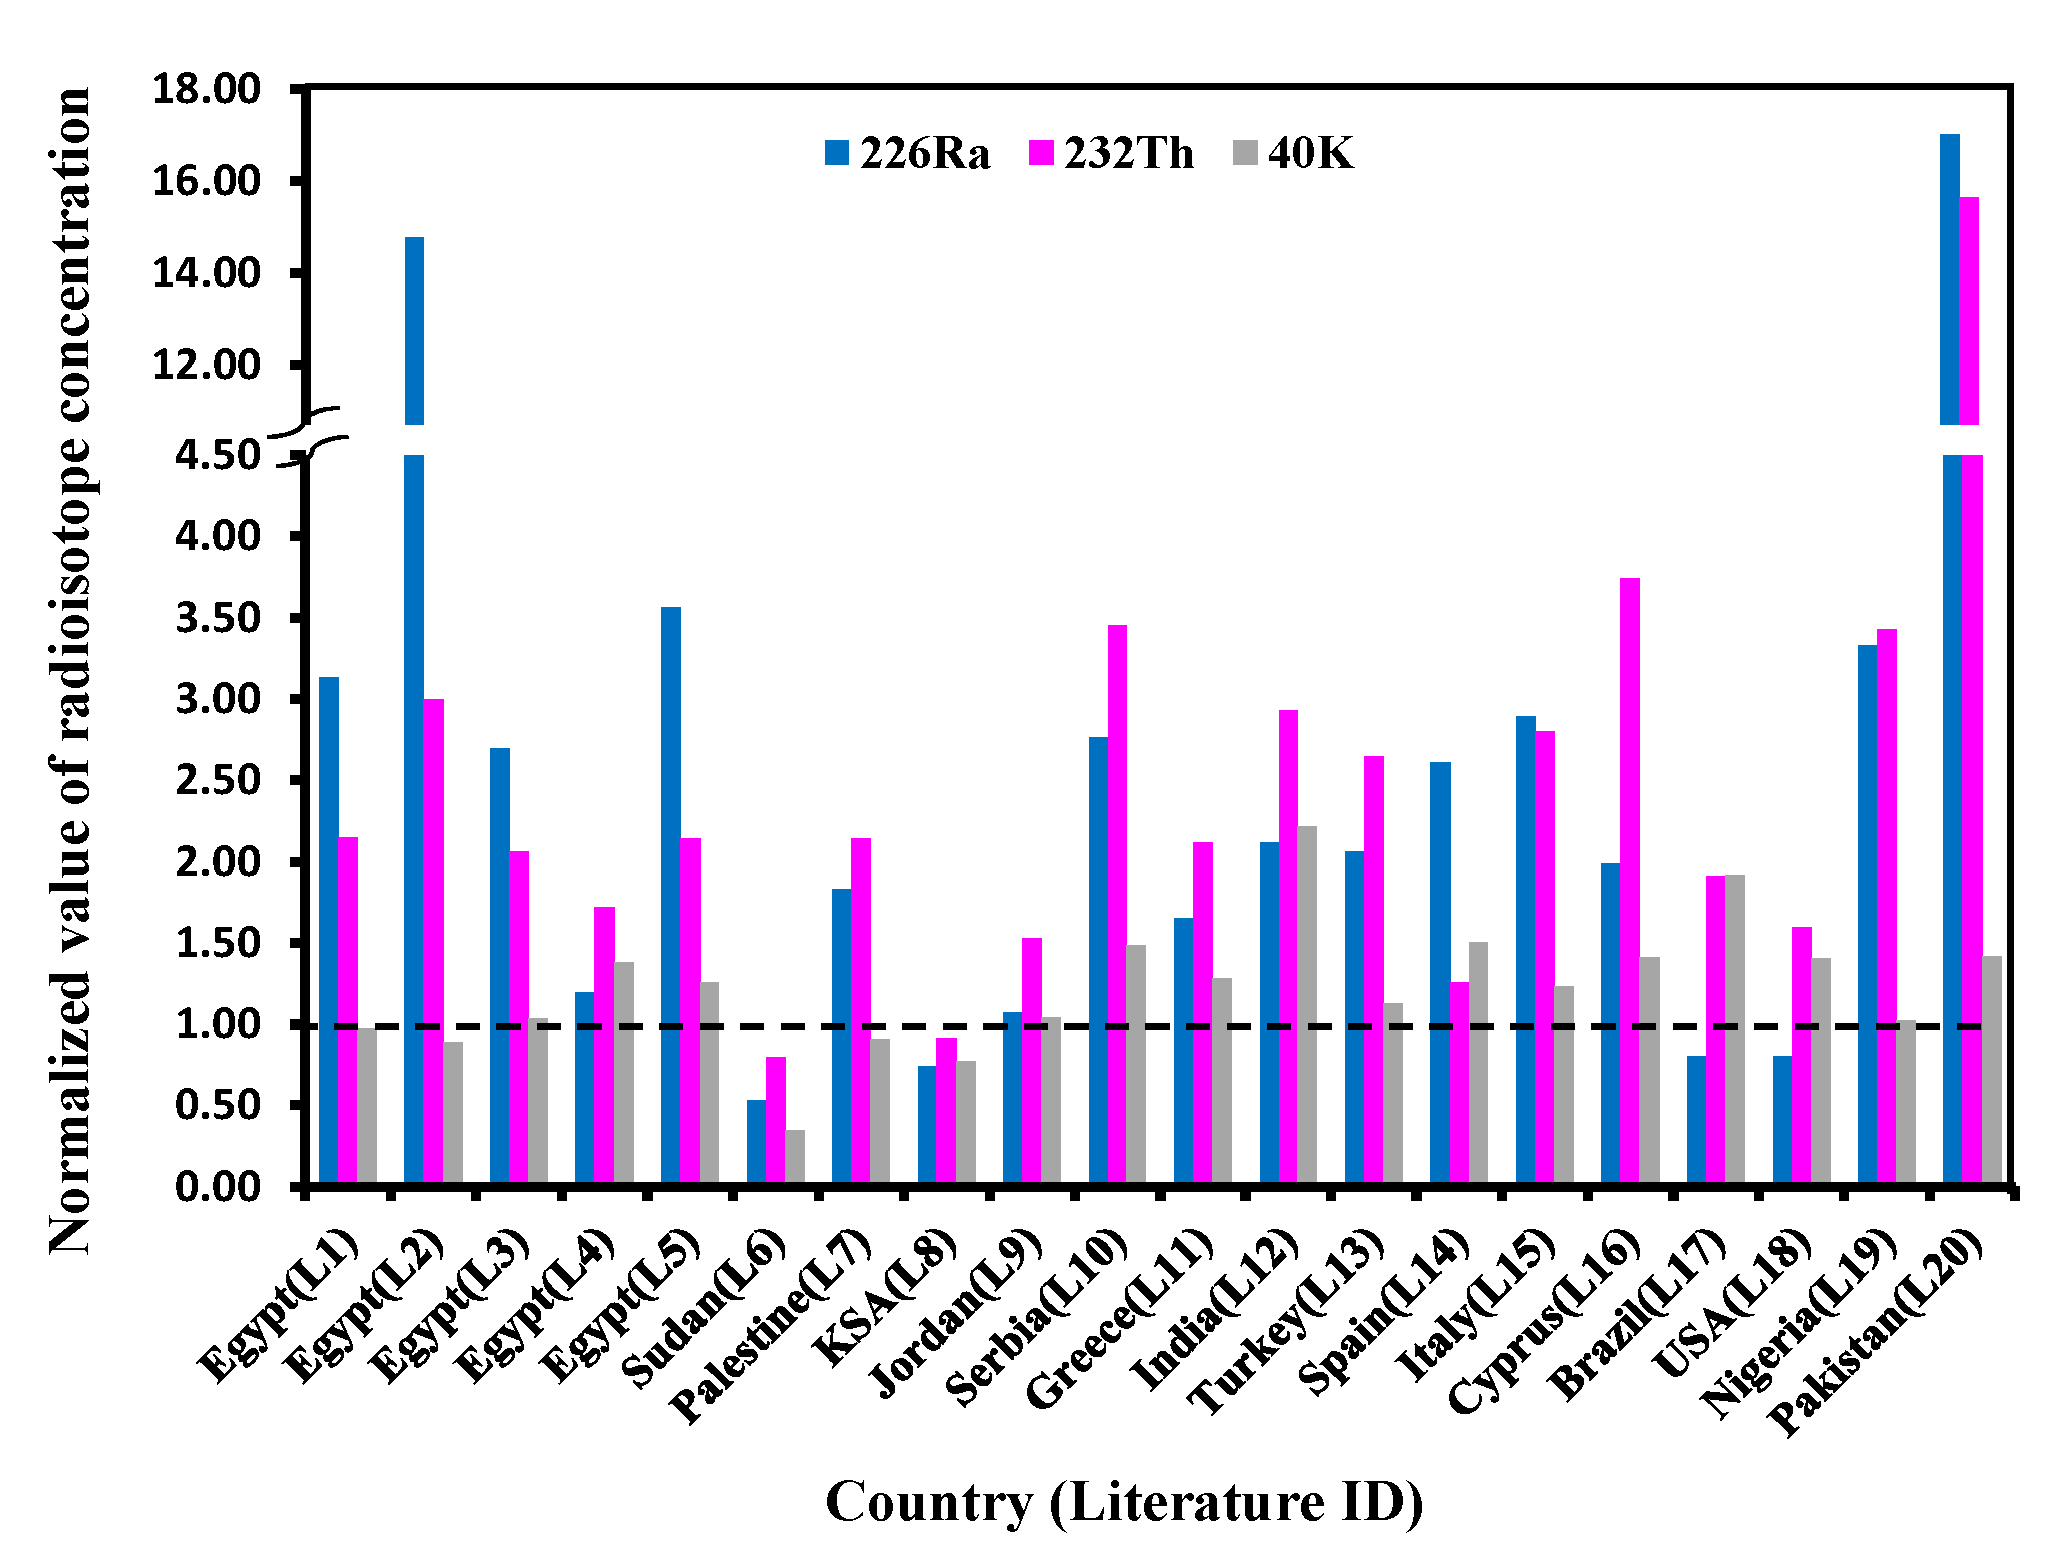


| Country Name | Activity Concentration (Bq/kg) | Reference | Literature ID | ||
|---|---|---|---|---|---|
| 226Ra | 232Th | 40K | |||
| Egypt (ElSibai-Abu ElTiyur granite) | (16.89–72) 38.73 | (21.97–70) 38.23 | (689.23–1037.73) 860.71 | Current work | Current work |
| Egypt (Gebel Mueiha granites) | (44.8–175.4) 121.3 | (29.4–111.4) 82.2 | (525.2–1045.2) 840 | [9] | L1 |
| Egypt (Gebel El-Missikat granites) | (104.2–4536.9) 572.3 | (71–163.1) 114.5 | (17.5–1039.7) 764.1 | [7] | L2 |
| Egypt (Gebel El-Qattar granites) | (38.1–459.4) 104.4 | (28.9–122.7) 78.8 | (777.9–963.1) 892.9 | [8] | L3 |
| Egypt (Saint Katherine granites) | (17.2–85.9) 46.4 | (26.1–121.1) 65.7 | (940.6–1322.9) 1186.5 | [12] | L4 |
| Egypt (commercial Egyptian granites) | (25–356) 138 | (5–161) 82 | (100–1796) 1081 | [23] | L5 |
| Sudan (Nuba mountains granites) | (12.8–28.7) 20.6 | (21.1–39.8) 30.5 | (111.6–443.3) 295.2 | [24] | L6 |
| Palestine (imported granite) | (18.6–151.2) 71 | (28.8–211) 82 | (400–1256.8) 780.8 | [25] | L7 |
| KSA (local and imported granite) | (1.53–77.16) 28.82 | (0.51–89.82) 34.83 | (19.47–1632.37) 665.08 | [26] | L8 |
| Jordan (local granite used as building materials) | 41.5 | 58.4 | 897 | [27] | L9 |
| Serbia (imported granite used in the construction industry) | (23–280) 107 | (77–426) 132 | (550–2240) 1276 | [28] | L10 |
| Greece (granites used as building materials) | (1–170) 64 | (1–354) 81 | (49–1592) 1104 | [29] | L11 |
| India (granites used in Indian dwellings) | 82 | 112 | 1908 | [30] | L12 |
| Turkey (granite used as construction material) | (10–187) 80 | (16–354) 101 | (104–1630) 974 | [31] | L13 |
| Spain (Extremadura granite) | (14–22) 101 | (8–122) 48 | (1098–1633) 1293 | [32] | L14 |
| Italy (commercial ornamental stones) | (12–390) 112 | (20–490) 107 | (240–2000) 1063 | [33] | L15 |
| Cyprus (imported granites) | (1–588) 77 | (1–906) 143 | (50–1606) 1215 | [34] | L16 |
| Brazil (commercial granites) | (5.2–169) 31 | (4.5–448.5) 73 | (190–2028) 1648 | [35] | L17 |
| USA (commercial granites) | 31 | 61 | 1210 | [36] | L18 |
| SE part of Nigeria | 129 | 131 | 882 | [37] | L19 |
| Pakistan (natural granite) | (46–6120) 659 | (92–3214) 598 | (899–1927) 1218 | [38] | L20 |
| Radiological Parameters | Approved Values | References |
|---|---|---|
| Concentrations of 238U, 232Th and 40K | 35, 30 and 400 Bq/kg (In regular soil) | UNSCEAR [21] |
| 50, 50 and 500 Bq/kg (in building materials) | UNSCEAR [22] | |
| Radium equivalent activity (Raeq) | 370 Bq/kg | NEA-OECD [58] |
| Radon concentration (RC) | 200 Bq m-3 | European Commission [59] |
| Gamma index (Iγ) for superficial building materials. | 2 (corresponds to a dose of 0.3 mSv/y) | European Commission [20] |
| Alpha index (Iα) | 0.5 (corresponds indoor radon ≤ 200 Bq m−3) 1 (corresponds indoor radon ≥ 200 Bq m−3) | European Commission [20] |
| Absorbed gamma dose rate | 84 nGy/h 70 nGy/h | UNSCEAR [21] European Commission [20] |
| Average annual external effective dose | 0.46 mSv/y | UNSCEAR [22] |
| Excess lifetime cancer risk (ELCR) | 0.29 × 10³ | UNSCEAR [21] |
| Indoor radon concentration (IRC) | 40 Bq m−3 100 to 300 Bq m−3 200 Bq m−3 | UNSCEAR [21] WHO et al. [60] European Commission [20] ICRP [61] |
| Indoor yearly effective dose owing to radon exposure (IYEDRn) | 1.2 mSv/y 3–10 mSv/y | UNSCEAR [21] ICRP [61] |
| Sample | Raeq (Bq/kg) | Iα | Iγ | AGDR (nGy/h) | IYEGD (mSv/y) | ELCR ×10−3 | RER (Bq/m2 h) | IRC (Bq/m3) | IYADRn (mSv/y) |
|---|---|---|---|---|---|---|---|---|---|
| S1 | 180.42 | 0.27 | 0.68 | 20.72 | 0.10 | 0.34 | 7.12 | 132.38 | 3.34 |
| S2 | 138.61 | 0.15 | 0.53 | 15.81 | 0.08 | 0.26 | 3.96 | 73.63 | 1.86 |
| S3 | 135.13 | 0.14 | 0.52 | 15.62 | 0.08 | 0.25 | 3.81 | 70.89 | 1.79 |
| S4 | 159.56 | 0.23 | 0.59 | 18.05 | 0.09 | 0.29 | 6.09 | 113.16 | 2.86 |
| S5 | 112.48 | 0.10 | 0.44 | 13.09 | 0.06 | 0.21 | 2.54 | 47.27 | 1.19 |
| S6 | 134.31 | 0.15 | 0.51 | 15.38 | 0.08 | 0.25 | 3.99 | 74.12 | 1.87 |
| S7 | 121.47 | 0.11 | 0.47 | 14.11 | 0.07 | 0.23 | 3.06 | 56.88 | 1.44 |
| S8 | 118.17 | 0.08 | 0.47 | 13.76 | 0.07 | 0.22 | 2.25 | 41.88 | 1.06 |
| S9 | 139.19 | 0.16 | 0.53 | 16.03 | 0.08 | 0.26 | 4.18 | 77.61 | 1.96 |
| S10 | 149.71 | 0.14 | 0.57 | 17.04 | 0.08 | 0.28 | 3.71 | 68.91 | 1.74 |
| S11 | 156.15 | 0.17 | 0.59 | 17.69 | 0.09 | 0.29 | 4.66 | 86.66 | 2.19 |
| S12 | 155.75 | 0.18 | 0.60 | 17.97 | 0.09 | 0.29 | 4.87 | 90.44 | 2.28 |
| S13 | 198.97 | 0.28 | 0.74 | 22.52 | 0.11 | 0.36 | 7.50 | 139.40 | 3.52 |
| S14 | 214.57 | 0.36 | 0.79 | 24.39 | 0.12 | 0.40 | 9.60 | 178.50 | 4.51 |
| S15 | 238.25 | 0.33 | 0.88 | 26.72 | 0.13 | 0.43 | 8.67 | 161.15 | 4.07 |
| S16 | 123.17 | 0.14 | 0.48 | 14.35 | 0.07 | 0.23 | 3.72 | 69.13 | 1.75 |
| S17 | 141.10 | 0.17 | 0.55 | 16.43 | 0.08 | 0.27 | 4.55 | 84.52 | 2.13 |
| S18 | 159.74 | 0.22 | 0.61 | 18.36 | 0.09 | 0.30 | 5.74 | 106.70 | 2.69 |
| S19 | 213.06 | 0.25 | 0.80 | 24.11 | 0.12 | 0.39 | 6.70 | 124.52 | 3.14 |
| S20 | 203.46 | 0.25 | 0.77 | 23.09 | 0.11 | 0.37 | 6.58 | 122.37 | 3.09 |
| Min | 112.48 | 0.08 | 0.44 | 13.09 | 0.06 | 0.21 | 2.25 | 41.88 | 1.06 |
| Max | 238.25 | 0.36 | 0.88 | 26.72 | 0.13 | 0.43 | 9.60 | 178.50 | 4.51 |
| AV | 159.66 | 0.19 | 0.61 | 18.26 | 0.09 | 0.30 | 5.17 | 96.01 | 2.42 |
| SE | 8.15 | 0.02 | 0.03 | 0.89 | 0.004 | 0.01 | 0.45 | 8.38 | 0.21 |
| Variables | Range | Min | Max | Mean | Std. Deviation | Variance | Skewness | Kurtosis | Normality Test (Shapiro–Wilk) | GFT for Normal Distribution with A–D Test | |
|---|---|---|---|---|---|---|---|---|---|---|---|
| Value | Std. Error | p-Value | p-Value | ||||||||
| 238U | 55.110 | 16.890 | 72.000 | 38.726 | 3.379 | 15.111 | 228.345 | 0.662 | −0.256 | 0.30063 | 0.25085 |
| 232Th | 48.030 | 21.970 | 70.000 | 38.226 | 2.988 | 13.362 | 178.555 | 0.794 | 0.014 | 0.12877 | 0.19204 |
| 40K | 348.500 | 689.230 | 1037.730 | 860.712 | 18.593 | 83.152 | 6914.183 | 0.251 | 0.441 | 0.9736 | 0.88759 |
| Raeq | 125.770 | 112.480 | 238.250 | 159.664 | 8.152 | 36.457 | 1329.089 | 0.748 | −0.484 | 0.07763 | 0.0616 |
| Iα | 0.280 | 0.080 | 0.360 | 0.194 | 0.017 | 0.077 | 0.006 | 0.646 | −0.301 | 0.27676 | 0.20339 |
| Iγ | 0.440 | 0.440 | 0.880 | 0.606 | 0.029 | 0.128 | 0.016 | 0.758 | −0.512 | 0.06745 | 0.05257 |
| AGDR | 13.630 | 13.090 | 26.720 | 18.262 | 0.891 | 3.986 | 15.891 | 0.741 | −0.548 | 0.07585 | 0.05973 |
| YEGD | 0.070 | 0.060 | 0.130 | 0.090 | 0.004 | 0.019 | 0.000 | 0.645 | −0.420 | 0.11088 | 0.05016 |
| ELCR | 0.220 | 0.210 | 0.430 | 0.296 | 0.014 | 0.064 | 0.004 | 0.689 | −0.577 | 0.11505 | 0.0975 |
| RER | 7.351 | 2.253 | 9.603 | 5.165 | 0.451 | 2.015 | 4.062 | 0.663 | −0.256 | 0.30403 | 0.25418 |
| IRC | 136.620 | 41.880 | 178.500 | 96.006 | 8.377 | 37.461 | 1403.325 | 0.663 | −0.256 | 0.30049 | 0.2508 |
| IYEDRn | 3.450 | 1.060 | 4.510 | 2.424 | 0.211 | 0.946 | 0.895 | 0.667 | −0.246 | 0.29481 | 0.24563 |
| U-238 | Th-232 | K-40 | Raeq | Iα | Iγ | AGDR | YEGD | ELCR | RER | IRC | IYEDRn | |||
|---|---|---|---|---|---|---|---|---|---|---|---|---|---|---|
| U-238 | 1.000 | |||||||||||||
| Th-232 | 0.866 | 1.000 | 0.8–1 | |||||||||||
| K-40 | 0.401 | 0.478 | 1.000 | 0.6–0.79 | ||||||||||
| Raeq | 0.939 | 0.967 | 0.592 | 1.000 | 0.4–0.59 | |||||||||
| Iα | 0.999 | 0.865 | 0.397 | 0.937 | 1.000 | 0.2–0.39 | ||||||||
| Iγ | 0.928 | 0.960 | 0.630 | 0.999 | 0.927 | 1.000 | ||||||||
| AGDR | 0.942 | 0.959 | 0.607 | 1.000 | 0.940 | 0.999 | 1.000 | |||||||
| YEGD | 0.939 | 0.958 | 0.579 | 0.993 | 0.934 | 0.991 | 0.993 | 1.000 | ||||||
| ELCR | 0.946 | 0.955 | 0.600 | 0.998 | 0.944 | 0.997 | 0.999 | 0.992 | 1.000 | |||||
| RER | 1.000 | 0.866 | 0.401 | 0.939 | 0.999 | 0.928 | 0.942 | 0.939 | 0.946 | 1.000 | ||||
| IRC | 1.000 | 0.866 | 0.401 | 0.939 | 0.999 | 0.928 | 0.942 | 0.939 | 0.946 | 1.000 | 1.000 | |||
| IYEDRn | 1.000 | 0.866 | 0.400 | 0.939 | 0.999 | 0.928 | 0.942 | 0.938 | 0.945 | 1.000 | 1.000 | 1.000 |
Publisher’s Note: MDPI stays neutral with regard to jurisdictional claims in published maps and institutional affiliations. |
© 2021 by the authors. Licensee MDPI, Basel, Switzerland. This article is an open access article distributed under the terms and conditions of the Creative Commons Attribution (CC BY) license (https://creativecommons.org/licenses/by/4.0/).
Share and Cite
Sidique, E.; Elhaddad, M.A.; Abdelwahab, S.F.; El Hadek, H.H. Health Hazards Assessment and Geochemistry of ElSibai-Abu ElTiyur Granites, Central Eastern Desert, Egypt. Appl. Sci. 2021, 11, 12002. https://doi.org/10.3390/app112412002
Sidique E, Elhaddad MA, Abdelwahab SF, El Hadek HH. Health Hazards Assessment and Geochemistry of ElSibai-Abu ElTiyur Granites, Central Eastern Desert, Egypt. Applied Sciences. 2021; 11(24):12002. https://doi.org/10.3390/app112412002
Chicago/Turabian StyleSidique, Essam, Mervat A. Elhaddad, Sayed F. Abdelwahab, and Hany H. El Hadek. 2021. "Health Hazards Assessment and Geochemistry of ElSibai-Abu ElTiyur Granites, Central Eastern Desert, Egypt" Applied Sciences 11, no. 24: 12002. https://doi.org/10.3390/app112412002
APA StyleSidique, E., Elhaddad, M. A., Abdelwahab, S. F., & El Hadek, H. H. (2021). Health Hazards Assessment and Geochemistry of ElSibai-Abu ElTiyur Granites, Central Eastern Desert, Egypt. Applied Sciences, 11(24), 12002. https://doi.org/10.3390/app112412002