Article

BlocklyXR: An Interactive Extended Reality Toolkit for Digital Storytelling

1
Department of Educational Psychology and Leadership, Texas Tech University, Lubbock, TX 79409, USA
2
Department of Information Technology, University of Information and Communication Technology, Thai Nguyen 24000, Vietnam
*
Author to whom correspondence should be addressed.
Appl. Sci. 2021, 11(3), 1073; https://doi.org/10.3390/app11031073
Submission received: 11 January 2021 / Revised: 22 January 2021 / Accepted: 22 January 2021 / Published: 25 January 2021
(This article belongs to the Collection Virtual and Augmented Reality Systems)

Abstract

:
Traditional in-app virtual reality (VR)/augmented reality (AR) applications pose a challenge of reaching users due to their dependency on operating systems (Android, iOS). Besides, it is difficult for general users to create their own VR/AR applications and foster their creative ideas without advanced programming skills. This paper addresses these issues by proposing an interactive extended reality toolkit, named BlocklyXR. The objective of this research is to provide general users with a visual programming environment to build an extended reality application for digital storytelling. The contextual design was generated from real-world map data retrieved from Mapbox GL. ThreeJS was used for setting up, rendering 3D environments, and controlling animations. A block-based programming approach was adapted to let users design their own story. The capability of BlocklyXR was illustrated with a use case where users were able to replicate the existing PalmitoAR utilizing the block-based authoring toolkit with fewer efforts in programming. The technology acceptance model was used to evaluate the adoption and use of the interactive extended reality toolkit. The findings showed that visual design and task technology fit had significantly positive effects on user motivation factors (perceived ease of use and perceived usefulness). In turn, perceived usefulness had statistically significant and positive effects on intention to use, while there was no significant impact of perceived ease of use on intention to use. Study implications and future research directions are discussed.

1. Introduction

Virtual reality (VR) and augmented reality (AR) are emerging technologies that have attracted researchers from a wide variety of fields in recent years [1,2,3]. VR enables users to immerse themselves in a virtual environment that is isolated from the physical world [4], while AR supplements the real world with augmented information [5]. They have distinctive roles in helping users carry out certain tasks more efficiently. VR is often used for simulation and training when the actual content/scenario in the real world is expensive to design (e.g., visiting the inside of a volcano [6], practicing surgery and simulations [7], examining a new house design [8], engaging in disaster response training [9]) or impossible to recreate (e.g., ancient artifacts [10] or a military battle [11]). On the other hand, AR is more focused on providing contextual information (e.g., annotations [12]), presentations [13], mapping virtual objects with the physical world [14] (i.e., automatically situating an object on the targeted floor).
Integrated development environments (IDEs) and software are typically used to create VR/AR applications; these include Android Studio, XCode, and Unity3D [15]. Android Studio is dedicated to producing applications for Android devices, while XCode is used for Apple products. Unity3D can be considered as a general IDE that supports the proposed applications for both Android and iOS. These tools have many rich capabilities (or APIs) to utilize functionalities of the targeted operating system, such as camera, accelerator, motion, and device orientation, which provides huge opportunities in developing an AR/VR application. However, using these tools requires a high level of expertise from developers [15,16,17]. Part of the problem is due to the unstable nature of the operating system and the incompatible API version [18], meaning that the application will crash, stop working, or show black screen if the developed application is not built for the target device and the operating system version. As such, developers should pay attention to the features of the operating system for the device of interest. This kind of dependency on a specific target device poses big challenges for users who want to create VR/AR applications, especially when the applications are not compatible with their devices.
To alleviate the aforementioned issues, researchers have brought VR/AR to the web with programming tools such as ARtoolkit [19], ThreeJS [20], A-Frame [21], or BabylonJS [22]. These enable users to experience AR/VR regardless of the operating systems they are using. Web-based VR/AR have rapidly emerged over the years and their capabilities and applicability have been demonstrated in many studies [18,23,24,25,26]. The studies have focused on providing a web environment for VR/AR programming, as well as enhancing the usability with high fidelity and speeding up the rendering performance. For example, the Khronos Group aimed to speed up the web’s processing time by defining a new lightweight 3D model scheme (i.e., GLTF [27]) that is intended for the web environment. ThreeJS provides a library to set up and manipulate the virtual environment and A-Frame wraps up ThreeJS into components for users to shorten programming time in VR/AR creation. However, interactions in web-based VR/AR are still limited, which is partly due to the lack of input controls and accessibility to mobile device sensors from the browser. To handle this issue, web extended reality (or WebXR) has been introduced as a new mechanism that enables developers to gain access to mobile sensors, thus providing users with a huge opportunity to have the same experience as in-app applications. Although WebXR is still under development and experimental progress, developers can incorporate its testing features with the existing methods to develop an interactive extended reality application.
Unlike in-app VR/AR development, in which the IDE provides rich APIs available for use, creating a web-based VR/AR application is a challenging task for developers, especially for general users who have no formal training in computer science and computing-related fields. As such, there is a need to introduce a visual programming platform that can help general users (enthusiasts, instructors, artists, or kids) to develop a VR/AR application without advanced programming knowledge. To address this issue, some frameworks and tools have been provided (e.g., AR Scratch [28], CoSpace [29], and VEDILS [30]) that shift VR/AR creators from advanced programming skills to logical and computational thinking skills by utilizing visual programming tools. Using these tools, general users can create their own VR/AR applications by “dragging and dropping” the visual cues to the appropriate place to form a logical flow for the program. These tools are gaining in popularity, especially in the education sector, to inspire young learners in science, technology, engineering, and mathematics (STEM). However, these tools still suffer from creating dynamic spatial situated contents or imposing animations of 3D models in a given context. That is, a series of 3D models’ actions or animations are often defined in another software (e.g., Blender), which causes difficulties for users to use and manipulate/customize the animations. As such, it is warranted to find a way to manipulate/customize animations more efficiently in the browser to convey users’ ideas and stories. This paper introduces a novel web-based visual programming interface for creating an extended reality application, which enables general users to create a digital storytelling application with a block-based programming toolkit.

2. Motivation and Research Aim

Motivated by the new presence of WebXR and inspired by the existing work of Scratch and CoSpace, our aim with this research is to close the gap by providing developers, young learners, and enthusiasts with an interactive web environment in such a way that they can create their own extended reality applications more efficiently. To our best knowledge, there is no prior work in the literature focusing on this issue, which makes our work a unique contribution. To meet this goal, we propose a novel visual programming toolkit, namely BlocklyXR, that enables users to focus on designing a visual storytelling application rather than writing a piece of code intensively. The contributions of our research are as follows:
  • provide an interactive visual programming environment in which users can create a VR/AR application;
  • help users to examine their proposed WebXR with visual previewing content;
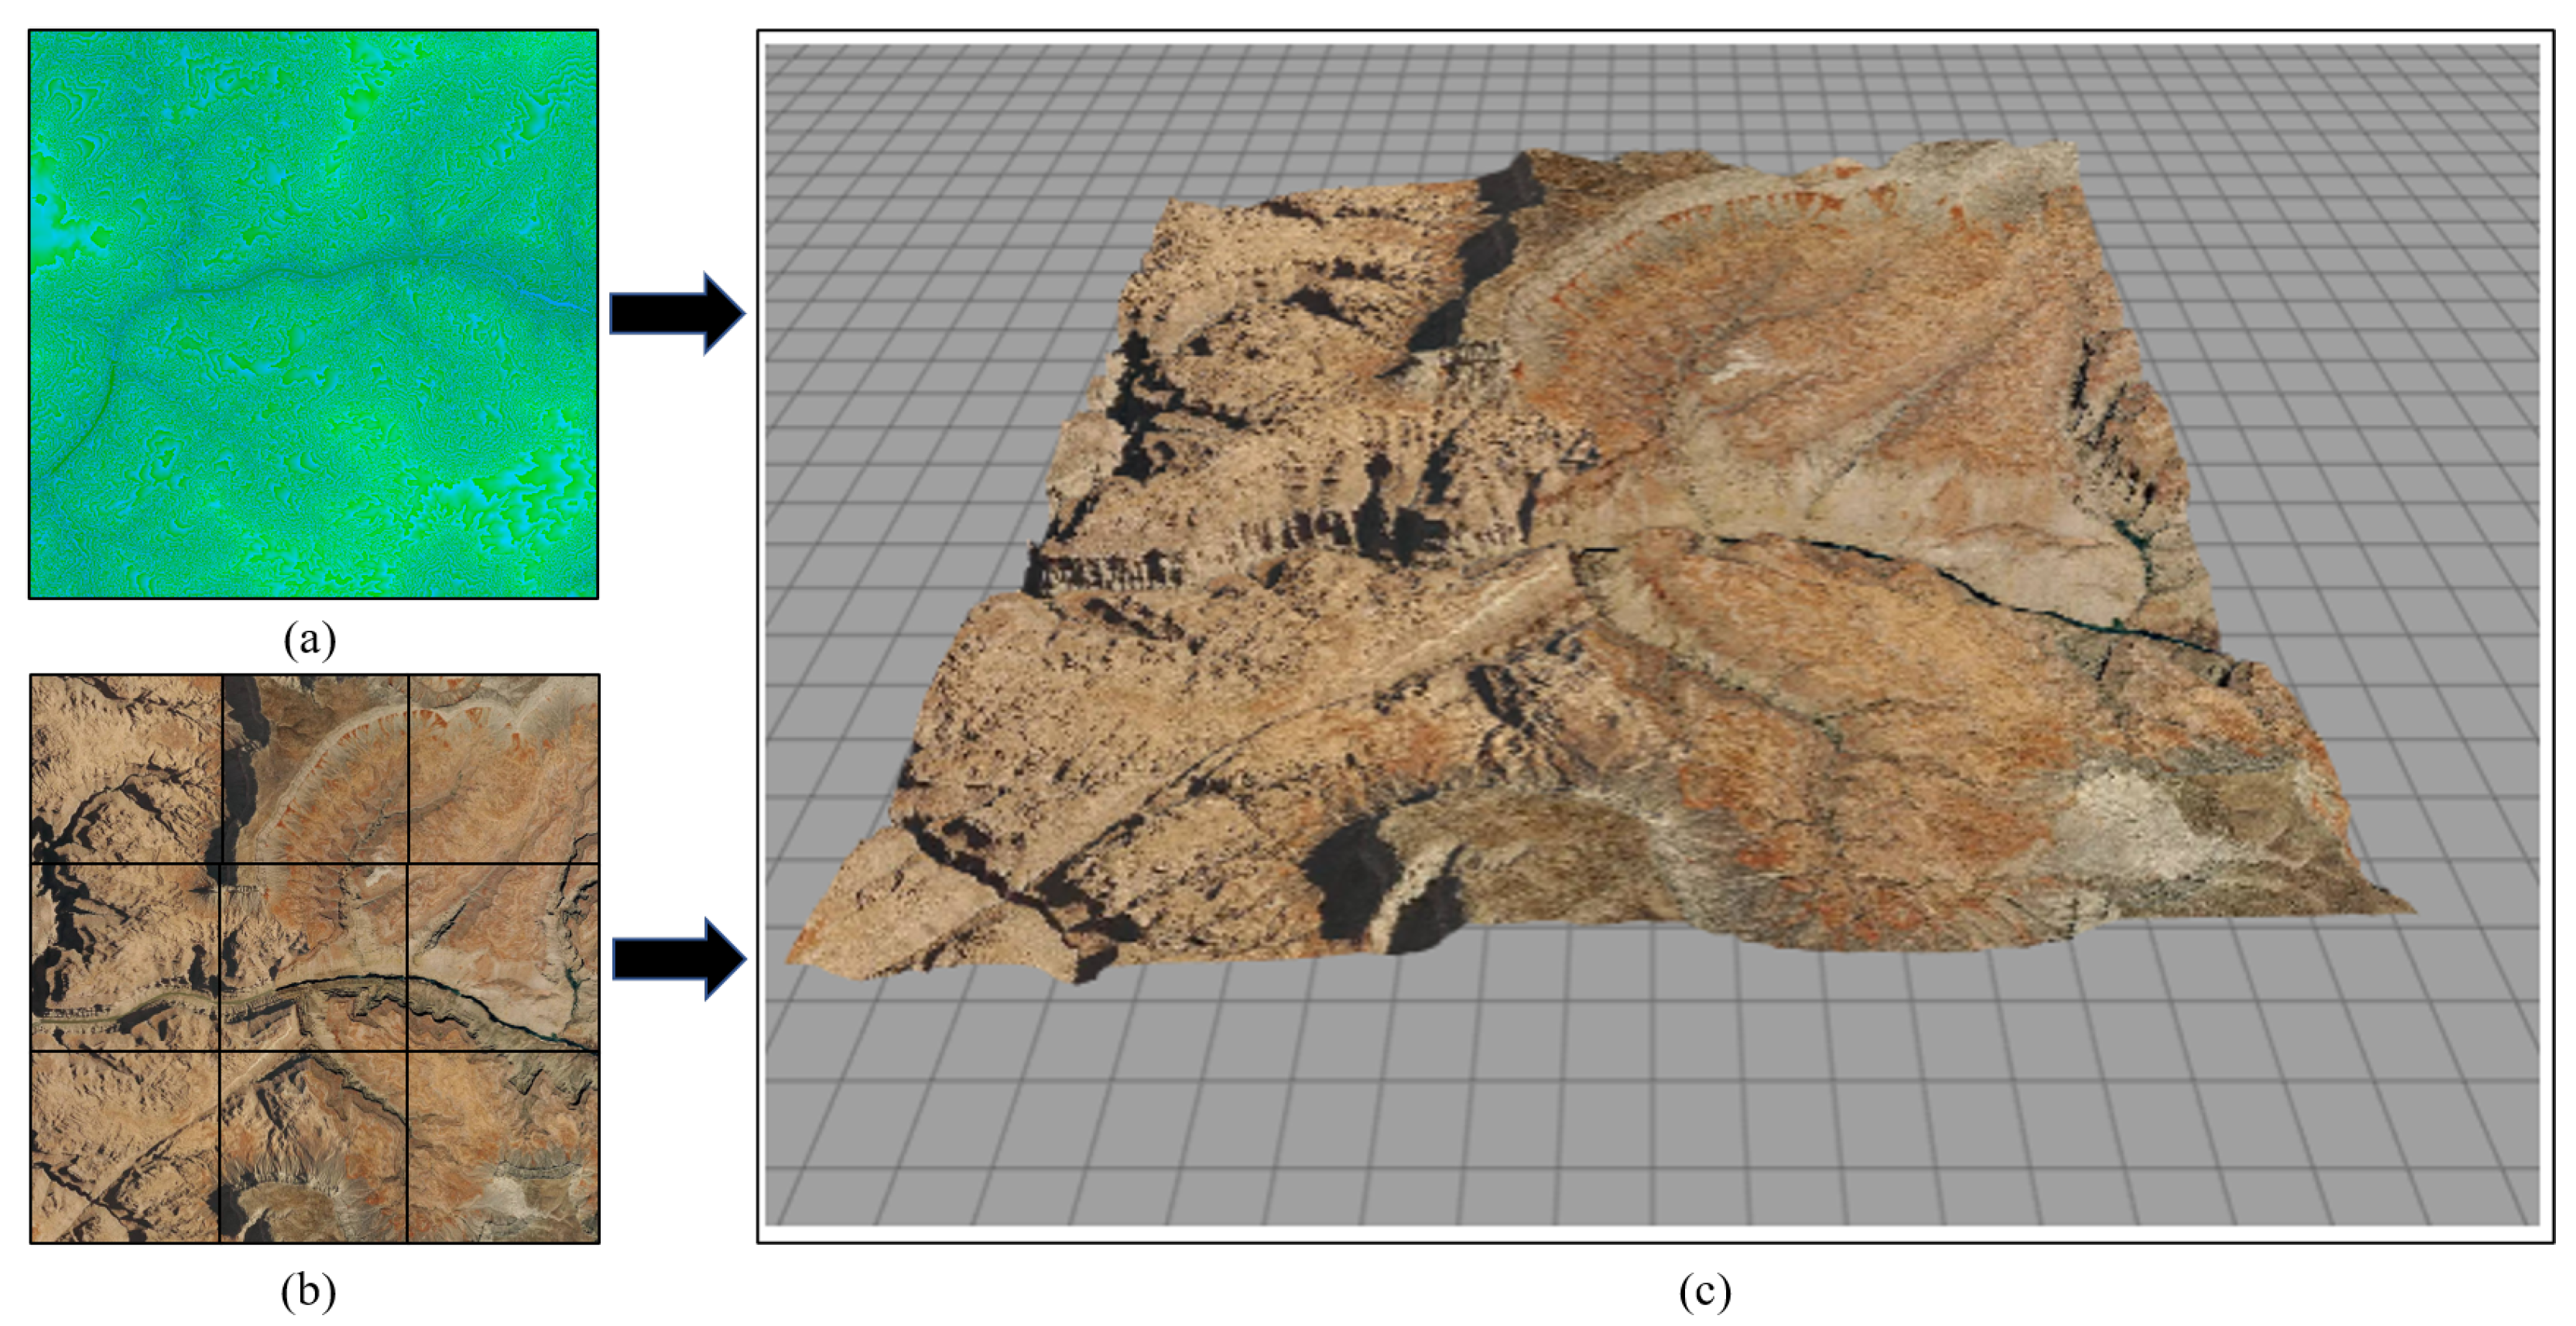
  • support generating WebXR storytelling applications by providing a real-world 3D map context;
  • enable users to control 3D animations in the WebXR application;
  • allow users to share their work with others through exporting the WebXR application;
  • demonstrate the applicability of BlocklyXR by recreating an existing AR application in geographic information science through the visual programming interface; and
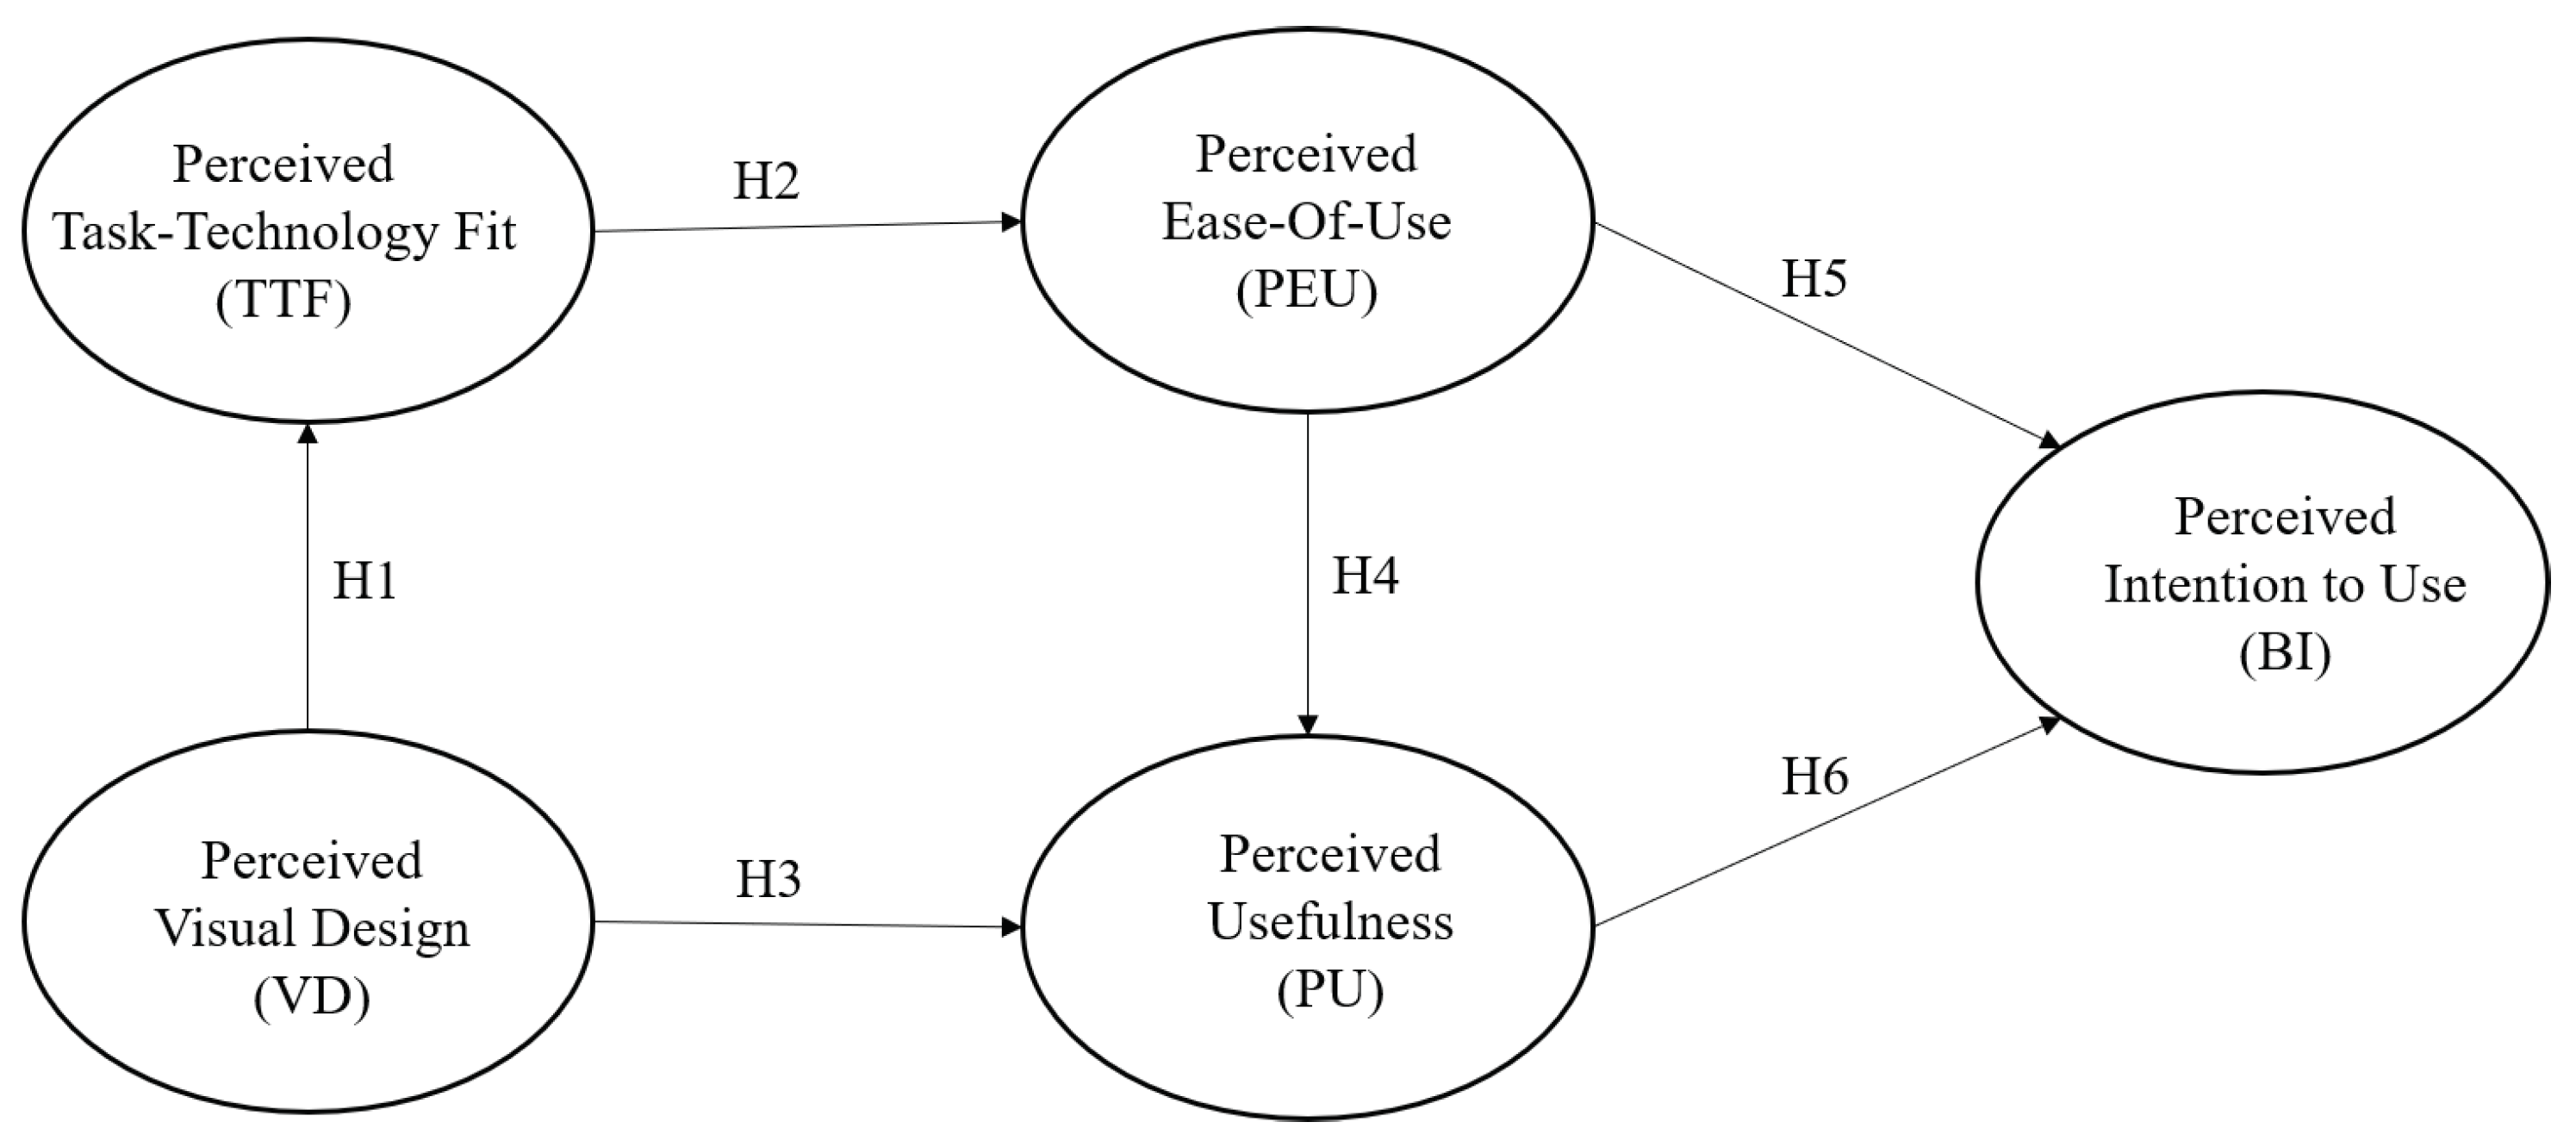
  • evaluate BlocklyXR toolkit using the technology acceptance model (TAM) with the following hypotheses:
    -
    Hypotheses 1 (H1).Perceived visual design positively influences perceived task technology fit.
    -
    Hypotheses 2 (H2).Perceived task technology fit positively influences perceived ease of use.
    -
    Hypotheses 3 (H3).Perceived visual design positively influences perceived usefulness.
    -
    Hypotheses 4 (H4).Perceived ease of use positively influences perceived usefulness.
    -
    Hypotheses 5 (H5).Perceived ease of use positively influences intention to use.
    -
    Hypotheses 6 (H6).Perceived usefulness positively influences intention to use.
The rest of this paper is organized as follows: Section 3 provides a review of existing research that is related to our research. Section 4 outlines the methods for developing our proposed block-based programming toolkit and portrays the tool’s design in detail. Section 5 assess the tool application using the technology acceptance model. A few challenging issues are discussed in Section 6. Our paper is concluded in Section 7.

3. Related Work

As WebXR is relatively new, its use in combination with visual programming is scarce in the literature. Thus, in this section, we briefly review similar work that used the same tool and techniques with our research. The use of block-based visual programming has been adapted in many different domains. Scratch [31] and MIT App Inventor [32] are the popular visual programming environments that enable users to drag and drop visual cues (also known as blocks) to form a logical program. The block-based paradigm was originally attributed to Google Blockly [33]. One notable feature of Blockly is that it can run in a web browser. As such, users can access the application without the need to install any required library. The visual cues in Blockly can be linked or stacked on top of each other to form a set of programming instructions (see example in Figure 1). The central value of Blockly is its ability to transform the visual cues into many different programming languages (e.g., PHP, JavaScript, Dart, Lua, Python).
The idea of utilizing a block-based paradigm was presented in the work of Radu and Blair [28], where the authors proposed an AR Scratch tool that enables kids to create applications that blend real and virtual environments. In their approach, the Scratch environment was customized and extended by offering an AR feature to the interface. The external library (i.e., ARToolkitPlus) was adapted for detecting and tracking markers’ position and orientation. When the markers were detected, pre-defined images were superimposed on top of the corresponding markers. The pilot study result demonstrated that young learners were very motivated, and frequently returned to interact with the toolkit even after the study was completed. A limitation noted by the authors was that the integration of 3D models was not taken into account in the current Scratch environment because of its complexity in specifying relationships and interactions among different 3D objects.
Mota et al. [30] created an in-app AR tool called Visual Environment for Designing Interactive Learning Scenarios (also known as VEDILS), mainly for Android users. The Vuforia [15] package was adapted for image detecting, tracking, and positioning 3D objects. Similar to Scratch, VEDILS took advantage of the Blockly library for generating visual blocks. However, it offers more rich features such as hand gesture sensors and electroencephalography (EEG) headsets.
In line with the previous research, Clarke [34] took a further step by extending VEDILS to be capable of working on iOS devices. In total, 20 augmented reality primitive components were defined as the basic 3D models for users to start with, including shapes such as box, capsule, cone, and sphere, as well as text and 3D models. To help users get familiar with the proposed tool, the author prepared a tutorial with instructions for the visual interface and its components. The pilot study result demonstrated that participants felt empowered by working with the proposed tool and were able to build their own AR applications using the proposed AR components. It was also noted that this tool faced the API incompatibility issue because it required iOS version 12+ to execute. Furthermore, the features and functionalities, such as animations and movements, have not been developed in the current version. Another line of research utilizing VEDILS was introduced by Ruiz-Rube et al. [35], where the researchers incorporated streaming data components for programming in the context of the Internet Of Things.
ARcadia [36] is another visual programming interface that utilizes a block-based paradigm for creating AR applications. It is an event-based programming architecture that allows a series of events (or actions) to be evoked depending on the status of the fiducial markers (e.g., visible or invisible). However, this toolkit has limited functionality in that it supports the on or off buttons only.
The idea most comparable to our work was presented by Nguyen et al. [37], where the authors utilized Blockly in conjunction with A-Frame [21] libraries in making an AR application. In their work, forty-three visual cues are transformed into A-Frame components. The toolkit can be considered as an abstraction of the A-Frame library. The proposed toolkit was demonstrated through a use case and evaluated by a user experience study. The study result showed positive feedback from the survey respondents on the usefulness and applicability of the toolkit. The authors also discussed several limitations and the main technical issue was the lack of WebXR support. However, their work requires a huge amount of effort to replicate in a similar setting in terms of web development.
Although there exist a number of tools, applications, and frameworks in the literature for creating VR/AR applications [38,39,40,41], we here focus on the adaptation of block-based programming language for producing general storytelling applications. To some extent, the aforementioned works faced the same issues as their predecessors in being deployed on a device with the lack of interactions in the AR environment or unstable marker detection and tracking. On the other hand, our toolkit eliminates requiring a printed marker, removes the issues with API incompatibility, and offers multiple interactions and animations of 3D models in the blended environment.

4. Materials and Methods

BlocklyXR was developed using different JavaScript libraries. Specifically, Blockly was used for setting up the visual programming interface and transcribing block into JavaScript, ThreeJS [20] was used for controlling animations and rendering 3D environments, Mapbox GL JS [42] was included for previewing the real-world map as well as retrieving elevation data for generating 3D terrain in VR/AR, and immersive WebXR [43] was adapted for accessing devices’ sensor motions and orientations, as well as for floor detection. A demonstration video of the proposed tool can be seen on YouTube [44].
The primary goal of BlocklyXR is to provide a visual programming environment in which general users can create their extended reality applications and share them with others. To meet this goal, we followed the design approach recommended by Munzner [45], which suggests that the requirements of the proposed application should be classified into tasks, then the visual design should be carried out to fulfill these tasks. The newly proposed BlocklyXR tool had the following tasks:
  • Task 1 (T1). Enable general users to create VR/AR applications with minimal effort.
  • Task 2 (T2). Support users to retrieve and generate real-world data.
  • Task 3 (T3). Allow users to examine and control 3D model animations.
  • Task 4 (T4). Enable users to test their coding scheme on the visual interface.
  • Task 5 (T5). Allow users to share VR/AR apps they have developed with others.
Based on the tasks laid out above, BlocklyXR was scratched with the following three primary components: (1) the design editor, (2) the preview component, and (3) the utility panel. Figure 2 illustrates the layout when users first use the tool. The following subsection will describe each component in detail.

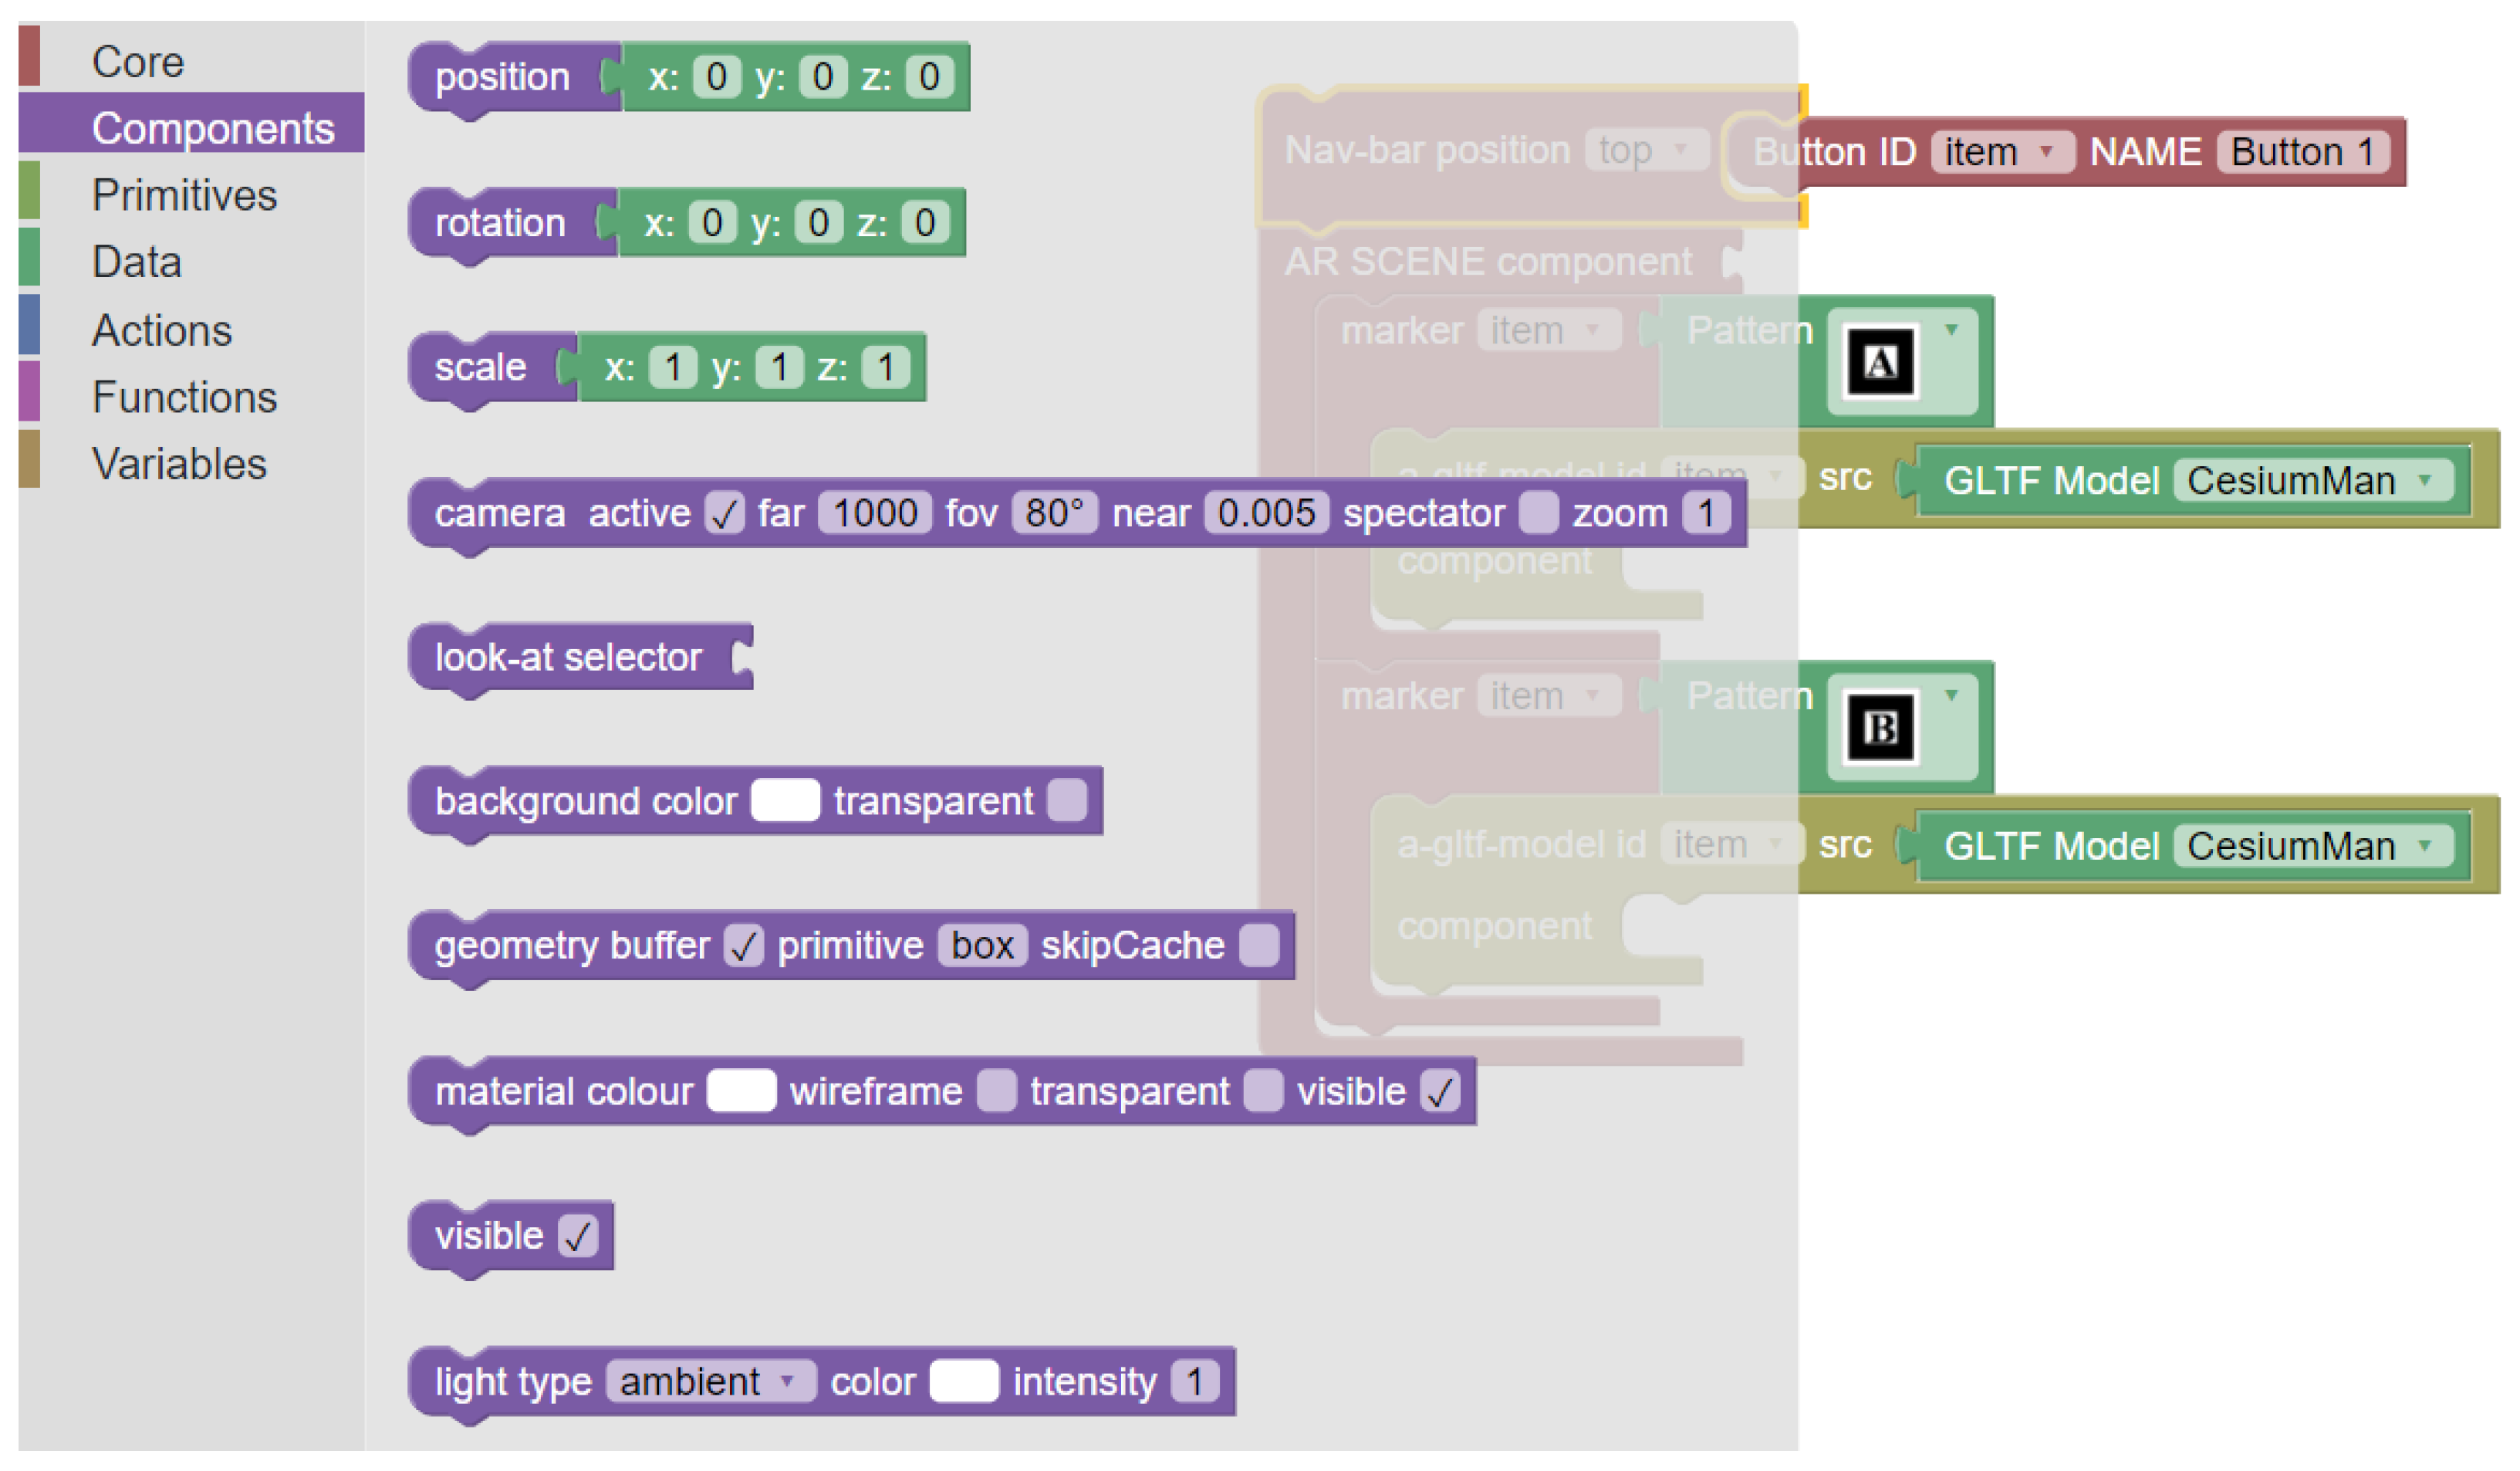
4.1. The Design Editor

The design editor consisted of two parts (as depicted in Figure 2B): (1) the real-world map panel and (2) the procedures editor. The objective of the first part was to enable users to start their storytelling with contextual information achieved from real-world map data (Task 2). From this map, users could search and select a point of interest; the selected point could be used either for rendering the 3D terrain model or as a reference point for positioning external 3D objects. Mapbox GL has a rich set of features that allow users to view the world from a different perspective, such as street, satellite, or even world, with 3D buildings; however, it does not support VR/AR features in the browser. Google Map and Google Earth can be considered as alternatives for VR experience, but they lack open source libraries/features available for developing AR. In other words, it is challenging to bring the entire 3D contents of Mapbox/Google Map to AR. Thus, we used only the Mapbox interface as a reference point and to acquire elevation data.
Figure 3 depicts the visual programming editor (Task 1) that was adopted from Blockly. Each block was defined based on ThreeJS‘ objects/features. For example, when users used the cube block with the attributes color, depth, height, and width, the translation to ThreeJs could be described as “var cube = new THREE.Mesh(new THREE.BoxBufferGeometry(width, height, depth), new THREE.MeshBasicMaterial(color: color))” or animation blocks were translated into animation mixer, and so on. Currently, BlocklyXR supported 37 blocks that defined the most commonly used objects, features, and animations in ThreeJS. Blocks were classified into six categories depending on the types of objects and features. For example, the components category included blocks that were attributed for general use such as lighting, material, camera, position, rotation, or scale, and the primitives category contains blocks that define 3D shapes such as ring, cube, cone, etc. The most interesting blocks belonged to the actions and functions categories, where users started creating a storytelling XR experience (Task 3). The blocks in these categories enabled them to perform a series of actions such as moving objects from one location to another (based on real-world latitude and longitude), controlling animations of objects during movement, or even displaying text and playing audio.

4.2. The Preview Component

Comparable to the stage area within the Scratch environment, where users could see the outcomes of the program execution, the preview component empowered users to experience their storytelling coding schemes in the 3D space (Task 4). Three inputs were taken in this component to render the scene: (a) a specific location on the map (latitude and longitude) for rendering the 3D terrain model, (b) an external 3D model (taken via the upload button), and (c) JavaScript code from the coding editor to control animations of the uploaded 3D object as well as positioning it on the 3D map. When users selected a point of interest on the map, a pop-up window appeared to supplement information (i.e., lat, lon) and show available functions (i.e., get point, generate terrain). Once the generated terrain was triggered, the lat, lon reference points were sent to the Mapbox server to retrieve remotely sensed data such as elevation data and satellite texture maps. The retrieved elevation data were encoded into an RGB image. We extracted the elevation data from the given image as follows:
h e i g h t = 10 , 000 + ( ( R 256 256 + G 256 + B ) 0.1 )
where −10,000 is the base value of elevation above sea level and 0.1 is the meter height increment that provides vertical precision necessary for cartographic and 3D applications [42]. Figure 4 illustrates our process for generating a 3D terrain model (Task 4).

4.3. The Utility Component
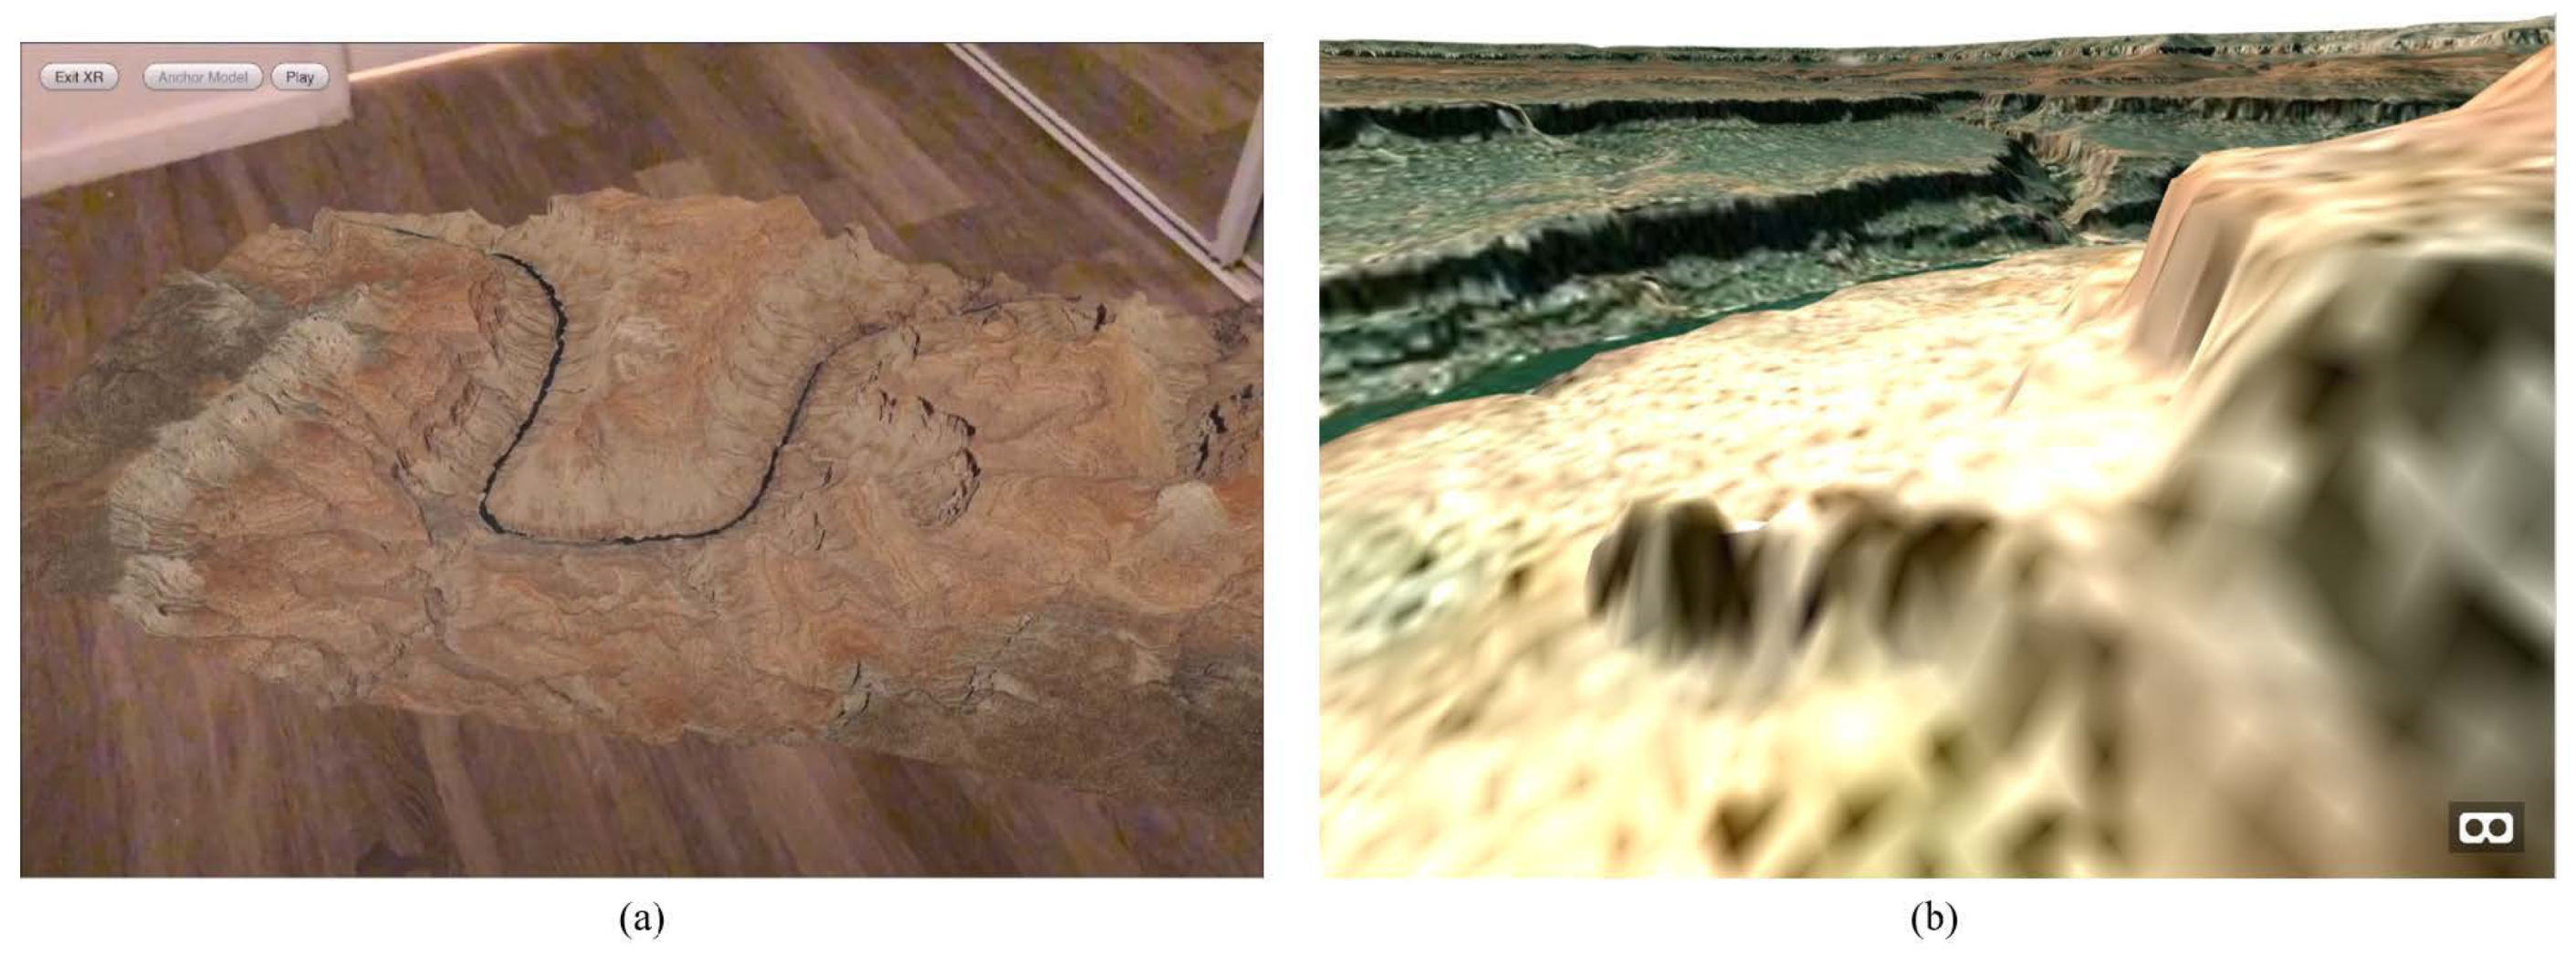
While the preview component allowed users to see the thumbnail version of the developing AR/VR application, the utility component enabled them to experience VR/AR with their actual handheld devices. The application could be exported to either WebVR or WebXR. With WebVR, users could view their developed storytelling content from the first-person view (with a Google Cardboard headset), or the third-person view (using a keyboard or touch controls to move around the scene). The WebXR option enabled users to look at the 3D content through their device’s camera. Users could point their camera into the floor to search for a flat surface. Once the floor was detected by WebXR, the developed XR application was superimposed on the physical world. Users were then able to move around and look at the scene from different perspectives. The layouts for VR and XR are demonstrated in Figure 5 (Task 5), where users could upload to a repository and share with others.

4.4. A Use Case

This section portrays a use case where users could reproduce the existing application in geographic information science by using BlocklyXR. The setting of this study was retrieved from the work of Jung et al. [13,46], where the authors recreated the historic battle of Palmito Ranch in Texas on 12–13 May 1865. This work also utilized A-Frame and AR.js to make a 3D environment and superimpose virtual objects on the markers, respectively. We chose this work for our study because the AR application had animations and the moving elements of 3D objects within the scene. We did not bring other work into consideration if the task simply showed the information. In spite of the fact that the AR app (PalmitoAR) can fulfill the tasks the authors laid out, it was written in pure JavaScript and hence required a tremendous amount of work to control every action and animation in the scene. The PalmitoAR defined eight stages to be simulated and we transcribed one stage into the action blocks as follows (the next stages were almost the same as the previous ones): The Union army started moving from White Ranch toward Palmito to assault the Confederate army—play audio, display a message, move the Union 3D models from a marker to another marker, set animation of the Union models to “walking.” When the Union wrapped up moving, set animation of the Union and Confederacy to “attack,” play audio ”attack”.
Based on the perceptual conversation above, we could drag and drop the corresponding blocks at their appropriate positions. Figure 6a illustrates the set of block instructions. The process of constructing 3D models for the WebXR application can be briefly described as follows: first, we used Adobe Fuse to build the basic shape of the characters including body, clothes and shoes. The resulting model was exported in the .fbx format. Second, we used Blender software to optimize and customize the model such as adding gun, sword or modify some textures. Third, we used Mixamo-a free online character animation tool-to generate each animation for the model. Fourth, these separated model animations (i.e., walking, running, firing, standing and idle) were combined into a single 3D character in Blender. The combined model was exported in GLB format. Figure 7 illustrates the process of constructing animated character ready for WebXR.
When running the extended VR/AR application based on the instructions we created, our result could yield the same quality as the original version of PalmitoAR (as depicted in Figure 6b).

4.5. Evaluation

The technology acceptance model [47] was adapted to evaluate the technology adoption of BlocklyXR in our work. The TAM has been most commonly used to describe use intentions and actual technology use with several extensions [48,49]. Perceived usefulness and perceived ease of use are considered the most important factors in the TAM that directly or indirectly explain the outcomes (intention to use, actual technology use). In the extended TAM [50,51] the construct of task technology fit was integrated into the original TAM model to investigate whether it has a positive effect on the key variables of user motivation (perceived usefulness and perceived ease of use). The model asserted that the proposed technology must be utilized and fitted with the tasks it underpins to achieve significant impacts on users’ performance. Visual design is another construct utilized to examine whether a layout will have impact on the customers’ retention through growing trust and loyalty [52]. Verhagen et al. [53] pointed out that this variable has a positive effect on perceived usefulness. In our study, we used the extended TAM model with two external factors (task technology fit and visual design).

4.6. Research Model

The extended TAM model considered the following hypotheses for the technical adoption of BlocklyXR: perceived visual design has a positive effect on perceived task technology fit (H1), perceived task technology fit has a positive effect on perceived ease of use (H2), perceived visual design has a positive effect on perceived usefulness (H3), perceived ease of use has a positive effect on perceived usefulness (H4), perceived ease of use has a positive effect on intention to use (H5), and perceived usefulness has a positive effect on intention to use (H6). The proposed hypotheses were converted into the research model as depicted in Figure 8, where each set of ellipses represents a construct in the extended TAM and arrows represents the hypotheses from 1 to 6.

4.7. Data Collection and Analysis

The Amazon Mechanical Turk (AMT) was utilized for data collection with Google Form as an online survey instrument. Our study was affirmed by the university‘s Institutional Review Board to recruit participants to take part in the survey. The survey was comprised of three parts: (a) a YouTube video that subjects were required to watch, (b) 20 Likert-type questions for viewpoints and one open-ended question for comments/suggestions, and (c) four questions to gather demographic information. In the first part, subjects were asked to watch a demo application of our proposed toolkit on YouTube [44]. After watching the video, participants were asked to answer to questions about their attitudes, comments, and behavioral intention to use BlocklyXR with 5-point Likert scales (“strongly disagree (1)” to “strongly agree (5)”) and one open-ended question. Table 1 appears the set of items used to measure each construct. The final part inquired subjects to provide general information such as gender, English as a first language, age, and ethnicity. We had a response of 82 participants from Amazon Mechanical Turk. Data were cleaned by removing meaningless responses. After that, we had 73 respondents as valid cases for analysis. Table 2 presents descriptive statistics of participants‘ demographic information: 73.97% of the participants were male, 73.97% of the subjects reported English as a first language, and their ages ranged from 23 to 55 (mean = 35.3). A majority of the participants were Asian (57.53%), 30.14% were Caucasian, 5.48% were African American/Black, 2.74% were American Indian/Alaska Native, and 2.74% were Hispanic.
Generalized structured component analysis (GSCA) [56,57,58] was conducted to evaluate the proposed research model. GSCA is an approach to component-based structural equation modeling and works well with a small sample size without requiring rigid distributional assumptions such as multivariate normality [59,60,61]. Web-based software for GSCA was used for the analysis, available online at [62].

5. Results

5.1. Qualitative Analysis

Overall, we positive feedback from the participants on BlocklyXR’s usefulness and applicability, as well as ease of use and capability. Along with the positive comments, we also received constructive feedback for improvements such as presenting more detailed explanations on the features of BlocklyXR–“More detailed tutorials may be needed”; “I found that the elements of the toolkit (component, primitives, data, etc.) have not been properly introduced. This is important as you are positioning this toolkit to be used by people with little or no programming expertise”; and “needs to explain it better for beginners using step-by-step instructions.” In terms of introducing 3D models with animation into the scene, S31 stated that the toolkit “need[s] improvement in the characters. They are not attractive” and “There could be more varied animations or characters to choose from.” To address this issue, realistic and appealing 3D models might be utilized for demonstration. The BlocklyXR video also needed to be improved, as indicated by S45: “If duration of video time can [be] more than 3 min, it will be better” and “I think maybe more instructions or sub-sessions of the video to explain various aspects of the tool might be helpful.” We acknowledge that it is necessary to keep improving the tutorial video for general users with more detailed instructions.

5.2. Quantitative Analysis

Table 3 shows the descriptive statistics for the items of the constructs. It can be seen from the table that all the means of the TAM‘s measures were above the average point of 3, and the standard deviations ranged from 0.466 to 1.281.
Table 4 presents the measures for internal consistency and convergent validity for each construct. Dillon–Goldstein‘s rho was utilized to evaluate the internal consistency reliability criterion for each construct. All the values ranging from 0.790 to 0.925 were greater than 0.7, thereby exceeding the reliability estimate recommended in [56]. We also assessed the average variance extracted (AVE) value of each latent variable to check convergent validity. All AVE values ranging from 0.561 to 0.856 were greater than 0.5, indicating a reasonable convergent validity [56].
Table 5 provides the loading estimates for the items in company with their standard errors (SEs) and 95% bootstrap percentile confidence intervals (CIs) with the lower bounds (LB) and the upper bounds (UB). The CIs were calculated utilizing 100 bootstrap samples. For interpretation, a parameter estimate was assumed to be statistically significant at 0.05 alpha level if the 95% CI did not include the value of zero. The results showed that all the loading estimates were statistically significant, indicating that all those items were good indicators of the constructs.
The hypothesized model showed an overall goodness of fit index in GSCA (FIT) value of 0.596, indicating that the model accounted for 59.6% of the total variance of all the items and their corresponding constructs. Table 6 provides the estimates of path coefficients in the structural model along with their SEs and 95% CIs. The results showed that visual design had statistically significant and positive impact on task technology fit (H1 = 0.715, SE = 0.064, 95% CI = 0.616–0.831). In turn, task technology fit had a statistically significant and positive influence on perceived ease-of-use (H2 = 0.597, SE = 0.109, 95% CI = 0.340–0.767). Visual design also had statistically significant and positive impact on perceived usefulness (H3 = 0.492, SE = 0.118, 95% CI = 0.215–0.656). Moreover, perceived ease of use had statistically significant and positive effect on perceived usefulness (H4 = 0.319, SE = 0.120, 95% CI = 0.094–0.560), and perceived usefulness had statistically significant and positive effect on intention to use (H6 = 0.604, SE = 0.140, 95% CI = 0.317–0.856). However, hypothesis H5 (perceived ease of use → intention to use) was not supported due to the presence of zero values in CIs.

6. Discussion

Our findings for the user experience study indicated that the hypothesized directional relationships among the constructs (research hypotheses) in the structural model were supported, except the non-significant effect of perceived ease of use on intention to use. The findings are in accordance with the previous literature on VR/AR applications [63,64,65] in that perceived usefulness as utilitarian value has a dominant effect on intention to use, while perceived ease of use as hedonic value is secondary and mediated by perceived usefulness. Notably, the decisive impact of perceived usefulness on intention to use implies that BlocklyXR generates “utilitarian benefits” such as functional, instrumental, and practical benefits, rather than “hedonic benefits” like aesthetic, experiential, and enjoyment-related factors [65].
Our user experience study has several limitations that should be addressed in future research. The first limitation involves the procedure to collect users‘ responses. This was due to the COVID-19 pandemic, which prevented us from conducting the study in a face-to-face fashion. Participants were not able to use the toolkit directly at their own pace, which may have reduced the motivation to take part in the study. As such, more rigorous user studies would be needed to evaluate the use and acceptance of BlocklyXR, which would provide more reliable and valid responses. Second, the demo video used in the study presented only an overview of the toolkit. Thus, a more detailed explanation of the features of the toolkit would be needed with a series of tutorial videos. Last, we might consider other factors contributing to the adoption and use of technology in future studies. It would be particularly interesting to utilize the extended unified theory of acceptance and use of technology [66,67]. That is, it would extend the TAM used in this study by assessing the impacts of performance expectancy, effort expectancy, social influence, facilitating conditions, hedonic motivation, price value, and habit on the technology adoption and use, considering the moderating effects of participants’ individual differences (age, gender, and experience) on relationship among the constructs.
During the development of BlocklyXR, we encountered several technical challenges to be considered in future research. First, we used the open Mapbox API to get the remotely sensed data such as elevation and the corresponding textures. Yet there exist many different frameworks that provide similar features, e.g., Google Map Platform [68], OpenStreetMap [69], and Cesium [70]. Some of these services even offer 3D views of the environment with satellite images and 3D buildings [42,70]. These rich features can be used in conjunction with head-mounted display devices, allowing users to experience the real world in a virtual reality environment. Developers can also utilize these services to build their own AR applications by customizing some 3D components, e.g., enhancing the texture of the building to create TableTop AR [71], or adding new 3D models to the map for 3D storytelling or simulation [26]. However, existing applications often depend on either a well-supported API library/package attributed to only some IDEs (Android Studio, XCode, Unity) or their own method to render the 3D environment, which makes it difficult to integrate them into a single system. From our point of view, the use of geographical data for VR is quite mature now, at least to some extent from developers’ perspectives because the spatial components in VR can be manipulated, and thus interactions are controllable. When it comes to AR development, there are still some issues that should be taken into account, such as the lighting conditions, the quality of the images captured by the camera, or the power of the machine learning models that are capable of sensing and extracting as much information as possible from the surrounding environment (e.g., object registration, lighting estimation, distance estimation, flat surface detection, object recognition, pose estimation), and the relationship formed either between the physical world and the virtual environment or among multiple virtual spaces and the real world. As such, it is challenging for AR developers to handle all of these issues at the same time, especially for the AR web developers where supported libraries are still in the development/migration process from well-developed packages. This is part of the reason why we started our toolkit from scratch, or manually generated the terrains from elevation data.
Second, we point out that there are two different types of coordinate reference systems: geographic coordinate systems (GCSs) and projected coordinate systems (PCSs) [72]. While the former refers to coordinate systems that span the entire globe (e.g., latitude/longitude), the latter is localized to minimize visual distortion in a particular region. For our proposed toolkit, we are interested in a specific region where a particular event takes place, so PCS is the preferable choice. In addition, the utility of elevation data for building a heightmap is another reason to select PCS over GCS due to its visibility for users to avoid distortion. On the other hand, GCS could be used in our toolkit when there is a need to extend digital storytelling to a global scale (e.g., flight simulation, disease spread, World Wars I or II simulation). Further research is warranted to investigate the use of GCS and its feasibility for BlocklyXR.
Third, we emphasize the usefulness of our toolkit as a web-based interface for extended reality programming. Applications and frameworks have gradually shifted from offline to online over the past decade. Popular applications such as Microsoft Office, Adobe, and design tools have all migrated to the web, eliminating the need for users to install them locally. Web-based tools do not offer a full array of features compared to installed versions, but they still have their unique place, as does our toolkit. The most challenging part is how to evaluate the tool without the risk of exposing the intellectual property (or source code and materials) before releasing it. A client-server framework can be a solution but it requires migration as well as hosting/setting up a server. In this regard, WebAssembly [73] could be a promising solution because this emerging framework provides a sandbox that enclaves coding in an isolated environment; thus it can both protect users from malicious programs and prevent unauthorized users from accessing the codes. We expect that over the coming years, when face-to-face encounters are still restricted, research could explore tools/techniques that can overcome the above issue.
Last, our toolkit does not support functions or models that are not available in the ThreeJS libraries, since the mechanism of our toolkit works by translating visual cues to ThreeJS‘s codes. However, we think that these provided functions are adequate for general users whose jobs call for creating non-complicated VR/XR applications.

7. Conclusions

This paper presented BlocklyXR, a novel web-based visual programming interface for creating an extended reality application. By integrating ThreeJS and XR library into Blockly, BlocklyXR enables general users to create a digital storytelling application with a block-based programming toolkit. The newly developed toolkit can be generalized and extended to many different domains for digital storytelling with supported animation 3D models. Following this approach, users can download free 3D models on the internet [74], then apply animation to them through intermediate tools such as Mixamo and Blender, which are described in detail by Jung et al. [13]. BlocklyXR would pave the way for many potential applications where streaming and aggregated data from sensors reside in a host server. The data can be retrieved, processed, and transformed into a meaningful graphical representation, then integrated with the projected map. Applications in related fields may include cultural heritage [75,76], archaeology [77], geovisualization [78], and tourism [79]. As described in the use case section on technical development, we illustrated the capability of BlocklyXR with a use case where we were able to replicate the existing PalmitoAR utilizing the block-based authoring toolkit with fewer efforts in programming. Participants in the user experience study provided positive feedback, indicating that BlocklyXR would be useful in learning visual programming and creating an extended reality application, particularly for new learners and K-12 students. The findings on the technology adoption of BlocklyXR using the extended TAM showed that visual design and task technology fit had significantly positive effects on user motivation factors (perceived ease of use and perceived usefulness). In turn, perceived usefulness had statistically significant and positive effects on intention to use. However, there was no significant impact of perceived ease of use on intention to use. This may imply that when using the interactive extended reality toolkit, users are more focused on the utilitarian value (i.e., functional, instrumental, and practical benefits) of the medium than the hedonic value (i.e., experiential, pleasure-oriented benefits) [65,80]. A large-scale user experience study would be warranted to further investigate the technical adoption and use of BlocklyXR.

Author Contributions

Conceptualization, V.T.N., K.J. and J.L.; data curation, V.T.N. and K.J.; formal analysis, K.J. and V.T.N.; funding acquisition, K.J. and J.L.; investigation, V.T.N. and K.J.; methodology, V.T.N. and K.J.; project administration, K.J. and J.L.; resources, V.T.N. and K.J.; software, V.T.N. and K.J.; supervision, K.J.; validation, V.T.N. and K.J.; visualization, K.J. and V.T.N.; writing—original draft, V.T.N. and K.J.; writing—review and editing, V.T.N., K.J. and J.L. All authors have read and agreed to the published version of the manuscript.

Funding

This work was partially supported by a Texas Tech College of Education Competitive Edge Grant.

Institutional Review Board Statement

The study was conducted according to the guidelines of the Declaration of Helsinki, and approved by the Institutional Review Board of Texas Tech University (IRB2020-444).

Informed Consent Statement

Informed consent was obtained from all subjects involved in the study.

Data Availability Statement

The data presented in this study are available on request from the corresponding author.

Conflicts of Interest

The authors declare no conflict of interest.

References

  1. Arnaldi, B.; Guitton, P.; Moreau, G. Virtual Reality and Augmented Reality: Myths and Realities; John Wiley & Sons: Hoboken, NJ, USA, 2018. [Google Scholar]
  2. Ong, S.K.; Nee, A.Y.C. Virtual and Augmented Reality Applications in Manufacturing; Springer Science & Business Media: Berlin/Heidelberg, Germany, 2013. [Google Scholar]
  3. Kim, Y.; Kim, H.; Kim, Y.O. Virtual reality and augmented reality in plastic surgery: A review. Arch. Plast. Surg. 2017, 44, 179. [Google Scholar] [CrossRef] [PubMed] [Green Version]
  4. Sherman, W.R.; Craig, A.B. Understanding Virtual Reality; Morgan Kauffman: San Francisco, CA, USA, 2003. [Google Scholar]
  5. Carmigniani, J.; Furht, B.; Anisetti, M.; Ceravolo, P.; Damiani, E.; Ivkovic, M. Augmented reality technologies, systems and applications. Multimed. Tools Appl. 2011, 51, 341–377. [Google Scholar] [CrossRef]
  6. Zhao, J.; LaFemina, P.; Wallgrün, J.O.; Oprean, D.; Klippel, A. iVR for the geosciences. In Proceedings of the 2017 IEEE Virtual Reality Workshop on K-12 Embodied Learning through Virtual & Augmented Reality (KELVAR), Los Angeles, CA, USA, 19 March 2017; pp. 1–6. [Google Scholar]
  7. Moody, L.; Waterworth, A.; McCarthy, A.D.; Harley, P.J.; Smallwood, R.H. The feasibility of a mixed reality surgical training environment. Virtual Real. 2008, 12, 77–86. [Google Scholar] [CrossRef]
  8. Xie, Y. Application of the Architectural Animation Virtual Technology in the Landscape Architecture Design. Cyber Secur. Intell. Anal. 2019, 928, 339. [Google Scholar]
  9. Sharma, S.; Devreaux, P.; Scribner, D.; Grynovicki, J.; Grazaitis, P. Megacity: A Collaborative Virtual Reality Environment for Emergency Response, Training, and Decision Making. Electron. Imaging 2017, 2017, 70–77. [Google Scholar] [CrossRef]
  10. Stanco, F.; Tanasi, D.; Allegra, D.; Milotta, F.L.M.; Lamagna, G.; Monterosso, G. Virtual anastylosis of Greek sculpture as museum policy for public outreach and cognitive accessibility. J. Electron. Imaging 2017, 26, 011025. [Google Scholar] [CrossRef] [Green Version]
  11. Liu, X.; Zhang, J.; Hou, G.; Wang, Z. Virtual reality and its application in military. In IOP Conference Series: Earth and Environmental Science; IOP Publishing: Bristol, UK, 2018; Volume 170, p. 032155. [Google Scholar]
  12. Bruno, F.; Barbieri, L.; Marino, E.; Muzzupappa, M.; D’Oriano, L.; Colacino, B. An augmented reality tool to detect and annotate design variations in an Industry 4.0 approach. Int. J. Adv. Manuf. Technol. 2019, 105, 875–887. [Google Scholar] [CrossRef]
  13. Jung, K.; Nguyen, V.T.; Yoo, S.C.; Kim, S.; Park, S.; Currie, M. PalmitoAR: The Last Battle of the US Civil War Reenacted Using Augmented Reality. ISPRS Int. J. Geo-Inf. 2020, 9, 75. [Google Scholar] [CrossRef] [Green Version]
  14. Norouzi, N.; Bruder, G.; Belna, B.; Mutter, S.; Turgut, D.; Welch, G. A systematic review of the convergence of augmented reality, intelligent virtual agents, and the internet of things. In Artificial Intelligence in IoT; Springer: Berlin/Heidelberg, Germany, 2019; pp. 1–24. [Google Scholar]
  15. Linowes, J.; Babilinski, K. Augmented Reality for Developers: Build Practical Augmented Reality Applications with Unity, ARCore, ARKit, and Vuforia; Packt Publishing Ltd.: Birmingham, UK, 2017. [Google Scholar]
  16. Bernardes, S.; Madden, M.; Knight, A.; Neel, N.; Morgan, N.; Cameron, K.; Knox, J. A multi-component system for data acquisition and visualization in the geosciences based on uavs, augmented and virtual reality. Int. Arch. Photogramm. Remote Sens. Spat. Inf. Sci. 2018, XLII-4, 45–49. [Google Scholar] [CrossRef]
  17. Gavish, N.; Gutiérrez, T.; Webel, S.; Rodríguez, J.; Peveri, M.; Bockholt, U.; Tecchia, F. Evaluating virtual reality and augmented reality training for industrial maintenance and assembly tasks. Interact. Learn. Environ. 2015, 23, 778–798. [Google Scholar] [CrossRef]
  18. Nguyen, V.T.; Hite, R.; Dang, T. Learners’ technological acceptance of vr content development: A sequential 3-part use case study of diverse post-secondary students. Int. J. Semant. Comput. 2019, 13, 343–366. [Google Scholar] [CrossRef]
  19. Kato, H. ARToolKit: Library for Vision-Based augmented reality. IEICE PRMU 2002, 6, 2. [Google Scholar]
  20. Danchilla, B. Three.js framework. In Beginning WebGL for HTML5; Springer: Berlin/Heidelberg, Germany, 2012; pp. 173–203. [Google Scholar]
  21. Mozilla. A Web Framework for Building Virtual Reality Experiences. 2019. Available online: https://aframe.io (accessed on 23 January 2020).
  22. Moreau-Mathis, J. Babylon. js Essentials; Packt Publishing Ltd.: Birmingham, UK, 2016. [Google Scholar]
  23. Nguyen, V.T.; Hite, R.; Dang, T. Web-Based Virtual Reality Development in Classroom: From Learner’s Perspectives. In Proceedings of the 2018 IEEE International Conference on Artificial Intelligence and Virtual Reality (AIVR), Taichung, Taiwan, 10–12 December 2018; pp. 11–18. [Google Scholar] [CrossRef]
  24. Nguyen, V.T.; Jung, K.; Dang, T. Creating Virtual Reality and Augmented Reality Development in Classroom: Is it a Hype? In Proceedings of the 2019 IEEE International Conference on Artificial Intelligence and Virtual Reality (AIVR), San Diego, CA, USA, 9–11 December 2019; pp. 212–2125. [Google Scholar]
  25. Nguyen, V.T.; Zhang, Y.; Jung, K.; Xing, W.; Dang, T. VRASP: A Virtual Reality Environment for Learning Answer Set Programming. In International Symposium on Practical Aspects of Declarative Languages; Springer: Berlin/Heidelberg, Germany, 2020; pp. 82–91. [Google Scholar]
  26. Jung, K.; Nguyen, V.T.; Diana, P.; Seung-Chul, Y. Meet the Virtual Jeju Dol Harubang—The Mixed VR/AR Application for Cultural Immersion in Korea’s Main Heritage. ISPRS Int. J. Geo-Inf. 2020, 9, 367. [Google Scholar] [CrossRef]
  27. Robinet, F.; Arnaud, R.; Parisi, T.; Cozzi, P. gltf: Designing an open-standard runtime asset format. GPU Pro 2014, 5, 375–392. [Google Scholar]
  28. Radu, I.; MacIntyre, B. Augmented-reality scratch: A children’s authoring environment for augmented-reality experiences. In Proceedings of the 8th International Conference on Interaction Design and Children, Como, Italy, 3–5 June 2009; pp. 210–213. [Google Scholar]
  29. CoSpaces. Make AR & VR in the Classroom. 2020. Available online: https://cospaces.io/edu/ (accessed on 5 April 2020).
  30. Mota, J.M.; Ruiz-Rube, I.; Dodero, J.M.; Arnedillo-Sánchez, I. Augmented reality mobile app development for all. Comput. Electr. Eng. 2018, 65, 250–260. [Google Scholar] [CrossRef]
  31. Resnick, M.; Maloney, J.; Monroy-Hernández, A.; Rusk, N.; Eastmond, E.; Brennan, K.; Millner, A.; Rosenbaum, E.; Silver, J.; Silverman, B.; et al. Scratch: Programming for all. Commun. ACM 2009, 52, 60–67. [Google Scholar] [CrossRef]
  32. Massachusetts Institute of Technology. MIT App Inventor. 2020. Available online: http://appinventor.mit.edu/ (accessed on 19 June 2020).
  33. Inc, G. Blockly: A JavaScript Library for Building Visual Programming Editors. 2020. Available online: https://developers.google.com/blockly (accessed on 5 April 2020).
  34. Clarke, N.I. Through the Screen and into the World: Augmented Reality Components with MIT App Inventor. Ph.D. Thesis, Massachusetts Institute of Technology, Cambridge, MA, USA, 2019. [Google Scholar]
  35. Ruiz-Rube, I.; Mota, J.M.; Person, T.; Corral, J.M.R.; Dodero, J.M. Block-based development of mobile learning experiences for the Internet of Things. Sensors 2019, 19, 5467. [Google Scholar] [CrossRef] [PubMed] [Green Version]
  36. Kelly, A.; Shapiro, R.B.; de Halleux, J.; Ball, T. ARcadia: A rapid prototyping platform for real-time tangible interfaces. In Proceedings of the 2018 CHI Conference on Human Factors in Computing Systems, Montreal, QC, Canada, 21–26 April 2018; pp. 1–8. [Google Scholar]
  37. Nguyen, V.T.; Jung, K.; Dang, T. BlocklyAR: A Visual Programming Interface for Creating Augmented Reality Experiences. Electronics 2020, 9, 1205. [Google Scholar] [CrossRef]
  38. Schez-Sobrino, S.; Vallejo, D.; Glez-Morcillo, C.; Redondo, M.Á.; Castro-Schez, J.J. RoboTIC: A serious game based on augmented reality for learning programming. Multimed. Tools Appl. 2020, 79, 34079–34099. [Google Scholar] [CrossRef]
  39. Rienow, A.; Lindner, C.; Dedring, T.; Hodam, H.; Ortwein, A.; Schultz, J.; Selg, F.; Staar, K.; Jürgens, C. Augmented Reality and Virtual Reality Applications Based on Satellite-Borne and ISS-Borne Remote Sensing Data for School Lessons. Pfg-J. Photogramm. Remote. Sens. Geoinf. Sci. 2020, 88, 187–198. [Google Scholar] [CrossRef]
  40. Kersten, T.P.; Tschirschwitz, F.; Deggim, S. Development of a virtual museum including a 4D presentation of building history in virtual reality. Int. Arch. Photogramm. Remote Sens. Spat. Inf. Sci. 2017, 42, 361. [Google Scholar] [CrossRef] [Green Version]
  41. Esfahlani, S.S. Mixed reality and remote sensing application of unmanned aerial vehicle in fire and smoke detection. J. Ind. Inf. Integr. 2019, 15, 42–49. [Google Scholar] [CrossRef]
  42. Mapbox. Mapbox GL JS. 2020. Available online: https://docs.mapbox.com/mapbox-gl-js/api/ (accessed on 18 June 2020).
  43. W3C Immersive Web Working Group. WebXR Device API. 2020. Available online: https://immersive-web.github.io/webxr/ (accessed on 18 June 2020).
  44. Anonymous. BlocklyXR: Create a Storytelling with the Visual Mixed Reality Toolkit. 2020. Available online: https://youtu.be/Gj2NmmL0hc4 (accessed on 20 June 2020).
  45. Munzner, T. Visualization Analysis and Design; CRC Press: Boca Raton, FL, USA, 2014. [Google Scholar]
  46. Nguyen, V.T.; Jung, K.; Yoo, S.; Kim, S.; Park, S.; Currie, M. Civil War Battlefield Experience: Historical Event Simulation using Augmented Reality Technology. In Proceedings of the 2019 IEEE International Conference on Artificial Intelligence and Virtual Reality (AIVR), San Diego, CA, USA, 9–11 December 2019; pp. 294–2943. [Google Scholar] [CrossRef]
  47. Davis, F.D. A Technology Acceptance Model for Empirically Testing New End-User Information Systems: Theory and Results. Ph.D. Thesis, Massachusetts Institute of Technology, Cambridge, MA, USA, 1985. [Google Scholar]
  48. Marangunić, N.; Granić, A. Technology acceptance model: A literature review from 1986 to 2013. Univers. Access Inf. Soc. 2015, 14, 81–95. [Google Scholar] [CrossRef]
  49. Taherdoost, H. A review of technology acceptance and adoption models and theories. Procedia Manuf. 2018, 22, 960–967. [Google Scholar] [CrossRef]
  50. Goodhue, D.L.; Thompson, R.L. Task-technology fit and individual performance. MIS Q. 1995, 19, 213–236. [Google Scholar] [CrossRef]
  51. Dishaw, M.T.; Strong, D.M. Extending the technology acceptance model with task–technology fit constructs. Inf. Manag. 1999, 36, 9–21. [Google Scholar] [CrossRef]
  52. Li, Y.M.; Yeh, Y.S. Increasing trust in mobile commerce through design aesthetics. Comput. Hum. Behav. 2010, 26, 673–684. [Google Scholar] [CrossRef]
  53. Verhagen, T.; Feldberg, F.; van den Hooff, B.; Meents, S.; Merikivi, J. Understanding users’ motivations to engage in virtual worlds: A multipurpose model and empirical testing. Comput. Hum. Behav. 2012, 28, 484–495. [Google Scholar] [CrossRef]
  54. Becker, D. Acceptance of mobile mental health treatment applications. Procedia Comput. Sci. 2016, 98, 220–227. [Google Scholar] [CrossRef] [Green Version]
  55. Davis, F.D. Perceived usefulness, perceived ease of use, and user acceptance of information technology. MIS Q. 1989, 13, 319–340. [Google Scholar] [CrossRef] [Green Version]
  56. Hwang, H.; Takane, Y. Generalized Structured Component Analysis: A Component-Based Approach to Structural Equation Modeling; Chapman and Hall/CRC: Boca Raton, FL, USA, 2014. [Google Scholar]
  57. Hwang, H.; Takane, Y.; Jung, K. Generalized structured component analysis with uniqueness terms for accommodating measurement error. Front. Psychol. 2017, 8, 2137. [Google Scholar] [CrossRef] [PubMed] [Green Version]
  58. Hwang, H.; Cho, G.; Jung, K.; Falk, C.; Flake, J.; Jin, M. An Approach to Structural Equation Modeling with Both Factors and Components: Integrated Generalized Structured Component Analysis. 2020. Available online: https://psycnet.apa.org/record/2020-51893-001 (accessed on 22 July 2020).
  59. Hwang, H.; Malhotra, N.K.; Kim, Y.; Tomiuk, M.A.; Hong, S. A comparative study on parameter recovery of three approaches to structural equation modeling. J. Mark. Res. 2010, 47, 699–712. [Google Scholar] [CrossRef]
  60. Jung, K.; Panko, P.; Lee, J.; Hwang, H. A comparative study on the performance of GSCA and CSA in parameter recovery for structural equation models with ordinal observed variables. Front. Psychol. 2018, 9, 2461. [Google Scholar] [CrossRef] [PubMed]
  61. Jung, K.; Lee, J.; Gupta, V.; Cho, G. Comparison of Bootstrap Confidence Interval Methods for GSCA Using a Monte Carlo Simulation. Front. Psychol. 2019, 10, 2215. [Google Scholar] [CrossRef] [PubMed] [Green Version]
  62. Hwang, H.; Jung, K.; Kim, S. WEB GESCA. 2019. Available online: http://sem-gesca.com/webgesca (accessed on 22 July 2020).
  63. Rese, A.; Baier, D.; Geyer-Schulz, A.; Schreiber, S. How augmented reality apps are accepted by consumers: A comparative analysis using scales and opinions. Technol. Forecast. Soc. Chang. 2017, 124, 306–319. [Google Scholar] [CrossRef]
  64. Rauschnabel, P.A.; Felix, R.; Hinsch, C. Augmented reality marketing: How mobile AR-apps can improve brands through inspiration. J. Retail. Consum. Serv. 2019, 49, 43–53. [Google Scholar] [CrossRef]
  65. Hilken, T.; de Ruyter, K.; Chylinski, M.; Mahr, D.; Keeling, D.I. Augmenting the eye of the beholder: Exploring the strategic potential of augmented reality to enhance online service experiences. J. Acad. Mark. Sci. 2017, 45, 884–905. [Google Scholar] [CrossRef]
  66. Venkatesh, V.; Thong, J.Y.; Xu, X. Consumer acceptance and use of information technology: Extending the unified theory of acceptance and use of technology. MIS Q. 2012, 36, 157–178. [Google Scholar] [CrossRef] [Green Version]
  67. Williams, M.D.; Rana, N.P.; Dwivedi, Y.K. The unified theory of acceptance and use of technology (UTAUT): A literature review. J. Enterp. Inf. Manag. 2015, 28, 443–488. [Google Scholar] [CrossRef] [Green Version]
  68. Google. Google Maps Platform. 2020. Available online: https://cloud.google.com/maps-platform (accessed on 25 July 2020).
  69. OSM Foundation. OpenStreetMap. 2020. Available online: https://www.openstreetmap.org/about (accessed on 25 July 2020).
  70. Cesium. Changing How the World Views 3D. 2020. Available online: https://cesium.com/ (accessed on 25 July 2020).
  71. Mapbox. Tabletop AR. 2020. Available online: https://docs.mapbox.com/unity/maps/examples/tabletop-ar/ (accessed on 5 April 2020).
  72. Maher, M.M. Lining Up Data in ArcGIS: A Guide to Map Projections; Esri Press: Redlands, CA, USA, 2013. [Google Scholar]
  73. WebAssembly. World Wide Web Consortium. 2020. Available online: https://webassembly.org/ (accessed on 25 July 2020).
  74. Nguyen, V.T.; Dang, T. Setting up Virtual Reality and Augmented Reality Learning Environment in Unity. In Proceedings of the 2017 IEEE International Symposium on Mixed and Augmented Reality (ISMAR-Adjunct), Nantes, France, 9–13 October 2017; pp. 315–320. [Google Scholar]
  75. Murray, J.H.; Murray, J.H. Hamlet on the Holodeck: The Future of Narrative in Cyberspace; MIT Press: Cambridge, MA, USA, 2017. [Google Scholar]
  76. Jenkins, H. Confronting the Challenges of Participatory Culture: Media Education for the 21st Century; MIT Press: Cambridge, MA, USA, 2009. [Google Scholar]
  77. Forte, M.; Kurillo, G. Cyberarchaeology: Experimenting with teleimmersive archaeology. In Proceedings of the 2010 16th International Conference on Virtual Systems and Multimedia, Seoul, Korea, 13–20 October 2010; pp. 155–162. [Google Scholar]
  78. Liarokapis, F.; Greatbatch, I.; Mountain, D.; Gunesh, A.; Brujic-Okretic, V.; Raper, J. Mobile augmented reality techniques for geovisualisation. In Proceedings of the Ninth International Conference on Information Visualisation (IV’05), London, UK, 6–8 July 2005; pp. 745–751. [Google Scholar]
  79. Ocampo, A.; Palaoag, T. Improving Tourism Experiences in Open Data Environment with Mobile Augmented Reality: Needs and Challenges. In Proceedings of the International Conference on Information Technology and Digital Applications, Istanbul, Turkey, 16–17 April 2019; Volume 483, p. 2019. [Google Scholar]
  80. Van der Heijden, H. User acceptance of hedonic information systems. MIS Q. 2004, 28, 695–704. [Google Scholar] [CrossRef]
Figure 1. Example of using visual cues to form logical operations.
Applsci 11 01073 g001
Figure 2. The main interface of BlocklyXR: (A) the utility panel, (B) the designing editor and (C) the preview component.
Applsci 11 01073 g002
Figure 3. The procedure editor from BlocklyXR.
Applsci 11 01073 g003
Figure 4. The process of generating a 3D terrain model (c) from elevation data (a) and a satellite map (b).
Applsci 11 01073 g004
Figure 5. The developed application can be exported to (a) WebXR view and (b) WebVR view.
Applsci 11 01073 g005
Figure 6. A use case using BlocklyXR to recreate the PalmitoAR [13] (a) visual coding and (b) XR result.
Applsci 11 01073 g006
Figure 7. The process of constructing animated character: (1) create a character with a T-pose, (2) customize the model, (3) generate animations, and (4) combine animations and export to GLB format.
Applsci 11 01073 g007
Figure 8. The conceptual research model where each set of ellipses represents a construct and an arrow denotes a hypothesis.
Applsci 11 01073 g008
Table 1. Construct and items.
ConstructSource
Perceived Task Technology Fit[54]
(TTF1) BlocklyXR (A visual programming interface) is adequate for a visual programming toolkit to create extended reality experiences.
(TTF2) BlocklyXR is compatible with the task of controlling virtual objects.
(TTF3) BlocklyXR fits the task well (i.e., visual programming to create extended reality experiences).
(TTF4) BlocklyXR is sufficient for a visual programming toolkit to create extended reality experiences.
Perceived Visual Design[53]
(VD1) The visual design of BlocklyXR is appealing.
(VD2) The size of the 3D virtual objects is adequate.
(VD3) The layout structure is appropriate.
Perceived Usefulness[55]
(PU1) Using BlocklyXR would improve my knowledge in visual programming skills to create extended reality experiences.
(PU2) Using BlocklyXR, I would accomplish tasks more quickly (i.e., visual programming to create extended reality experiences).
(PU3) Using BlocklyXR would increase my interest in a visual programming toolkit to create extended reality experiences.
(PU4) Using BlocklyXR would enhance my effectiveness on the task (i.e., visual programming to create extended reality experiences).
(PU5) Using BlocklyXR would make it easier to do my task (i.e., visual programming to create extended reality experiences).
Perceived Ease of Use[55]
(PEU1) Learning to use the visual programming toolkit would be easy for me.
(PEU2) I would find it easy to get the visual programming toolkit to do what I want it to do.
(PEU3) My interaction with the visual programming toolkit would be clear and understandable.
(PEU4) I would find the visual programming toolkit to be flexible to interact with.
(PEU5) It would be easy for me to become skillful at using the visual programming toolkit.
(PEU6) I would find the visual programming toolkit easy to use.
Intention to Use[55]
(BI1) I intend to use the visual programming toolkit in the near future.
(BI2) I intend to check the availability of the visual programming toolkit in the near future.
Table 2. General information about the participants.
VariableCategoryNumberPercentage
GenderMale5473.97
Female1926.03
English as a First LanguageYes5473.97
No1926.03
Ethnic heritageAsian4257.53
Hispanic/Latino22.74
Caucasian/White2230.14
American Indian/Alaska Native22.74
African American/Black45.48
Total 73100
Table 3. Means and standard deviations of technology acceptance model (TAM)’s measures (N = 73).
ConstructItemMeanSD
Perceived Task Technology FitTTF14.1950.466
TTF24.2600.764
TTF34.1780.903
TTF44.0140.979
Perceived Visual DesignVD14.0960.945
VD24.1510.892
VD34.1100.936
Perceived UsefulnessPU14.0551.066
PU24.0550.970
PU34.0411.060
PU44.1780.991
PU54.1231.013
Perceived Ease of UsePEU14.0680.933
PEU23.8630.962
PEU34.0681.045
PEU43.9040.974
PEU54.0680.918
PEU63.9181.010
Intention to UseBI13.6581.157
BI23.6711.281
Table 4. Internal consistency and convergent validity.
ConstructItemDillon-Goldstein’s RhoAverage Variance Extracted
Perceived Task Technology Fit (TTF)40.8810.652
Perceived Visual Design (VD)30.7900.566
Perceived Usefulness (PU)50.9250.713
Perceived Easy of Use (PEU)60.8830.561
Intention to Use (BI)20.9200.852
Table 5. Estimates of loadings.
EstimateSE95% CI_LB95% CI_UB
TTF10.8550.0510.7330.924
TTF20.6550.0790.4860.778
TTF30.8500.0460.7380.906
TTF40.8520.0350.7660.900
VD10.8850.0270.8160.920
VD20.5300.1620.1670.756
VD30.7950.0680.6660.882
PU10.8360.0490.7230.898
PU20.7840.0700.6150.866
PU30.8980.0310.8150.934
PU40.8270.0570.6580.888
PU50.8720.0340.7900.925
PEU10.7320.1120.5120.899
PEU20.8570.0590.6860.924
PEU30.7820.0560.6480.866
PEU40.7620.0670.6070.871
PEU50.5780.1630.1960.787
PEU60.7560.0750.5680.880
BI10.8970.0320.8070.938
BI20.9480.0170.9030.977
Table 6. Estimates of path coefficients.
EstimatesStd.Error95% CI_LB95% CI_UB
VD → TTF0.715 *0.0640.6160.831
TTF → PEU0.597 *0.1090.3400.767
VD → PU0.492 *0.1180.2150.656
PEU → PU0.319 *0.1200.0940.560
PEU → BI0.1950.167−0.1110.554
PU → BI0.604 *0.1400.3170.856
* statistically significant at 0.05 level.
Publisher’s Note: MDPI stays neutral with regard to jurisdictional claims in published maps and institutional affiliations.

